Article

Evaluation of Fermented Turmeric Milk by Lactic Acid Bacteria to Prevent UV-Induced Oxidative Stress in Human Fibroblast Cells

1
Institute of Biotechnology, College of Bioresources and Agriculture, National Taiwan University, Taipei 106319, Taiwan
2
Department of Food Science, Nutrition, and Nutraceutical Biotechnology, Shih Chien University, Taipei 10462, Taiwan
3
Department of Food Science and Biotechnology, National Chung Hsing University, Taichung 402, Taiwan
4
Institute of Food Science and Technology, College of Bioresources and Agriculture, National Taiwan University, Taipei 106319, Taiwan
5
Department of Optometry, Asia University, 500, Lioufeng Rd., Wufeng, Taichung 41354, Taiwan
6
Department of Medical Research, China Medical University Hospital, China Medical University, 91, Hsueh-Shih Road, Taichung 40402, Taiwan
*
Authors to whom correspondence should be addressed.
These authors contributed equally to this work.
Fermentation 2023, 9(3), 230; https://doi.org/10.3390/fermentation9030230
Submission received: 29 December 2022 / Revised: 26 February 2023 / Accepted: 27 February 2023 / Published: 27 February 2023
(This article belongs to the Section Fermentation for Food and Beverages)

Abstract

:
The nutrition enhancement of turmeric using lactic acid bacteria (LAB) was studied. Among the 23 different LAB strains, Levilactobacillus brevis BCRC12247 was chosen due to its robustness. The fermentation of a turmeric drink from L. brevis significantly improved DPPH antioxidant activity (from 71.57% to 75.87%) and total reducing capacity (2.94 ± 0.03 mM Trolox/g dw) compared to the unfermented product. The fermented turmeric samples were subjected to liquid–liquid partition, producing four different fractions. An in vitro study was conducted by treating the fractions on human fibroblast cells (Hs68). The results indicated that hexane (Hex) and water residual (WA) samples could significantly attenuate UVA (15 J/cm2)-induced reactive oxygen species (ROS), reducing the oxidative damage from 16.99 ± 3.86 to 3.42 ± 2.53 and 3.72 ± 1.76 times, respectively. Real-time polymerase chain reaction (qPCR) results showed that Hex and WA inhibited the expression of c-jun and c-fos and lowered the mmp-1 value compared to the negative control group (by 2.72 and 2.58 times, respectively). Moreover, the expressions of Nrf2 and downstream antioxidant-related genes were significantly elevated in the Hex fraction. Therefore, fermentation using L. brevis can be an effective method to elevate the nutritional values of turmeric, protecting fibroblast cells from UVA-induced photoaging and oxidative stress.

1. Introduction

In 2019 alone, more than 7 million global cases of skin cancer were reported, and the number is most likely to increase. One of the main causes of skin carcinoma is ultraviolet (UV) radiation. UV radiation from the sun is composed of long-wave UVA (320–400 nm), mid-wave UVB (280–320 nm), and short-wave UVC (200–280 nm) [1]. Due to the short wavelength, UVC is the most mutagenic; however, it is usually blocked by the ozone layer. On the other hand, UVB can interact with DNA to produce thymine dimer (T-T dimer), causing DNA damage [2,3,4]. However, only 5% of all UV radiation is UVB [5]. As a result, UVA is the most common type of UV radiation that reaches the Earth’s atmosphere, accounting for 95% of solar light. Due to its strong penetrating ability, long and direct UV exposure damages even the subcutaneous tissue area of the skin, which eventually causes photoaging [6].
Skin is the largest organ of the human body, contributing to about 10–15% of total body weight, and has a surface area of about 2 m2 for an adult [7]. Its function is not only limited to being the first line of defense against environmental stresses; it also possesses many physiologically regulative functions, including body temperature regulation, secretion, and excretion [8]. Photodamage can essentially lead to the formation of fine lines, which may develop into rough, saggy, and wrinkled skin. On the cellular level, the barrier epidermis is weakened and the activity of keratinocytes is reduced, which results in a decrease in the cell renewal rate. In addition, the number of fibroblasts in the dermis gradually declines, causing a reduction in collagen and elastin synthesis while decomposition elevates.
Turmeric (Curcuma longa L.) has been traditionally used for centuries as a spice, food coloring, and preservative in Asia. Its pharmacological properties, including anti-inflammatory and antioxidant, have been well recognized [9,10]. Turmeric generally contains three major active phenolic compounds, including curcumin and its two major analogs, demethoxycurcumin (DMC) and bisdemethoxycurcumin (BDMC), with ratios of approximately 77%, 16%, and 6%, respectively [11]. Recently, several studies investigated the use of UVA radiation to induce oxidative stress in human keratinocytes (HaCaTs) and dermal fibroblasts (HDFs) to examine the protective effects of curcumin against skin photoaging caused by UVA exposure. The results showed that turmeric can inhibit UVA-induced photoaging-associated damage in human skin cells [12,13].
One of the main techniques to improve the nutritional value of food is fermentation. Frequently found in foods and the intestines of humans and animals, lactic acid bacteria (LAB) are Gram-positive bacteria that are acid-tolerant, non-motile, non-spore-forming, and rod- or cocci-shaped. The attractive feature of LAB is the acidification of food using sugars to produce lactic acid, which can inhibit the growth of food spoilage bacteria [14]. Since ancient times, LAB have had an imperative role in food fermentation as they not only provide a special aroma [15] but also contribute to other advantageous nutritional characteristics, including cholesterol-lowering ability, intestinal immune regulation, and the reduction of allergenicity in foods [16,17,18,19]. Furthermore, a great number of LAB promote therapeutic effects and are utilized as probiotics with desirable marketing features [20].
A recent study has shown that turmeric fermented by lactic acid bacteria could enhance total phenolic content (TPC) and antioxidant activity [5,21]. Furthermore, the study reported the elevation of antioxidant content from turmeric without increasing its cytotoxicity, in addition to displaying better anti-inflammatory activity than the unfermented group [22].
The aim of this study is to analyze the anti-photoaging and functional characteristics of LAB-fermented wild turmeric extract. Wild turmeric powder is subjected to liquid-state fermentation in milk by 23 different lactic acid bacteria strains. Suitable LAB strains are identified for further experiments. In addition, the antioxidant capacity and anti-photodamage activity of fermented wild turmeric extract in Hs68 human fibroblast cells are determined.

2. Materials and Methods

2.1. Materials and Chemicals

Turmeric (Curcuma longa L.) powder was purchased from Siva Organic Life Firm (Hualien, Taiwan). Milk powder was purchased from Anchor (Auckland, New Zealand). Bacto agar and peptone were purchased from Bioshop (Burlington, ON, Canada). 1-Butanol and n-hexane were purchased from Emperor Chemical Co., Ltd. (Taipei City, Taiwan). 2,2-Diphenyl-1picryl-hydrazyl (DPPH), 6-hydroxy-2,5,7,8-tetramethylchromane-2-carboxylic acid (Trolox), potassium hydroxide, 2,2’-azino-bis (3-ethylbenzothiazoline-6-sulphonic acid) (ABTS), Folin–Ciocalteu phenol reagent, ethanol, and ethyl acetate were purchased from Sigma-Aldrich (St. Louis, MO, USA).

2.2. Microorganisms and Medium

Levilactobacillus brevis BCRC12247, Limosilactobacillus reuteri BCRC14625, Lactobacillus delbrueckii subsp. delbrueckii BCRC12195, Bifidobacterium infantis BCRC14633, Lactobacillus gasseri BCRC14619, Lactococcus lactis BCRC12315, Lacticaseibacillus paracasei BCRC14023, Bifidobacterium bifidum BCRC14615, Bifidobacterium adolescentis BCRC14606, Bifidobacterium breve BCRC11846, Lactobacillus delbrueckii subsp. bulgaricus BCRC10696, Lactobacillus bulgaricus BCRC14009, Lactobacillus helveticus BCRC12936, Lactiplantibacillus plantarum BCRC11697, Streptococcus thermophilus BCRC14085, Bifidobacterium longum BCRC14634, Lactobacillus johnsonii BCRC17474, Lacticaseibacillus rhamnosus BCRC10940, Bifidobacterium longum subsp. infantis BCRC14602, Lactobacillus acidophilus BCRC 14079, Lacticaseibacillus casei BCRC10697, Lacticaseibacillus rhamnosus (Hansen) Collins et al. BCRC16000, and Lactobacillus helveticus BCRC14092 were purchased from Bioresource Collection and Research Center (BCRC, Hsinchu city, Taiwan) and cultured in De Man, Rogosa, Sharpe (MRS) medium for routine use (Sigma-Aldrich, St. Louis, MO, USA). The bacteria were stored in MRS broth with 20% glycerol at −80 °C for long-term storage. Prior to fermentation, all strains were activated by thawing at room temperature and inoculated (1% v/v) in the MRS broth. The cultures were incubated at a constant temperature of 37 °C for 48 h and subcultured twice per week.

2.3. LAB-Fermented Turmeric Milk Preparation

All 23 strains of LAB were used as the starter inoculum. Each LAB was inoculated in 10 mL MRS broth and incubated at 37 °C for 24 h until the culture reached the late log phase. Afterward, the cell density and microbial count were determined using the spread-plate method with serial dilution. The bacterial cultures were quantified, in which the counting was within 25–250. Then, the cultured medium was stored at 4 °C to minimize the metabolism and cell division of LAB. The turmeric milk mixture was prepared by combining 2.5% (w/v) turmeric powder, 200 mL sterile water, and 25 g milk powder. Aside from the unfermented turmeric milk, the starter was quantified until the cell density reached 7 log CFU/mL by dilution. Afterward, LAB culture was inoculated into the sample for future experiments. All the flasks were maintained at 37 °C in an incubator for 24 h.

2.4. Antioxidant Activity Assays

The fermented turmeric milk was freeze-dried, and 1 g of turmeric milk powder was mixed with 9 mL of 95% ethanol. The mixture was then centrifuged at 6000× g for 25 min at 4 °C, and the supernatant was collected. The supernatant was then centrifuged again for 10 min and filtered through a 0.45 μm PTFE membrane for further analysis of antioxidant activity. The method was slightly modified according to Hu et al. [23]. A freshly prepared 1 mM DPPH ethanol solution was diluted to 250 μM as the reaction solution. For the experimental group, 40 μL of sample extract and 160 μL of DPPH reaction solution were added to 96 wells and left to react in the dark for 30 min at room temperature. The absorbance values at 517 nm wavelength were measured by spectrophotometer. A standard curve of 0.01–0.1 mg/mL was used to calculate the equivalent concentration of Trolox (mg/mL) with the same DPPH radical scavenging capacity as that of the sample, expressed as total antioxidant capacity (TEAC) (mg TE/g dw).
An ABTS assay was slightly modified according to Hu et al. [23]. ABTS solution (7 mM) was mixed with potassium persulfate (K2S8O2) (2.45 mM) solution in equal volume (1:1 ratio) for 12 h. The ABTS radical solution was diluted with distilled water to an absorbance value of 0.7 ± 0.02 nm at 734 nm before use. The ABTS radical solution was diluted with distilled water to an absorbance value of 0.7 ± 0.02 at 734 nm as the reaction solution. Then, 20 μL of sample extract and 180 μL of ABTS radical reaction solution were added to 96 wells. The absorbance value at 734 nm was measured after 6 min of reaction, and 0.01–0.1 mg/mL of the reaction solution was prepared. A standard curve of 0.01–0.1 mg/mL was used to calculate the equivalent concentration of Trolox (mg/mL) with the same ABTS radical scavenging capacity. The equivalent concentration (mg/mL) of Trolox with the same ABTS radical scavenging capacity was converted to total antioxidant capacity (TEAC) (mg TE/g dw).
The total reduction test was modified from the method proposed by Moein et al. [24]. Briefly, 100 μL of fermented turmeric extract was mixed with 100 μL of 1% K3Fe(CN)6 and 100 μL of 0.2 M phosphoric acid buffer solution by shaking, and the reaction was carried out at 50 °C for 20 min. After the solution cooled down, 500 μL of 10% trichloroacetic acid solution was added and centrifuged at 3000× g for 10 min. The supernatant was mixed with deionized water and 0.1% FeCl3 (w/v) (1:1:1), and the absorbance value at 700 nm was measured to determine the reductive power. The higher the absorbance value, the better the reduction ability. A standard curve of 0.01–0.1 mg/mL was used to calculate the equivalent concentration of Trolox (mg/mL) with the same total reducing power. The equivalent concentration (mg/mL) of Trolox with the same total reducing power was converted to total antioxidant capacity (TEAC) (mg TE/g dw).

2.5. Fermented Turmeric Milk Extract Preparation

The extraction procedure was modified from Nakamura et al.’s study [25]. Briefly, 5 g of sample powder was stirred and extracted with 100 mL of 95% alcohol and stirred again at 300 rpm for 1 h. The extract was collected by suction and filtration. This step was repeated three times. The alcohol extract was concentrated under vacuum concentration to remove the solvent and then redissolved in water. Under liquid–liquid partition, each solvent (in order of polarity: hexane, ethyl acetate, n-butanol, and water residue) was used for the extraction to produce different fractions at various polarities. The step was repeated three times. The remaining solvents were extracted using the same procedure. Afterward, the collected extracts were subjected to vacuum concentration. Then, the samples were redissolved at a concentration of 100,000 ppm in DMSO and stored at −20 °C.

2.6. Phenolic Compounds Content Analysis

The determination of total polyphenols was based on Abderrahim et al. [26] with slight modifications. Total polyphenols were extracted by taking 0.1 g of freeze-dried powder of the fermented sample and mixing it with 1 mL of 80% MeOH (in a 1:10 ratio). The extract was shaken with a KS Orbital shaker for 1 h at 250 rpm before centrifuging at 2100× g at 4 °C for 10 min. The supernatant was removed and filtered through a 0.22 µm filter membrane. A second extraction was performed with 1 mL acetone/water solution (70:30 v/v). The extract was shaken with a KS Orbital shaker for 1 h at 250 rpm and centrifuged at 2100× g at 4 °C for 10 min. The supernatant was removed and filtered through a 0.22 µm filter membrane to obtain the free phenolics fraction filtrate. The third extraction was performed with 1 mL of methanol/H2SO4 (90:10, v/v). The extract was heated in a water bath for 10 h at 80 °C and centrifuged at 2100× g at 4 °C for 10 min. The supernatant was removed and filtered through a 0.22 µm filter membrane. The bound phenolics fraction filtrate was obtained.

2.7. Cell Culture and UVA Irradiation

Hs68 cell lines are human foreskin fibroblasts, which were purchased from BCRC (Hsinchu, Taiwan). The method was carried out according to Calò et al. [27] with slight modification. The cells were pretreated with the fermented turmeric milk extractions diluted with serum-free DMEM for 24 h, then washed with 100 µL PBS before adding 100 µL phenol red-free DMEM. The illuminance meter was 10 cm, and the 96-well plate was used directly under the UV-A irradiation device (365 nm, Chingtek Instrument Co., Ltd., New Taipei, Taiwan). After irradiation, the cells were washed with PBS, and serum-free DMEM was added before incubating in a 37 °C in a 5% CO2 incubator for 3 h prior to performing the related experiments.
The irradiation dose is: intensity (mW/cm2) * time = dose (J/cm2).

2.8. Cell Viability

To measure the cell survival rate of the Hs68 cells, a method was modified from Hseu et al. [28], and Cell Counting Kit-8 (CCK-8, Dojindo Molecular Technologies, Inc., Rockville, MD, USA) was used. The method was based on the manufacturer’s instructions.

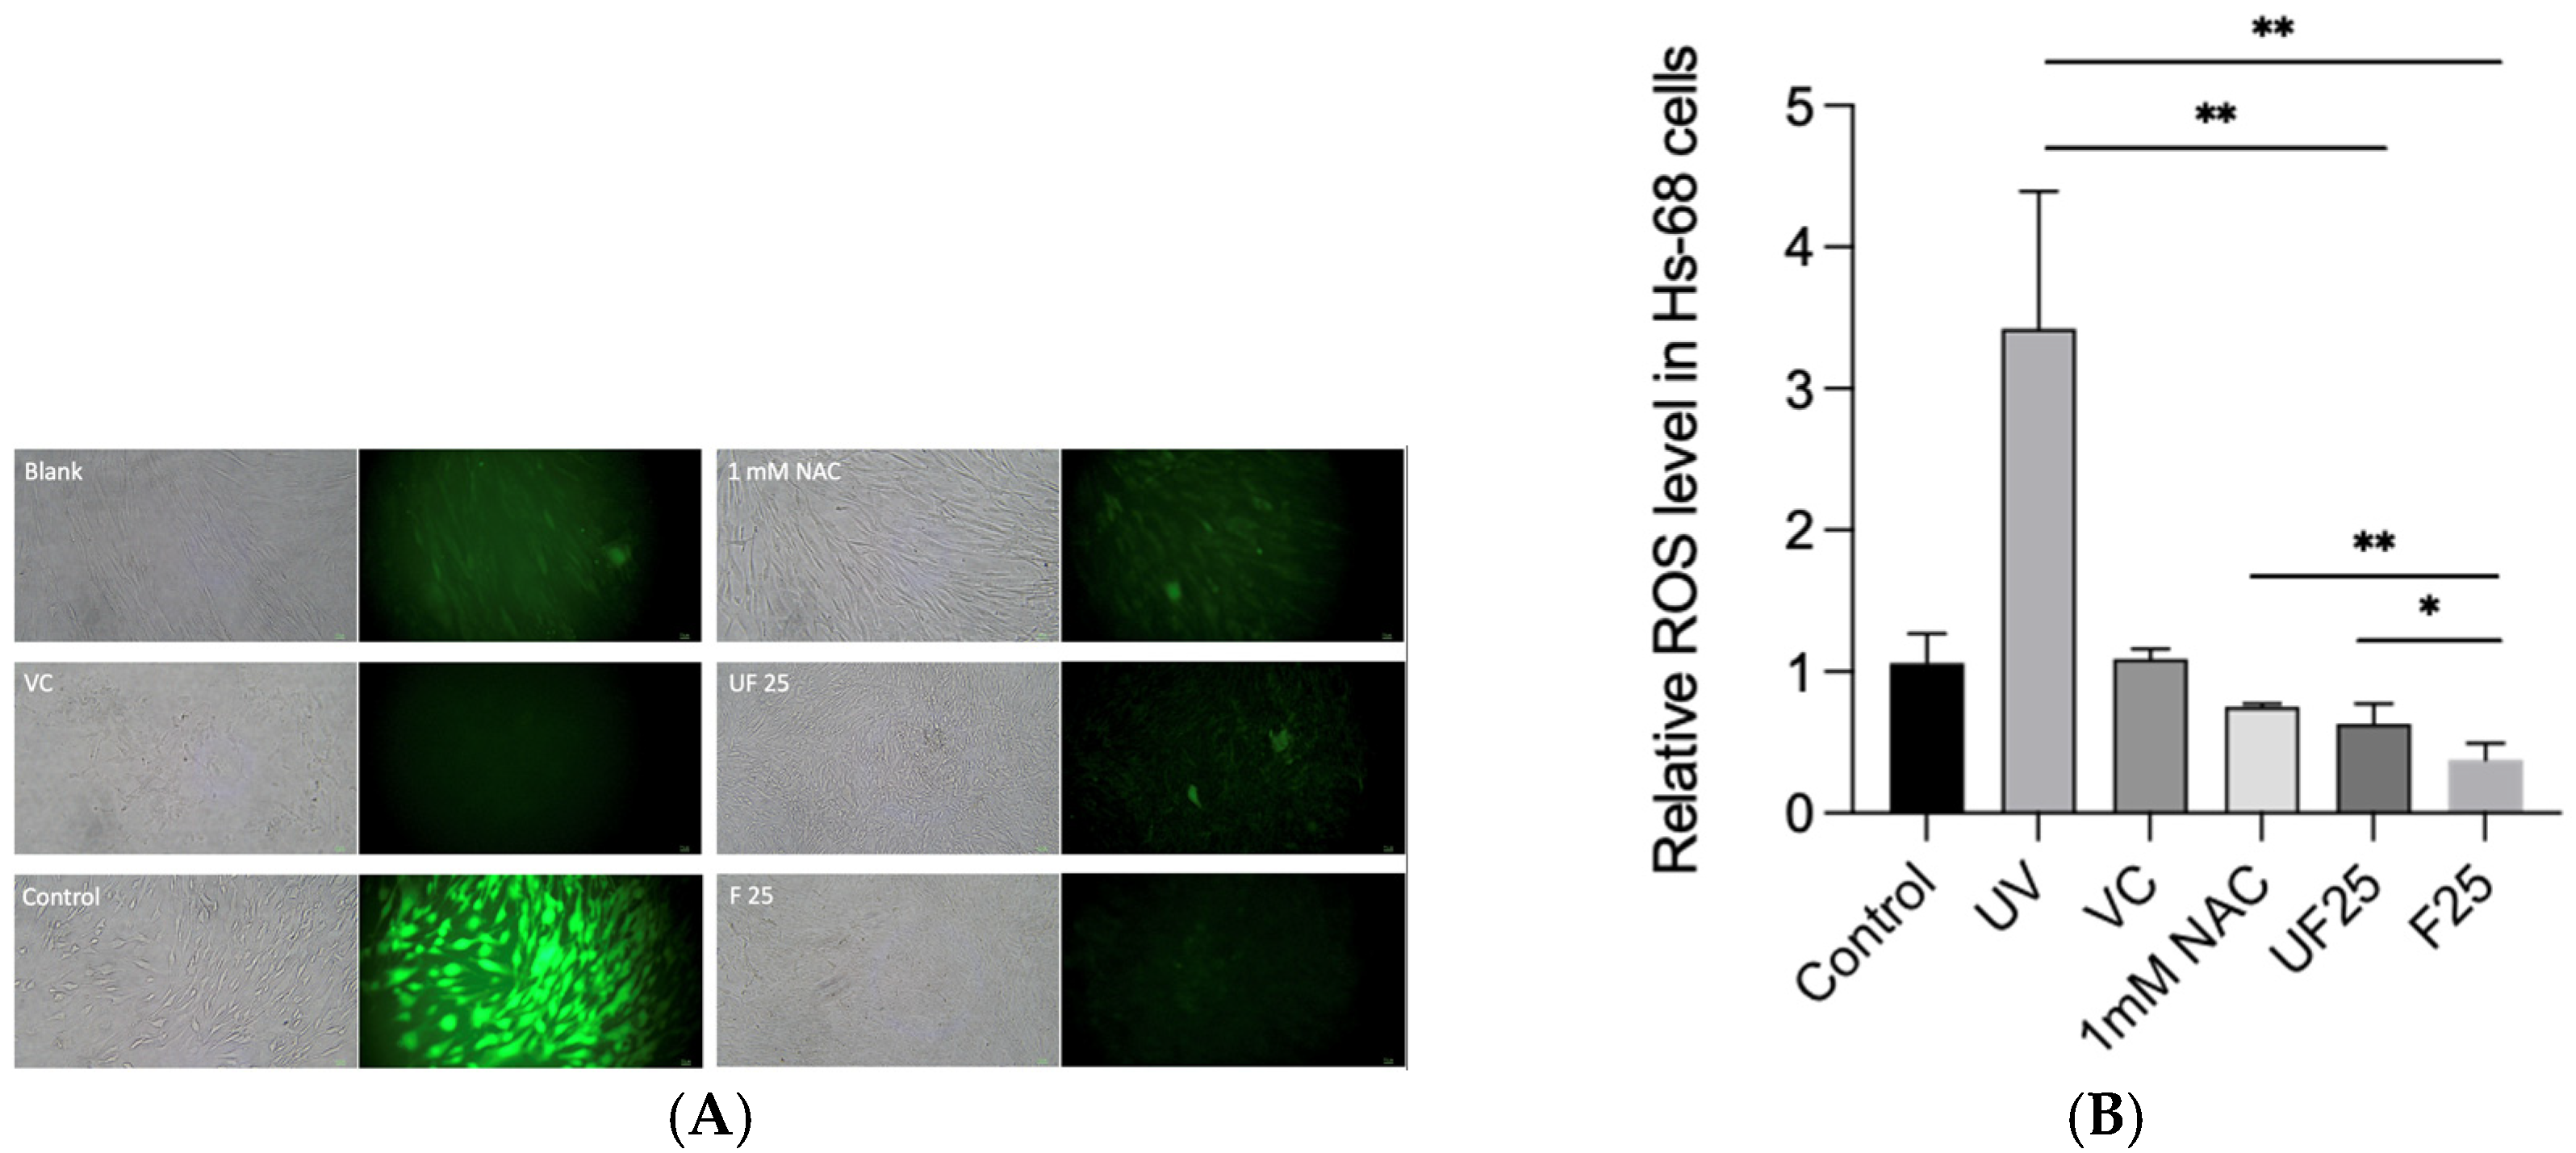
2.9. Measurement of ROS Production

Measurement of ROS production was carried out based on the modified method described by Hseu et al. [28]. The concentration of Hs68 cells was adjusted to 5 × 10⁵ cell/mL, inoculated with 200 µL of cell fluid in a 48-well plate, and cultured for 24 h. After culturing, PBS was used to remove cell waste and dead cells. Then, the extract solutions were added to each model and left for 24 h. The cells were washed with PBS the next day before being irradiated with a UV-A lamp. After reaching the target dose, the light was turned off and the cells were left in the incubator for 1.5 h. Then, the samples were washed with PBS before adding 10 µM of 2′,7′-dichlorodihydrofluorescein diacetate (DCFH-DA) fluorescent dye. The treated samples were wrapped in aluminum foil in the dark for 30 min. After the reaction, DCFH-DA was removed by washing with PBS. Images were taken using a fluorescent microscope, and relative fluorescence intensity was analyzed with ImageJ image analysis software (NIH, Bethesda, MD, USA).

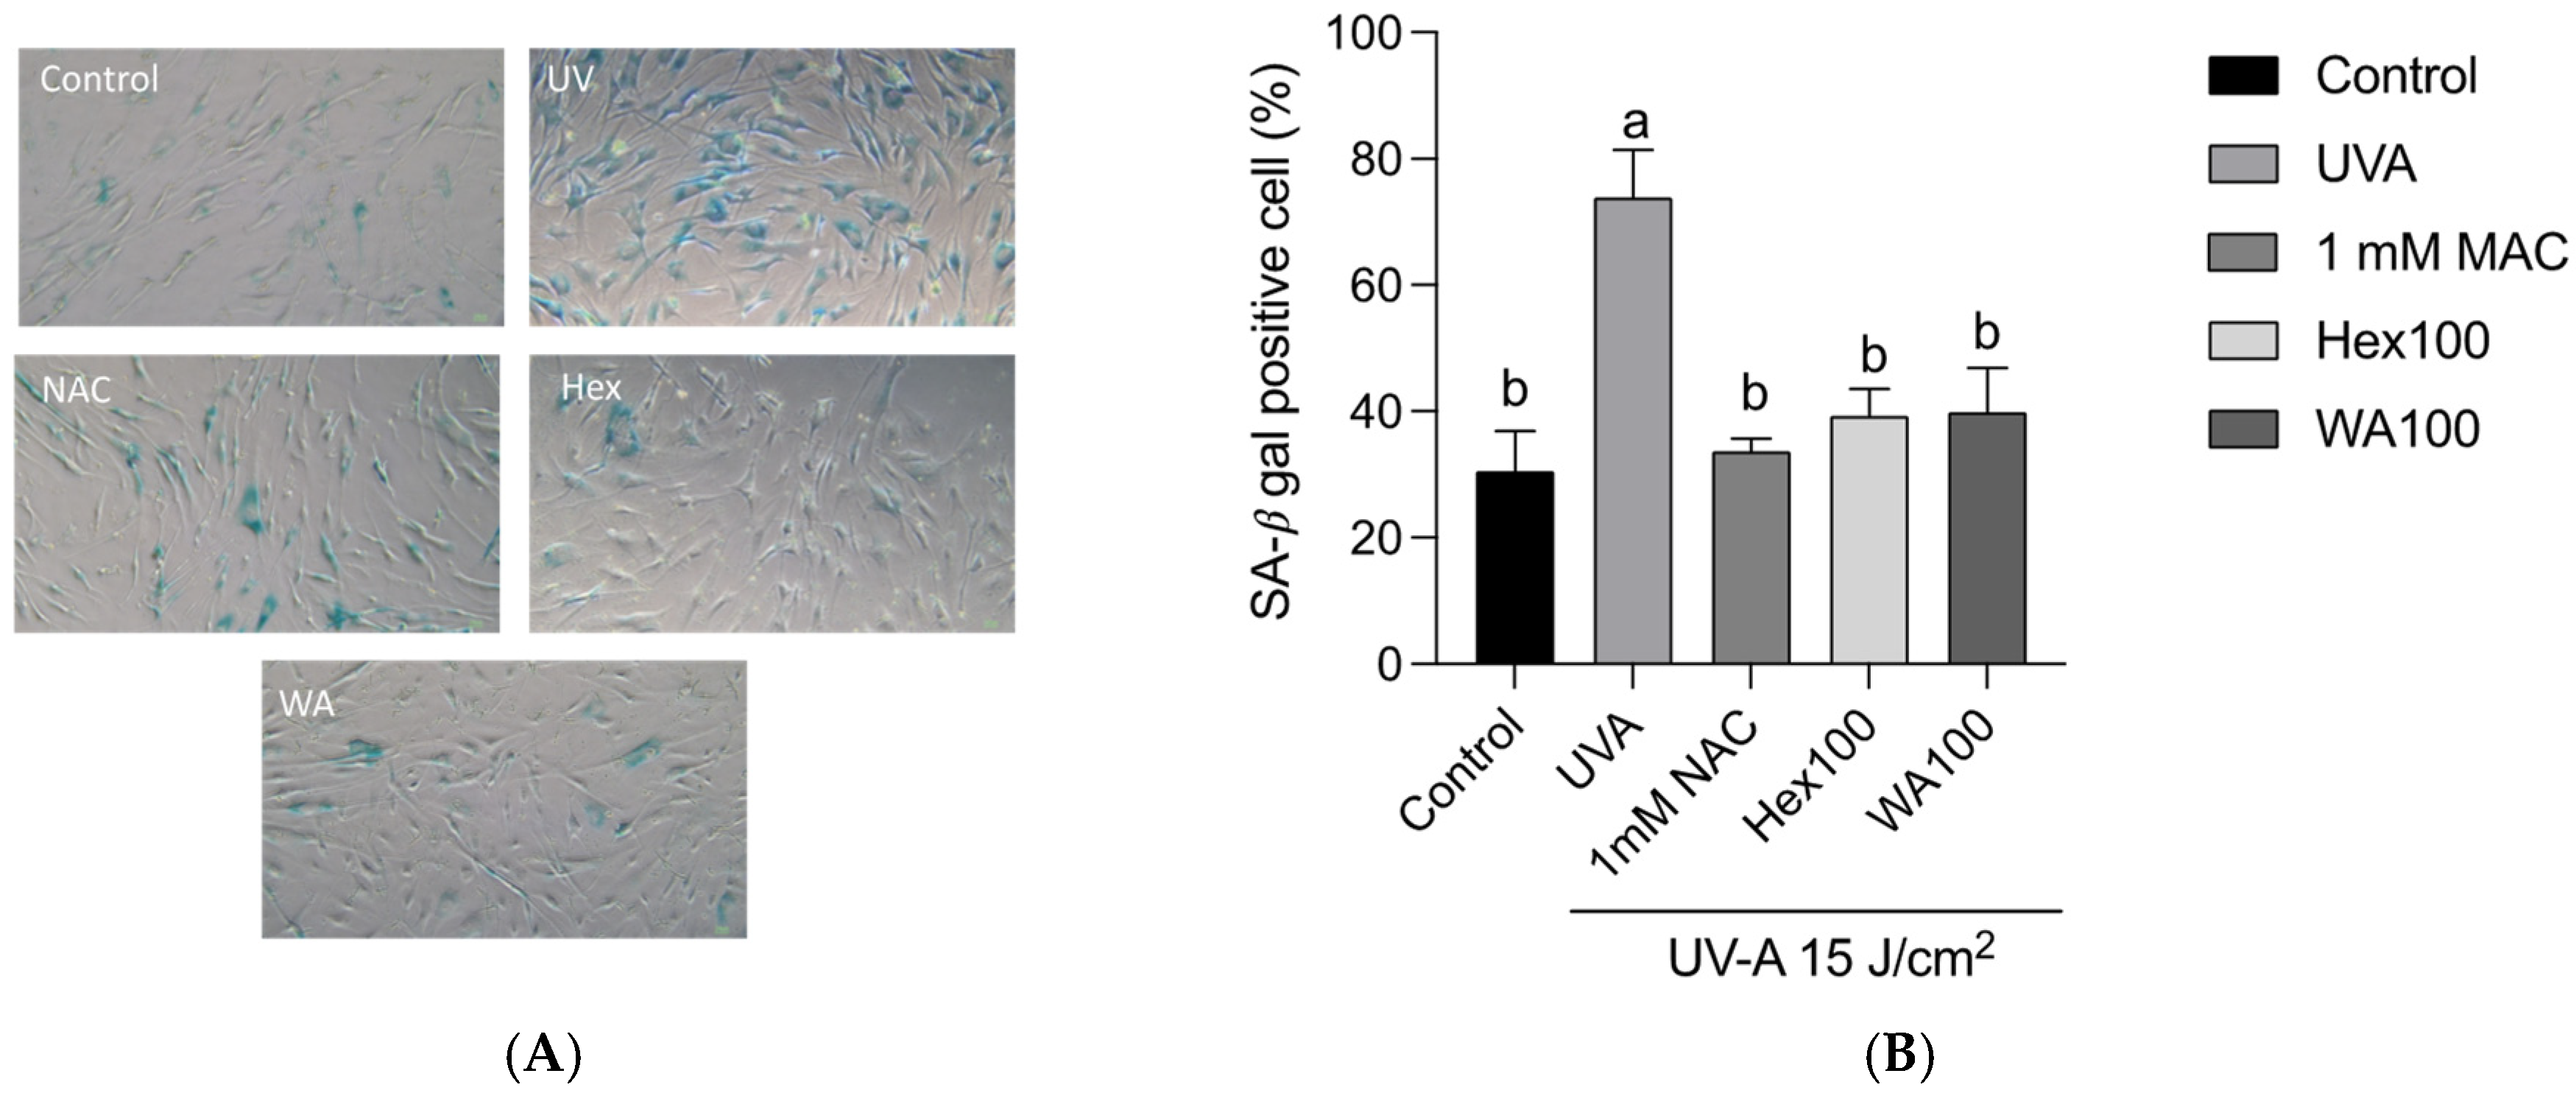
2.10. Detection of Senescence-Associated β-Galactosidase (SA-β-Gal) Activity

The SA-β-gal activity is one of the cellular markers for senescence. To detect cellular senescence, the cells were stained with the SA β-gal staining kit (Abbkine, Inc., Wuhan, China). The instructions were according to the manufacturer’s protocol and the methods described by Makpol et al. [29] and Han et al. [30] with modifications. Cell images were taken by a microscope under three bright fields at 400x magnification, and we counted all the cells stained with a blue-green color. The percentage of SA β-gal positive cells was the number of stained cells to the number of total cells, which indicated the presence of cellular senescence.

2.11. Skin-Associated Gene Expression by qPCR

To analyze the expression of senescence-regulated genes by quantitative polymerase chain reaction (qPCR), a modified method was performed according to Sun et al. [31] and Mavrogonatou et al. [32]. Cells were reacted with Total RNA Reagent (Bioman Scientific Co., Ltd., Taiwan) for 5 min at room temperature, then collected with a 1.5 mL microcentrifuge tube in 0.2 mL of chloroform. The tube was shaken vigorously with a vortex for 30 s before letting it rest at room temperature for 3 min. After careful removal of the supernatant, 1 mL of 70% alcohol was added and centrifuged for 5 min at 7500 rpm and 4 °C. After complete removal of the supernatant, 50 mL of DEPC water was used for back dissolution. Then, 125 ng/µL of RNA (8 µL) was added to 1 µL DNase I and 1 µL 10 × DNase I reaction buffer. The samples were incubated at 37 °C for 15 min. In the next step, 1 µL of 20 mM EGTA was added and allowed to react at 75 °C for 10 min to inactivate DNase I. Afterward, 1 µL 50 µM Oligo(dT)20 and 1 µL 10 mM dNTP mix solution were added and reacted at 65 °C for 5 min. Then, 4 µL of 5x 1st strand buffer, 1 µL 0.1 M DTT, 1 µL (40 U/µL) RibolNTM RNase Inhibitor, and 1 µL GScript RTase were mixed and incubated at 50 °C for 1 h. The final samples were allowed to react at 70 °C for 15 min to terminate the enzyme reaction. In the next step, 20 µL cDNA was diluted with 30 µL ultrapure water and 1 µL was mixed with 5 µL GII EvaGreen qPCR Master Mix, ROX, 3.4 µL pure water (without nuclease), and 0.6 µL 10 µM of pre-mix with forward and reverse translator primers. qPCR conditions were 95 °C for 10 min to allow enzymatic action, followed by PCR cycle conditions of 95 °C for 15 s, and then cooled to 60 °C for 60 s for 35 cycles to obtain Ct (cycle threshold). The target genes were controlled internally by 𝛽-actin. The analyzed primers were Nrf2 (nuclear factor erythroid 2-related factor 2), NQO1 (NAD(P)H quinone dehydrogenase 1), c-jun, c-fos, mmp-1 (matrix metalloproteinase-1), COL1A1 (collagen, type I, alpha 1), and type-1 pro-collagen, which would be used in qPCR analysis.

2.12. Statistical Analysis

All experiments were performed in triplicate. One-way analysis of variance (ANOVA) and Duncan’s multiple range tests were used for statistical analysis to compare the groups using IBM SPSS Statistics 23.0 (IBM Corp., Armonk, NY, USA). To display the results, the data are presented as means ± standard deviations (SDs). Statistical significance was established at p < 0.05.

3. Results and Discussion

3.1. Strain Selection for Turmeric Fermentation

Fermentation is one of the most effective methods to enhance food quality, nutritional content, and bioactive compounds. With the growing trend of health and safety concerns, fermentation is likely to become even more important in the food processing industry. Turmeric is one of the plants that have attracted considerable research interest due to its high nutritional value and antioxidant capacity. A publication from Lee [33] has confirmed that the fermentation of turmeric using LAB leads to higher nutritional values compared to its unfermented counterpart. Moreover, LAB not only contributes to the acidification of food, which can serve as a natural preservative, but it also reduces turmeric cytotoxicity [22].
In order to select LAB strains suitable for turmeric milk fermentation in this study, the microorganisms should be able to withstand turmeric’s antimicrobial properties to a certain extent. A study conducted by Lee [33] showed an inhibitory effect of turmeric against pathogens, including Clostridium perfringens and Escherichia coli. However, it does not cause any significant effect on LAB strains. Nevertheless, the responses are highly dependent on the dosage and strains of bacteria [33]. Consequently, the most suitable LAB strains for fermentation should be robust under the presence of turmeric.
Within the study, 6 out of 23 strains were chosen based on the number of bacterial colonies forming units (CFU). By observing the number of LAB growths after 24 h of turmeric fermentation, the most suitable strains can be selected for the next stage of experiments. As shown in Figure 1, the six strains with the highest growth are Bifidobacterium longum BCRC14634 (9.04 ± 0.03 log CFU/mL), Lacticaseibacillus paracasei BCRC14023 (8.66 ± 0.10 log CFU/mL), Levilactobacillus brevis BCRC12247 (8.41 ± 0.02 log CFU/mL), Lactobacillus delbrueckii subsp. delbrueckii BCRC 12195 (8.37 ± 0.05 log CFU/mL), Lactobacillus acidophilus BCRC14079 (8.33 ± 0.03 log CFU/mL), and Lacticaseibacillus casei BCRC10697 (8.31 ± 0.01 log CFU/mL). The result demonstrates that fermentation can be an effective method to improve the antioxidant capacity of turmeric since certain LAB strains may have the metabolic ability to convert some phenolic compounds into more bioactive forms [21].
According to Chen and colleagues [34], free radicals have been shown to initiate oxidative stress. Skin photoaging is an exogenous oxidative stress that can be impeded or prevented under the presence of antioxidants [34]. Turmeric can be a powerful antioxidant that can interfere with reactive oxygen species (ROS) activating signal transduction pathways that lead to inflammation and tumorigenesis. In this study, six samples of fermented turmeric milk from each LAB strain are evaluated to quantitatively determine their antioxidant ability using DPPH, ABTS, and free-radical scavenging ability assays, as illustrated in Table 1. Among all the antioxidant assays, unfermented turmeric milk (UF) has the lowest value (1.77 ± 0.01 mmole/g dw). The result demonstrates that fermentation can be an effective method to improve the antioxidant capacity of turmeric. On the contrary, the highest DPPH radical scavenging activity could be observed in L. brevis BCRC12247, which has 1.97 ± 0.02 mmole/g dw. Moreover, the turmeric milk fermented by L. brevis also contains the highest free-radical scavenging ability (4.41 ± 0.05) and ferric-reducing power capacity (2.95 ± 0.03), the best among the other samples of LAB fermentation. Therefore, L. brevis BCRC12247 was chosen as the most appropriate LAB strain for further analysis. In addition, in Figure 2, cell count and pH value were measured every 2 h for the first 12 h. Once LAB reached the stationary phase, then the cell count and pH were measured every 4 h for the next 12 h. As shown in the figure, the number of bacteria grew exponentially in the first 6 h, whereas the pH value dropped dramatically. The result confirmed that lactic acid bacteria were able to grow in turmeric milk and secreted lactic acid, which explained the lowering of the pH value. After 12 h, the LAB slowly approached the stationary phase, which is depicted through the slower growth rate and constant pH value. The final bacterial count and pH value were 8.69 ± 0.088 log CFU/mL and 5.62 ± 0.03, respectively.

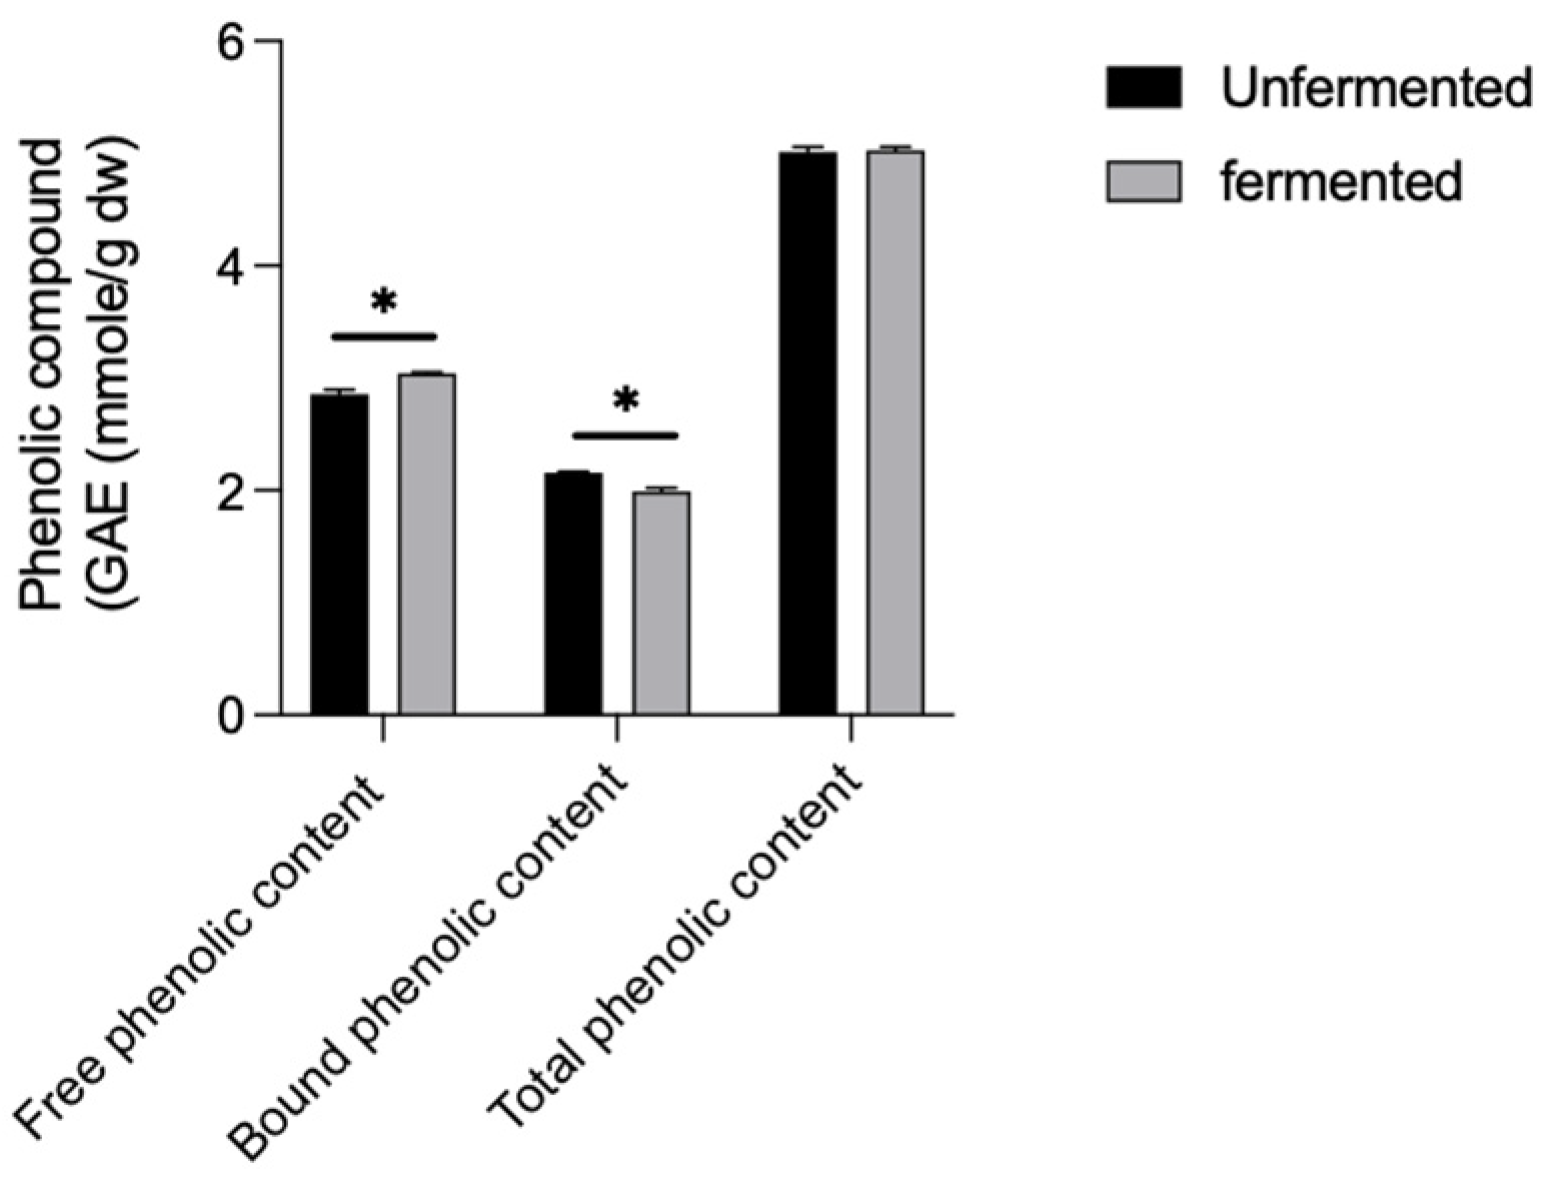
3.2. Influence of L. brevis BCRC12247 Fermentation on Total Phenol and ROS Accumulation

Through the fermentation system using L. brevis BCRC12247, free-form phenolic compounds in the fermented turmeric milk significantly increase compared to the unfermented sample (from 2.86 ± 0.04 to 3.03 ± 0.01 mmole/g dw), as can be seen in Figure 3. On the other hand, the total phenol content remains unchanged, while the bound phenol within the fermented turmeric milk decreases (from 2.16 ± 0.01 to 1.99 ± 0.03 mmole/g dw). The result indicates that the bound phenols are disaggregated after lactic acid fermentation. Free-form phenolics can be the more potent form of nutrients as they can be readily absorbed by the small intestine [35]. Fermentation increases the free-form phenolic compounds due to enzyme secretion by microorganisms, which leads to the breakdown of plant cell walls, releasing bioactive phenolic compounds [36]. Moreover, Hs68 cells were pretreated with the fermented turmeric milk extract for 24 h before being irradiated with UVA 15 J/cm2. As shown in Figure 4A, the green fluorescence intensity of the UVA group is the strongest, which demonstrates that UVA irradiation evidently triggers intracellular ROS production. The fermented turmeric milk obtained from crude ethanol extraction significantly reduced the accumulation of ROS induced by UVA (from 3.42 ± 0.97 to 0.38 ± 0.11 times the relative ROS level). In addition, Figure 4B shows that the inhibitory effect of the sample is noticeably higher than that of the unfermented group (0.63 ± 0.14 times the relative ROS level). The result highlights the potential of a new functional fermented milk drink to enhance nutritional value and antioxidants.

3.3. Effects of Fractions of Fermented Turmeric Milk Extract on ROS Inhibition and Cell Viability in UVA-Irradiated Hs68 Cells

After confirming that the fermented turmeric milk had antioxidant activity, it was then divided into hexane (Hex), ethyl acetate (EA), butanol (Bu), and water residual (WA) fractions via liquid–liquid partition. Before evaluating their protective effects using UVA induction, we examined the Hex, EA, Bu, and WA fractions on Hs68 cells to determine cell viability by CCK-8 assay. Hs68 cells were incubated with different concentrations of samples (25, 50, and 100 ppm) for 24 h. Figure 5A shows that the experimental concentrations are safe for Hs68 cells and that cell viability was not significantly affected. As illustrated in Figure 5B, the green fluorescence intensity of the UVA group was the strongest since UVA irradiation evidently increases intracellular ROS production. Figure 5C displays the inhibitory effect of the four fractions from fermented turmeric extracts on the UVA-induced Hs68 cells. According to the figure, the fermented turmeric milk from Hex and WA extractions had the highest ROS scavenging ability, similar to 1 mM NAC, which served as a positive control. Hence, the Hex and WA fractions were selected for the next experiment.

3.4. Effects of Fractions of Fermented Turmeric Milk Extract on Senescence-Associated β-Galactosidase (SA-β-Gal) Activity

This experiment further explores the effects of the fermented samples from Hex and WA extractions to reduce the aging indicator, the SA-β-gal enzyme. SA-β-gal is only present in senescent cells and, thus, can be an effective cellular senescence marker. As a result, the SA-β-gal activity in UVA-irradiated Hs68 cells was investigated. Hs68 cells were pretreated with Hex and WA fractions of fermented turmeric milk (100 ppm) for 24 h before UVA irradiation. Afterward, the cells were stained. As shown in Figure 6A, it can be clearly observed that the UVA group has more stained cells than the other groups. Its expression of SA-β-gal enzyme activity was 73.85 ± 6.33%, which is much higher than that of the control group (30.43 ± 8.33%). Similar to the result reported by Yi et al. [37], the UVA exposure at 10 J/cm2 for three consecutive days resulted in about 80% of SA-β-gal enzyme activity. In Figure 6B, the values of SA-β-gal after treating with the samples from the Hex and WA extracts are 39.26 ± 4.31 and 39.90 ± 7.00%, respectively, which shows no significant difference compared to the positive control group (NAC) (33.74 ± 1.97%). The findings indicate that fermented turmeric milk samples from the Hex and WA fractions possess an antioxidant ability that can hinder SA-β-gal expression.

3.5. Effects of Fractions of Fermented Turmeric Milk on Antioxidant Genes Expression in UVA-Exposed Hs68 Cells

To further understand the effects of the fermented turmeric milk from Hex and WA fractions, the genes related to antioxidant enzyme production can be studied. The regulations of genes Nrf2 and NQO1 are vital for the modulation of antioxidant enzymes to protect cells from oxidative stress. Nrf2 has been shown to be involved in the induction of various antioxidants by UV irradiation in human keratinocytes [38]. The results obtained (Figure 7) indicate a slight increase in Nrf2 expression after the cells are UVA-irradiated (1.37 ± 0.14), while the expressions of pretreated WA (1.70 ± 0.07) and especially of Hex (5.67 ± 0.74) fractions before UVA exposure rise dramatically, as shown in Figure 7A. This finding demonstrates that cells have their own defense system against photodamage, whereby the Nrf2 signaling pathway acts as an upstream regulator that activates the production of antioxidative enzymes, such as NQO1, HO-1, glutathione S-transferase, glutathione peroxidase, and glutamate-cysteine ligase [39]. The overexpression of NQO1 in Figure 7B further emphasizes the production of the antioxidant enzyme NQO1 after 24 h of pretreatment with the Hex extraction, followed by UV irradiation. Recent studies have found that the activation of Nrf2 gene transcription in human fibroblasts promotes the binding of Nrf2 to the ARE gene, thereby increasing the expression of HO-1 and NQO1 to translate their antioxidant enzymes. The gene expression pathway shows the ability to scavenge free radicals, reduce the amount of ROS in cells, and improve the condition of human skin fibroblasts that are damaged by UVA exposure [40,41].

3.6. Effects of Fractions of Fermented Turmeric Milk on Skin-Associated Genes Expression in UVA-Exposed Hs68 Cells

In Figure 8A–C, both c-jun and c-fos show a noticeable elevation after UVA irradiation (4.02 ± 0.17 and 20.78 ± 2.29 times, respectively). Moreover, the downstream mmp-1 also increases dramatically (2.10 ± 0.50), suggesting that UV induces c-jun and c-fos. However, c-jun and c-fos were restored to the same level as control after the treatment using the fermented turmeric milk from Hex and WA fractions. The subunits c-jun and c-fos belong to the AP-1 transcription factor, which is a downstream effector of the MAPK signaling pathway [42]. An increase in AP-1 transcriptional factor is correlated to an increase in mmp-1, a downstream enzyme responsible for extracellular matrix decomposition [4,43]. A recent research investigation found that ROS is involved in the UVA-dependent induction of mmp-1, mmp-2, and mmp-3 mRNA and protein expression in fibroblast cells. The expressions of c-jun/c-fos and mmp-1 are associated with the decomposition of collagen, whereas those of COL1A1 and type 1 pro-collagen lead to collagen production; both systems work in complementarity to one another [44]. Therefore, the inhibition of gene expression of AP-1 subunits c-jun and c-fos can effectively suppress the expression of downstream MMPs in a UV-induced fibroblast cell senescence model [45]. Simultaneously, the decrease in mmp-1 gene expression would result in the expression elevation of COL1A1, enhancing the production of the collagen matrix [46].
Furthermore, type 1 pro-collagen is composed of three polypeptide chains transcribed from two related genes, COL1A1 and COL1A2 [47]. According to Figure 8D,E, the gene expression of COL1A1 and type 1 pro-collagen are correlated, indicating that the repair and recovery of the extracellular matrix are delayed by UV irradiation. However, after pretreating with the fermented turmeric drink from Hex and WA fractions, both cell models recovered to the same level as the control group, which illustrates the potential of the samples for protecting the skin’s extracellular matrix from UV-induced oxidative stress.

4. Conclusions

In this study, the fermentation of turmeric milk by L. brevis BCRC 12247 is effective in reducing UVA-induced ROS production. After liquid–liquid partition, the fermented samples extracted by hexane (Hex) and water residue (WA) showed an enhanced gene expression of the Nrf-2 transcriptional factor and the downstream antioxidant enzyme. In addition, Hex and WA fractions of fermented turmeric milk may also suppress mmp-1 expression by inhibiting AP-1 subunits c-jun and c-fos. This leads to the promotion of collagen synthesis through the elevated genetic expression of COL1A1 and type 1 pro-collagen. All of these effects help to prevent skin photoaging. Based on this finding, turmeric milk fermented with lactic acid bacteria has the potential to prevent UVA-induced skin aging and promote cellular repair. Moreover, fermented turmeric milk extracted by WA and Hex fractions has the potential to delay photodamage. It is thus worthwhile to further investigate the chemical compositions of turmeric before and after fermentation to clarify the potency of particular compounds that are responsible for the inhibitory effect of photoaging.

Author Contributions

Conceptualization, C.-W.H. and K.-C.C.; methodology, J.-J.L., M.-C.C. and D.K.; validation, J.-J.L. and C.-C.H.; data curation, J.-J.L.; writing—original draft preparation, J.-J.L.; writing—review and editing, D.K., M.-C.C. and K.-C.C. All authors have read and agreed to the published version of the manuscript.

Funding

This research was funded by the Ministry of Science and Technology, Taiwan (MOST-109-2628-E-002-007-MY3 and MOST 110-2320-B-158-001).

Institutional Review Board Statement

Not applicable.

Informed Consent Statement

Informed consent was obtained from all subjects involved in the study.

Data Availability Statement

The data presented in this study are available on request from the corresponding author.

Conflicts of Interest

The authors declare no conflict of interest.

Sample Availability

Samples of the compounds are not available from the authors.

References

  1. Parisi, A.V.; Turner, J. Variations in the short wavelength cut-off of the solar UV spectra. Photochem. Photobiol. Sci. 2006, 5, 331–335. [Google Scholar] [CrossRef] [Green Version]
  2. Jiang, Y.; Rabbi, M.; Kim, M.; Ke, C.; Lee, W.; Clark, R.L.; Mieczkowski, P.A.; Marszalek, P.E. UVA generates pyrimidine dimers in DNA directly. Biophys. J. 2009, 96, 1151–1158. [Google Scholar] [CrossRef] [Green Version]
  3. Cavinato, M.; Jansen-Dürr, P. Molecular mechanisms of UVB-induced senescence of dermal fibroblasts and its relevance for photoaging of the human skin. Exp. Gerontol. 2017, 94, 78–82. [Google Scholar] [CrossRef] [PubMed]
  4. Gu, Y.; Han, J.; Jiang, C.; Zhang, Y. Biomarkers, oxidative stress and autophagy in skin aging. Ageing Res. Rev. 2020, 59, 101036. [Google Scholar] [CrossRef] [PubMed]
  5. Farage, M.A.; Miller, K.W.; Elsner, P.; Maibach, H.I. Intrinsic and extrinsic factors in skin ageing: A review. Int. J. Cosmet. Sci. 2008, 30, 87–95. [Google Scholar] [CrossRef] [PubMed]
  6. Rittié, L.; Fisher, G.J. Natural and sun-induced aging of human skin. Cold Spring Harb. Perspect. Med. 2015, 5, a015370. [Google Scholar] [CrossRef] [PubMed]
  7. Lai-Cheong, J.E.; McGrath, J.A. Structure and function of skin, hair and nails. Medicine 2013, 41, 317–320. [Google Scholar] [CrossRef]
  8. Blume-Peytavi, U.; Kottner, J.; Sterry, W.; Hodin, M.W.; Griffiths, T.W.; Watson, R.E.B.; Hay, R.J.; Griffiths, C.E.M. Age-Associated Skin Conditions and Diseases: Current Perspectives and Future Options. Gerontologist 2016, 56 (Suppl. 2), S230–S242. [Google Scholar] [CrossRef] [Green Version]
  9. Goel, A.; Kunnumakkara, A.B.; Aggarwal, B.B. Curcumin as “Curecumin”: From kitchen to clinic. Biochem. Pharmacol. 2008, 75, 787–809. [Google Scholar] [CrossRef] [Green Version]
  10. Sharifi-Rad, J.; Rayess, Y.E.; Rizk, A.A.; Sadaka, C.; Zgheib, R.; Zam, W.; Sestito, S.; Rapposelli, S.; Neffe-Skocińska, K.; Zielińska, D.; et al. Turmeric and Its Major Compound Curcumin on Health: Bioactive Effects and Safety Profiles for Food, Pharmaceutical, Biotechnological and Medicinal Applications. Front. Pharmacol. 2020, 11, 01021. [Google Scholar] [CrossRef]
  11. Liu, Y.-H.; Lin, Y.-S.; Huang, Y.-W.; Fang, S.-U.; Lin, S.-Y.; Hou, W.-C. Protective Effects of Minor Components of Curcuminoids on Hydrogen Peroxide-Treated Human HaCaT Keratinocytes. J. Agric. Food Chem. 2016, 64, 3598–3608. [Google Scholar] [CrossRef] [PubMed]
  12. Deng, H.; Wan, M.; Li, H.; Chen, Q.; Li, R.; Liang, B.; Zhu, H. Curcumin protection against ultraviolet-induced photo-damage in Hacat cells by regulating nuclear factor erythroid 2-related factor 2. Bioengineered 2021, 12, 9993–10006. [Google Scholar] [CrossRef] [PubMed]
  13. Liu, X.; Zhang, R.; Shi, H.; Li, X.; Li, Y.; Taha, A.; Xu, C. Protective effect of curcumin against ultraviolet A irradiation-induced photoaging in human dermal fibroblasts. Mol. Med. Rep. 2018, 17, 7227–7237. [Google Scholar] [CrossRef] [Green Version]
  14. Thomas, B. Lactic acid bacteria as starter cultures: An update in their metabolism and genetics. AIMS Microbiol. 2018, 4, 665–684. [Google Scholar] [CrossRef]
  15. Azam, M.; Mohsin, M.; Ijaz, H.; Tulain, R.; Ashraf, M.; Fayyaz, A.; Ul Abadeen, Z.; Kamran, Q. Lactic acid bacteria in traditional fermented Asian foods. Pak. J. Pharm. Sci. 2017, 30, 1803–1814. [Google Scholar]
  16. Albano, C.; Morandi, S.; Silvetti, T.; Casiraghi, M.C.; Manini, F.; Brasca, M. Lactic acid bacteria with cholesterol-lowering properties for dairy applications: In vitro and in situ activity. J. Dairy Sci. 2018, 101, 10807–10818. [Google Scholar] [CrossRef] [Green Version]
  17. Jeong, J.H.; Lee, C.Y.; Chung, D.K. Probiotic Lactic Acid Bacteria and Skin Health. Crit. Rev. Food Sci. Nutr. 2016, 56, 2331–2337. [Google Scholar] [CrossRef]
  18. Di Caro, S.; Tao, H.; Grillo, A.; Elia, C.; Gasbarrini, G.; Sepulveda, A.R.; Gasbarrini, A. Effects of Lactobacillus GG on genes expression pattern in small bowel mucosa. Dig. Liver Dis. 2005, 37, 320–329. [Google Scholar] [CrossRef]
  19. El Mecherfi, K.-E.; Todorov, S.D.; Cavalcanti de Albuquerque, M.A.; Denery-Papini, S.; Lupi, R.; Haertlé, T.; Dora Gombossy de Melo Franco, B.; Larré, C. Allergenicity of Fermented Foods: Emphasis on Seeds Protein-Based Products. Foods 2020, 9, 792. [Google Scholar] [CrossRef]
  20. Wedajo, B. Lactic Acid Bacteria: Benefits, Selection Criteria and Probiotic Potential in Fermented Food. J. Probiotics Health 2015, 3, 1–9. [Google Scholar] [CrossRef]
  21. Pianpumepong, P.; Noomhorm, A. Isolation of probiotic bacteria from turmeric (Curcuma longa Linn.) and its application in enriched beverages. Int. J. Food Sci. Technol. 2010, 45, 2456–2462. [Google Scholar] [CrossRef]
  22. Yong, C.; Yoon, Y.; Yoo, H.; Oh, S. Effect of Lactobacillus Fermentation on the Anti-Inflammatory Potential of Turmeric. J. Microbiol. Biotechnol. 2019, 29, 1561–1569. [Google Scholar] [CrossRef] [PubMed]
  23. Hu, Y.; Zhang, J.; Zou, L.; Fu, C.; Li, P.; Zhao, G. Chemical characterization, antioxidant, immune-regulating and anticancer activities of a novel bioactive polysaccharide from Chenopodium quinoa seeds. Int. J. Biol. Macromol. 2017, 99, 622–629. [Google Scholar] [CrossRef]
  24. Moein, M.R.; Moein, S.; Ahmadizadeh, S. Radical Scavenging and Reducing Power of Salvia mirzayanii Subfractions. Molecules 2008, 13, 2804–2813. [Google Scholar] [CrossRef] [PubMed] [Green Version]
  25. Nakamura, M.; Ra, J.-H.; Jee, Y.; Kim, J.-S. Impact of different partitioned solvents on chemical composition and bioavailability of Sasa quelpaertensis Nakai leaf extract. J. Food Drug Anal. 2017, 25, 316–326. [Google Scholar] [CrossRef] [Green Version]
  26. Abderrahim, F.; Huanatico, E.; Segura, R.; Arribas, S.; Gonzalez, M.C.; Condezo-Hoyos, L. Physical features, phenolic compounds, betalains and total antioxidant capacity of coloured quinoa seeds (Chenopodium quinoa Willd.) from Peruvian Altiplano. Food Chem. 2015, 183, 83–90. [Google Scholar] [CrossRef]
  27. Calò, R.; Marabini, L. Protective effect of Vaccinium myrtillus extract against UVA- and UVB-induced damage in a human keratinocyte cell line (HaCaT Cells). J. Photochem. Photobiol. B Biol. 2014, 132C, 27–35. [Google Scholar] [CrossRef] [PubMed]
  28. Hseu, Y.C.; Korivi, M.; Lin, F.Y.; Li, M.L.; Lin, R.W.; Wu, J.J.; Yang, H.L. Trans-cinnamic acid attenuates UVA-induced photoaging through inhibition of AP-1 activation and induction of Nrf2-mediated antioxidant genes in human skin fibroblasts. J. Derm. Sci. 2018, 90, 123–134. [Google Scholar] [CrossRef] [Green Version]
  29. Makpol, S.; Durani, L.W.; Chua, K.H.; Mohd Yusof, Y.A.; Ngah, W.Z. Tocotrienol-rich fraction prevents cell cycle arrest and elongates telomere length in senescent human diploid fibroblasts. J. Biomed. Biotechnol. 2011, 2011, 506171. [Google Scholar] [CrossRef] [Green Version]
  30. Han, B.-I.; Hwang, S.-H.; Lee, M. A progressive reduction in autophagic capacity contributes to induction of replicative senescence in Hs68 cells. Int. J. Biochem. Cell Biol. 2017, 92, 18–25. [Google Scholar] [CrossRef]
  31. Sun, X.; Zuo, H.; Liu, C.; Yang, Y. Overexpression of miR-200a protects cardiomyocytes against hypoxia-induced apoptosis by modulating the kelch-like ECH-associated protein 1-nuclear factor erythroid 2-related factor 2 signaling axis. Int. J. Mol. Med. 2016, 38, 1303–1311. [Google Scholar] [CrossRef] [PubMed] [Green Version]
  32. Mavrogonatou, E.; Konstantinou, A.; Kletsas, D. Long-term exposure to TNF-α leads human skin fibroblasts to a p38 MAPK- and ROS-mediated premature senescence. Biogerontology 2018, 19, 237–249. [Google Scholar] [CrossRef] [PubMed]
  33. Lee, H.-S. Antimicrobial Property of Turmeric (Curcuma longa L.) Rhizome-Derived ar-Turmerone and Curcumin. Food Sci. Biotechnol. 2006, 15, 559–563. [Google Scholar]
  34. Chen, J.; Liu, Y.; Zhao, Z.; Qiu, J. Oxidative stress in the skin: Impact and related protection. Int. J. Cosmet. Sci. 2021, 43, 495–509. [Google Scholar] [CrossRef]
  35. Bento-Silva, A.; Koistinen, V.M.; Mena, P.; Bronze, M.R.; Hanhineva, K.; Sahlstrøm, S.; Kitrytė, V.; Moco, S.; Aura, A.-M. Factors affecting intake, metabolism and health benefits of phenolic acids: Do we understand individual variability? Eur. J. Nutr. 2020, 59, 1275–1293. [Google Scholar] [CrossRef] [PubMed] [Green Version]
  36. Huynh, N.T.; Van Camp, J.; Smagghe, G.; Raes, K. Improved release and metabolism of flavonoids by steered fermentation processes: A review. Int. J. Mol. Sci. 2014, 15, 19369–19388. [Google Scholar] [CrossRef]
  37. Yi, Y.; Xie, H.; Xiao, X.; Wang, B.; Du, R.; Liu, Y.; Li, Z.; Wang, J.; Sun, L.; Deng, Z.; et al. Ultraviolet A irradiation induces senescence in human dermal fibroblasts by down-regulating DNMT1 via ZEB1. Aging 2018, 10, 212–228. [Google Scholar] [CrossRef] [Green Version]
  38. Zhong, J.L.; Edwards, G.P.; Raval, C.; Li, H.; Tyrrell, R.M. The role of Nrf2 in ultraviolet A mediated heme oxygenase 1 induction in human skin fibroblasts. Photochem. Photobiol. Sci. 2010, 9, 18–24. [Google Scholar] [CrossRef]
  39. Khan, N.M.; Haseeb, A.; Ansari, M.Y.; Devarapalli, P.; Haynie, S.; Haqqi, T.M. Wogonin, a plant derived small molecule, exerts potent anti-inflammatory and chondroprotective effects through the activation of ROS/ERK/Nrf2 signaling pathways in human Osteoarthritis chondrocytes. Free Radic. Biol. Med. 2017, 106, 288–301. [Google Scholar] [CrossRef] [Green Version]
  40. Fu, H.; Zhang, Y.; An, Q.; Wang, D.; You, S.; Zhao, D.; Zhang, J.; Wang, C.; Li, M. Anti-Photoaging Effect of Rhodiola rosea Fermented by Lactobacillus plantarum on UVA-Damaged Fibroblasts. Nutrients 2022, 14, 2324. [Google Scholar] [CrossRef]
  41. Liu, W.; Yan, F.; Xu, Z.; Chen, Q.; Ren, J.; Wang, Q.; Chen, L.; Ying, J.; Liu, Z.; Zhao, J.; et al. Urolithin A protects human dermal fibroblasts from UVA-induced photoaging through NRF2 activation and mitophagy. J. Photochem. Photobiol. B Biol. 2022, 232, 112462. [Google Scholar] [CrossRef]
  42. Jochum, W.; Passegué, E.; Wagner, E.F. AP-1 in mouse development and tumorigenesis. Oncogene 2001, 20, 2401–2412. [Google Scholar] [CrossRef] [PubMed] [Green Version]
  43. Brenneisen, P.; Wenk, J.; Klotz, L.O.; Wlaschek, M.; Briviba, K.; Krieg, T.; Sies, H.; Scharffetter-Kochanek, K. Central role of Ferrous/Ferric iron in the ultraviolet B irradiation-mediated signaling pathway leading to increased interstitial collagenase (matrix-degrading metalloprotease (MMP)-1) and stromelysin-1 (MMP-3) mRNA levels in cultured human dermal fibroblasts. J. Biol. Chem. 1998, 273, 5279–5287. [Google Scholar] [CrossRef] [Green Version]
  44. Wenk, J.; Brenneisen, P.; Wlaschek, M.; Poswig, A.; Briviba, K.; Oberley, T.D.; Scharffetter-Kochanek, K. Stable overexpression of manganese superoxide dismutase in mitochondria identifies hydrogen peroxide as a major oxidant in the AP-1-mediated induction of matrix-degrading metalloprotease-1. J. Biol. Chem. 1999, 274, 25869–25876. [Google Scholar] [CrossRef]
  45. Lu, J.; Guo, J.H.; Tu, X.L.; Zhang, C.; Zhao, M.; Zhang, Q.W.; Gao, F.H. Tiron Inhibits UVB-Induced AP-1 Binding Sites Transcriptional Activation on MMP-1 and MMP-3 Promoters by MAPK Signaling Pathway in Human Dermal Fibroblasts. PLoS ONE 2016, 11, e0159998. [Google Scholar] [CrossRef] [PubMed]
  46. Lin, Z.Y.; Chuang, W.L. Genes responsible for the characteristics of primary cultured invasive phenotype hepatocellular carcinoma cells. Biomed. Pharm. 2012, 66, 454–458. [Google Scholar] [CrossRef]
  47. Sengupta, P.; Xu, Y.; Wang, L.; Widom, R.; Smith, B.D. Collagen alpha1(I) gene (COL1A1) is repressed by RFX family. J. Biol. Chem. 2005, 280, 21004–21014. [Google Scholar] [CrossRef] [PubMed] [Green Version]
Figure 1. Selection of different lactic acid bacteria for turmeric milk fermentation through the determination of bacterial count. Values are the mean ± SD. Superscripts (a, b, c, etc.) indicate significant differences in one-way analysis of variance (ANOVA) and Tukey’s multiple range test (p < 0.05). The selected strains are colored in black, and the numbers represent their BCRC numbers: 14634: B. longum BCRC14634; 14023: L. paracasei BCRC14023; 12247: L. brevis BCRC12247; 14079: L. acidophilus BCRC14079; 12195: L. delbrueckii subsp. delbrueckii BCRC12195; 10697: L. casei BCRC10697. Other strains that were not chosen are colored in gray.
Fermentation 09 00230 g001
Figure 2. Growth curve of turmeric milk fermented by L. brevis BCRC12247. Values are the mean ± SD.
Fermentation 09 00230 g002
Figure 3. Content of free/bound phenolic compounds in unfermented (black) and fermented (gray) 2.5% turmeric milk. Experimental results were repeated in triplicate, and bar values are the mean ± standard deviation. Statistics were analyzed by t-test, * = p < 0.05. GAE, gallic acid equivalents.
Fermentation 09 00230 g003
Figure 4. Effects of the fractions of fermented turmeric milk extract on UVA-induced ROS production and cell survival rate after UVA exposure in Hs68 cells. (A) Images of ROS production in Hs68 cells were observed under fluorescence microscopy (400× magnification). (B) The fold change of mean fluorescence intensity of Hs68 cells. Experimental results were repeated in triplicate, and bar values are the mean ± standard deviation. Statistics were analyzed by t-test, * = p < 0.05, ** = p < 0.01. VC: Vehicle Control. NAC: N-acetylcysteine group. UF25: 25 ppm of unfermented turmeric milk ethanol extraction. F25: 25 ppm of fermented turmeric milk ethanol extraction.
Fermentation 09 00230 g004
Figure 5. Effects of fermented turmeric milk from various solvent fractions on UVA-induced ROS production after UVA exposure on Hs68 cells. (A) Cell survival rate of the four fractions of fermented turmeric milk extracts with different concentrations in Hs68 cells. (B) Images of ROS production in Hs68 cells were observed under fluorescence microscopy (400× magnification). (C) Bar values are the mean ± SD of three replicates. Bars with different superscripts indicate a significant difference (p < 0.05). NAC: N-acetylcysteine group. Hex100: 100 ppm of hexane fraction of fermented turmeric milk extract. EA100: 100 ppm of ethyl acetate fraction of fermented turmeric milk extract. Bu100: 100 ppm of butanol fraction of fermented turmeric milk extract. WA: 100 ppm of water residue fraction of fermented turmeric milk extract.
Fermentation 09 00230 g005
Figure 6. Effect of the fractions of fermented turmeric milk extract on SA-β-gal activity in UVA-irradiated Hs68 cells. (A) Microscopy images of senescent Hs68 cells shown by SA-β-gal staining (400× magnification). (B) SA-β-gal activity was quantified by the percentage of SA-β-gal-positive cells in total Hs68 cells. Superscripts indicate significant differences in one-way analysis of variance (ANOVA) and Tukey’s multiple range test (p < 0.05). SA-β-gal: senescence-associated β-galactosidase. NAC: N-acetylcysteine group. Hex100: 100 ppm of hexane fraction of fermented turmeric milk extract. EA100: 100 ppm of ethyl acetate fraction of fermented turmeric milk extract. Bu100: 100 ppm of butanol fraction of fermented turmeric milk extract. WA: 100 ppm of water residue fraction of fermented turmeric milk extract.
Fermentation 09 00230 g006
Figure 7. Effects of fractions of fermented turmeric milk on antioxidant genes expression in UVA-exposed Hs68 cells. (A) Nfr-2, (B) NQO1. Control: group without UV-A irradiation; NC: irradiated with 15 J/cm2 without other treatment; NAC: 1 mM N-acetylcysteine; Hex: 100 ppm n-hexane extract of fermented turmeric milk; WA100: 100 ppm fermented turmeric drink water. Residual layer test results are repeated three times and expressed as mean ± standard deviation. Statistics were analyzed by t-test, # = p < 0.05 vs. Control, #### = p < 0.0001 vs. Control, * = p < 0.05, *** = p < 0.001, **** = p < 0.0001.
Fermentation 09 00230 g007
Figure 8. Effects of the fractions of fermented turmeric milk on skin-associated genes expression in UVA-exposed Hs68 cells. (A) c-jun, (B) c-fos, (C) mmp-1, (D) COL1A1, (E) type 1 pro-collagen. Control: group without UV-A irradiation; NC: irradiated with 15 J/cm2 without other treatment; NAC: 1 mM N-acetylcysteine; Hex: 100 ppm n-hexane extract of fermented turmeric milk; WA100: 100 ppm fermented turmeric drink water. Residual layer test results are repeated three times and expressed as mean ± standard deviation. Statistics were analyzed by t-test, ## = p < 0.01 vs. Control, ### = p < 0.001 vs. Control, #### = p < 0.0001 vs. Control. * = p < 0.05, ** = p < 0.01, *** = p < 0.001, **** = p < 0.0001.
Fermentation 09 00230 g008
Table 1. Trolox equivalent of fermented and unfermented turmeric milk from antioxidant assays.
Turmeric MilkDPPH Free-Radical Scavenging Assay
(mmole TE/g dw)
ABTs Free-Radical Scavenging Assay
(mmole TE/g dw)
Ferric-Reducing Power Capacity Assay
(mmole TE/g dw)
UF1.77 ± 0.01 cd3.98 ± 0.06 cd2.82 ± 0.08 ab
140231.80 ± 0.01 c3.94 ± 0.06 d2.45 ± 0.11 c
121951.86 ± 0.02 b4.15 ± 0.11 bc2.90 ± 0.02 ab
122471.97 ± 0.02 a4.41 ± 0.05 a2.95 ± 0.03 a
146341.74 ± 0.01 d4.28 ± 0.03 ab2.72 ± 0.04 b
106961.86 ± 0.03 b4.18 ± 0.06 bc2.80 ± 0.09 ab
140791.93 ± 0.02 cd4.26 ± 0.08 ab2.75 ± 0.07 b
Each value is the mean ± SD of triplicates. Values are the mean ± SD. Superscripts (a, b, c, etc.) indicate significant differences in one-way analysis of variance (ANOVA) and Tukey’s multiple range test (p < 0.05). UF: unfermented turmeric milk; 14023, 12195, 12247, 14634, 10696, and 14079: BCRC numbers of LAB-fermented turmeric milk.
Disclaimer/Publisher’s Note: The statements, opinions and data contained in all publications are solely those of the individual author(s) and contributor(s) and not of MDPI and/or the editor(s). MDPI and/or the editor(s) disclaim responsibility for any injury to people or property resulting from any ideas, methods, instructions or products referred to in the content.

