Abstract
There are a variety of ways to make glucose-galactose syrup (GGS) and other products of lactose hydrolysis; therefore, research is still ongoing and will undoubtedly result in improved methods and lower costs. The aim of the study was to use a two-stage fermentation approach to increase the sweetness of glucose-galactose syrup. Comparing lactose hydrolysis with β-galactosidases, the enzyme Ha-Lactase 5200 (K. lactis) showed the highest hydrolysis yield but NOLA™ Fit5500 (B. licheniformis) and GODO-YNL2 (K. lactis) hydrolysis yields varied. After the two-stage fermentation, the syrups from sweet whey permeate had shown the highest sweet taste intensity scores; the sweetest samples were 1NFS and 1HLS with a score of 9.2 and 9.3, respectively. The presence of fructose in the range of 14 ± 3 to 25 ± 1 %, significantly (p < 0.05) increased the sweetness of the syrups. Obtained syrups from whey permeates using enzymes NOLA™ Fit5500 and Ha-Lactase 5200 contained less than 10% lactose. Additionally, results indicate that hydrolysis of lactose and subsequent enhancement of sweetness through glucose isomerisation may provide additional benefits through the production of galacto-oligosaccharides (GOS) in the range of 2 ± 1 to 34 ± 7%.
1. Introduction
Lactose is a main component of whey, which can be used in many biotechnology processes [1]. Thus, with the significant advances in biotechnology, whey is becoming a promising substrate for various food sectors [2].
Lactose is a reducing sugar participating in the Maillard’s reaction; it causes a significant loss of nutrients by creating by-products, which are capable of changing the product’s colour as well as taste [3]. In aqueous solutions, the rate of transformation and its balance between lactose α- and β-anomers [4] are challenging to control and determine; they depend on the temperature, concentration, pH and presence of other substances (minerals, riboflavin, traces of fat and protein) [5]. The use of lactose as a food ingredient is limited; it is less soluble and has low sweetness [6]. Lactose can easily be crystallised, which emphasises the fact that the usage is limited to the production of dairy products [7]. One of the biotechnological processes used in the dairy industry is lactose enzymatic hydrolysis with β-galactosidase to reduce the amount of lactose in milk and milk products [8]. This technology not only change the physical and chemical properties of the product but also helps to make milk more digestible [9]. β-Galactosidase (EK 3.2.1.23) is an enzyme catalysing a lactose glycosidic bond for its hydrolysis [10]. β-Galactosidase consists of four identical polypeptide chains, and each chain consists of 1023 amino acids and combining structural domains [9]. Whey hydrolysis and further treatment transform lactose into a valuable product such as sweet syrup, which could be used in milk, bakery and non-alcoholic product production. Therefore, hydrolysis of lactose would complement the gap of products and solve the environmental problem [7].
Acid and sweet whey permeates can be used as a raw material for lactose hydrolyse into monosaccharides, and after proper treatment, glucose-galactose syrup (GGS) can be produced [11]. In terms of sweetness, the relative sweetness of lactose compared to sucrose (1.0) is 0.16, galactose 0.6, glucose 0.7 [12] and fructose 1.2–1.8 [13]; the sweetness of hydrolysed lactose products is about 0.7 which is 4–4.5 times sweeter than lactose [14].
The enzymatic method to obtain GGS is highly selective for monosaccharides and this research is ongoing and will undoubtedly lead to process improvements and cost changes [15]. Each commercial β-galactosidase is unique and behaves differently during lactose hydrolysis. These factors (the enzyme activity, lactose concentration, reaction time, hydrolysis rate and monosaccharide ratio) affect sweetness, concentration of a new developed products, lactose hydrolysis and galacto-oligosaccharides synthesis during the reaction [16]. To increase the sweetness of the GGS, glucose isomerisation can be used, resulting in a solution of 50% galactose, 29% glucose and 21% fructose [17].
The aim of the research was to use the two-stage fermentation approach for increasing glucose-galactose syrup sweetness.
2. Materials and Methods
2.1. Chemicals and Materials
Sweet and acid whey permeates with total solids of 5% were gained from local dairy factories (Latvia). Fresh permeates were stored in the fridge at 4 ± 2 °C no longer than 24 h. Commercial β-galactosidases: NOLATM Fit5500 (B. licheniformis) (Chr.HANSEN, Denmark, Hørsholm), Ha-Lactase 5200 (K. lactis) (Chr.HANSEN, Denmark, Hørsholm), and GODO-YNL2 (K. lactis) (Danisco, Denmark, Hørsholm) and glucose isomerase isolated from Streptomyces murinus (Sigma–Aldrich, St. Louis, MO, USA) were used for the study. Commercial glucose-galactose syrup was kindly provided by “Smiltenes piens” (Latvia).
D-Lactose monohydrate (≥99.5% purity), D (+) galactose (≥99% purity), D (+) glucose (≥99.5% purity), D-fructose (≥99% purity), KOH (≥85%, pellets) and acetonitrile were purchased from (Sigma Aldrich, St. Louis, MO, USA).
2.2. Production of GGS
2.2.1. Hydrolysis of Permeates
The hydrolysis of lactose (first-stage fermentation) was carried out according to Majore and Ciprovica’s [18] described method using permeates with lactose concentration of 20%. During fermentation at temperature 42 °C, time 4 h, it is important to ensure the optimal pH of substrates to keep enzymes active (Ha-Lactase 5200 enzyme pH 6.5–8.0, for NOLATM Fit5500 enzyme pH 5.4–7.0 and for GODO-YNL2 enzyme pH 7.5–8.0); therefore, 10% KOH was used for the adjustment of pH.
The degree of lactose hydrolysis (DH)% was calculated with the equation:
where:
L0—initial lactose concentration, g L−1;
L1—concentration of lactose after hydrolysis, g L−1.
2.2.2. Isomerisation
After lactose hydrolysis, glucose isomerisation (second-stage fermentation) into fructose was done using a method described by Majore and Ciprovica [18]. Afterwards, isomerised samples were filtrated to remove enzyme debris and evaporated to a solids’ concentration of 70%, gaining a syrup-like product.
2.3. Lactose, Glucose, Fructose and Galactose Analyses
Sugar determination was conducted with high-performance liquid chromatography (HPLC). Each sample was placed into 1.5 mL Eppendorf tubes and centrifuged for 5 min at 10,000 rpm. Lactose, fructose, glucose and galactose were determined with the HPLC (Shimadzu) refractive index detector RID-10A; column: Alltech NH2, (4.6 mm × 250 mm, particle size of 5 μm); temperature: 40 °C; mobile phase: A—acetonitrile 80%, B—deionised water 20%; rate of flow: 1.2 mL min−1; at the time range of 0 to 12 min [19]. Standards were prepared at the concentration range from 0.5 to 100 g L−1 for calibration. The equation was used to calculate the concentration of lactose (g L−1) in the sample:
where:
Mlac—molecular weight of lactose (342.3 g mol−1);
Mlac m—molecular weight of α-lactose monohydrate (360.3 g mol−1);
lac m—concentration of α-lactose monohydrate (g L−1) from HPLC analyses [20].
Analyses were carried out in triplicate.
2.4. Galacto-Oligosaccharides (GOS) Analyses
The GOS concentration was determined with HPLC (Agilent 1100) using the column: Shodex KS-802 (300 mm × 8 mm); mobile phase—H2O, flow rate 0.5 mL min−1 [21].
2.5. Sensory Evaluation
Sensory evaluation was carried out according to the ISO 4121:2003 [22]. The 36 trained panellists (students and staff members of the Faculty of Food Technology, Latvia University of Life Sciences and Technologies) were chosen for the first-stage fermented samples evaluation, and 30 panellists were chosen to evaluate samples after the second-stage fermentation. The substrate solids’ concentration in each fermentation stage was different—at the first-stage fermentation 20% and at the second-stage fermentation 70%. Commercially available GGS was used as a control, and distilled water or an evaporator was used to adjust the required solids concentration to be the same as the fermented samples.
The concentration of solids was measured with a digital refractometer (KR ÜSS GmbH, Germany). In the sensory test, 1 commercial GGS, 3 fermented sweet whey permeate samples and 3 fermented acid whey permeate samples were tested. Each sample was placed into a glass beaker and placed on a tray in two lines, but glucose-galactose syrup (Control) was placed at the beginning of each line; all eight samples were coded and tested. Participants were asked to rate the intensity of sweet, sour, salty and aftertaste attributes on an unstructured 12-point line scale, where 0 is not detected and 12 is extremely strong. After each attribute assessment, panellists were invited to provide a comment expressing their feelings and emotions, which may be used to characterise samples in greater detail. The format of the evaluation sheet and data collection were processed with FIZZ software (Biosystemes, France, Dijon). Warm tea without sugar was used for the recovery of taste between samples.
2.6. Statistical Analysis
Results were expressed as mean ± standard deviation (SD) of three replicates for composition and analytical measurements. Statistical analyses were carried out using Two-Way ANOVA, One-Way ANOVA and Tukey tests. The level of significance of the data is characterised by the value of p (0.05). All data were calculated in MS Excel 2019 software.
The frequency of mentioning terms with the same meaning by panellists was counted and grouped in categories according to Rodrigues et al.’s [23] method.
Sensory data were analysed using principal component analysis (PCA); where the variables are sensory attributes, the data were assessed with a Two-Way ANOVA. Statistical analyses were performed using R Studio Version 2022.02.0 + 443 package (PBC).
3. Results
3.1. First-Stage Fermentation with β-Galactosidase
Figure 1 provides an overview of the sugars’ concentrations after first-stage fermentation. The experiment was performed using sweet and acid whey permeates with lactose concentrations of 20.4 ± 0.2% and 18.5 ± 0.1%, respectively.
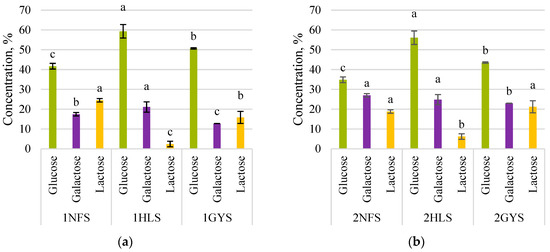
Figure 1.
Sugars’ concentrations during 4 h of lactose hydrolysis. (a)—sweet whey permeate 1GYS—GODO-YNL2; 1NFS—NOLA™ Fit5500; 1HLS—Ha-Lactase 5200. (b)—acid whey permeate 2GYA—GODO-YNL2; 2NFA—NOLA™ Fit5500; 2HLA—Ha-Lactase 5200. The values marked with the same letter within each sugar do not differ significantly (p > 0.05).
The study results were analysed using the concentration of final sugar as a criterion. After 4 h of lactose hydrolysis in sweet whey permeate (Figure 1a), the final lactose concentration of NOLA™ Fit5500 was only 24.5 ± 0.5% of the initial lactose concentration 20.4 ± 0.2%, Ha-Lactase 5200—2 ± 1% and GODO-YNL2—15.9 ± 3.5%. The degree of lactose hydrolysis (DH) for NOLA™ Fit5500 was 75%, Ha-Lactase 5200—98% and GODO-YNL2—84%. Using acid whey permeate (Figure 1b), the final lactose concentration of NOLA™ Fit5500 was 18.9 ± 0.5% of the initial lactose concentration 18.9%, Ha-Lactase 5200—6.2 ± 0.8% and GODO-YNL2—21.2 ± 3.5%. The DH for NOLA™ Fit5500 was 81%, Ha-Lactase 5200—94% and GODO-YNL2—79%.
Comparing the activity of enzymes in both permeates (Figure 1a,b), it can be seen that the Ha-Lactase 5200 (K. lactis) showed the highest activity, but for NOLA™ Fit5500 (B. licheniformis) and GODO-YNL2 (K. lactis), the activity varied. Metal ions in permeates functionated as activators or inhibitors for enzymes, affecting lactose hydrolysis and monosaccharide production [24]. In our previous study [18], we had analysed potassium, sodium, calcium, magnesium and phosphate concentrations in acid and sweet whey permeates. Both permeates with lactose concentration of 20% are highly rich with potassium 5600 ± 140 mg kg−1 (in acid whey permeate) and 2710 ± 55 mg kg−1 (in sweet whey permeate). According to the literature, the monovalent K+ ion acts as an activator for K. lactis β-galactosidase, and K+ and Na+ ions act as activators for B. licheniformis β-galactosidase, although almost all divalent ions are inhibitors [25].
In this study, the β-galactosidase enzymes from K. lactis and B. licheniformis were tested, and the optimal hydrolysis conditions (medium pH and temperature) for each of them were provided. This is primarily a responsibility for ensuring the highest enzyme activity [26]. Permeate is a complex medium containing salts and acids; it is beneficial to Ha-Lactase 5200 but inhibits NOLATM Fit5500 and GODO-YNL2, resulting in enzyme activity reduction. Complete lactose hydrolysis with β-galactosidase is difficult to achieve. Inhibition increases and slows the rate of hydrolysis, allowing the hydrolysis reaction to last longer and accomplish at least 70% lactose hydrolysis. According to Demirhan et al.’s [27] study, at concentration of enzyme 1 mL L−1 and lactose 1–6%, the inhibition constants for glucose and galactose were found at the concentrations of 10.32 g L−1 and 13.03 g L−1, respectively, and the most effective inhibitor for β-galactosidase was glucose. This indicates that the concentrations of glucose and galactose are important factors in the hydrolysis of lactose. Our results showed that the low galactose concentration in relation to the glucose concentration was apparent for all samples in both permeates. Ha-Lactase 5200 showed the highest glucose concentration in both permeates as well as galactose concentration; in turn, the enzyme NOLA™ Fit5500 showed the lowest results. The study by Popescu et al. [28] showed that using 30 U mL−1 NOLA™ Fit5500 for lactose hydrolysis in milk (4.75%) at a temperature of 38–40 °C made it possible to reach DH over 90% after 2 h. Botvynko et al. [29] used 10 U mL−1 NOLA™ Fit5500 enzyme to hydrolyse 40% w/w lactose at 40 °C and achieved 70.7% DH. By comparing the results of those authors with ours, it can be stated that the higher the solids’ concentration of the substrate, the less DH is obtained using the NOLA™ Fit5500 enzyme.
Osmak et al. [30] reported 75.4 ± 2.5% of DH after 4 h of hydrolysis using demineralised sweet whey with a dry matter concentration of 20% and a GODO-YNL2 enzyme load of 20 U mL−1. Our study showed that the GODO-YNL2 enzyme is capable of hydrolysing lactose by more than 75% using both types of permeate, especially when using the acid whey permeate for which DH was 84%. The enzyme activity and stability depend primarily on the source of the enzyme, the conditions of activity (temperature, average pH, aeration, agitation, incubation time) and the components present in the growth medium [31]. Acid whey has higher concentrations of calcium, phosphate and lactate than sweet whey, which may be important factors affecting β-galactosidase’s ability to hydrolyse lactose more effectively in acid whey permeate [32].
The Results of Sensory Test 1
Selected taste attributes of samples obtained in the first-stage fermentation were determined using sensory studies and are shown in Figure 2.
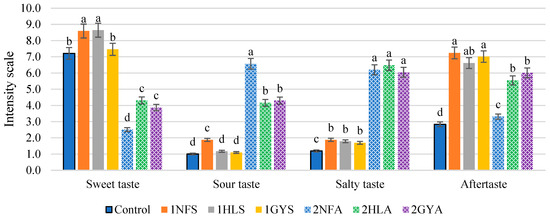
Figure 2.
The sensory properties of hydrolysed permeate samples after first-stage fermentation. Using sweet whey permeate and enzyme 1GYS—GODO-YNL2; 1NFS—NOLA™ Fit5500; 1HLS—Ha-Lactase 5200. Using acid whey permeate and enzyme 2GYA—GODO-YNL2; 2NFA—NOLA™ Fit5500; 2HLA—Ha-Lactase 5200. Control—commercial glucose-galactose syrup. The values marked with the same letter within each sensory attribute do not differ significantly (p > 0.05) (n = 36).
Sensory results showed that using sweet whey permeate as a substrate, 1NFS and 1HLS sample scores were 8.6 (out of 12), and the samples were significantly (p < 0.05) sweeter compared to the Control and 1GYS samples. The sour taste intensity differed significantly (p < 0.05) for the 1NFS sample, which was rated 1.9 (out of 12), while 1HLS, 1GYS and Control samples’ scores ranged from 1.0 to 1.2. There was no significant difference (p > 0.05) in the salty taste between 1NFS, 1HLS and 1GYS samples nor between the 2NFA, 2HLA and 2GYA samples. Overall, the sour and salty taste intensity scored below 2 (out of 12), suggesting a low concentration of salts in the samples of 1NFS, 1HLS and 1GYS. The difference in aftertaste between those samples was also not significant (p > 0.05), and the samples were scored from 6.6 to 7.2 but the Control, 2.8.
Sensory results of the first-stage fermentation using acid whey permeate 2NFA, 2HLA and 2GYA samples show low scores in sweet taste intensity within the range of 2.5 to 4.3. The lowest score (2.5) in sweet taste intensity and the highest score in sour taste intensity (6.6) were given to the 2NFA sample. The scores of aftertaste intensity showed that the 2HLA and 2GYA samples were rated with 5.6 and 6.0, respectively, and did not differ significantly either (p > 0.05).
Kumar et al. [33] stated that the sweetness score 8.6 (based on a nine-point Hedonic Rating Scale) was recorded for hydrolysed milk using the enzyme Ha-Lactase 5200 with a concentration of 7363.59 NLU L−1. Pawlos et al. [34] reported that lactose hydrolysis in goat’s milk showed a 4.75 ± 2.27 score of sweet taste (based on a nine-point rating scale) and was characterised by a less sour flavour. Li et al. [35] observed that the sweet taste score of hydrolysed skim chocolate milk with the addition of 10% of permeate using the GODO-YNL2 enzyme was scored at approximately 8 (based on an intensity scale of 15).
One of the main differences between hydrolysed permeate samples is the high saltiness and low sweetness intensity. The factors that need to be specified are the source of the whey permeate, the pH and the amount of 10% KOH, which was used to provide optimal medium pH. Acid whey permeate is mainly obtained from fermented dairy products (cottage cheese, Greek yoghurt), and after ultrafiltration, the protein and fat are removed, but the lactic acid and salt remain in it. This is the reason for the low pH, low saltiness and high acidity [36]. The optimum pH for each enzyme is different. Experiments with NOLATM Fit5500 β-galactosidase were performed at pH 5.6 ± 0.1. This can explain the lowest sweetness score and the highest sour and salty intensity. Wen et al. [37] summarised the results of several studies, which showed that the K+ ion contributes to a salty taste.
Principal component analysis (PCA) was performed to provide a clear visualisation of associations among sensory attributes, enzyme variety and the type of whey permeate in Figure 3.
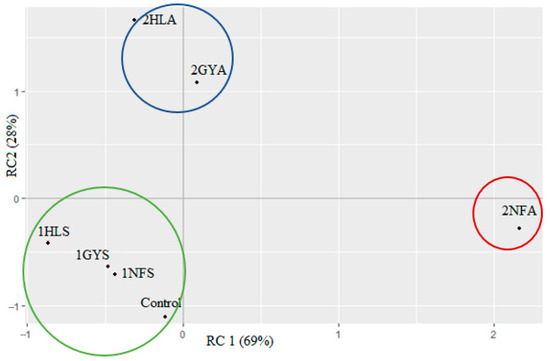
Figure 3.
Principal component analysis (PCA) generated from the sensory properties of hydrolysed whey permeates after first-stage fermentation. Using sweet whey permeate and enzyme 1GYS—GODO-YNL2; 1NFS—NOLA™ Fit5500; 1HLS—Ha-Lactase 5200. Using acid whey permeate and enzyme 2GYA—GODO-YNL2; 2NFA—NOLA™ Fit5500; 2HLA—Ha-Lactase 5200. Control—commercial glucose-galactose syrup. The values with the same letter within each column do not differ significantly (p > 0.05).
The PCA biplot showed 97% of the total variance with RC1 and RC2 explaining 69% and 28%, respectively. It can be concluded that this type of product is partially acceptable as a sweet. Samples 1NFS, 1HLS, 1GYS and the Control had a negative RC1 and RC2 and appeared at the bottom of the PCA plot, indicated as Group 1. These samples showed similar evaluation scores of high sweet intensity and low sour and salty intensity. Group 2 is the sample 2NFA, which had the strongest influence on RC1. Data in this group were evaluated with a low sweet taste and high sour taste intensity. In addition, in Group 3, samples 2HLA and 2GYA showed low evaluation scores in sweet and sour intensity.
Variations in sample groups were observed when acid whey permeate was applied for hydrolysis. In Figure 3, samples 2NFS, 2HLS and 2GYS demonstrated that the enzyme origin of samples 2HLA and 2GYA is yeast (K. lactis), and the sensory scores (Figure 2) were not statistically different compared with the sample 2NFA (B. licheniformis) sensory scores.
It was important to compare the correlation between sweet (RC2) and sour (RC1) taste attributes because they are the primary properties that can demonstrate the efficiency of lactose hydrolysis in producing glucose-galactose syrup. The relatively low percentage of 28% of variance (RC2), explained with the PCA model, may suggest that the composition (acids, salts) of acid whey permeate mainly affects the correlation between sweet and acid taste intensity. This PCA plot indicated that, although the hydrolysis of different permeates with different enzymes could be gained, the food samples with various attribute intensities.
3.2. Second-Stage Fermentation with Glucose Isomerase
Comparing the concentration of glucose and galactose in both permeates, it can be seen that using a sweet whey permeate results in a higher concentration of monosaccharides than using an acid whey permeate. The low galactose concentration in hydrolysis indicated that a higher amount of galactose was utilised in GOS production. Table 1 shows the composition of GGS syrups obtained after second-stage fermentation.

Table 1.
Glucose-galactose syrups’ sugar compositions at solids 70%.
Syrups obtained from permeates using enzyme NOLA™ Fit5500 and Ha-Lactase 5200 contained less than 10% lactose compared to the Control. The concentration of fructose in syrups derived from sweet whey permeate ranges from 20 ± 4% to 25 ± 1%, while syrups derived from acid whey permeate range from 14 ± 3% to 16 ± 1%. Fructose is one of the main carbohydrates that enhances the sweetness of the syrup.
During the hydrolysis, a transgalactosylation reaction also activates, which causes the formation of GOS [38]. The syrups from sweet whey permeate showed the concentration of galactose in the range of 21 ± 3 to 37 ± 1%, glucose 12 ± 4 to 22 ± 1% and GOS 12 ± 2 to 33 ± 7%, but syrups from acid whey permeate galactose showed 38 ± 1 to 49 ± 7%, glucose 23 ± 2 to 29 ± 5% and GOS 2 ± 1 to 14 ± 4%. This activity mainly affects the concentration ratio of glucose and galactose, as well as forms of GOSs. The concentration of medium can affect the concentrations of glucose and galactose [39]. The findings of Voorde et al. [40] revealed that the concentration of substrate influences the synthesis of glucose, galactose and GOS. The more the whey permeate was diluted, the more evenly glucose and galactose concentrations were obtained.
Table 1 revealed that the galactose concentrations in both GODO-YNL2 samples were the lowest. When compared to the other two enzyme results, this enzyme exhibited the ability to be more active in the transgalactosylation reaction rather than hydrolysation, which could be proven with the high GOS concentration. The synthesis of GOSs is dependent on the amount of lactose in the reaction medium, the enzyme origin and the overall reaction conditions [40]. The transgalactolytic activity of the enzyme from K. lactis is greatly influenced by the salt concentrations in whey and their ratio (as seen by the enzyme’s distinct behaviour in acid whey), which varies between suppliers [24]. The concentration differences of glucose between research syrups and the Control can be explained by the use of enzyme glucose isomerase. In the production of the Control sample, the producer had performed only lactose hydrolysis (β-galactosidase, first-stage fermentation).
These results indicate that hydrolysis of lactose and subsequent enhancement of sweetness through glucose isomerisation may also provide additional benefits through the production of prebiotic GOSs.
The formation of fructose from glucose was accomplished with an isomerisation reaction. The resultant syrups had a sweeter taste intensity (Figure 4) compared to the first-stage fermentation results in Figure 2. Significant differences (p < 0.05) between the developed syrups and the Control sample were observed. There was a significant (p < 0.05) difference in sweet taste intensity between 1GYS and both 1NFS and 1HLS samples when sweet whey permeates were used as a substrate. The sweetest samples were 1NFS and 1HLS with a score of 9.2 and 9.3, respectively. In the sour taste intensity, 1GYS, 1NFS, 1HLS and Control samples showed that the evaluation did not differ significantly (p > 0.05) in the range of 1.4 to 1.9. The sweet taste intensity of 2NFA and 2HLA samples was not significantly different (p > 0.05), 4.2 and 4.5, respectively, and the 2GYA sample had the lowest score of 3.4 (out of 12).
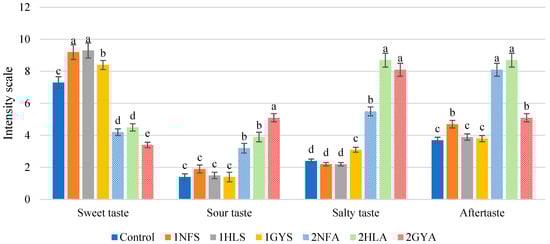
Figure 4.
The sensory properties of syrups after two-stage fermentation. Using sweet whey permeate and enzyme 1GYS—GODO-YNL2; 1NFS—NOLA™ Fit5500; 1HLS—Ha-Lactase 5200. Using acid whey permeate and enzyme 2GYA—GODO-YNL2; 2NFA—NOLA™ Fit5500; 2HLA—Ha-Lactase 5200. Control—commercial glucose-galactose syrup. The values marked with the same letter within each sensory attribute do not differ significantly (p > 0.05) (n = 30).
Syrup samples from sweet whey permeate had a less salty taste than syrups from acid whey permeate, as well as aftertaste.
Glucose isomerase is active at pH 7.5, and to prepare samples for the second-stage fermentation, 10% KOH solution was used to adjust the pH of the samples. The permeate composition, particularly potassium and organic acids, contribute to the salty taste, according to Frankowski et al. [41]. One of the main problems with acid whey is its high acidity, and for many recycling processes, whey should be neutralised. The common approach is to use strong alkali such as sodium hydroxide (NaOH) or potassium hydroxide (KOH). However, this approach affects the ionic composition of whey and neutralises desalination, making the technology even less efficient [42]. In acid whey permeate samples, increasing the pH to 7.5 had a substantial impact on syrup concentration and sensory attributes. The reactive groups of amino acids are affected by strong alkali solutions, resulting in changes in noncovalent forces that influence binding, such as Van der Waals forces, electrostatic interactions, hydrophobic interactions and hydrogen bonding [43]. Luzzi et al. [44] reported that the presence of calcium during isomerisation raises the inhibition effect on fructose formation, which could explain the low concentration of fructose in samples from acid whey permeate. Majore and Ciprovica [45] reported that acid whey permeate contains three times higher calcium than sweet whey permeate.
Principal component analysis (PCA) was performed to provide a clear visualisation of associations among developed syrups, research of enzymatic reactions and type of whey permeate in Figure 5. The largest variance of the data was described with the main attributes RC2 and RC1, which represent a sweet and sour taste, respectively. The PCA biplot accounted for 96% of the total variance with RC1 and RC2, explaining 63% and 33%, respectively. Regarding the panellists’ evaluation, the samples 1NFS, 1HLS, 1GYS and the Control had negative RC1 and RC2 and appeared at the bottom of the PCA plot. Samples were divided into two groups where Group 1 represented sample 1NFS and Group 2 the samples 1HLS, 1GYS and the Control. Those samples were characterised similarly with a high sweet and low sour and salty taste intensity, but sample 1NFS had a higher intensity of aftertaste than the rest of the samples. The greatest influence on RC1 was found in the Group 3 sample 2GYA, which had the least sweet taste and the least sour and salty taste intensity. The optimal pH medium for efficient hydrolysis of the GODO-YNL2 enzyme was in the range of 7.5–8.0 [45]. Using acid whey permeate as a substrate, achieving this high pH is difficult. The usage of an alkali allows one to increase the pH of the medium, but it has a profound sensory influence, suppressing the sweetness of the syrup. The samples 2HLA as Group 4 and 2NFA as Group 5 had the greatest impact on RC2, with low sweet taste assessment ratings and high aftertaste intensity. These two samples also showed that the aftertaste is more noticeable than the sweet taste when utilising acid whey permeate with two-stage fermentation. To optimise the sweet syrup process from acid whey permeate, more extensive research should be conducted.
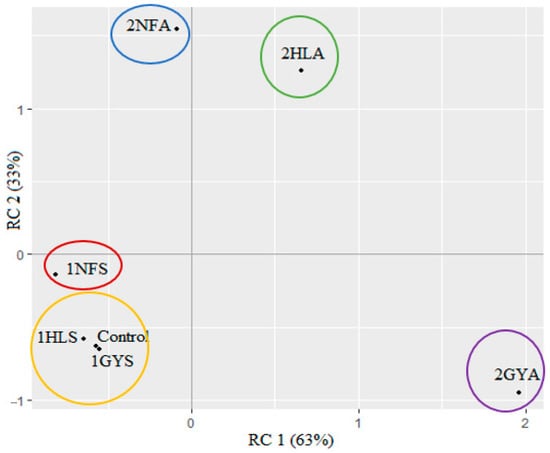
Figure 5.
Principal component analysis (PCA) for syrups of sweet and acid whey permeates after second-stage fermentation, evaluated at four sensory attributes’ (sweet, sour, salty and aftertaste) intensities. Commercial glucose-galactose syrup used as a control (n = 30).
Evdokimov et al. [14] also evaluated sensory properties of glucose-galactose syrup from sweet whey, and the results showed that the syrup has a slightly bitter aftertaste, which could be caused by the presence of minerals as well as short peptide and amino acid residues. Lorenzen et al. [46] reported that using two-stage fermentation, the sweet taste of skim milk permeate and different types of whey permeates can be raised by a factor of three, while raising the sweetness for acid whey permeate by a factor of roughly 2.5. Based on the sensory experiments of Luzzi et al. [44], the application of the two-stage fermentation in yoghurt and pudding samples reduced the total sugar concentration by 10–20% (w/w) while maintaining the same sweetness.
The findings of two-stage fermentation have shown that hydrolysing lactose and the creation of new sugars significantly increases the sweetness and the nutritional value of the final product. Fermentation technology, according to some authors [44,47,48,49], provides more efficient resource utilisation and the transformation of milk by-product into a valuable food additive with a wide range of applications.
Figure 6 shows the most noted descriptions for the newly developed glucose-galactose syrups.
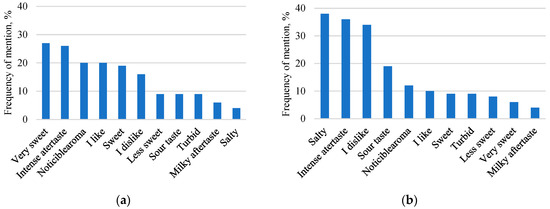
Figure 6.
Frequency of the 11 most frequently mentioned descriptions that participants noted during evaluation. Glucose-galactose syrups of second-stage fermentation from sweet whey permeate (a); Glucose-galactose syrups of two-stage fermentation from acid whey permeate (b).
Regardless of the whey origin, the terms “Very sweet” (27%) and “Intense aftertaste” (26%) were the most cited for syrups from sweet whey permeate, but the words “Intense aftertaste” (36%), “Salty” (38%) and “I dislike” (34%) were the most cited for syrups from acid whey permeate. It was noted that participants indicated that the syrups from sweet whey permeate had a noticeable sweet taste throughout consumption, and this could explain the high citation of “I like” (20%) compared to syrups from acid whey permeate (10%). Due to the obvious salty taste and aftertaste, the participants were not impressed by the syrups which were made from acid whey permeate, as evidenced by the high citation of “I dislike” (34 %). It should be highlighted that all six syrups have a remarkable monosaccharide and GOS concentrations. This research showed that the sensory profile of two-stage fermentation is effective and is able to increase the sweetness of the syrup. Although isomerisation has some side effects (formation of new sugar and products, addition of more alkali for pH control), additional preparations are needed to improve the clarity of the syrup, especially in the case of acid whey syrup. The sweet taste scoring results of final syrups obtained from sweet whey permeate suggest that this product has the potential to enter the food market as a sugar substitute. Acid whey permeate syrups have the most expressive salty and sour tastes and can be used as one of the ingredients in sauces or as a salad dressing in the kitchen.
4. Conclusions
The present study showed that two-stage fermentation can be used to increase sweetness. Results highlight the impact of enzyme sources on the capability of lactose hydrolysis and glucose isomerisation. Sensory assessment of the syrups derived from both permeates revealed considerable differences. Sensory research revealed that results were comparable to commercial glucose-galactose lactose syrup and that syrups made from sweet whey permeate had a higher sweet taste intensity. Our study provided evidence about the importance of choosing the proper β-galactosidase preparation in combination with glucose isomerase in order to produce highly sweetened glucose-galactose syrup. Specifically, we demonstrated that after the two-stage fermentation, the syrup contains fructose in the range of 14 ± 3 to 25 ± 1% and galacto-oligosaccharides in the range of 2 ± 1 to 34 ± 7%. After the two-stage fermentation, each syrup became almost unique, demonstrating the method’s features and potential applications.
Author Contributions
Conceptualisation, K.M. and I.C.; methodology, K.M.; formal analysis, K.M.; investigation, K.M.; data curation, K.M.; writing—original draft preparation, K.M.; writing—review and editing, I.C.; visualisation, K.M.; supervision, I.C. All authors have read and agreed to the published version of the manuscript.
Funding
This research was funded by the project ‘Strengthening Research Capacity in Latvia University of Agriculture’ (project No. 3.2.-8/49) and the grant Latvia University of Life Sciences and Technologies Transition to the New Doctoral Funding Model. European Social Fund Project No.8.2.2.0/20/I/001.
Institutional Review Board Statement
Not applicable.
Informed Consent Statement
Not applicable.
Data Availability Statement
Not applicable.
Conflicts of Interest
The authors declare no conflict of interest.
References
- Ryan, M.P.; Walsh, G. The biotechnological potential of whey. Rev. Environ. Sci. Biotechnol. 2016, 15, 479–498. [Google Scholar] [CrossRef]
- Simović, M.; Milivojević, A.; Ćorović, M.; Banjanac, K.; Bezbradica, D. Whey valorization using transgalactosylation activity of immobilized β-galactosidase. Int. J. Food Sci. 2019, 54, 3074–3082. [Google Scholar] [CrossRef]
- Anand, S.; Som Nath, K.; Chenchaiah, M. Whey and whey products. In Milk and Dairy Products in Human Nutrition: Production, Composition and Health; Park, Y.W., Haenlein, G.F.W., Eds.; John Wiley and Sons, Ltd.: Chichester, UK, 2013; pp. 477–497. [Google Scholar] [CrossRef]
- Carpin, M.; Bertelsen, H.; Bech, J.K.; Jeantet, R.; Risbo, J.; Schuck, P. Caking of lactose: A critical review. Trends Food Sci. Technol. 2016, 53, 1–12. [Google Scholar] [CrossRef]
- Wong, S.Y.; Hartel, R.W. Crystallization in lactose refining: Review. J. Food Sci. 2014, 79, 257–272. [Google Scholar] [CrossRef] [PubMed]
- Batista, K.A.; Silva, C.N.S.; Fernandes, P.M.; Campos, I.T.N.; Fernandes, K.F. Development of a new bioaffinity stationary phase for lactose removal using a lactose-binding lectin immobilized onto polyaniline. Sep. Purif. Technol. 2017, 185, 54–60. [Google Scholar] [CrossRef]
- Panesar, P.; Kumari, S.; Panesar, R. Potential applications of immobilized β-galactosidase in food processing industries. Enzyme Res. 2010, 2010, 473137. [Google Scholar] [CrossRef]
- Dutra Rosolen, M.; Gennari, A.; Volpato, G.; De Souza, C.F.V. Lactose hydrolysis in milk and dairy whey using microbial β-galactosidases. Enzyme Res. 2015, 2015, 806240. [Google Scholar] [CrossRef]
- Saqib, S.; Akram, A.; Halim, S.A.; Tassaduq, R. Sources of β-galactosidase and its applications in food industry. 3 Biotech 2017, 7, 79. [Google Scholar] [CrossRef]
- Adalberto, P.R.R.; Massabni, A.C.C.; Carmona, E.C.C.; Goulart, A.J.J.; Marques, D.P.P.; Monti, R. Effect of divalent metal ions on the activity and stability of β-galactosidase isolated from Kluyveromyces lactis. Rev. Ciênc. Farm. Básica E Apl. 2010, 31, 143–150. [Google Scholar]
- Shen, J.; Chen, J.; Jensen, P.R.; Solem, C. Sweet as sugar—Efficient conversion of lactose into sweet sugars using a novel whole—Cell catalyst. J. Agric. Food Chem. 2019, 67, 6257–6262. [Google Scholar] [CrossRef]
- Joesten, M.D.; Wood, J.L.; Castellion, M.E. The world of chemistry: Essentials, 3rd ed.; Brooks/Cole: Belmont, CA, USA, 2007; p. 231. [Google Scholar]
- Rocha, J.M.; Guerra, M.A. On the valorisation of lactose and its derivatives from cheese whey as a dairy industry by-product: An overview. Eur. Food Res. Technol. 2020, 246, 2161–2174. [Google Scholar] [CrossRef]
- Evdokimov, I.A.; Kulikova, I.K.; Volkova, E.I.; Oleshkevich, O.I.; Shramko, M.I.; Voblikova, T.V. Modification of the carbohydrate component of ice cream and frozen desserts using glucose-galactose syrup. In Proceedings of the IOP Conference Series: Earth and Environmental Science, Veliky Novgorod, Russia, 22 October 2020. [Google Scholar]
- Lindsay, M.J.; Walker, T.W.; Dumesic, J.A.; Rankin, S.A.; Huber, G.W. Production of monosaccharides and whey protein from acid whey waste streams in the dairy industry. Green Chem. 2018, 20, 1824–1834. [Google Scholar] [CrossRef]
- Suárez, S.; Guerrero, C.; Vera, C.; Illanes, A. Effect of particle size and enzyme load on the simultaneous reactions of lactose hydrolysis and transgalactosylation with glyoxyl-agarose immobilized β-galactosidase from Aspergillus oryzae. Process Biochem. 2018, 73, 56–64. [Google Scholar] [CrossRef]
- Belitz, H.D.; Grosch, W.; Schieberle, P. Amino Acids, Peptides, Proteins. In Food Chemistry, 4th ed.; Springer: Berlin/Heidelberg, Germany, 2009; pp. 27–56. [Google Scholar]
- Majore, K.; Ciprovica, I. Bioconversion of lactose into glucose–galactose syrup by two-stage enzymatic hydrolysis. Foods 2022, 11, 400. [Google Scholar] [CrossRef]
- Žolnere, K.; Ciproviča, I.; Ķirse, A.; Cinkmanis, I. A study of commercial β-galactosidase stability under simulated in vitro gastric conditions. Agron. Res. 2018, 16, 1555–1562. [Google Scholar] [CrossRef]
- Srivastava, A.; Tripathi, R.; Verma, S.; Srivastava, N.; Rawat, A.K.S.; Deepak, D. A novel method for quantification of lactose in mammalian milk through HPTLC and determination by a mass spectrometric technique. Anal. Methods 2014, 6, 7268–7276. [Google Scholar] [CrossRef]
- Lee, C.H.; Kim, H.T.; Yun, E.J.; Lee, A.R.; Kim, S.R.; Kim, J.H.; Choi, I.G.; Kim, K.H. A novel agarolytic β-galactosidase acts on agaro-oligosaccharides for complete hydrolysis of agarose into monomers. Appl. Environ. Microbiol. 2014, 80, 5965–5973. [Google Scholar] [CrossRef] [PubMed]
- ISO 4121:2003; Sensory Analysis—Guidelines for the Use of Quantitative Response Scales. International Organization for Standardization: Geneva, Switzerland, 2003.
- Rodrigues, J.F.; Siman, I.B.; de Oliveira, L.E.A.; de Fátima Barcelos, A.; Oliveira, R.A.A.; Silva, R.; da Cruz, A.G. Use of diaries as a research strategy on sensory perception and consumer behavior of Canastra cheese. J. Sens. Stud. 2021, 36, e12627. [Google Scholar] [CrossRef]
- Fischer, C.; Kleinschmidt, T. Synthesis of galacto-oligosaccharides using sweet and acid whey as a substrate. Int. Dairy J. 2015, 48, 15–22. [Google Scholar] [CrossRef]
- Juajun, O.; Nguyen, T.-H.H.; Maischberger, T.; Iqbal, S.; Haltrich, D.; Yamabhai, M. Cloning, purification, and characterization of β-galactosidase from Bacillus licheniformis DSM 13. Appl. Microbiol. Biotechnol. 2011, 89, 645–654. [Google Scholar] [CrossRef]
- Xavier, J.R.; Ramana, K.V.; Sharma, R.K. β-Galactosidase: Biotechnological applications in food processing. J. Food Biochem. 2018, 42, e12564. [Google Scholar] [CrossRef]
- Demirhan, E.; Apar, D.K.; Ozbek, B. Product inhibition of whey lactose hydrolysis. Chem. Eng. Commun. 2007, 195, 293–304. [Google Scholar] [CrossRef]
- Popescu, L.; Bulgaru, V.; Siminiuc, R. Effect of temperature, Ph and amount of enzyme used in the lactose hydrolysis of milk. Food Sci. Nutr. 2021, 12, 1243–1254. [Google Scholar] [CrossRef]
- Botvynko, A.; Bednářová, A.; Henke, S.; Shakhno, N.; Čurda, L. Production of galacto-oligosaccharides using various combinations of the commercial β-galactosidases. Biochem. Biophys. Res. Commun. 2019, 517, 762–766. [Google Scholar] [CrossRef]
- Osmak, T.; Mleko, S.; Bass, O.; Mykhalevych, A.; Kuzmyk, U. Enzymatic hydrolysis of lactose in concentrates of reconstituted demineralized whey, intended for ice cream production. Ukr. Food J. 2021, 10, 277–288. [Google Scholar] [CrossRef]
- Vidya, B.; Palaniswamy, M.; Gopalakrishnan, V.K. Screening and optimization of β-galactosidase from fungal strains by using agro residues. World J. Pharm. Sci. 2014, 3, 1809–1821. [Google Scholar]
- Bozanic, R.; Barukcic, I.; Lisak, K.; Jakopovic, T.L. Possibilities of whey utilisation. Austin J. Nutr. Food Sci. 2014, 2, 1036–1042. [Google Scholar]
- Kumar, A.; Kathuria, D.; Sharma, S.K.; Kumar, S. Optimizing process to prepare lactose hydrolysed milk by enzymatic treatment. J. Hill Agric. 2018, 3, 361–369. [Google Scholar] [CrossRef]
- Pawlos, M.; Znamirowska, A.; Kluz, M.; Szajnar, K.; Kowalczyk, M. Low-lactose fermented goat milks with Bifidobacterium animalis ssp. lactis Bb-12. J. Microbiol. Biotechnol. Food Sci. 2021, 9, 751–755. [Google Scholar] [CrossRef]
- Li, X.E.; Lopetcharat, K.; Qiu, Y.; Drake, M.A. Sugar reduction of skim chocolate milk and viability of alternative sweetening through lactose hydrolysis. J. Dairy Sci. 2015, 98, 1455–1466. [Google Scholar] [CrossRef]
- Merkel, A.; Voropaeva, D.; Ondrušek, M. The impact of integrated nanofiltration and electrodialytic processes on the chemical composition of sweet and acid whey streams. J. Food Eng. 2021, 298, 110500. [Google Scholar] [CrossRef]
- Wen, X.; Chen, A.; Wu, Y.; Yang, Y.; Xu, Y.; Xia, W.; Chen, S. Comparative evaluation of proximate compositions and taste attributes of three Asian hard clams (Meretrix meretrix) with different shell colors. Int. J. Food Prop. 2020, 23, 400–411. [Google Scholar] [CrossRef]
- Choi, J.Y.; Hong, H.; Seo, H.; Pan, J.G.; Kim, E.J.; Maeng, P.J.; Yang, T.H.; Kim, K.J. High galacto-oligosaccharide production and a structural model for transgalactosylation of β-galactosidase ii from Bacillus circulans. J. Agric. Food Chem. 2020, 68, 13806–13814. [Google Scholar] [CrossRef] [PubMed]
- Van De Voorde, I.; Goiris, K.; Syryn, E.; Van den Bussche, C.; Aerts, G. Evaluation of the cold-active Pseudoalteromonas haloplanktis β-galactosidase enzyme for lactose hydrolysis in whey permeate as primary step of d-tagatose production. Process Biochem. 2014, 49, 2134–2140. [Google Scholar] [CrossRef]
- Cieśliński, H.; Wanarska, M.; Pawlak-Szukalska, A.; Krajewska, E.; Wicka, M.; Kur, J. Cold-active β-galactosidases: Sources, biochemical properties and their biotechnological potential. In Biotechnology of Extremophiles, 1st ed.; Rampelotto, P.H., Ed.; Springer: Cham, Switzerland, 2016; Volume 1, pp. 445–469. [Google Scholar] [CrossRef]
- Frankowski, K.M.; Miracle, R.E.; Drake, M.A. The role of sodium in the salty taste of permeate. J. Dairy Sci. 2014, 97, 5356–5370. [Google Scholar] [CrossRef]
- Kravtsov, V.; Kulikova, I.; Mikhaylin, S.; Bazinet, L. Alkalinization of acid whey by means of electrodialysis with bipolar membranes and analysis of induced membrane fouling. J. Food Eng. 2020, 277, 109891. [Google Scholar] [CrossRef]
- Onwulata, C.I.; Isobe, S.; Tomasula, P.M.; Cooke, P.H. Properties of whey protein isolates extruded under acidic and alkaline conditions. J. Dairy Sci. 2006, 89, 71–81. [Google Scholar] [CrossRef] [PubMed]
- Luzzi, G.; Steffens, M.; Clawin-Rädecker, I.; Hoffmann, W.; Franz, C.M.; Fritsche, J.; Lorenzen, P.C. Enhancing the sweetening power of lactose by enzymatic modification in the reformulation of dairy products. Int. J. Dairy Tech. 2020, 73, 502–512. [Google Scholar] [CrossRef]
- Majore, K.; Ciproviča, I. Optimisation of lactose hydrolysis by combining solids and ß-galactosidase concentrations in whey permeates. Proc. Latv. Acad. Sci. Sect. B Nat. Exact Appl. Sci. 2020, 74, 263–269. [Google Scholar] [CrossRef]
- Lorenzen, P.C.; Breiter, J.; Clawin-Rädecker, I.; Dau, A. A novel bi-enzymatic system for lactose conversion. Int. J. Food Sci. 2013, 48, 1396–1403. [Google Scholar] [CrossRef]
- Araya, E.; Urrutia, P.; Romero, O.; Illanes, A.; Wilson, L. Design of combined crosslinked enzyme aggregates (combi-CLEAs) of β-galactosidase and glucose isomerase for the one-pot production of fructose syrup from lactose. Food Chem. 2019, 288, 102–107. [Google Scholar] [CrossRef] [PubMed]
- Cervantes, F.V.; Neifar, S.; Merdzo, Z.; Viña-Gonzalez, J.; Fernandez-Arrojo, L.; Ballesteros, A.O.; Fernandez-Lobato, M.; Bejar, S.; Plou, F.J. A three-step process for the bioconversion of whey permeate into a glucose D-free tagatose syrup. Catalysts 2020, 10, 647. [Google Scholar] [CrossRef]
- Cheng, S.; Hummel, M.; Dahal, B.; Gu, Z.; Kharel, P.; Martínez-Monteagudo, S.I. A two-step process for the synthesis of sweetening syrup from aqueous lactose. LWT 2020, 117, 108659. [Google Scholar] [CrossRef]


Disclaimer/Publisher’s Note: The statements, opinions and data contained in all publications are solely those of the individual author(s) and contributor(s) and not of MDPI and/or the editor(s). MDPI and/or the editor(s) disclaim responsibility for any injury to people or property resulting from any ideas, methods, instructions or products referred to in the content. |
© 2023 by the authors. Licensee MDPI, Basel, Switzerland. This article is an open access article distributed under the terms and conditions of the Creative Commons Attribution (CC BY) license (https://creativecommons.org/licenses/by/4.0/).