
A Comparison of Three Artificial Rumen Systems for Rumen Microbiome Modeling

 , ,
, ,
Abstract
1. Introduction
2. Materials and Methods
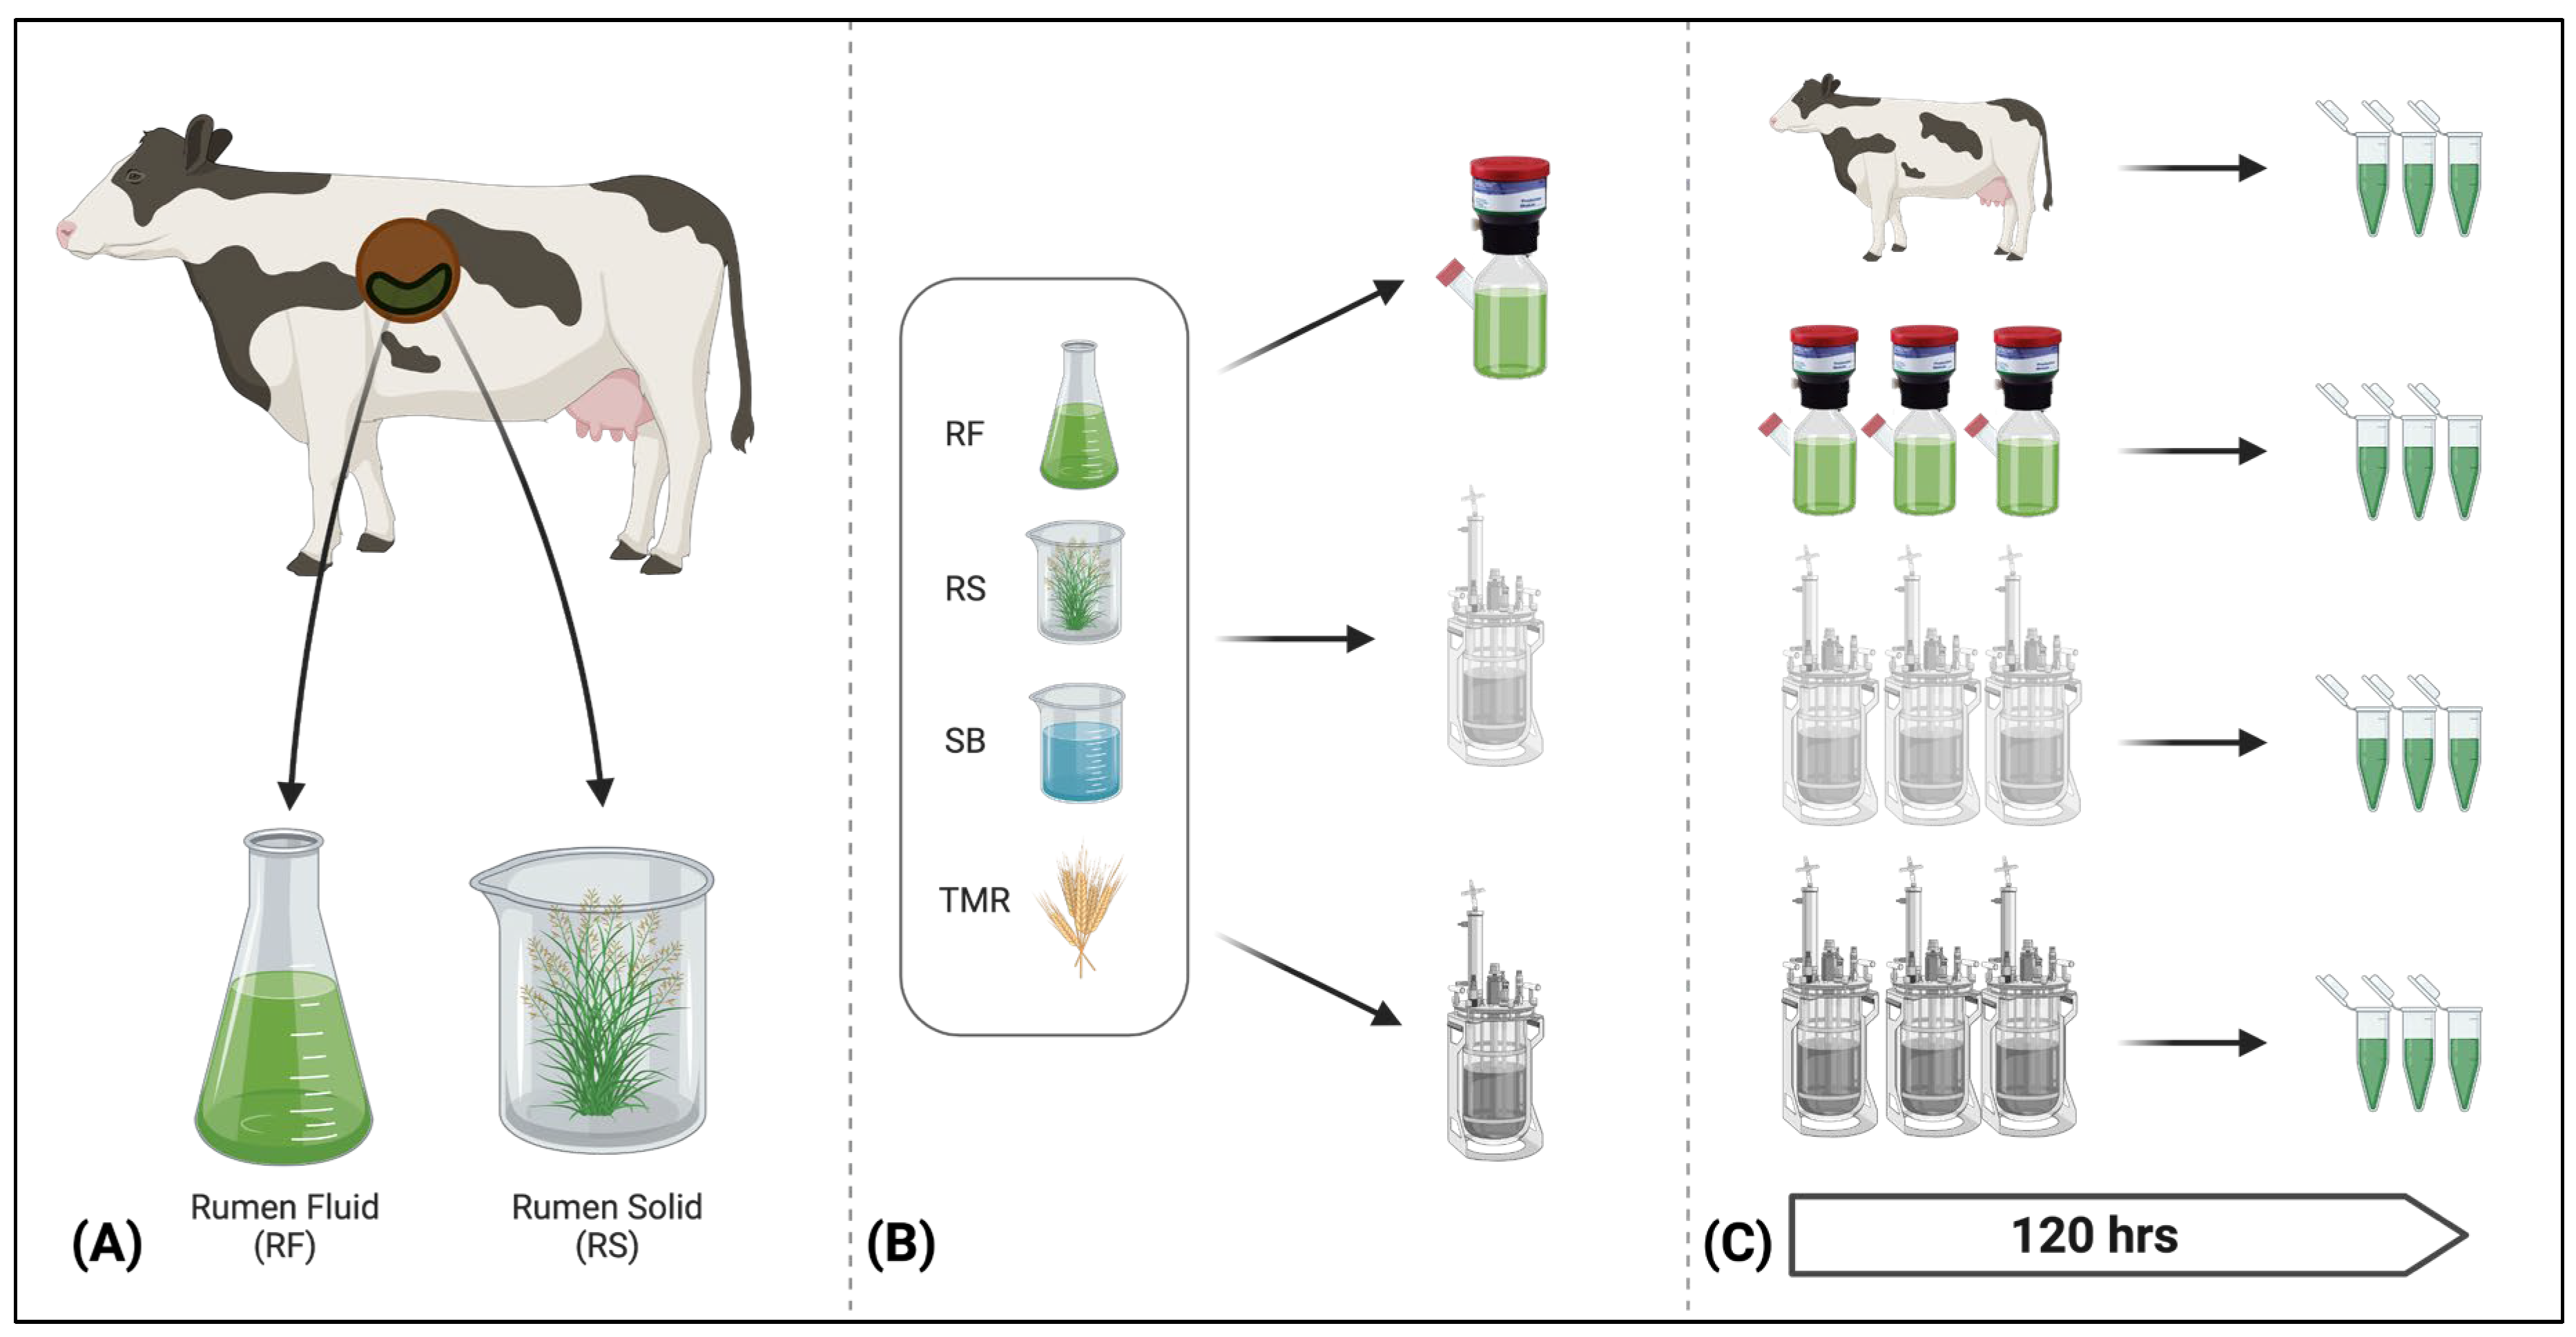
2.1. Rumen Fluid Collection
2.2. Feed Collection and Preparation
2.3. In Vitro Rumen Systems
2.4. Experimental Design
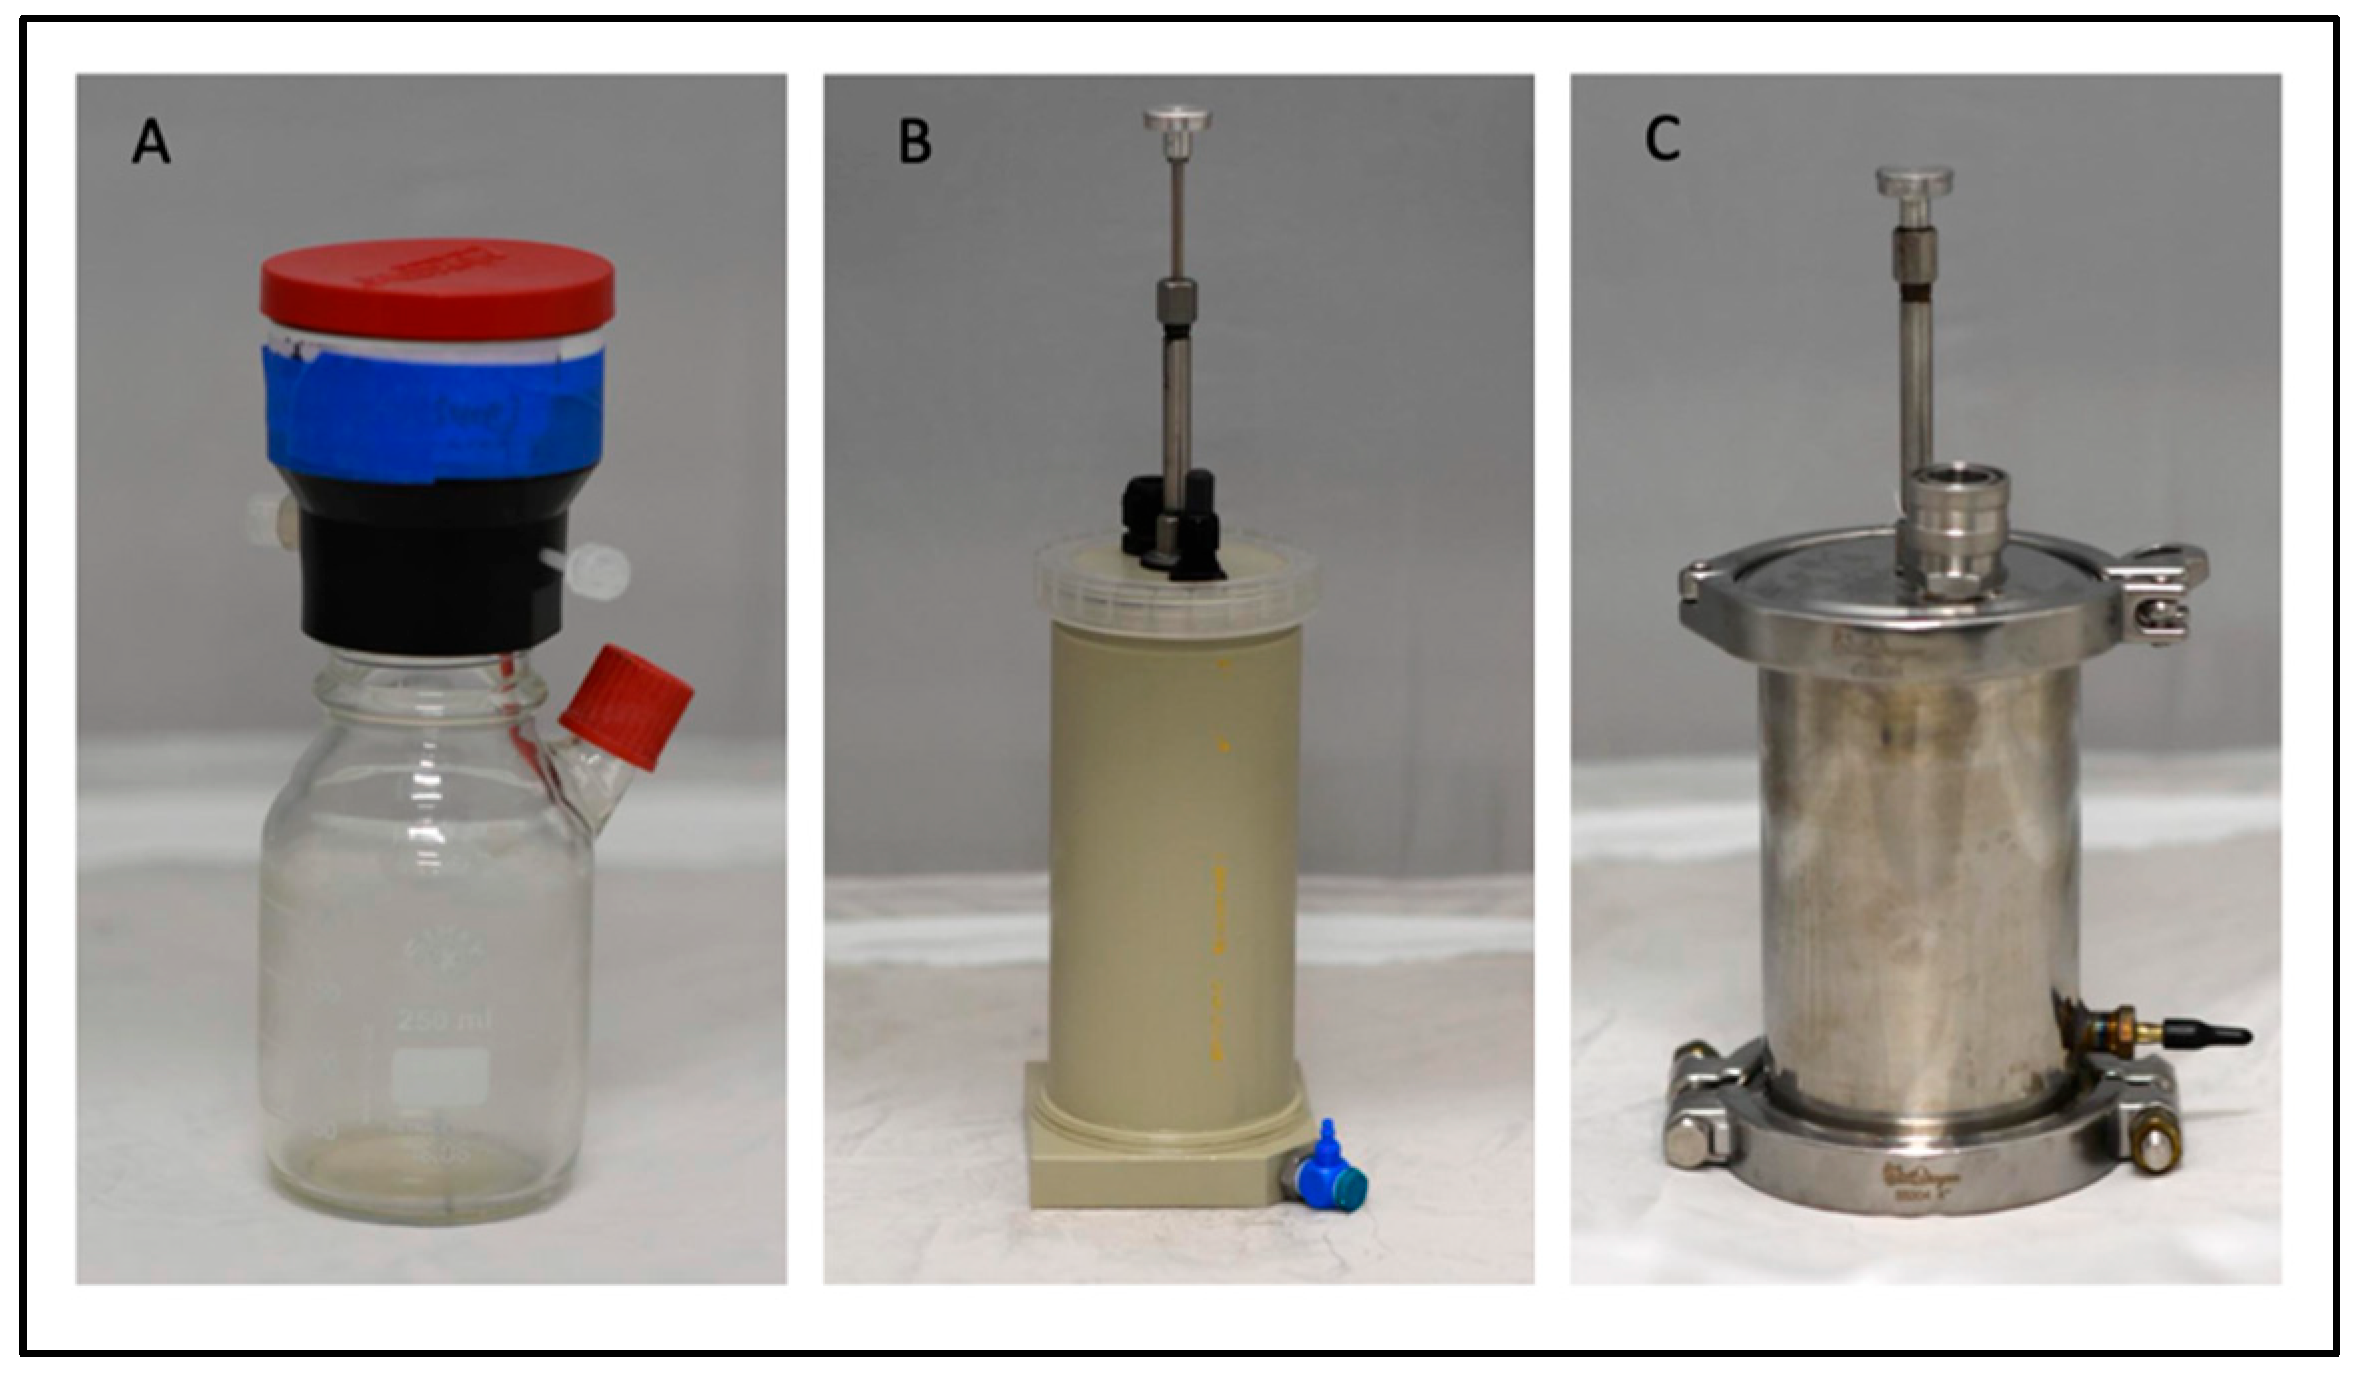
2.5. Ankom Gas Production System
2.6. RUSITEC, Polypropylene (PP) Vessels
2.7. RUSITEC Prime, Stainless Steel Vessels
2.8. Sample Collection
2.9. Volatile Fatty Acid and Greenhouse Gas Analysis
2.10. Statistics
2.11. DNA Extractions
2.12. PCR Amplification, Library Preparation, and Sequencing
2.13. Microbiome Analysis
3. Results
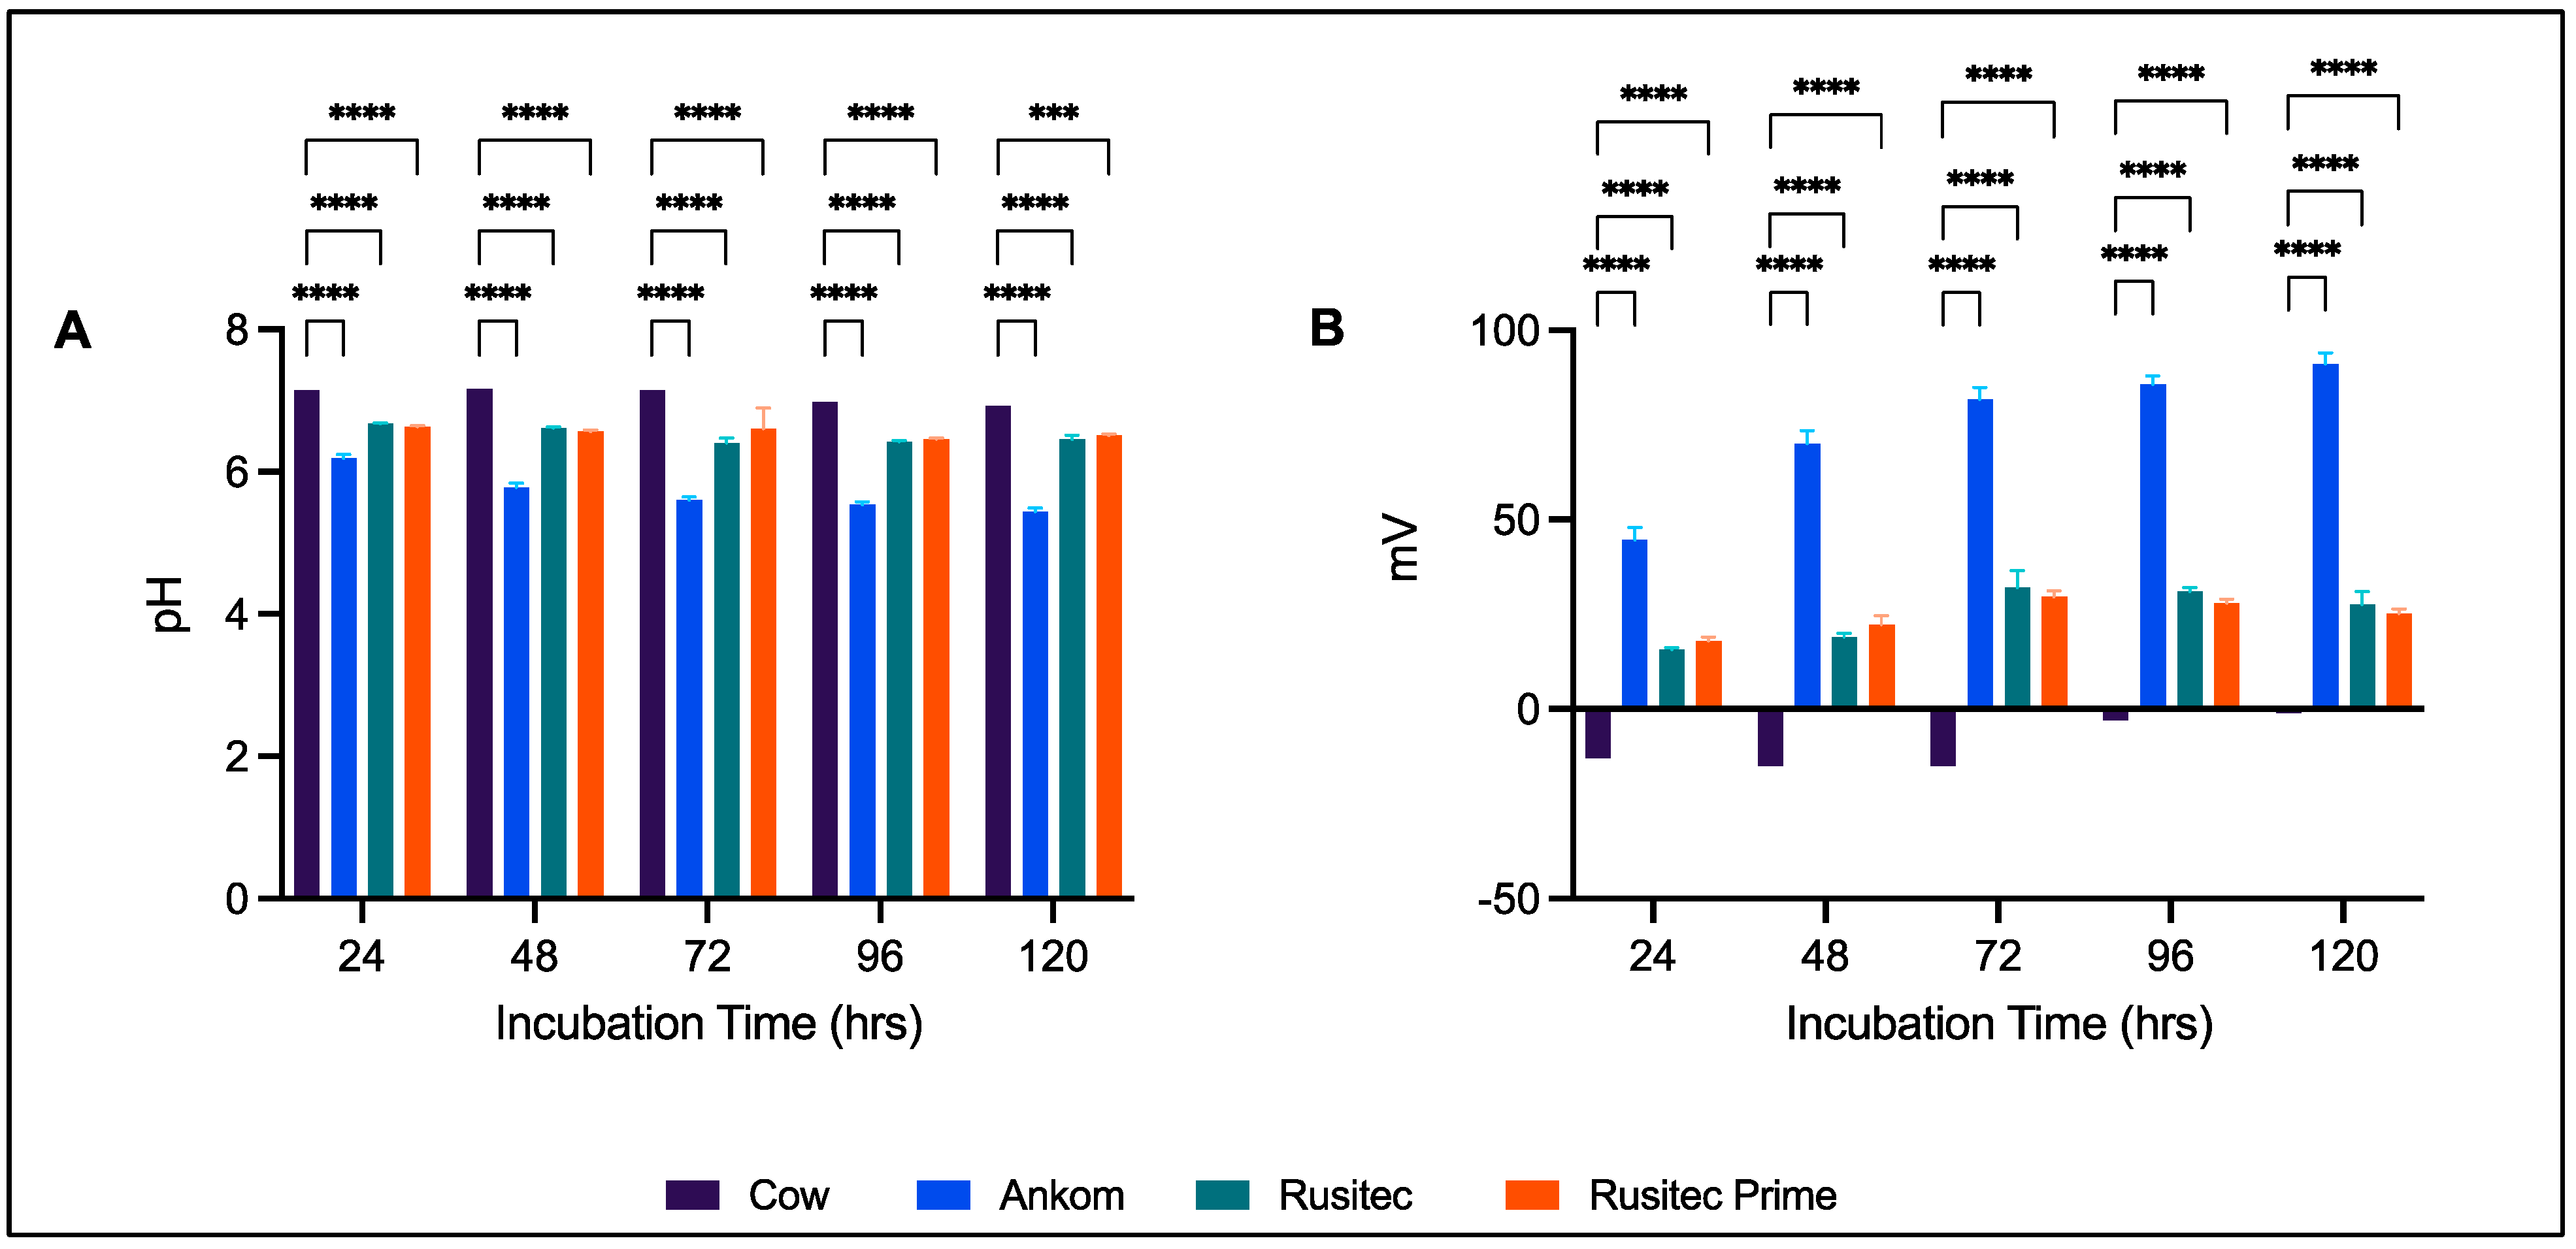
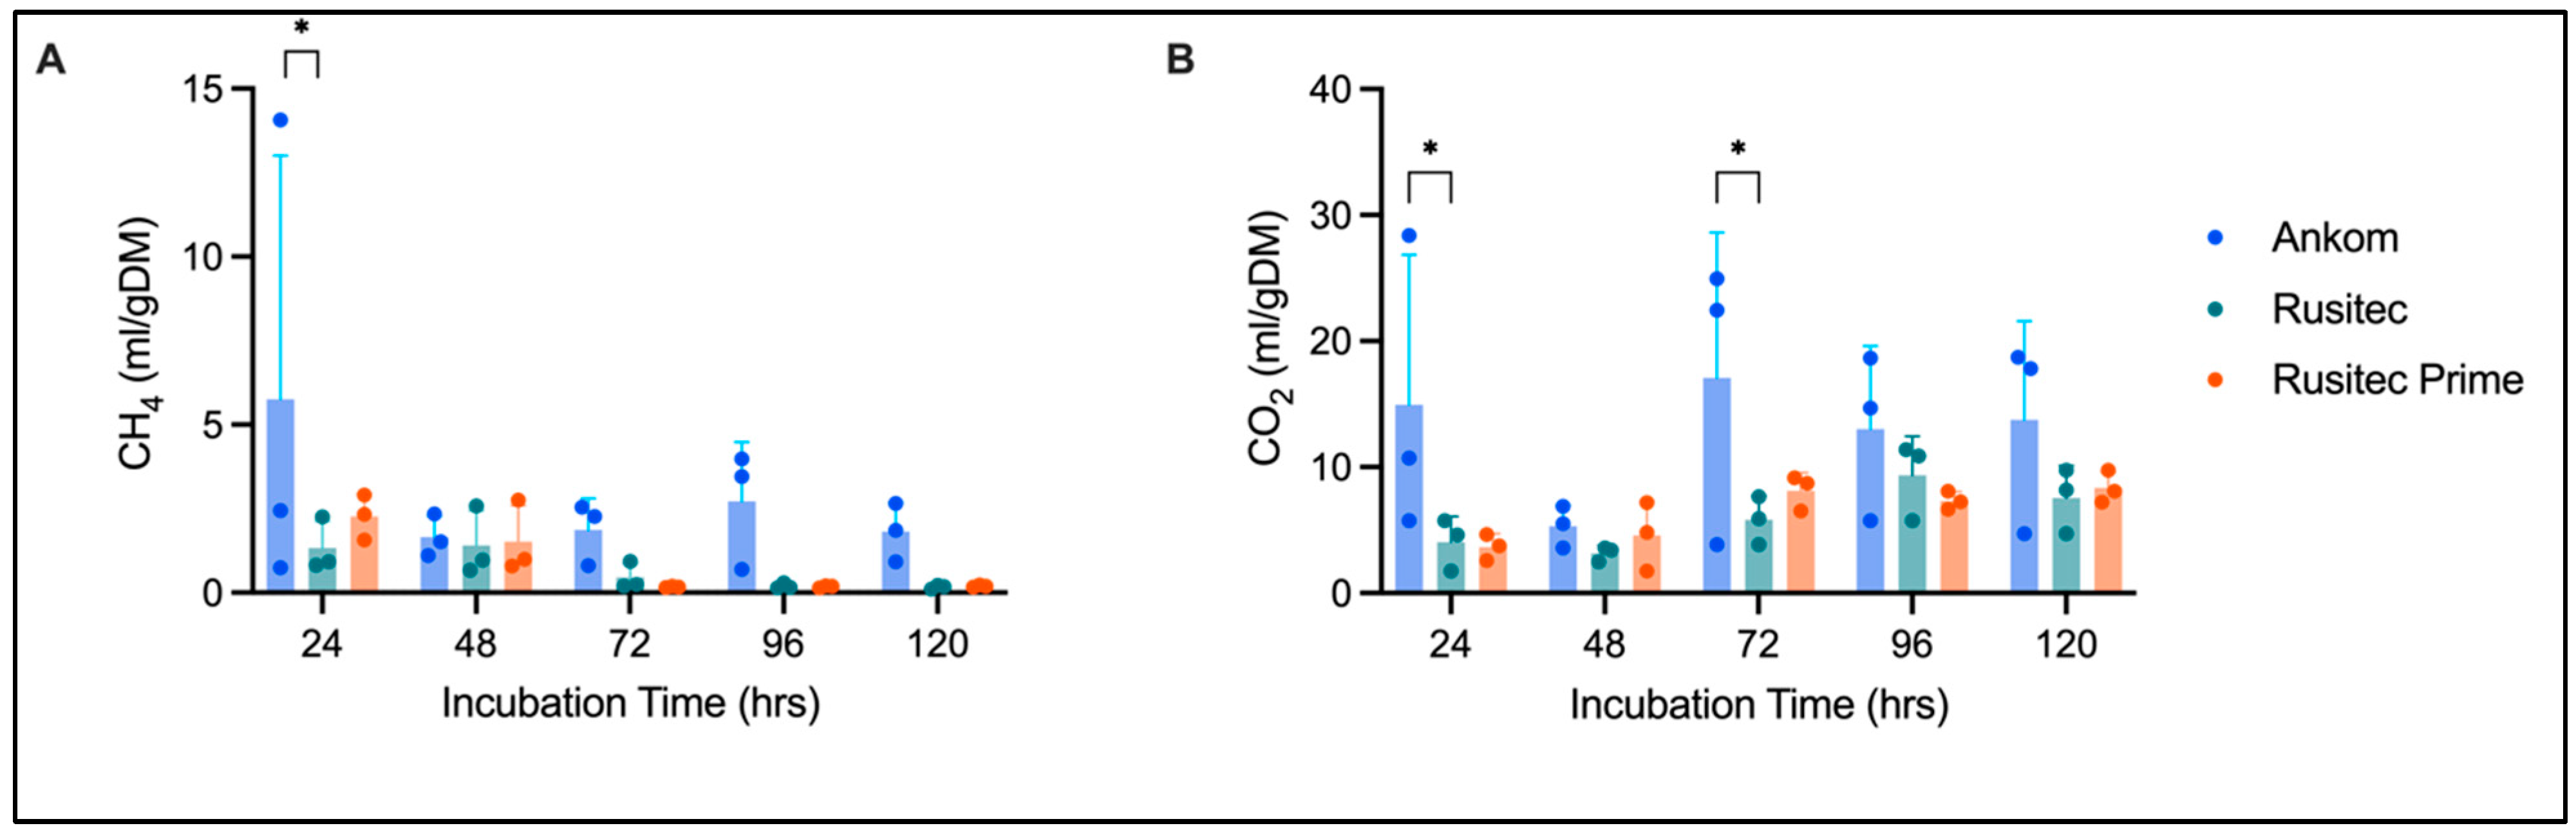
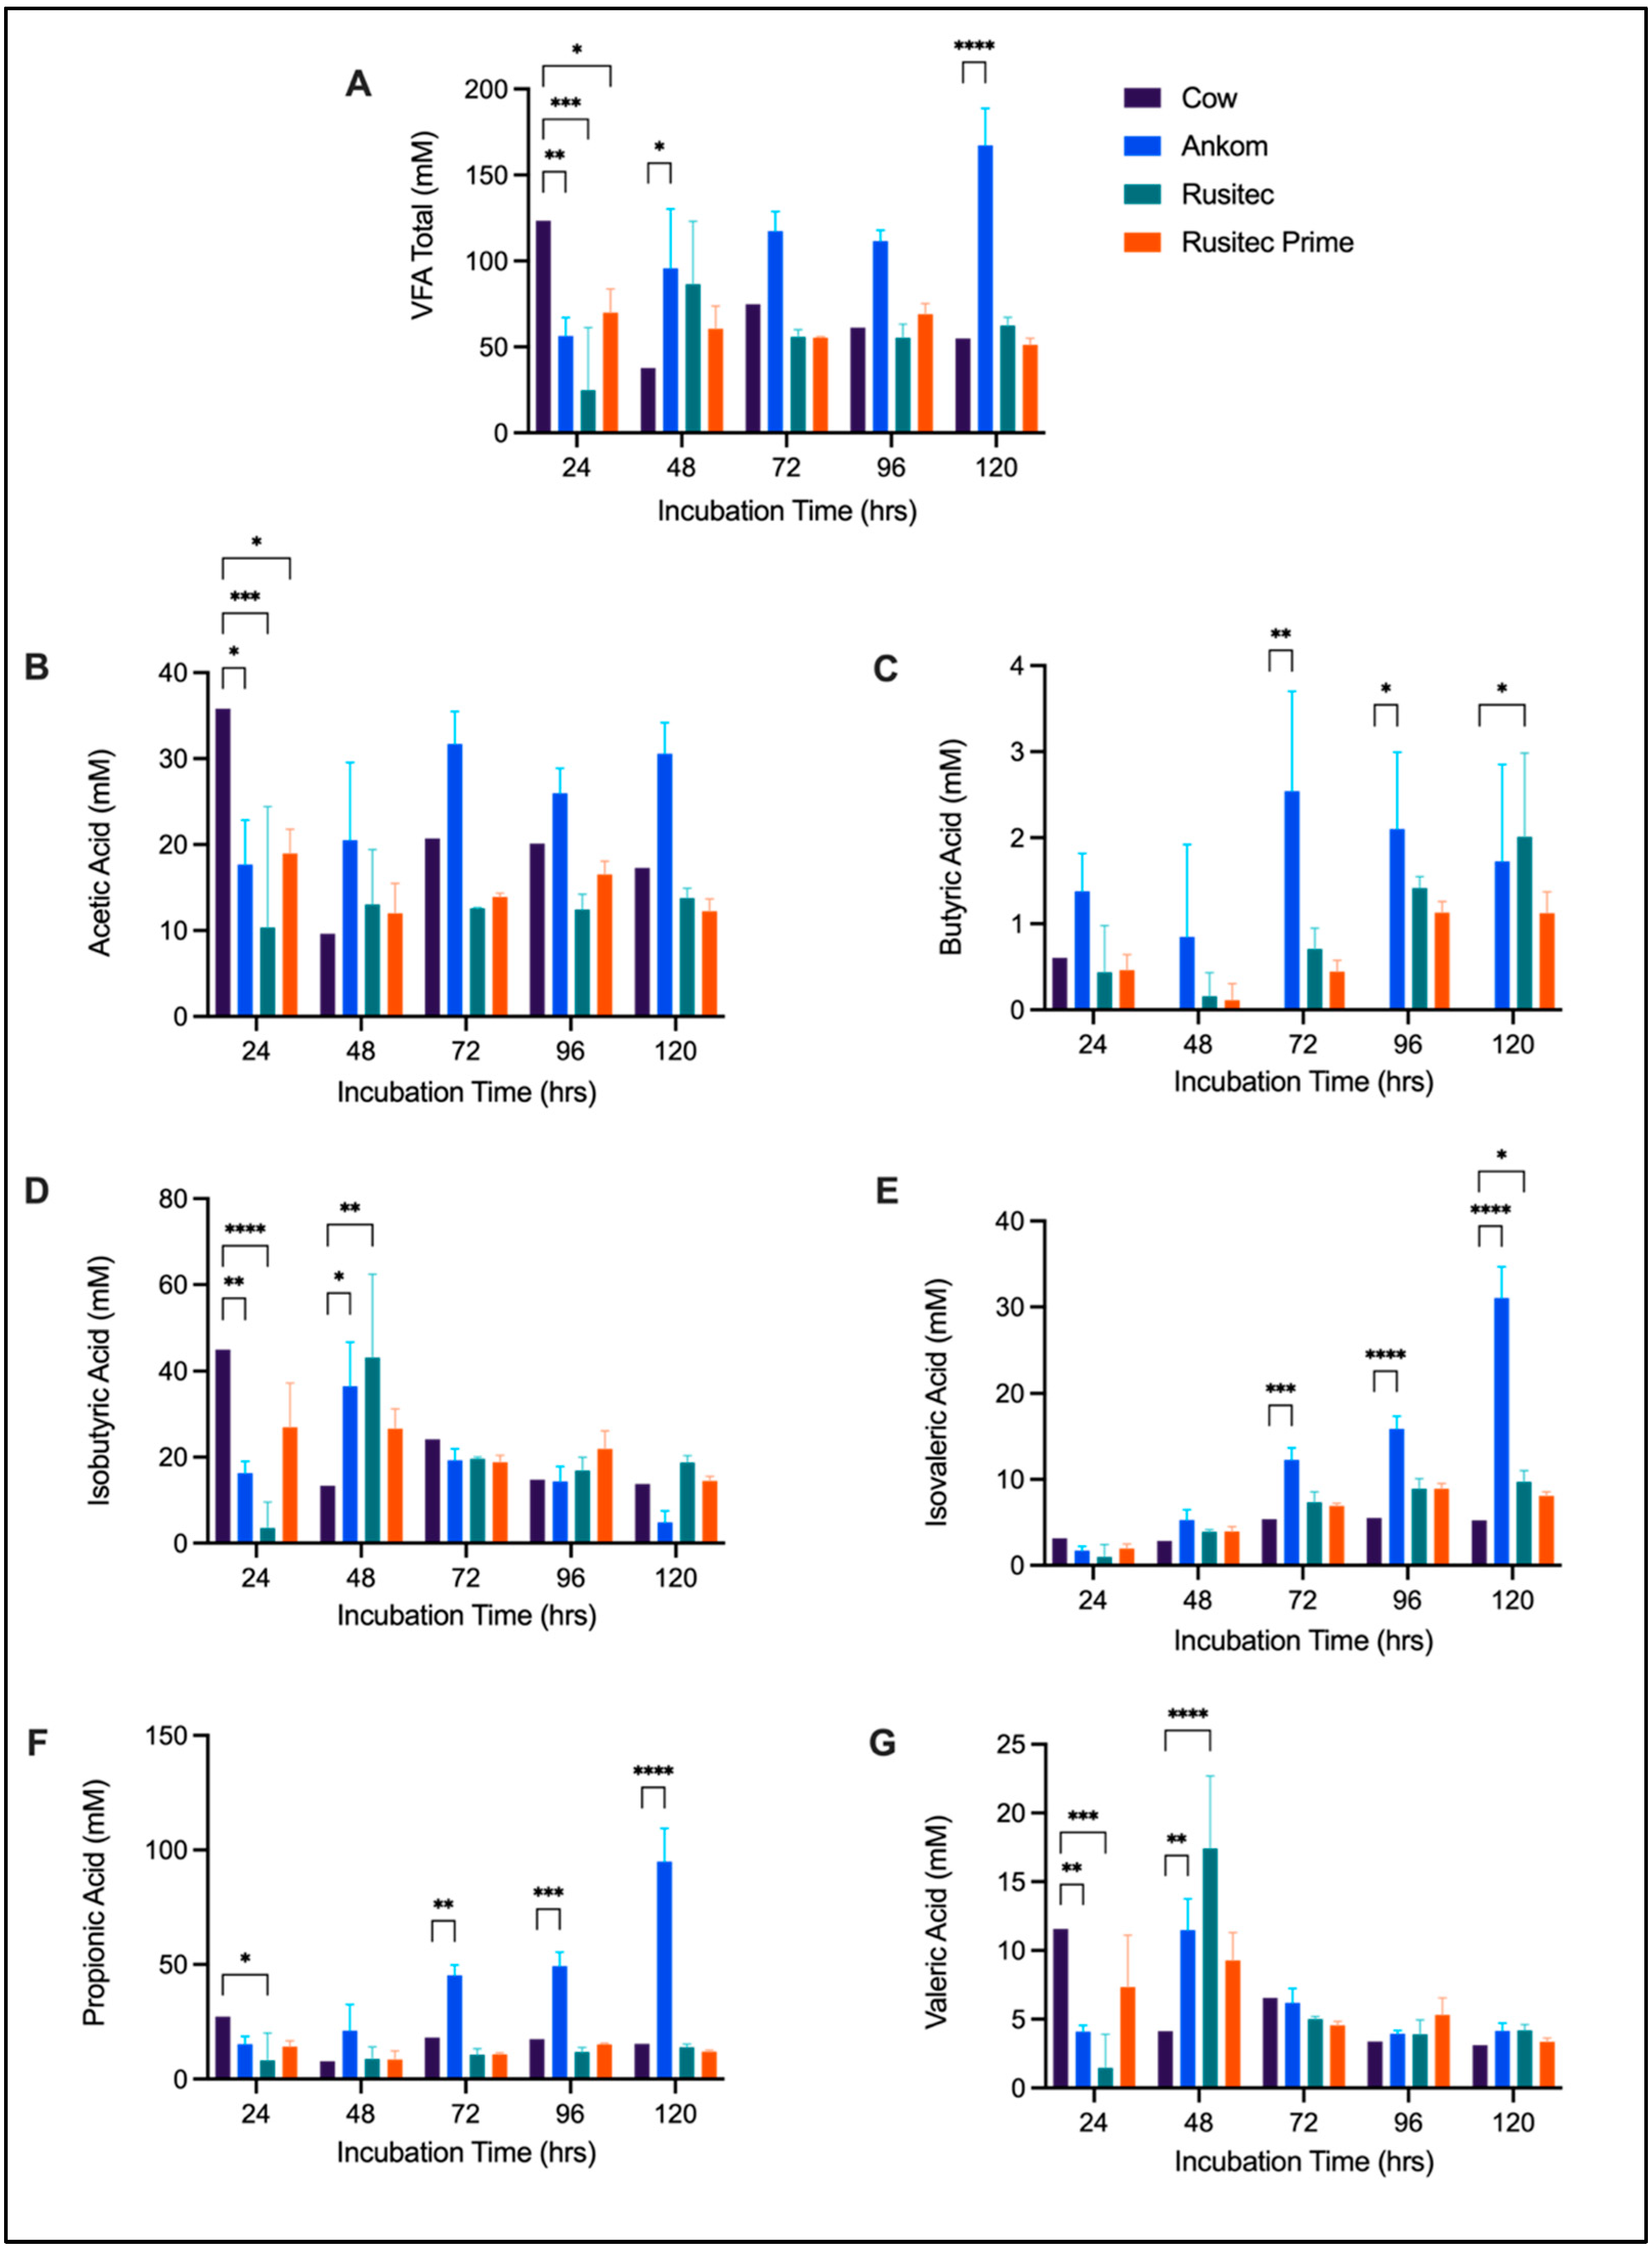
3.1. Gas Production
3.2. VFA Comparison
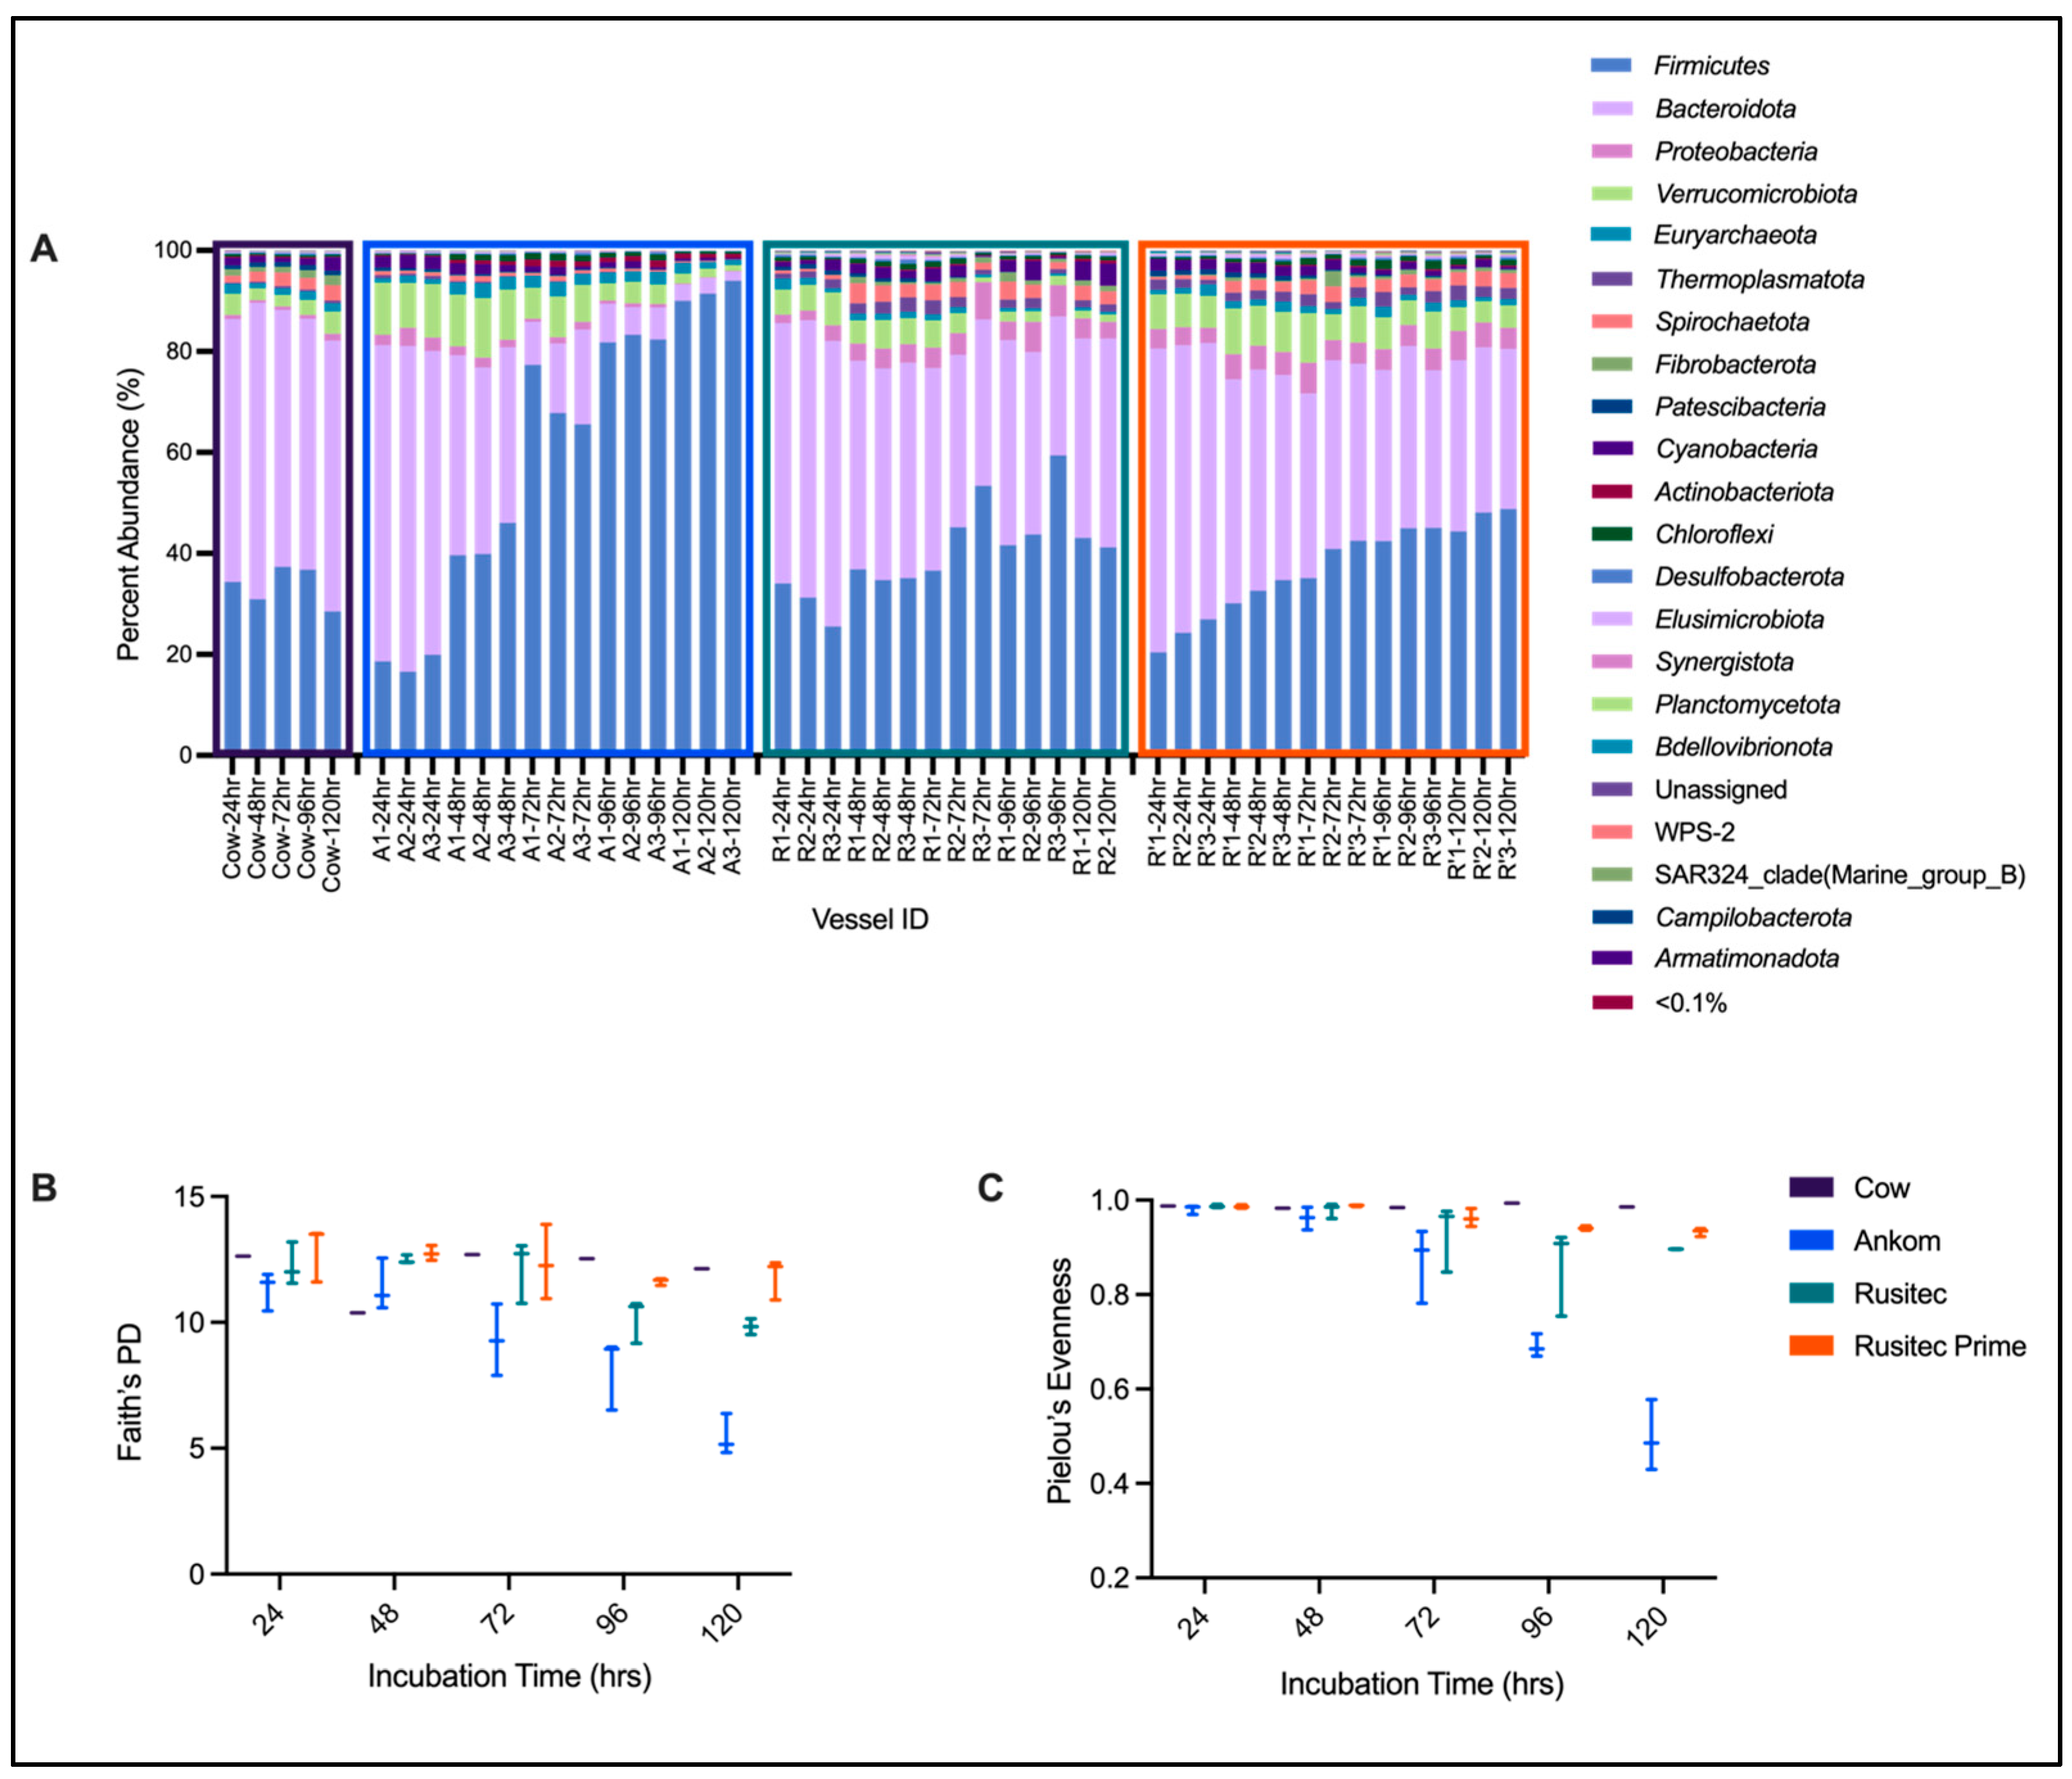
3.3. 16S rRNA Gene Sequencing Results
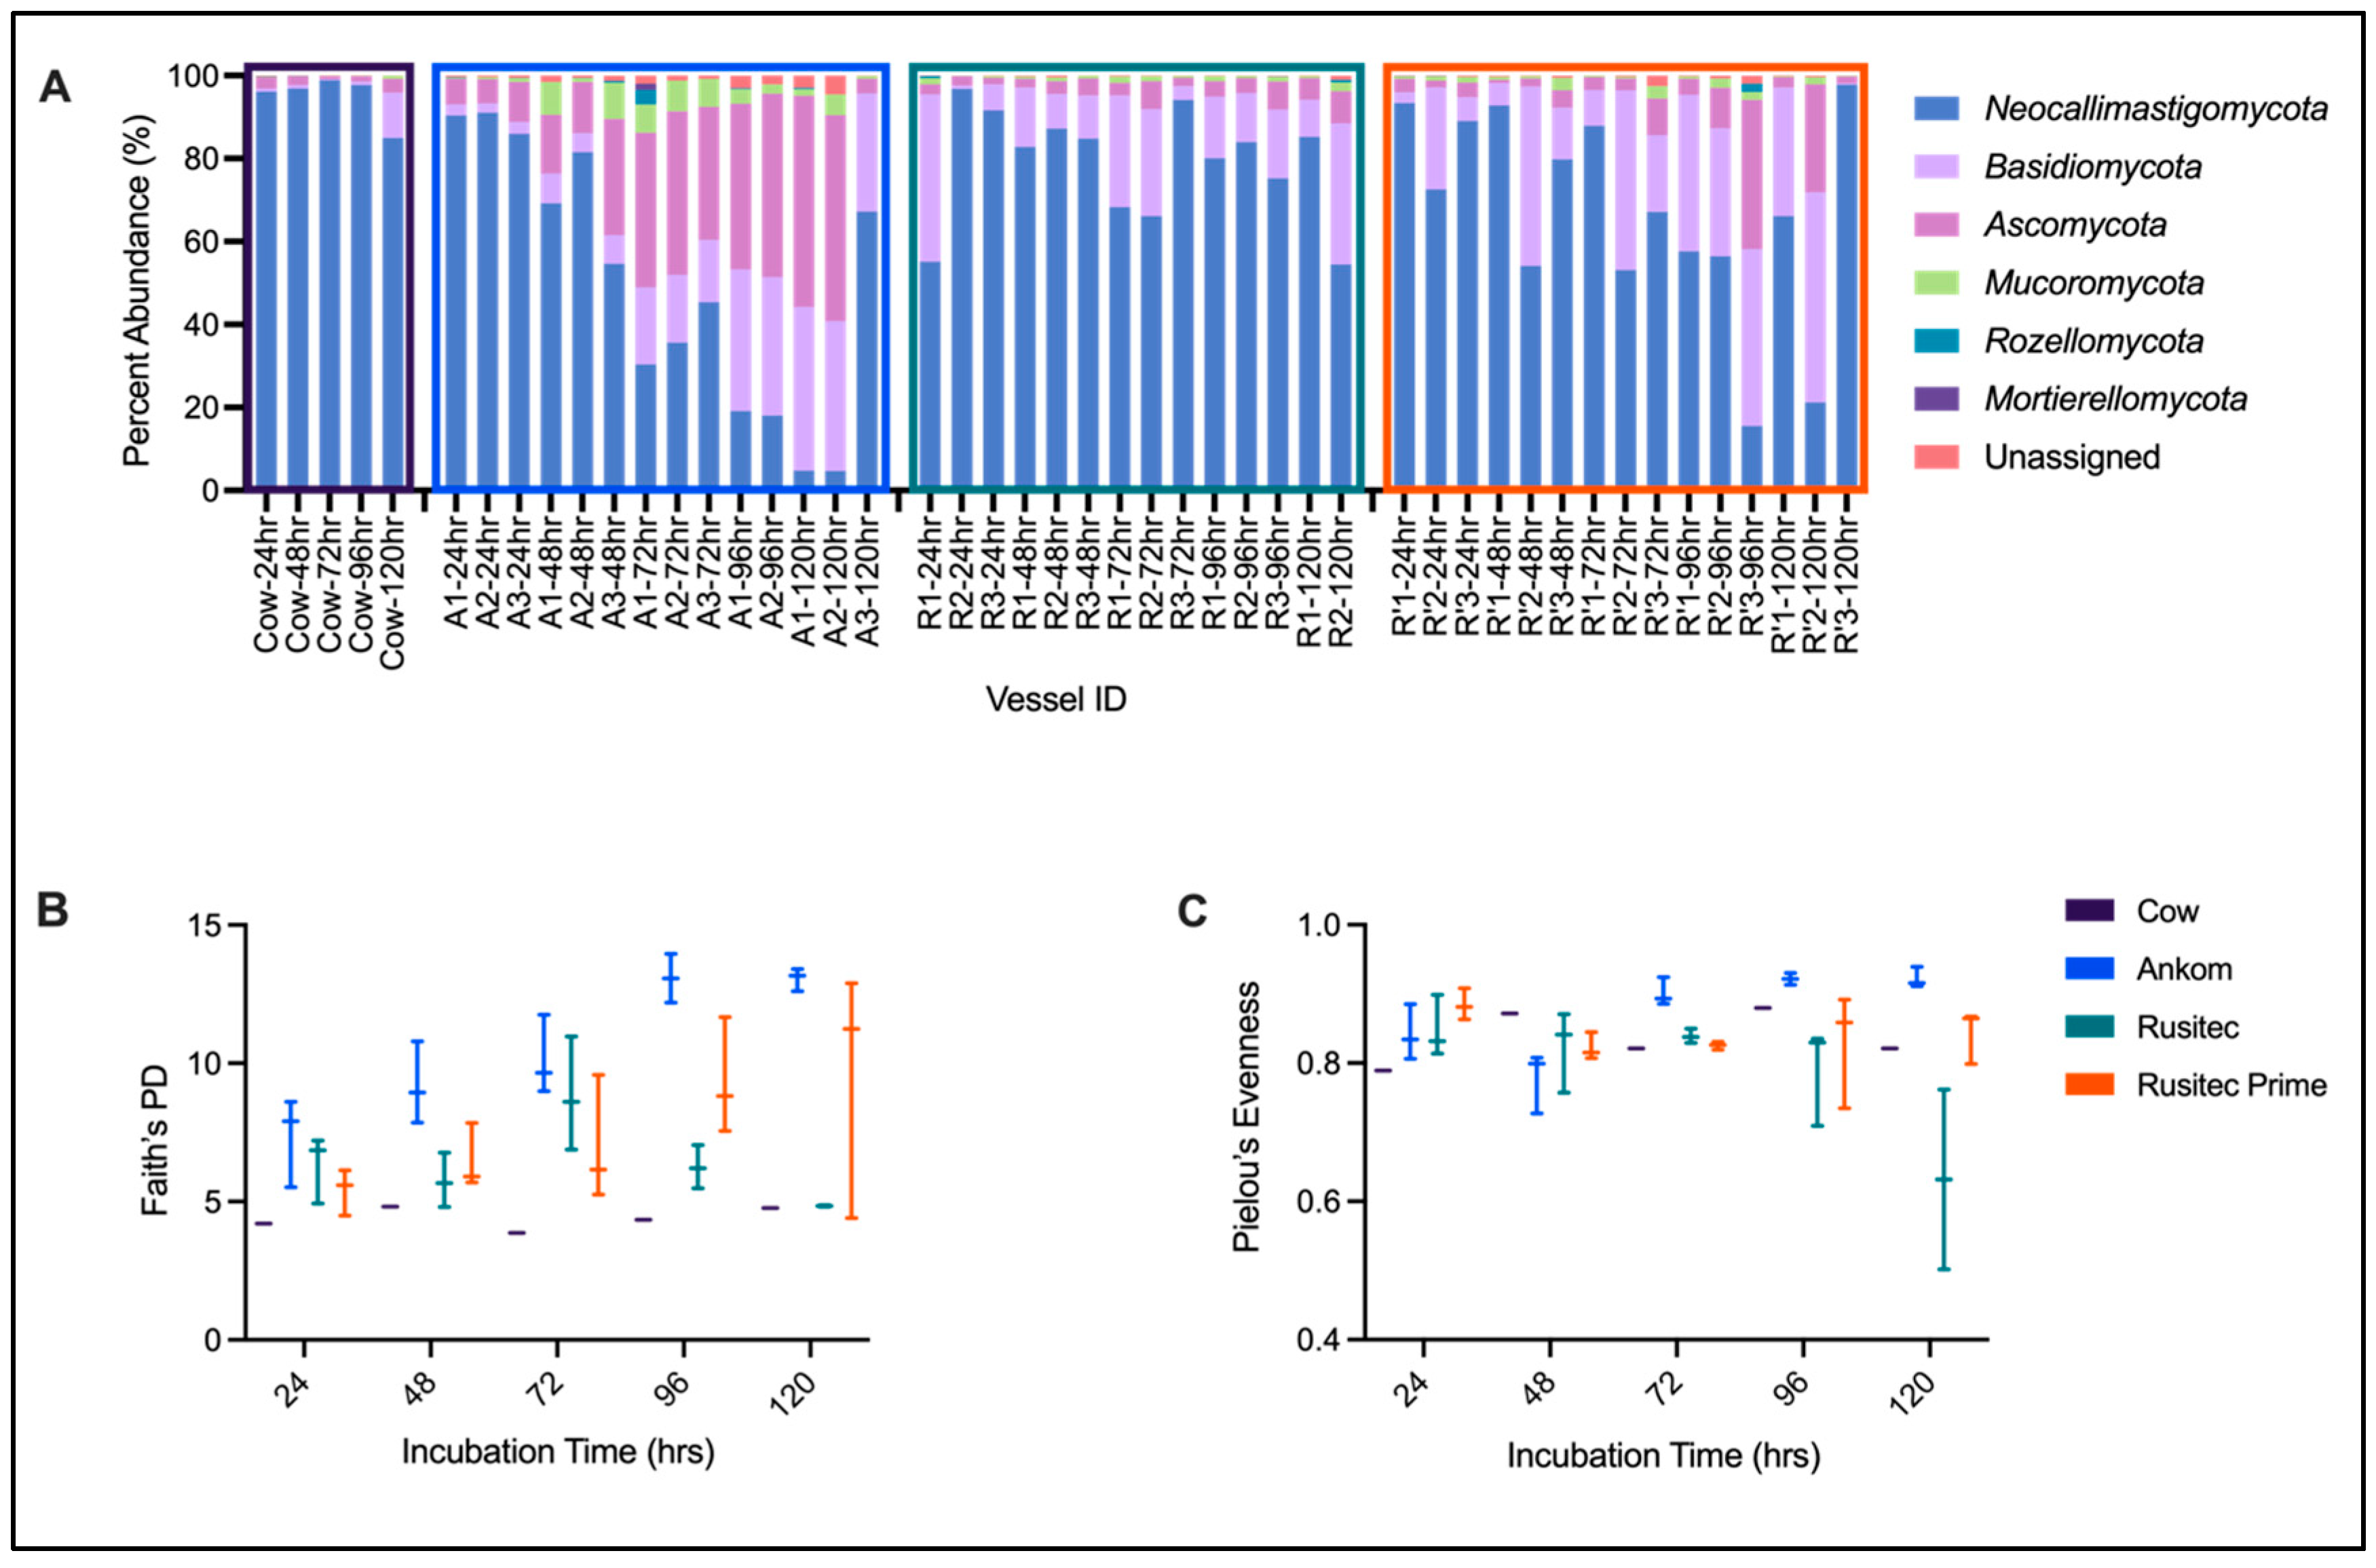
3.4. ITS Sequencing Results
4. Discussion
4.1. In Vitro Rumen Modeling
4.2. Platform Comparison
4.3. Selecting Semi-Continuous Modeling Platforms
4.4. Primed for Rumen Modeling
5. Conclusions
Supplementary Materials
Author Contributions
Funding
Institutional Review Board Statement
Data Availability Statement
Acknowledgments
Conflicts of Interest
References
- Wang, T.; Jin, H.; Kreuter, U.; Teague, R. Expanding grass-based agriculture on marginal land in the U.S. Great Plains: The role of management intensive grazing. Land Use Policy 2021, 104, 105155. [Google Scholar] [CrossRef]
- Huntsinger, L.; Barry, S. Grazing in California’s Mediterranean Multi-Firescapes. Front. Sustain. Food Syst. 2021, 5, 715366. [Google Scholar] [CrossRef]
- Gennet, S.; Spotswood, E.; Hammond, M.; Bartolome, J.W. Livestock grazing supports native plants and songbirds in a California annual grassland. PLoS ONE 2017, 12, e0176367. [Google Scholar] [CrossRef]
- Oltjen, J.W.; Beckett, J.L. Role of ruminant livestock in sustainable agricultural systems. J. Anim. Sci. 1996, 74, 1406–1409. [Google Scholar] [CrossRef] [PubMed]
- Barral-Martinez, M.; Fraga-Corral, M.; Garcia-Perez, P.; Simal-Gandara, J.; Prieto, M.A. Almond By-Products: Valorization for Sustainability and Competitiveness of the Industry. Food 2021, 10, 1793. [Google Scholar] [CrossRef]
- Klop, G.; Schuppen, S.v.L.-V.; Pellikaan, W.F.; Hendriks, W.H.; Bannink, A.; Dijkstra, J. Changes in in vitro gas and methane production from rumen fluid from dairy cows during adaptation to feed additives in vivo. Animal 2017, 11, 591–599. [Google Scholar] [CrossRef]
- Wang, Y.; Janssen, P.H.; Lynch, T.A.; van Brunt, B.; Pacheco, D. A mechanistic model of hydrogen-methanogen dynamics in the rumen. J. Theor. Biol. 2016, 393, 75–81. [Google Scholar] [CrossRef]
- Greening, C.; Geier, R.; Wang, C.; Woods, L.C.; Morales, S.E.; McDonald, M.J.; Rushton-Green, R.; Morgan, X.C.; Koike, S.; Leahy, S.C.; et al. Diverse hydrogen production and consumption pathways influence methane production in ruminants. ISME J. 2019, 13, 2617–2632. [Google Scholar] [CrossRef]
- Pachauri, R.K.; Allen, M.R.; Barros, V.R.; Broome, J.; Cramer, W.; Christ, R.; Church, J.A.; Clarke, L.; Dahe, Q.; Dasgupta, P.; et al. Climate Change 2014: Synthesis Report. In Contribution of Working Groups I, II and III to the Fifth Assessment Report of the Intergovernmental Panel on Climate Change; Pachauri, L.M.R., Ed.; IPCC: Geneva, Switzerland, 2014; p. 151. [Google Scholar]
- Lan, W.; Yang, C. Ruminal methane production: Associated microorganisms and the potential of applying hydrogen-utilizing bacteria for mitigation. Sci. Total Environ. 2019, 654, 1270–1283. [Google Scholar] [CrossRef]
- Brooke, C.G.; Roque, B.M.; Shaw, C.; Najafi, N.; Gonzalez, M.; Pfefferlen, A.; De Anda, V.; Ginsburg, D.W.; Harden, M.C.; Nuzhdin, S.V.; et al. Methane Reduction Potential of Two Pacific Coast Macroalgae During in vitro Ruminant Fermentation. Front. Mar. Sci. 2020, 7, 561. [Google Scholar] [CrossRef]
- Roque, B.M.; Brooke, C.G.; Ladau, J.; Polley, T.; Marsh, L.J.; Najafi, N.; Pandey, P.; Singh, L.; Kinley, R.; Salwen, J.K.; et al. Effect of the macroalgae Asparagopsis taxiformis on methane production and rumen microbiome assemblage. Anim. Microbiome 2019, 1, 3. [Google Scholar]
- Calsamiglia, S.; Busquet, M.; Cardozo, P.; Castillejos, L.; Ferret, A. Invited review: Essential oils as modifiers of rumen microbial fermentation. J. Dairy Sci. 2007, 90, 2580–2595. [Google Scholar] [CrossRef] [PubMed]
- Durmic, Z.; Busquet, M.; Cardozo, P.; Castillejos, L.; Ferret, A. In vitro screening of selected feed additives, plant essential oils and plant extracts for rumen methane mitigation. J. Sci. Food Agric. 2014, 94, 1191–1196. [Google Scholar] [CrossRef] [PubMed]
- Fouts, J.Q.; Honan, M.C.; Roque, B.M.; Tricarico, J.M.; Krebab, E. Board Invited Review: Enteric methane mitigation interventions. Transl. Anim. Sci. 2022, 6, txac041. [Google Scholar] [CrossRef]
- Wetzels, S.U.; Eger, M.; Burmester, M.; Kreienbrock, L.; Abdulmawjood, A.; Pinior, B.; Wagner, M.; Breves, G.; Mann, E. The application of rumen simulation technique (RUSITEC) for studying dynamics of the bacterial community and metabolome in rumen fluid and the effects of a challenge with Clostridium perfringens. PLoS ONE 2018, 13, e0192256. [Google Scholar] [CrossRef] [PubMed]
- Garcia-Rodriguez, J.; Saro, C.; Mateos, I.; González, J.S.; Carro, M.D.; Ranilla, M.J. Effects of Replacing Extruded Maize by Dried Citrus Pulp in a Mixed Diet on Ruminal Fermentation, Methane Production, and Microbial Populations in Rusitec Fermenters. Animals 2020, 10, 1316. [Google Scholar] [CrossRef]
- Min, B.R.; Castleberry, L.; Allen, H.; Parker, D.; Waldrip, H.; Brauer, D.; Willis, W. Associative effects of wet distiller’s grains plus solubles and tannin-rich peanut skin supplementation on in vitro rumen fermentation, greenhouse gas emissions, and microbial changes. J. Anim. Sci. 2019, 97, 4668–4681. [Google Scholar] [CrossRef]
- Czerkawski, J.W.; Breckenridge, G. Design and development of a long-term rumen simulation technique (Rusitec). Br. J. Nutr. 1977, 38, 371–384. [Google Scholar] [CrossRef]
- Belanche, A.; Palma-Hidalgo, J.M.; Nejjam, I.; Serrano, R.; Jiménez, E.; Martín-García, I.; Yáñez-Ruiz, D.R. In vitro assessment of the factors that determine the activity of the rumen microbiota for further applications as inoculum. J. Sci. Food Agric. 2019, 99, 163–172. [Google Scholar] [CrossRef]
- Metzler-Zebeli, B.U.; Scherr, C.; Sallaku, E.; Drochner, W.; Zebeli, Q. Evaluation of associative effects of total mixed ration for dairy cattle using in vitro gas production and different rumen inocula. J. Sci. Food Agric. 2012, 92, 2479–2485. [Google Scholar] [CrossRef]
- Vinyard, J.R.; Faciola, A.P. Unraveling the pros and cons of various in vitro methodologies for ruminant nutrition: A review. Transl. Anim. Sci. 2022, 6, txac130. [Google Scholar] [CrossRef]
- Oeztuerk, H.; Schroeder, B.; Beyerbach, M.; Breves, G. Influence of living and autoclaved yeasts of Saccharomyces boulardii on in vitro ruminal microbial metabolism. J. Dairy Sci. 2005, 88, 2594–2600. [Google Scholar] [CrossRef] [PubMed]
- Motulsky, H.J.; Brown, R.E. Detecting outliers when fitting data with nonlinear regression—A new method based on robust nonlinear regression and the false discovery rate. BMC Bioinform. 2006, 7, 123. [Google Scholar] [CrossRef] [PubMed]
- Caporaso, J.G.; Lauber, C.L.; Walters, W.A.; Berg-Lyons, D.; Huntley, J.; Fierer, N.; Owens, S.M.; Betley, J.; Fraser, L.; Bauer, M.; et al. Ultra-high-throughput microbial community analysis on the Illumina HiSeq and MiSeq platforms. ISME J. 2012, 6, 1621–1624. [Google Scholar] [CrossRef] [PubMed]
- Caporaso, J.G.; Lauber, C.L.; Walters, W.A.; Berg-Lyons, D.; Lozupone, C.A.; Turnbaugh, P.J.; Fierer, N.; Knight, R. Global patterns of 16S rRNA diversity at a depth of millions of sequences per sample. Proc. Natl. Acad. Sci. USA 2011, 108 (Suppl. S1), 4516–4522. [Google Scholar] [CrossRef] [PubMed]
- Smith, D.P.; Peay, K.G. Sequence depth, not PCR replication, improves ecological inference from next generation DNA sequencing. PLoS ONE 2014, 9, e90234. [Google Scholar] [CrossRef]
- Bolyen, E.; Rideout, J.R.; Dillon, M.R.; Bokulich, N.A.; Abnet, C.C.; Al-Ghalith, G.A.; Alexander, H.; Alm, E.J.; Arumugam, M.; Asnicar, F.; et al. Reproducible, interactive, scalable and extensible microbiome data science using QIIME 2. Nat. Biotechnol. 2019, 37, 852–857. [Google Scholar] [CrossRef]
- Callahan, B.J.; Mcmurdie, P.J.; Rosen, M.J.; Han, A.W.; Johnson, A.J.A.; Holmes, S.P. DADA2: High-resolution sample inference from Illumina amplicon data. Nat. Methods 2016, 13, 581–583. [Google Scholar] [CrossRef]
- R Core Team. R: A Language and Environment for Statistical Computing; R Core Team: Vienna, Austria, 2021. [Google Scholar]
- Katoh, K.; Standley, D.M. MAFFT multiple sequence alignment software version 7: Improvements in performance and usability. Mol. Biol. Evol. 2013, 30, 772–780. [Google Scholar] [CrossRef]
- Pedregosa, F.; Varoquaux, G.; Gramfort, A.; Michel, V.; Thirion, B.; Grisel, O.; Blondel, M.; Prettenhofer, P.; Weiss, R.; Dubourg, V.; et al. Scikit-learn: Machine learning in Python. J. Mach. Learn Res. 2011, 12, 2825–2830. [Google Scholar]
- Quast, C.; Pruesse, E.; Yilmaz, P.; Gerken, J.; Schweer, T.; Yarza, P.; Peplies, J.; Glöckner, F.O. The SILVA ribosomal RNA gene database project: Improved data processing and web-based tools. Nucleic Acids Res. 2013, 41, D590–D596. [Google Scholar] [CrossRef] [PubMed]
- Koljalg, U.; Nilsson, H.R.; Schigel, D.; Tedersoo, L.; Larsson, K.-H.; May, T.W.; Taylor, A.F.S.; Jeppesen, T.S.; Frøslev, T.G.; Lindahl, B.D.; et al. The Taxon Hypothesis Paradigm-On the Unambiguous Detection and Communication of Taxa. Microorganisms 2020, 8, 1910. [Google Scholar] [CrossRef]
- Lozupone, C.; Knight, R. UniFrac: A new phylogenetic method for comparing microbial communities. Appl. Environ. Microbiol. 2005, 71, 8228–8235. [Google Scholar] [CrossRef] [PubMed]
- Bokulich, N.A.; Kaehler, B.D.; Rideout, J.R.; Dillon, M.; Bolyen, E.; Knight, R.; Huttley, G.A.; Gregory Caporaso, J. Optimizing taxonomic classification of marker-gene amplicon sequences with QIIME 2’s q2-feature-classifier plugin. Microbiome 2018, 6, 90. [Google Scholar] [CrossRef] [PubMed]
- Chao, A.; Chiu, C.-H.; Jost, L. Phylogenetic Diversity Measures and Their Decomposition: A Framework Based on Hill Numbers. In Biodiversity Conservation and Phylogenetic Systematics: Preserving Our Evolutionary Heritage in an Extinction Crisis; Pellens, R., Grandcolas, P., Eds.; Springer International Publishing: Cham, Switzerland, 2016; pp. 141–172. [Google Scholar]
- Roque, B.M.; Venegas, M.; Kinley, R.D.; de Nys, R.; Duarte, T.L.; Yang, X.; Kebreab, E. Red seaweed (Asparagopsis taxiformis) supplementation reduces enteric methane by over 80 percent in beef steers. PLoS ONE 2021, 16, e0247820. [Google Scholar] [CrossRef]
- Roque, B.M.; Salwen, J.K.; Kinley, R.; Kebreab, E. Inclusion of Asparagopsis armata in lactating dairy cows’ diet reduces enteric methane emission by over 50 percent. J. Clean. Prod. 2019, 234, 132–138. [Google Scholar] [CrossRef]
- Schilde, M.; von Soosten, D.; Hüther, L.; Kersten, S.; Meyer, U.; Zeyner, A.; Dänicke, S. Dose—Response Effects of 3-Nitrooxypropanol Combined with Low- and High-Concentrate Feed Proportions in the Dairy Cow Ration on Fermentation Parameters in a Rumen Simulation Technique. Animals 2021, 11, 1784. [Google Scholar] [CrossRef]
- Van Gastelen, S.; Dijkstra, J.; Binnendijk, G.; Duval, S.M.; Heck, J.M.; Kindermann, M.; Zandstra, T.; Bannink, A. 3-Nitrooxypropanol decreases methane emissions and increases hydrogen emissions of early lactation dairy cows, with associated changes in nutrient digestibility and energy metabolism. J. Dairy Sci. 2020, 103, 8074–8093. [Google Scholar] [CrossRef]
- Zhao, W.; Abdelsattar, M.M.; Wang, X.; Zhang, N.; Chai, J. In Vitro Modulation of Rumen Fermentation by Microbiota from the Recombination of Rumen Fluid and Solid Phases. Microbiol. Spectr. 2022, 11, e0338722. [Google Scholar] [CrossRef]
- Brewster, A.N.; Pless, L.A.; McLean, D.J.; A Armstrong, S. Time of rumen fluid collection relative to feeding alters in vitro fermentation gas parameters. Transl. Anim. Sci. 2018, 2 (Suppl. S1), S97. [Google Scholar] [CrossRef]
- Wenner, B.A.; Kesselring, E.; Antal, L.; Henthorne, T.; Carpenter, A. Dual-flow continuous culture fermentor system updated to decrease variance of estimates of digestibility of neutral detergent fiber. Appl. Anim. Sci. 2021, 37, 445–450. [Google Scholar] [CrossRef]
- Teoh, R.; Caro, E.; Holman, D.B.; Joseph, S.; Meale, S.J.; Chaves, A.V. Effects of Hardwood Biochar on Methane Production, Fermentation Characteristics, and the Rumen Microbiota Using Rumen Simulation. Front. Microbiol. 2019, 10, 1534. [Google Scholar] [CrossRef] [PubMed]
- Huang, Y.; Marden, J.P.; Julien, C.; Bayourthe, C. Redox potential: An intrinsic parameter of the rumen environment. J. Anim. Physiol. Anim. Nutr. 2018, 102, 393–402. [Google Scholar] [CrossRef] [PubMed]
- Kimura, A.; Sato, S.; Kato, T.; Ikuta, K.; Yamagishi, N.; Okada, K.; Mizuguchi, H.; Ito, K. Relationship between pH and temperature in the ruminal fluid of cows, based on a radio-transmission pH-measurement system. J. Vet. Med. Sci. 2012, 74, 1023–1028. [Google Scholar] [CrossRef]
- Goto, H.; Qadis, A.Q.; Kim, Y.-H.; Ikuta, K.; Ichijo, T.; Sato, S. Effects of a bacterial probiotic on ruminal pH and volatile fatty acids during subacute ruminal acidosis (SARA) in cattle. J. Vet. Med. Sci. 2016, 78, 1595–1600. [Google Scholar] [CrossRef][Green Version]


| Firmicutes | Bacteroidota | Proteobacteria | Verrucomicrobiota | Euryarchaeota | Thermoplasmatota | Spirochaetota | Fibrobacterota | Patescibacteria | Cyanobacteria | Actinobacteriota | Chloroflexi | |
|---|---|---|---|---|---|---|---|---|---|---|---|---|
| Cow-24 h 1 | 34.34238 | 52.09 | 0.81 | 4.18 | 1.95 | 0.27 | 1.34 | 1.32 | 0.76 | 1.45 | 0.27 | 0.53 |
| Cow-48 h 1 | 30.95768 | 58.68 | 0.52 | 2.33 | 1.01 | 0.32 | 2.02 | 0.89 | 0.90 | 1.28 | 0.23 | 0.28 |
| Cow-72 h 1 | 37.34452 | 50.87 | 0.70 | 2.27 | 1.34 | 0.41 | 2.68 | 1.20 | 0.88 | 0.84 | 0.24 | 0.41 |
| Cow-96 h 1 | 36.784 | 49.67 | 0.76 | 2.99 | 1.71 | 0.36 | 2.27 | 1.58 | 0.97 | 1.34 | 0.23 | 0.38 |
| Cow-120 h 1 | 28.51376 | 53.59 | 1.37 | 4.42 | 1.63 | 0.55 | 3.08 | 1.98 | 0.86 | 2.69 | 0.13 | 0.35 |
| Cow-Total 2 | 33.59 ± 3.79 | 52.98 ± 3.5 | 0.83 ± 0.32 | 3.24 ± 1.01 | 1.53 ± 0.36 | 0.38 ± 0.11 | 2.28 ± 0.66 | 1.39 ± 0.41 | 0.87 ± 0.08 | 1.52 ± 0.7 | 0.22 ± 0.05 | 0.39 ± 0.09 |
| Ankom-24 h | 18.39 ± 1.68 | 62.39 ± 2.14 | 2.78 ± 0.79 | 9.96 ± 0.94 | 1.09 ± 0.33 | 0.54 ± 0.11 | 0.67 ± 0.11 | 0.07 ± 0.04 | 0.59 ± 0.09 | 2.44 ± 0.19 | 0.15 ± 0.06 | 0.28 ± 0.05 |
| Ankom-48 h | 41.87 ± 3.64 | 37.1 ± 2.45 | 1.71 ± 0.22 | 10.69 ± 1.02 | 2.61 ± 0.27 | 0.24 ± 0.09 | 0.95 ± 0.27 | 0.04 ± 0.01 | 0.28 ± 0.04 | 1.81 ± 0.48 | 0.71 ± 0.03 | 1.16 ± 0.05 |
| Ankom-72 h | 70.25 ± 6.23 | 13.67 ± 5.14 | 1.13 ± 0.41 | 7.18 ± 0.97 | 2.47 ± 0.38 | 0.12 ± 0.04 | 0.66 ± 0.29 | 0.02 ± 0 | 0.23 ± 0.06 | 1.08 ± 0.49 | 1.2 ± 0.2 | 1.26 ± 0.1 |
| Ankom-96 h | 82.51 ± 0.77 | 6.47 ± 1.11 | 0.68 ± 0.08 | 3.86 ± 0.43 | 2.2 ± 0.23 | 0.11 ± 0.07 | 0.47 ± 0.14 | 0.01 ± 0.01 | 0.17 ± 0.06 | 0.9 ± 0.43 | 1.12 ± 0.22 | 0.96 ± 0.2 |
| Ankom-120 h | 91.82 ± 2.01 | 2.71 ± 0.78 | 0.17 ± 0.03 | 1.61 ± 0.42 | 1.47 ± 0.54 | 0.05 ± 0.04 | 0.18 ± 0.11 | 0 ± 0 | 0.07 ± 0.04 | 0.44 ± 0.12 | 0.85 ± 0.11 | 0.44 ± 0.07 |
| Ankom-Total 2 | 81.52 ± 9.93 | 7.62 ± 5.51 | 0.66 ± 0.47 | 4.22 ± 2.49 | 2.05 ± 0.57 | 0.09 ± 0.06 | 0.44 ± 0.27 | 0.01 ± 0.01 | 0.16 ± 0.08 | 0.8 ± 0.44 | 1.05 ± 0.23 | 0.88 ± 0.38 |
| RUSITEC PP-24 h | 30.26 ± 4.35 | 54.37 ± 2.54 | 2.23 ± 0.78 | 5.53 ± 0.85 | 1.46 ± 0.68 | 1.37 ± 0.39 | 0.61 ± 0.13 | 0.04 ± 0.03 | 0.84 ± 0.08 | 1.27 ± 0.73 | 0.11 ± 0.05 | 0.56 ± 0.22 |
| RUSITEC PP-48 h | 35.55 ± 1.12 | 41.99 ± 0.68 | 3.64 ± 0.28 | 5.16 ± 0.51 | 1.26 ± 0.01 | 2.43 ± 0.39 | 3.27 ± 0.68 | 0.82 ± 0.46 | 0.7 ± 0.05 | 1.84 ± 0.38 | 0.18 ± 0.07 | 0.98 ± 0.12 |
| RUSITEC PP-72 h | 45.06 ± 8.38 | 35.72 ± 3.82 | 5.23 ± 1.86 | 3.47 ± 2.25 | 0.97 ± 0.4 | 1.9 ± 0.9 | 2.47 ± 0.96 | 0.78 ± 0.33 | 0.23 ± 0.12 | 1.65 ± 1.2 | 0.21 ± 0.13 | 0.88 ± 0.36 |
| RUSITEC PP-96 h | 48.26 ± 9.7 | 34.75 ± 6.67 | 5.29 ± 1.39 | 2.01 ± 0.14 | 0.53 ± 0.15 | 1.56 ± 0.61 | 2.5 ± 1.07 | 1.14 ± 0.66 | 0.06 ± 0.03 | 2.16 ± 1.73 | 0.32 ± 0.08 | 0.56 ± 0.12 |
| RUSITEC PP-120 h | 42.13 ± 1.28 | 40.43 ± 1.29 | 3.64 ± 0.49 | 1.5 ± 0.05 | 0.56 ± 0.08 | 1.48 ± 0.08 | 2.7 ± 0.23 | 1.1 ± 0.01 | 0.03 ± 0.01 | 4.07 ± 0.51 | 0.58 ± 0.07 | 0.68 ± 0.03 |
| RUSITEC PP-Total 2 | 40.12 ± 8.79 | 41.53 ± 8.18 | 4.03 ± 1.57 | 3.68 ± 1.9 | 0.98 ± 0.5 | 1.77 ± 0.63 | 2.28 ± 1.15 | 0.75 ± 0.54 | 0.4 ± 0.35 | 2.06 ± 1.27 | 0.26 ± 0.17 | 0.74 ± 0.25 |
| RUSITEC Prime-24 h | 23.89 ± 3.29 | 57.27 ± 2.73 | 3.47 ± 0.44 | 6.62 ± 0.29 | 1.41 ± 0.74 | 1.59 ± 0.56 | 0.69 ± 0.16 | 0.19 ± 0.05 | 1 ± 0.1 | 2.12 ± 0.2 | 0.06 ± 0.04 | 0.42 ± 0.1 |
| RUSITEC Prime-48 h | 32.5 ± 2.3 | 42.9 ± 2 | 4.74 ± 0.23 | 8.32 ± 0.65 | 1.55 ± 0.4 | 1.83 ± 0.18 | 2.09 ± 0.19 | 0.5 ± 0.22 | 0.91 ± 0.04 | 1.95 ± 0.08 | 0.19 ± 0.06 | 0.68 ± 0.1 |
| RUSITEC Prime-72 h | 39.5 ± 3.89 | 36.33 ± 1.2 | 4.76 ± 1.18 | 7.4 ± 2.32 | 1.34 ± 0.3 | 1.93 ± 0.54 | 2.6 ± 0.61 | 1.32 ± 1.5 | 0.43 ± 0.14 | 1.65 ± 0.45 | 0.22 ± 0.07 | 1.14 ± 0.22 |
| RUSITEC Prime-96 h | 44.16 ± 1.49 | 33.73 ± 2.43 | 4.2 ± 0.11 | 6.2 ± 1.2 | 1.61 ± 0.51 | 2.22 ± 0.73 | 2.46 ± 0.13 | 0.66 ± 0.24 | 0.25 ± 0.06 | 1.12 ± 0.25 | 0.21 ± 0.08 | 1.5 ± 0.46 |
| RUSITEC Prime-120 h | 47.1 ± 2.37 | 32.75 ± 1.08 | 4.97 ± 0.82 | 4.48 ± 0.25 | 1.14 ± 0.27 | 2.38 ± 0.45 | 2.86 ± 0.19 | 0.66 ± 0.09 | 0.09 ± 0.02 | 0.85 ± 0.57 | 0.27 ± 0.01 | 0.97 ± 0.34 |
| RUSITEC Prime-Total 2 | 37.43 ± 8.99 | 40.6 ± 9.53 | 4.43 ± 0.81 | 6.6 ± 1.68 | 1.41 ± 0.44 | 1.99 ± 0.53 | 2.14 ± 0.84 | 0.67 ± 0.7 | 0.54 ± 0.38 | 1.54 ± 0.58 | 0.19 ± 0.09 | 0.94 ± 0.45 |
| Desulfobacterota | Elusimicrobiota | Synergistota | Planctomycetota | Bdellovibrionota | Unassigned | WPS-2 | SAR324_clade(Marine_group_B) | Campilobacterota | Armatimonadota | <0.1% | ||
| Cow-24 h 1 | 0.18 | 0.21 | 0.01 | 0.08 | 0.01 | 0.18 | 0.00 | 0.00 | 0.01 | 0.00 | 0.01 | |
| Cow-48 h 1 | 0.25 | 0.12 | 0.02 | 0.06 | 0.01 | 0.09 | 0.01 | 0.00 | 0.00 | 0.00 | 0.00 | |
| Cow-72 h 1 | 0.37 | 0.16 | 0.03 | 0.08 | 0.02 | 0.13 | 0.00 | 0.01 | 0.00 | 0.01 | 0.00 | |
| Cow-96 h 1 | 0.41 | 0.17 | 0.03 | 0.10 | 0.01 | 0.17 | 0.00 | 0.02 | 0.00 | 0.00 | 0.00 | |
| Cow-120 h 1 | 0.22 | 0.32 | 0.04 | 0.07 | 0.01 | 0.14 | 0.00 | 0.01 | 0.01 | 0.00 | 0.00 | |
| Cow-Total 2 | 0.29 ± 0.1 | 0.19 ± 0.08 | 0.03 ± 0.01 | 0.08 ± 0.02 | 0.01 ± 0 | 0.14 ± 0.04 | 0 ± 0 | 0.01 ± 0.01 | 0 ± 0 | 0 ± 0 | 0 ± 0 | |
| Ankom-24 h | 0.13 ± 0.03 | 0.28 ± 0.03 | 0.03 ± 0.01 | 0.05 ± 0.03 | 0.02 ± 0.02 | 0.11 ± 0.02 | 0 ± 0.01 | 0.02 ± 0 | 0 ± 0 | 0 ± 0 | 0 ± 1 | |
| Ankom-48 h | 0.29 ± 0.12 | 0.24 ± 0.06 | 0.05 ± 0.01 | 0.11 ± 0.02 | 0.01 ± 0 | 0.08 ± 0.01 | 0 ± 0 | 0.04 ± 0.01 | 0 ± 0 | 0.01 ± 0 | 0 ± 0 | |
| Ankom-72 h | 0.37 ± 0.17 | 0.14 ± 0.01 | 0.08 ± 0.03 | 0.05 ± 0.02 | 0 ± 0 | 0.04 ± 0.02 | 0 ± 0 | 0.02 ± 0 | 0 ± 0 | 0.01 ± 0 | 0 ± 1 | |
| Ankom-96 h | 0.29 ± 0.22 | 0.06 ± 0.03 | 0.07 ± 0.04 | 0.06 ± 0.01 | 0 ± 0 | 0.04 ± 0.01 | 0 ± 0 | 0 ± 0 | 0 ± 0 | 0.01 ± 0.01 | 0 ± 0 | |
| Ankom-120 h | 0.12 ± 0.05 | 0.03 ± 0.01 | 0.01 ± 0.01 | 0.02 ± 0.01 | 0 ± 0 | 0.02 ± 0.02 | 0 ± 0 | 0 ± 0.01 | 0 ± 0 | 0 ± 0 | 0 ± 0 | |
| Ankom-Total 2 | 0.26 ± 0.18 | 0.08 ± 0.05 | 0.06 ± 0.04 | 0.04 ± 0.02 | 0 ± 0 | 0.03 ± 0.02 | 0 ± 0 | 0.01 ± 0.01 | 0 ± 0 | 0.01 ± 0.01 | 0 ± 0 | |
| RUSITEC PP-24 h | 0.4 ± 0.12 | 0.27 ± 0.21 | 0.06 ± 0.01 | 0.16 ± 0.04 | 0.17 ± 0.07 | 0.18 ± 0.03 | 0 ± 0.01 | 0.06 ± 0.02 | 0.01 ± 0 | 0.01 ± 0.01 | 0.01 ± 0.01 | |
| RUSITEC PP-48 h | 0.57 ± 0.28 | 0.65 ± 0.07 | 0.23 ± 0.07 | 0.18 ± 0.05 | 0.14 ± 0.05 | 0.25 ± 0.03 | 0.01 ± 0.01 | 0.06 ± 0.02 | 0.02 ± 0 | 0.01 ± 0.01 | 0.01 ± 0.01 | |
| RUSITEC PP-72 h | 0.27 ± 0.1 | 0.35 ± 0.22 | 0.16 ± 0.1 | 0.16 ± 0.1 | 0.04 ± 0.03 | 0.25 ± 0.24 | 0.06 ± 0.07 | 0.04 ± 0.01 | 0.02 ± 0 | 0 ± 0.01 | 0.01 ± 0.01 | |
| RUSITEC PP-96 h | 0.16 ± 0.05 | 0.21 ± 0.1 | 0.07 ± 0.03 | 0.11 ± 0.04 | 0.01 ± 0 | 0.15 ± 0.15 | 0.09 ± 0.05 | 0.02 ± 0.02 | 0.01 ± 0.01 | 0 ± 0 | 0 ± 0 | |
| RUSITEC PP-120 h | 0.23 ± 0.08 | 0.32 ± 0.18 | 0.08 ± 0.02 | 0.13 ± 0.02 | 0.01 ± 0 | 0.16 ± 0.06 | 0.12 ± 0.04 | 0.02 ± 0 | 0.02 ± 0 | 0 ± 0 | 0 ± 0 | |
| RUSITEC PP-Total 2 | 0.33 ± 0.2 | 0.36 ± 0.21 | 0.12 ± 0.09 | 0.15 ± 0.06 | 0.08 ± 0.08 | 0.2 ± 0.12 | 0.05 ± 0.06 | 0.04 ± 0.02 | 0.01 ± 0.01 | 0.01 ± 0.01 | 0.01 ± 0.01 | |
| RUSITEC Prime-24 h | 0.25 ± 0.07 | 0.4 ± 0.07 | 0.05 ± 0 | 0.13 ± 0.01 | 0.21 ± 0.08 | 0.15 ± 0.02 | 0.01 ± 0.01 | 0.05 ± 0.01 | 0.01 ± 0 | 0.01 ± 0.01 | 0 ± 0 | |
| RUSITEC Prime-48 h | 0.35 ± 0.12 | 0.58 ± 0.05 | 0.17 ± 0.04 | 0.18 ± 0.03 | 0.19 ± 0.06 | 0.19 ± 0.03 | 0.01 ± 0 | 0.06 ± 0.01 | 0.05 ± 0.01 | 0.01 ± 0 | 0 ± 0 | |
| RUSITEC Prime-72 h | 0.23 ± 0.16 | 0.42 ± 0.13 | 0.17 ± 0.09 | 0.22 ± 0.08 | 0.07 ± 0.06 | 0.13 ± 0.05 | 0.01 ± 0.02 | 0.04 ± 0.02 | 0.04 ± 0.01 | 0.01 ± 0 | 0 ± 0 | |
| RUSITEC Prime-96 h | 0.39 ± 0.15 | 0.23 ± 0.1 | 0.18 ± 0.06 | 0.32 ± 0.11 | 0.07 ± 0.01 | 0.14 ± 0.02 | 0.11 ± 0.07 | 0.05 ± 0.01 | 0.09 ± 0.02 | 0.01 ± 0.01 | 0 ± 0 | |
| RUSITEC Prime-120 h | 0.42 ± 0.2 | 0.25 ± 0.1 | 0.12 ± 0.06 | 0.24 ± 0.08 | 0.02 ± 0.02 | 0.1 ± 0.02 | 0.11 ± 0.02 | 0.05 ± 0.03 | 0.11 ± 0.03 | 0 ± 0 | 0 ± 0 | |
| RUSITEC Prime-Total 2 | 0.33 ± 0.15 | 0.38 ± 0.15 | 0.14 ± 0.07 | 0.22 ± 0.09 | 0.11 ± 0.09 | 0.14 ± 0.04 | 0.05 ± 0.06 | 0.05 ± 0.02 | 0.06 ± 0.04 | 0.01 ± 0 | 0 ± 0 | |
| Neocallimastigomycota | Basidiomycota | Ascomycota | Mucoromycota | Rozellomycota | Mortierellomycota | Unassigned | |
|---|---|---|---|---|---|---|---|
| Cow-24 h 1 | 96.11250628 | 0.772045634 | 2.648585301 | 0.150678051 | 0.004305087 | 0.203774126 | 0.108105522 |
| Cow-48 h 1 | 96.84371793 | 0.84187354 | 2.098238412 | 0.106597651 | 0.007437045 | 0.046605485 | 0.055529939 |
| Cow-72 h 1 | 98.86820007 | 0.245738198 | 0.742363393 | 0.092678406 | 0.031828947 | 0 | 0.019190983 |
| Cow-96 h 1 | 97.73148245 | 0.797102957 | 1.307831589 | 0.104892922 | 0 | 0 | 0.058690087 |
| Cow-120 h 1 | 84.96034062 | 10.95354187 | 3.323833396 | 0.683308725 | 0.020602273 | 0 | 0.058373107 |
| Cow-Total 2 | 94.9 ± 5.65 | 2.72 ± 4.61 | 2.02 ± 1.03 | 0.23 ± 0.26 | 0.01 ± 0.01 | 0.05 ± 0.09 | 0.06 ± 0.03 |
| Ankom-24 h | 89.12 ± 2.78 | 2.56 ± 0.35 | 7.23 ± 2.1 | 0.61 ± 0.35 | 0.08 ± 0.08 | 0 ± 0 | 0.4 ± 0.1 |
| Ankom-48 h | 68.48 ± 13.45 | 6.19 ± 1.4 | 18.2 ± 8.58 | 5.85 ± 4.33 | 0.16 ± 0.2 | 0 ± 0 | 1.12 ± 0.49 |
| Ankom-72 h | 37.14 ± 7.59 | 16.63 ± 1.76 | 36.24 ± 3.78 | 7 ± 0.35 | 1.18 ± 2.03 | 0.5 ± 0.87 | 1.3 ± 0.61 |
| Ankom-96 h | 18.62 ± 0.76 | 33.75 ± 0.55 | 42.03 ± 3.04 | 2.92 ± 0.92 | 0.12 ± 0.17 | 0 ± 0 | 2.56 ± 0.65 |
| Ankom-120 h | 25.56 ± 36.1 | 34.69 ± 5.61 | 34.69 ± 27.05 | 2.42 ± 2.3 | 0.09 ± 0.16 | 0 ± 0 | 2.55 ± 2.21 |
| Ankom-Total 2 | 49.87 ± 31.59 | 17.7 ± 13.99 | 26.65 ± 17.42 | 3.82 ± 3.17 | 0.34 ± 0.92 | 0.11 ± 0.4 | 1.52 ± 1.27 |
| RUSITEC PP-24 h | 81.2 ± 22.71 | 15.77 ± 21.41 | 2.12 ± 0.46 | 0.66 ± 0.73 | 0.18 ± 0.28 | 0 ± 0 | 0.07 ± 0.04 |
| RUSITEC PP-48 h | 84.93 ± 2.24 | 11.03 ± 3.05 | 3.09 ± 0.98 | 0.67 ± 0.2 | 0.01 ± 0.02 | 0 ± 0 | 0.28 ± 0.21 |
| RUSITEC PP-72 h | 76.16 ± 15.56 | 18.73 ± 13.27 | 3.89 ± 2.43 | 1.06 ± 0.62 | 0 ± 0 | 0 ± 0 | 0.17 ± 0.03 |
| RUSITEC PP-96 h | 79.74 ± 4.39 | 14.45 ± 2.39 | 4.66 ± 1.83 | 0.96 ± 0.38 | 0.04 ± 0.07 | 0 ± 0 | 0.15 ± 0.04 |
| RUSITEC PP-120 h | 69.8 ± 21.73 | 21.52 ± 17.63 | 6.5 ± 1.86 | 1.31 ± 1.21 | 0.27 ± 0.38 | 0 ± 0 | 0.6 ± 0.65 |
| RUSITEC PP-Total 2 | 78.98 ± 13.45 | 15.93 ± 11.69 | 3.88 ± 1.98 | 0.9 ± 0.58 | 0.09 ± 0.19 | 0 ± 0 | 0.23 ± 0.26 |
| RUSITEC Prime-24 h | 84.98 ± 10.96 | 10.97 ± 11.84 | 2.82 ± 0.97 | 0.98 ± 0.4 | 0.06 ± 0.03 | 0 ± 0 | 0.19 ± 0.1 |
| RUSITEC Prime-48 h | 75.58 ± 19.68 | 20.38 ± 20.12 | 2.27 ± 1.75 | 1.41 ± 1.33 | 0 ± 0 | 0 ± 0 | 0.35 ± 0.22 |
| RUSITEC Prime-72 h | 69.38 ± 17.51 | 23.48 ± 17.89 | 4.93 ± 3.36 | 1.26 ± 1.49 | 0 ± 0 | 0 ± 0 | 0.95 ± 1.4 |
| RUSITEC Prime-96 h | 43.21 ± 23.97 | 37.08 ± 5.96 | 16.51 ± 17.07 | 1.57 ± 0.89 | 0.67 ± 1.16 | 0 ± 0 | 0.95 ± 0.91 |
| RUSITEC Prime-120 h | 61.71 ± 38.46 | 27.37 ± 25.34 | 10.02 ± 13.82 | 0.73 ± 0.9 | 0 ± 0 | 0 ± 0 | 0.17 ± 0.16 |
| RUSITEC Prime-Total 2 | 66.97 ± 24.96 | 23.86 ± 17.28 | 7.31 ± 10.09 | 1.19 ± 0.96 | 0.15 ± 0.52 | 0 ± 0 | 0.52 ± 0.74 |
Disclaimer/Publisher’s Note: The statements, opinions and data contained in all publications are solely those of the individual author(s) and contributor(s) and not of MDPI and/or the editor(s). MDPI and/or the editor(s) disclaim responsibility for any injury to people or property resulting from any ideas, methods, instructions or products referred to in the content. |
© 2023 by the authors. Licensee MDPI, Basel, Switzerland. This article is an open access article distributed under the terms and conditions of the Creative Commons Attribution (CC BY) license (https://creativecommons.org/licenses/by/4.0/).
Share and Cite
Shaw, C.A.; Park, Y.; Gonzalez, M.; Duong, R.A.; Pandey, P.K.; Brooke, C.G.; Hess, M. A Comparison of Three Artificial Rumen Systems for Rumen Microbiome Modeling. Fermentation 2023, 9, 953. https://doi.org/10.3390/fermentation9110953
Shaw CA, Park Y, Gonzalez M, Duong RA, Pandey PK, Brooke CG, Hess M. A Comparison of Three Artificial Rumen Systems for Rumen Microbiome Modeling. Fermentation. 2023; 9(11):953. https://doi.org/10.3390/fermentation9110953
Chicago/Turabian StyleShaw, Claire A., Yuna Park, Maria Gonzalez, Rich A. Duong, Pramod K. Pandey, Charles G. Brooke, and Matthias Hess. 2023. "A Comparison of Three Artificial Rumen Systems for Rumen Microbiome Modeling" Fermentation 9, no. 11: 953. https://doi.org/10.3390/fermentation9110953
APA StyleShaw, C. A., Park, Y., Gonzalez, M., Duong, R. A., Pandey, P. K., Brooke, C. G., & Hess, M. (2023). A Comparison of Three Artificial Rumen Systems for Rumen Microbiome Modeling. Fermentation, 9(11), 953. https://doi.org/10.3390/fermentation9110953