Article

Ex Vivo Fermentation of Hay and Corn by Rumen Bacteria from Cattle and Sheep

by
Jennifer R. Weinert-Nelson
1,
Donald G. Ely
2,
Michael D. Flythe
1,
Tracy A. Hamilton
1,
Jessica L. Ferrell
1 and
Brittany E. Davis
1,*
1
Forage-Animal Production Research Unit, Agricultural Research Service, United States Department of Agriculture, Lexington, KY 40546, USA
2
Department of Animal and Food Sciences, University of Kentucky, Lexington, KY 40546, USA
*
Author to whom correspondence should be addressed.
Fermentation 2023, 9(11), 929; https://doi.org/10.3390/fermentation9110929
Submission received: 22 September 2023 / Revised: 17 October 2023 / Accepted: 20 October 2023 / Published: 25 October 2023
(This article belongs to the Special Issue In Vitro Fermentation, 3rd Edition)

Abstract

:
Sheep are often utilized as a model ruminant, despite a lack of functional comparisons of rumen bacterial communities and responses during dietary transitions between sheep and cattle. Therefore, an ex vivo study was conducted to evaluate species differences. Rumen fluid was obtained from hay-fed sheep and cattle (n = 3 species−1). Mixed bacterial cell suspensions in buffered media containing 3% w/v ground hay, corn, or combinations (2:1, 1:2) of substrates were incubated (24 h; 39 °C). Suspension pH, lactate, volatile fatty acids (VFA), and digestibility were assessed, functional guilds enumerated, and amylolytic bacteria isolated. Lactate was fully utilized in all hay incubations, and pH did not differ between species (p > 0.75). In contrast, digestibility, lactate accumulation, and pH decline were greater in bovine suspensions fermenting corn (p < 0.01). Streptococcus bovis was the predominant bacteria regardless of species, but total amylolytic bacteria were 10-fold greater in bovine suspensions (p < 0.01). Lactate-utilizing bacteria were 1000-fold greater in bovine than ovine suspensions (p < 0.01). However, total VFA did not differ between species (p > 0.28). Overall, these results demonstrate differential feed utilization capacities in rumen microbial communities of sheep and cattle as well as potential differences in rumen acidosis susceptibility.

1. Introduction

Cattle and sheep are ruminant animal species that rely on their resident rumen microbial community to ferment dietary nutrients and produce by-products such as volatile fatty acids (VFA), which can then be absorbed and utilized to meet animal energy requirements. Sheep are commonly used as model ruminants, as their smaller size and shorter production cycles aid in controlling experimental costs while also offering advantages in feasibility related to animal handling and housing. Consequently, results from cattle and sheep studies are often referred to interchangeably, despite inconsistencies in interspecies differences reported in the literature [1,2].
The majority of comparative studies have focused on in vivo digestibility across various feedstuffs. Overall, previous in vivo research points to superior total tract dry matter (DM) forage digestibility in forage-fed cattle in comparison with sheep [1,2,3,4,5], while total tract digestibility of concentrates may be more similar between species when fed a high-concentrate diet [1,6,7]. A smaller number of direct comparative studies have assessed feed and nutrient utilization within the rumen. These in situ studies largely focused on the ruminal degradation of forage substrates in animals fed forage-based diets, with inconsistent findings [3,8,9]. Studies evaluating the ruminal degradation of concentrates, particularly high-starch feedstuffs, in cattle versus sheep are even more limited [2,10].
An abrupt transition from a forage-based diet to a high-starch diet is associated with the development of both acute (pH < 5.0) and sub-acute (SARA; pH: 5.0–5.6) ruminal acidosis [11,12,13]. Introduction of dietary starch to the rumen leads to proliferation of ruminal amylolytic bacteria, specifically Streptococcus bovis, production of lactate, and a consequent enrichment for lactate-utilizing bacteria [11,12,13]. However, when fermentative acid production (most notably lactic acid) in the rumen exceeds capacity for utilization or absorption, acid accumulates, leading to environmental pH decline and the development of acidosis, at which point cellulolytic and lactate-utilizers are also inhibited [13,14]. These disruptions of the rumen microbial community result in negative impacts on ruminant animal health and performance [13]. Sheep are often used as an in vivo model of these conditions, and experimental induction of acidosis and SARA in sheep is well documented [15,16,17]. However, to the authors’ knowledge, no prior studies have directly compared responses to a high-starch corn challenge between cattle and sheep.
Given the above-noted inconsistencies regarding rumen fermentation of forages and significant gaps in knowledge related to the degradation of concentrates in cattle and sheep, additional research is needed to better understand these potential comparative species differences in ruminal fermentation and function. Furthermore, no prior studies have attempted in-depth direct comparisons of the functional characteristics of the rumen microbiota in cattle and sheep across multiple feed substrates, including responses in forage-adapted animals to the abrupt introduction of high-starch feedstuffs. Therefore, the objective of this study was to evaluate the ex vivo fermentation of hay and corn, as well as a combination of these common feed substrates, by rumen bacteria harvested from cattle and sheep.

2. Materials and Methods

2.1. Media Preparation

The composition of liquid media types can be found in Table S1. The cell suspension medium was prepared based on a protocol described by Stack et al. [18]. The cell suspension medium was also used for the enumeration of cellulolytic and amylolytic bacteria. For the enumeration of cellulolytic bacteria, Whatman #1 filter paper strips (Whatman, Tonglu, China) were added as the growth substrate. The medium was amended to exclude phenylacetic acid and VFA with cornstarch (10,000 mg L−1) added as the growth substrate for the enumeration of amylolytic bacteria [19]. Hyper-ammonia-producing bacteria (HAB) were enumerated in media prepared as previously described by Russell et al. [20] and Chen and Russell [21]. Trypticase (15 mg mL−1) and Casamino acids (15 mg mL−1; Becton Dickinson, Franklin Lake, NJ, USA) were added as substrates. Lactate-utilizing bacteria were enumerated in media based on the preparation described by Mackie and Heath [22]. After preparation, the three above-described liquid media types were adjusted for pH (cell suspension medium: 6.7; HAB medium: 6.5; lactate-utilizer medium: 6.8). The media were then autoclaved (121 °C, 103 kPa, 20 min) to remove O2 and cooled under O2-free CO2. A carbonate buffer (4000 mg Na2CO3) was added prior to subsequent dispensing and a final autoclave step for sterility.
Solid growth medium was also made for the isolation of amylolytic bacteria by preparing liquid media as described above with agar (15,000 mg L−1). Petri plates for the enumeration of amylolytic bacteria were prepared and later incubated in an anaerobic chamber (Coy, Grass Lakes, MI, USA; 95% CO2, 5% H2). Bile aesculin azide agar (Enterococcosel™; Becton, Dickinson, and CO, Franklin Lake, NJ, USA) was used for enumeration of Lancefield Group D Gram-positive cocci (GPC; enterococci and streptococci) and was prepared in Petri plates according to manufacturer instructions.

2.2. Animals and Mixed Rumen Microorganism Cell Suspensions

The use of animals and procedures in this study were approved by the Institutional Animal Care and Use Committee at the University of Kentucky. Housing and animal care were consistent with the Guide to the Care and Use of Agricultural Animals in Research and Teaching [23]. Animals were selected from the University of Kentucky, Department of Animal and Food Sciences, cattle herd, and sheep flock at the C. Oran Little Research Center (Versailles, KY; geographic coordinates: 38°4′36″ N, 84°44′22″ W). Rumen fluid donors were three ram lambs (age = 134 ± 1 d; weight = 44 ± 1 kg) and three Holstein steers (age = 212 ± 8 d; weight = 294 ± 4 kg). All animals were at a similar physiological growth stage and were maintained on an all-forage tall fescue hay diet for 14 d prior to the experiment with ad libitum access to conventional loose minerals and water. The chemical composition of tall fescue hay was as follows (DM basis): Crude Protein (CP)—9.3%; Acid Detergent Fiber (ADF; cellulose + lignin)—42.9%; Neutral Detergent Fiber (NDF; cellulose + hemicellulose + lignin)—64.6%; Non-Fiber Carbohydrate (NFC)—16.8%; Total Digestible Nutrients (TDN; estimated energy value)—57.0%.
Rumen fluid samples (500 mL) were collected via oral intubation of a stomach tube into the ventral sac of the rumen. Samples were transported to the laboratory in a sealed, insulated container within 1 h of collection. Rumen cell suspensions were prepared as previously described [19,24,25]. In brief, the collected rumen fluid was first subjected to low-speed centrifugation (100× g, 10 min) for the removal of remaining plant fibers and protists. The supernatants were subsequently subjected to high-speed centrifugation (25,700× g, 5 min) to collect the planktonic prokaryote fraction. Supernatants were discarded, and pellets were washed by re-suspension in anaerobic cell suspension media. Following additional high-speed centrifugation (25,700× g, 10 min), supernatants were again discarded. Pellets were re-suspended and pooled (by animal) into a CO2-sparged glass vessel. Microscopic analyses showed prokaryote-sized cells with no obvious plant fiber or protists in the resulting cell suspension. Due to the inherent disparity of optical densities (600 nm; OD) between species (bovine: 1.49–2.45 OD; ovine: 3.96–6.10 OD), OD was not adjusted. This species difference in OD was considered to be an inherent property of the respective rumen microbial communities, as samples were obtained within a similar timeframe on the same day and identical protocols were followed for sample collection and preparation of rumen cell suspensions. Therefore, OD was not adjusted across both species, as this adjustment could have artificially impacted the responses of rumen microbial communities as harvested from the bovine and ovine rumen fluid donors.

2.3. Ex Vivo Experiment

An experiment was conducted to determine the effect of animal species (bovine versus ovine) on the enumeration of cellulolytic, amylolytic, HAB, and lactate-utilizing bacteria as well as the ex vivo dry matter digestibility (EVDMD) of the following feed substrate treatments: tall fescue hay (HY; 30 mg mL−1 [chemical composition same as detailed above]); 2:1 fescue hay to ground shelled corn (HC; 20 mg mL−1 hay, 10 mg mL−1 corn (chemical composition [DM basis]: CP—8.2%; ADF—2.3%; NDF—7.9%; Starch—74.5%; TDN: 89.0%); 2:1 corn to fescue hay (CH; 20 mg mL−1 corn, 10 mg mL−1 hay), and corn (CN; 30 mg mL−1). Hay and corn were ground (2 mm screen), weighed, and placed in ANKOM F57 Filter bags (25-micron pore size; ANKOM Technology, Macedon, NY). Prepared bacterial suspensions (as described above) were dispensed into anaerobic (CO2) serum bottles containing substrate bags, with the final concentration of substrate at 3% w/v. Bottles were incubated in a shaking water bath (39 °C, 160 rev min−1) for 24 h.
Samples were collected via tuberculin syringes at 0, 2, 4, 8, and 24 h for pH and fermentation end-product analyses. Samples were collected from the initial prepared cell suspensions for bacterial enumerations at 0 h. Subsequent samples were collected from treatment bottles to enumerate bacteria at 8 and 24 h to capture the mid- and end-points of fermentation. The pH was measured immediately using a pH meter (Accumet™ Research, AR10 pH meter; ThermoFisher Scientific, Waltham, MA, USA, with a Broadley-James® pH electrode; Broadley-James®, Irvine, CA, USA) calibrated to pH 4.0 and 7.0. Aliquots collected for later end-product analysis were clarified via centrifugation (21,000× g, 2 min), with the supernatant collected and frozen at −20 °C (subsequent analyses described below). The quantification of bacterial guilds in selective enumeration media was as previously described [19,26]. In brief, samples collected for bacterial enumerations (0.5 mL) were serially diluted (10-fold, v/v) with anaerobic phosphate buffered saline (PBS; pH 7.4; N2-sparged; 8 g NaCl, 0.2 g KCl, 1.44 g Na2PO4; and 0.24 g KH2PO4 per L), which was used to inoculate selective enumeration media. Liquid media were inoculated with 0.5 mL via a tuberculin syringe, and solid media were inoculated with 0.2 mL via a sterile spreader. For liquid media, the final dilution exhibiting bacterial growth was recorded as the total viable number of bacteria after incubating at 39 °C for 3 d (amylolytic bacteria and HAB; visual examination, presence of a microbial pellet or optical density with a spectrophotometer at 600 nm as necessary), 5 d (lactate-utilizing bacteria; visual examination, OD600), or 10 d (cellulolytic bacteria; visual examination, dissolution of filter paper). Bile aesculin azide agar plates were aerobically incubated for 3 d (37 °C). Plates with 30 < x < 300 colonies were counted, with black colonies counted as GPC.
At the end of the incubation period, substrate bags were removed from bottles containing the mixed cell suspensions. Substrate bags were washed using an ANKOM fiber analyzer with the wash procedure from the ANKOM method for NDF determination [27], modified to exclude α-amylase from the hot water rinses [28]. Bags were dried (55 °C) in a forced-air drying oven, weighed after 48 h, and EVDMD calculated as follows:
[(Empty Bag Dry Weight + Initial Sample Dry Weight) − Post-incubation Bag/Sample Dry Weight] ÷ Initial Dry Sample Weight × 100 = % EVDMD

2.4. Isolation of Amylolytic Bacteria

Samples from the highest dilutions of amylolytic bacteria enumerations were used to streak solid growth media (as described above) for bacterial isolation. Plates were incubated (39 °C; 24–48 h) in an anaerobic chamber (95% CO2, 5% H2; Coy, Grass Lake, MI, USA). Colonies were picked and routinely passaged in liquid growth media (39 °C; 24–48 h). Phylogenetic identities were determined by 16S rRNA gene sequencing. DNA was extracted (PureLink™ Genomic DNA Mini Kit, Invitrogen, ThermoFisher Scientific, Waltham, MA, USA) following the manufacturer’s instructions for gram-positive bacterial cell lysate. The gDNA concentration (>10 ng µL−1) was confirmed via NanoDrop ND-1000 UV–Vis spectrophotometry prior to submitting samples to a commercial laboratory for subsequent PCR amplification and 16S sequencing (ID Genomics, Seattle, WA, USA). The PCR reaction mixture included 10 µM 16S forward primer with T7 sequencing tail (TAATACGACTCACTATAGGGAGAGTTTGATCCTGGCTCAG) and 10 µM 16S reverse primer (GYTACCTTGTTACGACTT) [29]. The PCR cycles used included initial denaturation (95 °C; 5 min), followed by 30 cycles (primer annealing: 58 °C, 30 s; primer extension: 72 °C, 40 s), and a final extension step (72 °C; 10 min). Products were sequenced via Sanger sequencing (Thermo, Applied Biosystems 3730 DNA Analyzer, Waltham, MA, USA), with the resulting sequences analyzed and aligned using Geneious™ v.5.1 [30]. The closest phylogenetic relatives were determined using a BLAST search of GenBank [31]. Sequence data are available in GenBank at: https://www.ncbi.nlm.nih.gov/genbank/ (accessed on 19 October 2023), accession numbers: OR076351–OR076387.

2.5. Fermentation End-Product Analyses

Frozen aliquots of supernatant from the ex vivo experiment (described above) were thawed, filtered (0.22 µm syringe filter), and further clarified via centrifugation (21,000× g, 2 min). Lactate, VFA (succinate, acetate, propionate, butyrate, and valerate), and branched-chain fatty acids (BCFA: isobutyrate and IVMB [isovalerate and/or methylbutyrate]) were quantified by HPLC (Summit HPLC; Dionex, Sunnyvale, CA, USA) equipped with an anion exchange column (Aminex, HP-87H; Bio-Rad, Hercules, CA, USA), refractive index (ERC Refractomax 520 RI, Prague, Czech Republic), and UV detector (Thermo, Dionex 3000 Multiwavelength Detector, Waltham, MA, USA). Eluting compounds were isocratically separated with a sulfuric acid mobile phase (5 mmol L−1, aqueous). The column was operated at 50 °C with a 0.4 mL min−1 flow rate and 50 µL injection volume. Ammonia concentrations were determined using a colorimetric method [32], previously modified by Russell et al. [20].

2.6. Chemical Composition of Feed Substrates

Substrate samples were submitted to a commercial laboratory (Dairy One, Inc., Ithaca, NY, USA) for analysis of chemical composition (as reported above for hay and corn). Crude protein was analyzed with a Leco FP-528 Nitrogen/Protein Analyzer (Leco Corporation, St. Joseph, MI; Association of Official Analytical Chemists [AOAC] 990.03). Fiber (ADF and NDF) was analyzed using an ANKOM A200 Digestion Unit (ANKOM Technology, Macedon, NY, USA) (AOAC 973.18 [33,34]). Starch was analyzed with a YSI 2700 SELECT Biochemistry Analyzer (YSI Incorporated Life Sciences, Yellow Springs, OH, USA). Non-fiber carbohydrates and TDN were calculated based on summative equations [35,36].

2.7. Statistical Analyses

All data were analyzed with SAS (v. 9.4, SAS Inst. Inc., Cary, NC, USA), with animals used as the experimental unit. Prior to statistical analyses, bacterial enumerations were normalized by log transformation. Enumeration data during incubation as well as pH and fermentation end-products were analyzed using PROC MIXED with species, treatment, time, and their interactions set as fixed effects and animal as the random variable. Denominator degrees of freedom were computed with the Kenward-Roger method, and compound symmetry co-variance structure was in the repeated statement. Bacterial enumerations in initial cell suspensions (time zero) and %EVDMD were analyzed by PROC GLM with species and treatment as fixed effects and animal as the random variable. Means were separated using the PDIFF option. Results were considered significant at p ≤ 0.05; trends were observed at p ≤ 0.10. The data are presented as true means ± SEM.

3. Results

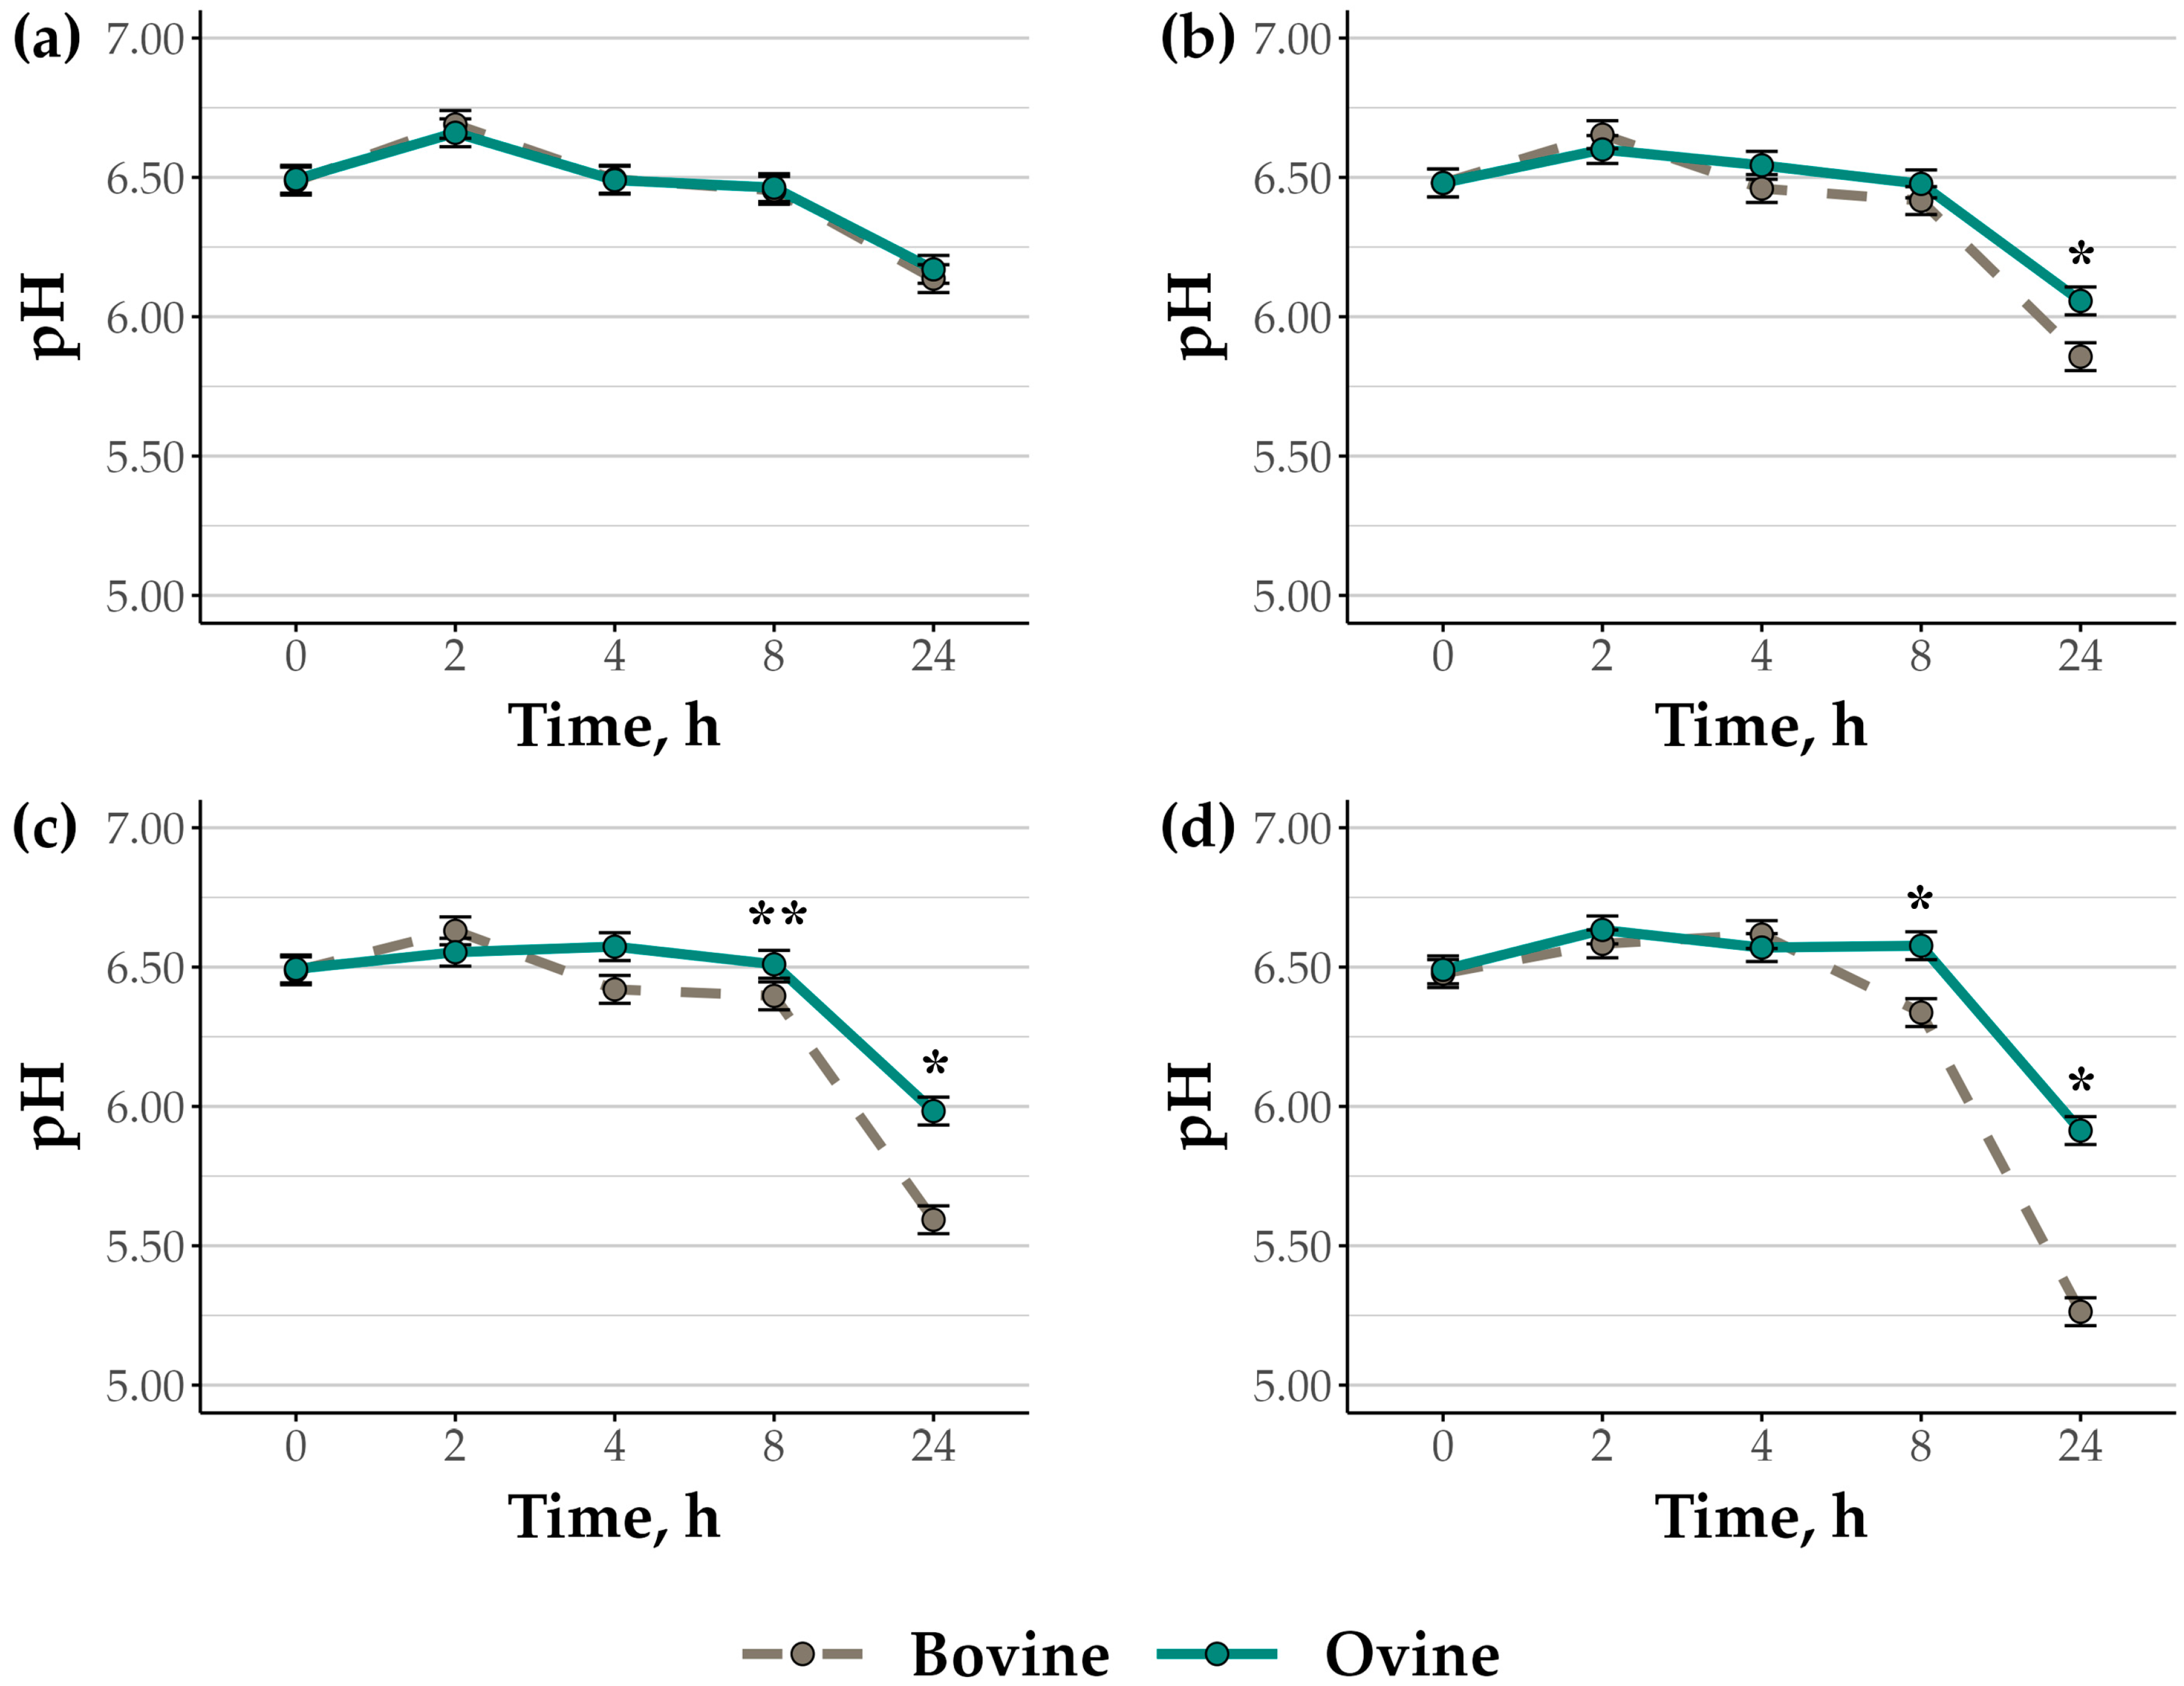
3.1. Rumen Cell Suspension pH and Fermentation End-Products

When ground hay and corn were fermented by bovine and ovine rumen bacterial cell suspensions, suspension pH differed by species (p = 0.04), feed substrate treatment (p < 0.01), and time (p < 0.01), with a species by treatment by time interaction (p < 0.01; Figure 1a–d). Initial pH in cell suspensions was 6.48 ± 0.01 regardless of species or treatment, and pH had declined by 24 h in both bovine and ovine rumen cell suspensions for all treatments (p < 0.01). In rumen cell suspensions fermenting HY, no differences in pH were found between species at any timepoint, including the final pH at 24 h (6.15 ± 0.03; p ≥ 0.75). In contrast, for all treatments that included ground corn, pH decline by 24 h was more pronounced in bovine rumen cell suspensions (HC: 5.86; CH: 5.59; CN: 5.26) than ovine cell suspensions (HC: 6.06; CH: 5.98; CN: 5.91; SEM: 0.05; p < 0.01).
Accordingly, lactate accumulation also differed by species (p = 0.04), treatment (p = 0.05), and time (p < 0.01), with a species-by-treatment-by-time interaction (p < 0.01; Figure 2a–d). In rumen cell suspensions fermenting HY, peak lactate accumulation occurred between 4 and 8 h of incubation (p ≤ 0.02), with greater lactate concentrations in bovine (12.63 ± 1.84 mmol L−1) versus ovine (7.37 ± 1.84 mmol L−1) suspensions at the 4 h timepoint (p = 0.05). Peak lactate accumulation also occurred between 4 and 8 h in bovine suspensions fermenting HC (p ≤ 0.02) and at 8 h in bovine suspensions fermenting CH (p < 0.01). However, lactate accumulation did not differ over the 2, 4, and 8 h timepoints in ovine cell suspensions fermenting HC or CH (p > 0.14), with lactate concentrations in ovine suspensions (HC: 6.39; CH: 3.21; SEM: 1.84 mmol L−1) less than in bovine suspensions (HC: 12.64; CH: 13.44; SEM: 1.84 mmol L−1) after 8 h of incubation for both treatments (p = 0.02). In rumen cell suspensions fermenting feed substrates including hay (HY, HC, CH), lactate concentrations were non-detectable or minimal by 24 h (≤1.50 mmol L−1), regardless of species (p ≥ 0.66). In contrast to other feed substrate treatments, lactate accumulation in bovine rumen cell suspensions fermenting CN increased by 8 h (13.63 ± 1.84 mmol L−1; p < 0.01) and continued to increase through 24 h (25.78 ± 1.84 mmol L−1; p < 0.01). Conversely, lactate concentrations did not vary over time in ovine cell suspensions fermenting CN (p ≥ 0.51), resulting in less lactate than in bovine suspensions at 8 (1.10 ± 1.84 mmol L−1) and 24 h (1.82 ± 1.84 mmol L−1), respectively (p ≤ 0.02).
The accumulation of propionate and butyrate also differed by species, primarily at the 24 h timepoint (Table 1). There was a trend for differences in propionate by species (p = 0.08), with an effect of treatment (p < 0.01), time (p < 0.01), and a species by treatment by time interaction (p < 0.01). Butyrate concentrations did not differ by species (p = 0.21) or treatment (p = 0.41) but did differ by time (p < 0.01), and there was a species-by-treatment-by-time interaction (p < 0.01). Propionate accumulation was non-detectable or minimal at 2 h (≤1.04 mmol L−1) and peaked at 24 h (25.42–42.87 mmol L−1) for all feed substrates in both bovine and ovine rumen cell suspensions (p < 0.01). Peak propionate accumulation after 24 h of incubation did not differ between species for HY (p ≥ 0.18). Propionate accumulations at 24 h were 36–44% greater in bovine rumen cell suspensions than in ovine suspensions fermenting feed substrate treatments including both hay and corn (p < 0.01), whereas this difference was only 18% in suspensions fermenting CN (p < 0.01). Similarly, butyrate concentrations were non-detectable to low through 4 h (≤1.00 mmol L−1) for all substrate treatments, with peak accumulation (4.79–8.17 mmol L−1) at 24 h for both species (p < 0.01). Butyrate accumulation did not differ between species for HY (p ≥ 0.57); however, butyrate was 47–50% greater at 24 h in ovine versus bovine cell suspensions fermenting CN and CH (p < 0.01). There was also a trend for greater butyrate in ovine rumen cell suspensions at 24 h when HC was fermented (p = 0.06).
Total VFA accumulation was also affected by treatment (p < 0.01) and time (p < 0.01), with a trend for an effect of species (p = 0.07) as well as a species by treatment by time interaction (p < 0.01). The accumulation of total VFA increased from 2 h (0.33–3.92 mmol L−1) through 24 h (60.42–80.09 mmol L−1) for all treatments (p < 0.01). While there were no species differences at any timepoint for rumen cell suspensions fermenting either HY or CN (p ≥ 0.28), the accumulation of fermentation end-products at 24 h was 18% greater in bovine than ovine rumen cell suspensions for both CH and HC (p < 0.01).
In contrast, species differences were not apparent for acetate, valerate, and total BCFA. While acetate accumulation differed by treatment (p < 0.01) and time (p < 0.01), acetate accumulation did not differ by species (p = 0.66), with no species affected by treatment-time interaction (p = 0.74). Acetate concentrations were non-detectable or minimal at 2 h (≤1.92 mmol L−1), regardless of species or treatment. There was a treatment-by-time interaction (p < 0.01), with acetate increasing 30–144% by 24 h (22.75–30.74 mmol L−1), depending on substrate treatment (p < 0.01). Although valerate was detected in some cell suspension samples from 2 to 8 h, concentrations were below the limit of quantification (<1.0 mmol L−1) for >75% of samples collected during these timepoints. Final valerate accumulation at 24 h was ≤2.05 mmol L−1 regardless of species or feed substrate treatment. Total BCFA concentrations were below the level of quantification in >85% of samples collected from the 2 h and 4 h timepoints, with final accumulation at 24 h ≤ 2.05 mmol L−1 regardless of species or feed substrate treatment.
Ammonia accumulation differed by species (p = 0.02), treatment (p < 0.01), and time (p < 0.01). There was no species by treatment by time interaction (p = 0.51), but there was a species by treatment interaction (p < 0.01; Table 2). Ammonia accumulation differed between bovine (2.31–10.37 mmol L−1) and ovine (6.65–8.11 mmol L−1) rumen cell suspensions fermenting all treatments, including hay (HY, HC, and CH; p < 0.05), but no interspecies differences (2.72–3.76 mmol L−1) were found in suspensions fermenting CN (p = 0.35). Mean ammonia accumulation across the overall incubation period was 22% lower in ovine than bovine rumen cell suspensions fermenting HY (p < 0.05), but was greater in ovine cell suspensions fermenting HC (126%) and CH (166%) compared with bovine suspensions (p < 0.01).

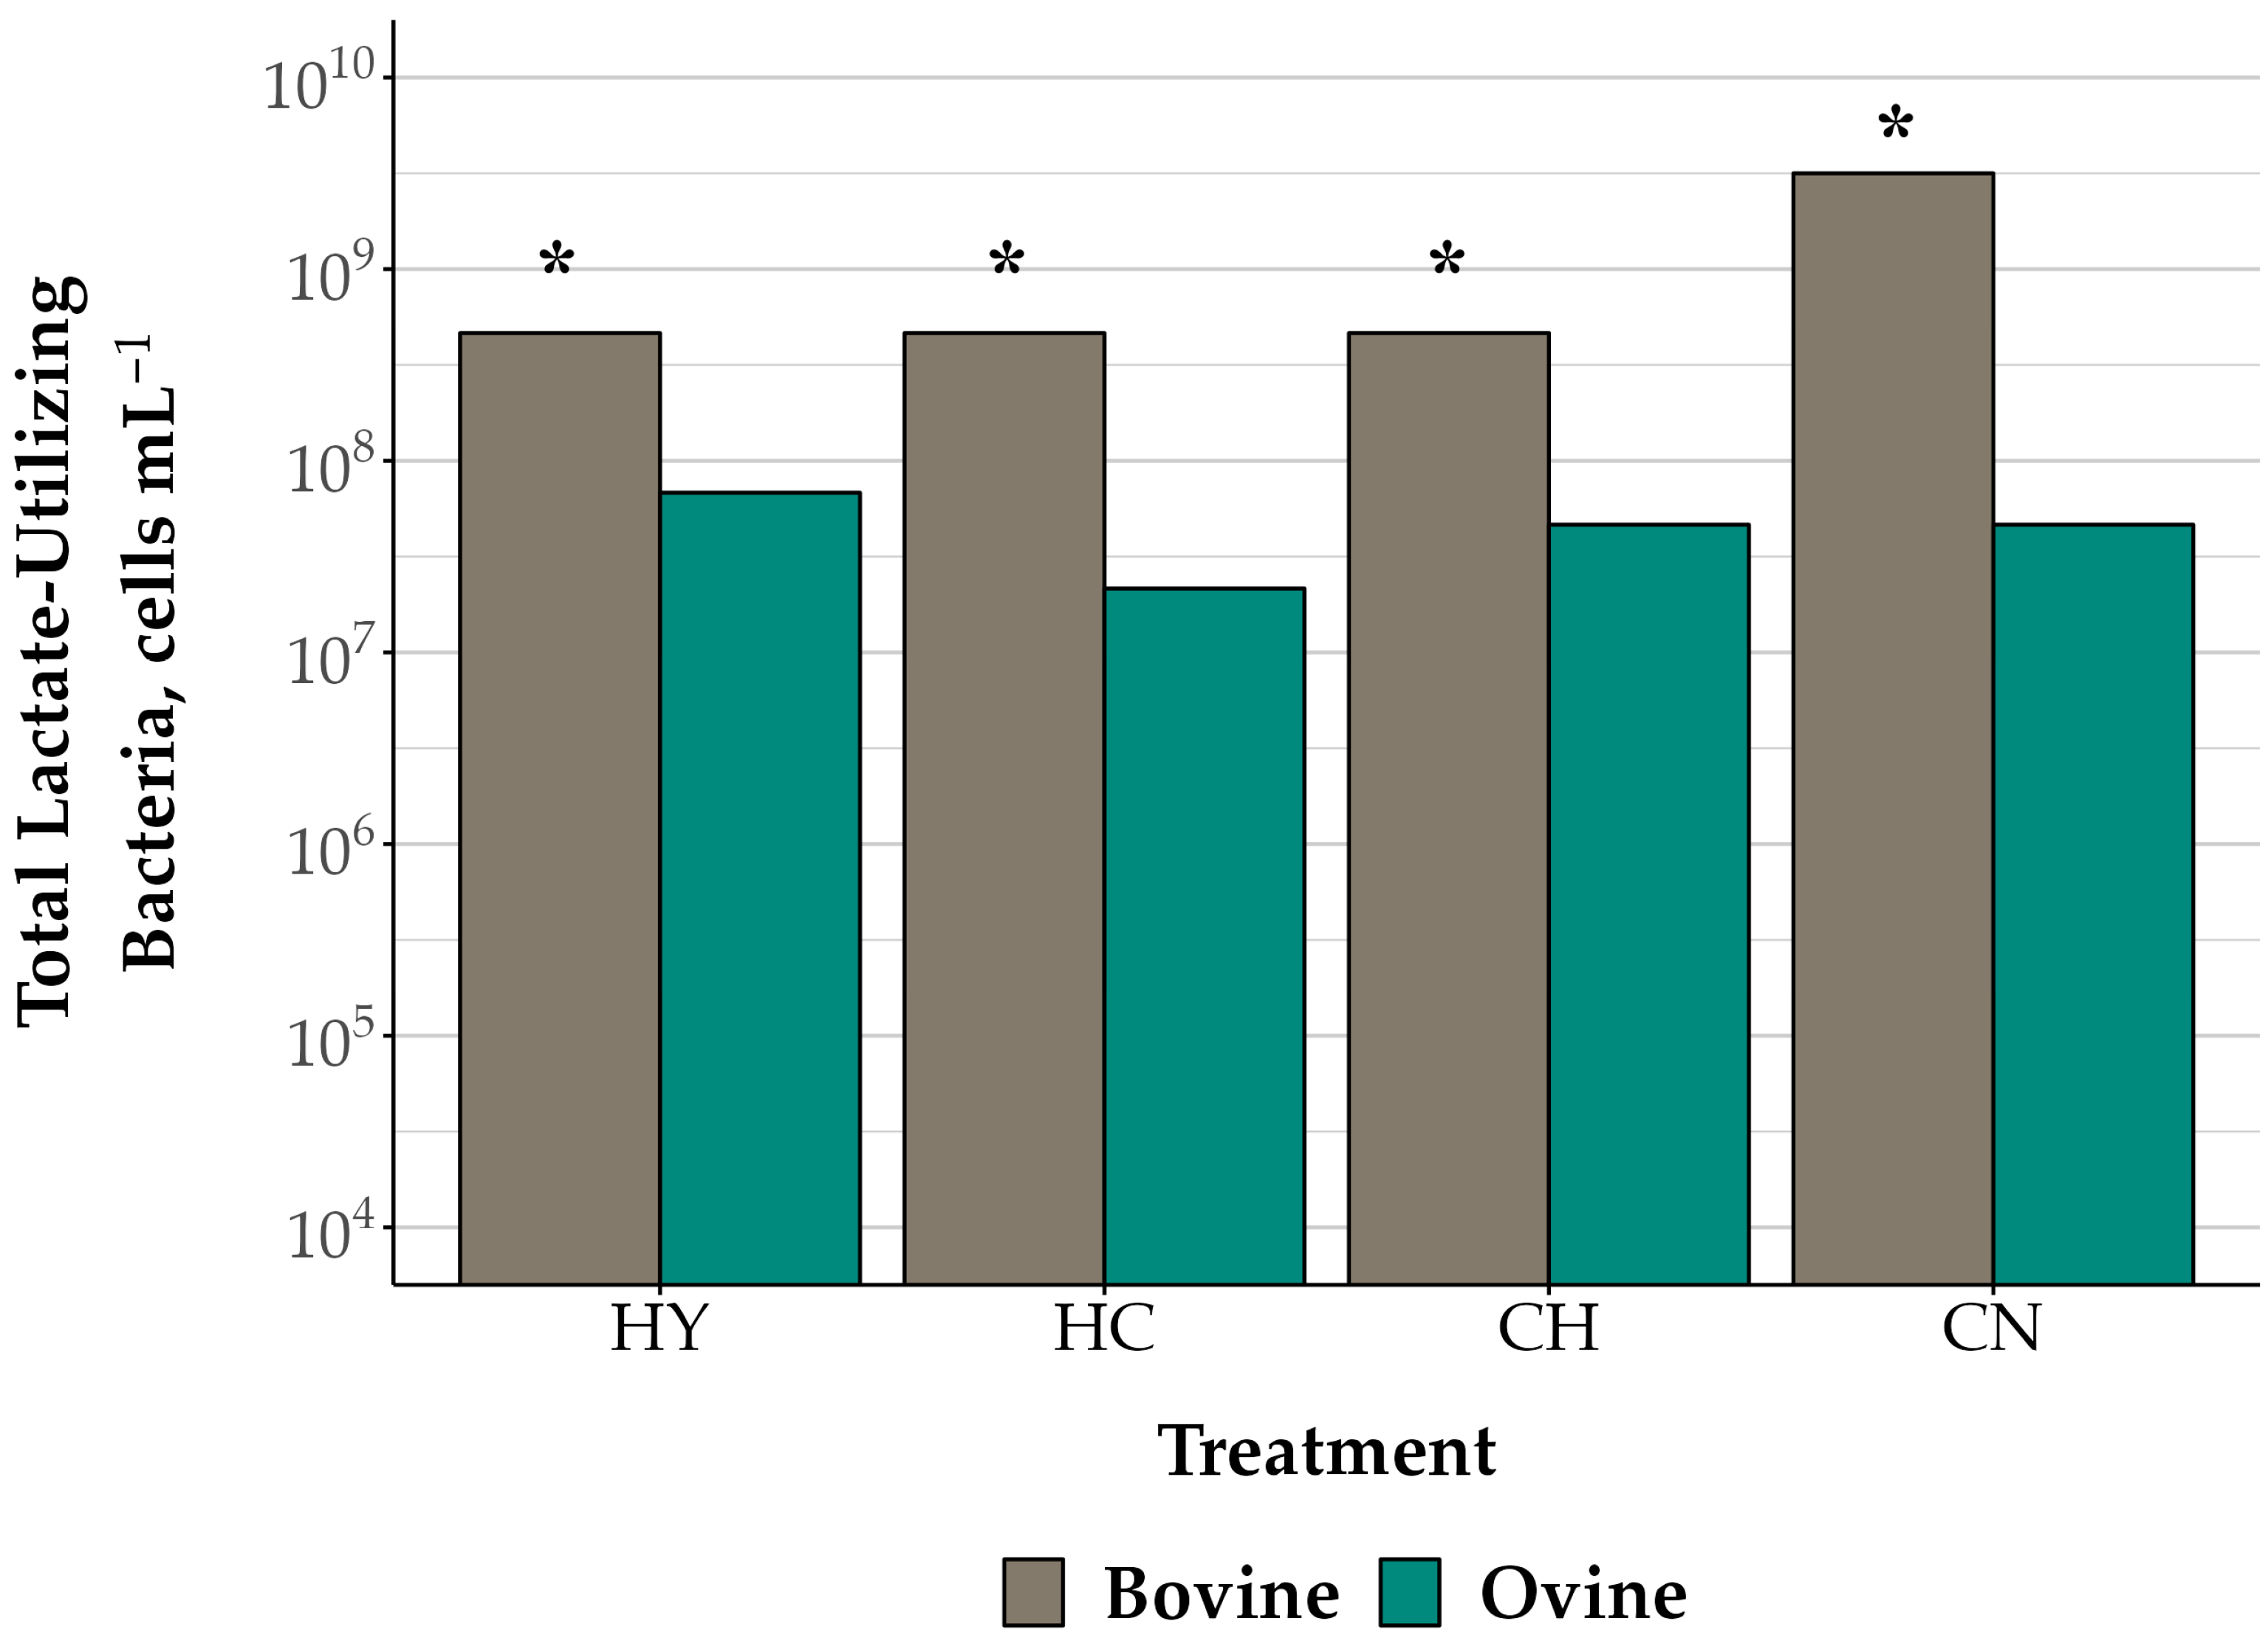
3.2. Rumen Microbiota in Mixed Microorganism Cell Suspensions

Initially, 107 cells mL−1 total amylolytic bacteria were found in both bovine and ovine rumen bacterial cell suspensions (p = 0.64; Table 3). The total viable number of amylolytic bacteria across the incubation period (107–1010 cells mL−1) differed by species (p < 0.01) and treatment (p = 0.05), but not by time (p = 0.20), and there was a trend for a species by treatment by time interaction (p = 0.10; Table 4). Total viable amylolytic bacteria were 100-fold greater in bovine compared with ovine rumen cell suspensions fermenting HY at 8 h (p < 0.01) and remained 10-fold greater in bovine suspensions at 24 h (p < 0.01). The total viable number of amylolytics was 109 cells mL−1 in bovine and ovine cell suspensions fermenting HC at 8 h and bovine cell suspensions at 24 h (p = 1.00), but there was a trend for a 10-fold decrease in ovine suspensions over time (p = 0.07), leading to a species difference for HC at the 24 h timepoint (p < 0.01). When CH was the substrate, amylolytic bacteria in bovine suspensions increased 10-fold from 8 (109 cells mL−1) to 24 h (1010 cells mL−1); however, no change over time was observed in ovine cell suspensions, resulting in a 100-fold difference between species at 24 h (p < 0.01, in all cases). Total amylolytic bacteria increased from 8 to 24 h in both species fermenting CN (bovine: p = 0.07; ovine: p < 0.01), with 10-fold greater total amylolytics detected in bovine suspensions at both timepoints (p < 0.01). A total of 42 predominant amylolytic bacterial isolates (bovine: 20 isolates; ovine: 22 isolates) were obtained from the highest enrichments (final dilution with growth) across both species and all feed substrate treatments. The 16S rRNA gene sequence analysis revealed that all isolates were group D streptococci grouped with the Streptococcus bovis-equinus complex (≥99% identity).
While the initial total amylolytic bacteria did not differ by species, there was a trend for a greater total viable number of the amylolytic bacterial GPC group in bovine (104 cfu mL−1) compared with ovine cell suspensions (102 cfu mL−1; p = 0.08; Table 3). The total viable number of GPC across the incubation period (102–107 cfu mL−1) differed by species (p < 0.01) and time (p = 0.05), but not by treatment (p = 0.11), with a species by treatment by time interaction (p < 0.01; Table 4). After 8 h of incubation, GPC were greater in bovine than ovine rumen cell suspensions for all treatments (HY: 1000-fold; HC: 100-fold; CH: 10,000-fold; CN: 10,000-fold; p < 0.01, in all cases; Table 4). However, by 24 h GPC had increased 1000-fold in ovine cell suspensions fermenting CN and CH, resulting in no species differences at this timepoint (p = 0.15). There were also no species differences for HC at 24 h (p = 0.20), but GPC tended to be greater in bovine versus ovine rumen cell suspensions fermenting HY (p = 0.07).
The initial total viable number of lactate-utilizing bacteria observed was 107 cells mL−1, regardless of species (p = 0.37; Table 3). Lactate-utilizing bacteria across the incubation period (107–1010 cells mL−1) differed by species (p < 0.01) and treatment (p = 0.04), with a trend for a difference in lactate-utilizers by time (p = 0.08). There was no species by treatment by time interaction (p = 0.12; Table 4), but there was a trend for a species by treatment interaction (p = 0.07; Figure 3). Across the incubation period, the total viable number of lactate-utilizing bacteria in bovine cell suspensions fermenting HY, HC, and CH (4.64 × 10⁸ cells mL−1 for all feed substrate treatments) were 10-fold greater in comparison with respective ovine suspensions (HY: 6.81 × 10⁷; HC: 2.15 × 10⁷; CH: 4.64 × 10⁷; cells mL−1; p < 0.01). Total lactate-utilizers were also 10–1000-fold greater in bovine than in ovine rumen cell suspensions fermenting CN over the 24 h incubation period (p < 0.01).
The initial number of total viable cellulolytic bacteria was greater in ovine (106 cells mL−1) than bovine (105 cells mL−1) rumen cell suspensions (p < 0.01; Table 3). During the incubation period, there was a trend for a difference in cellulolytic bacteria by species (p = 0.08). Cellulolytics also differed by feed substrate treatment (p < 0.01) and time (p < 0.01), with a trend for a species by treatment-time interaction (p = 0.09; Table 4). After 8 h of incubation, the total viable number of cellulolytic bacteria (104–106 cells mL−1) did not differ by species in rumen cell suspensions fermenting any feed substrate (p ≥ 0.42 for all treatments). There was also no species difference in cellulolytic bacteria in HY fermentations at 24 h (p = 0.42). In contrast, cellulolytic bacteria declined between 8 and 24 h (10-fold) in bovine cell suspensions fermenting HC and CH (p ≤ 0.01), but no change was found in ovine suspensions (p ≥ 0.39), leading to greater cellulolytic bacteria in ovine versus bovine cell suspensions for both substrate combinations at 24 h (p ≤ 0.02). In cell suspensions fermenting CN, total cellulolytic bacteria decreased 10-fold between 8 and 24 h for both species (p ≤ 0.01), resulting in no difference between species at 24 h (p = 0.11).
There was a trend for a difference in the initial viable number of HAB by species, with greater HAB in bovine rumen cell suspensions (107 cells mL−1) in comparison with ovine cell suspensions (106 cells mL−1; p = 0.10; Table 3). Across the incubation period, the viable number of HAB (107–1010 cells mL−1) differed by species (p < 0.01), with a trend for differences in HAB by time (p = 0.08), but no difference by treatment (p = 0.24). There was, however, a species-by-treatment-by-time interaction (p = 0.02). At 8 h, HAB was greater in bovine than ovine rumen cell suspensions fermenting HY (1000-fold), CH (10-fold), and CN (100-fold; p < 0.01), with HAB remaining 10-fold greater in bovine suspensions at 24 h for these substrates (p ≤ 0.01). In contrast, 10-fold less HAB was found in bovine than ovine rumen cell suspensions fermenting HC at 8 and 24 h (p = 0.01).

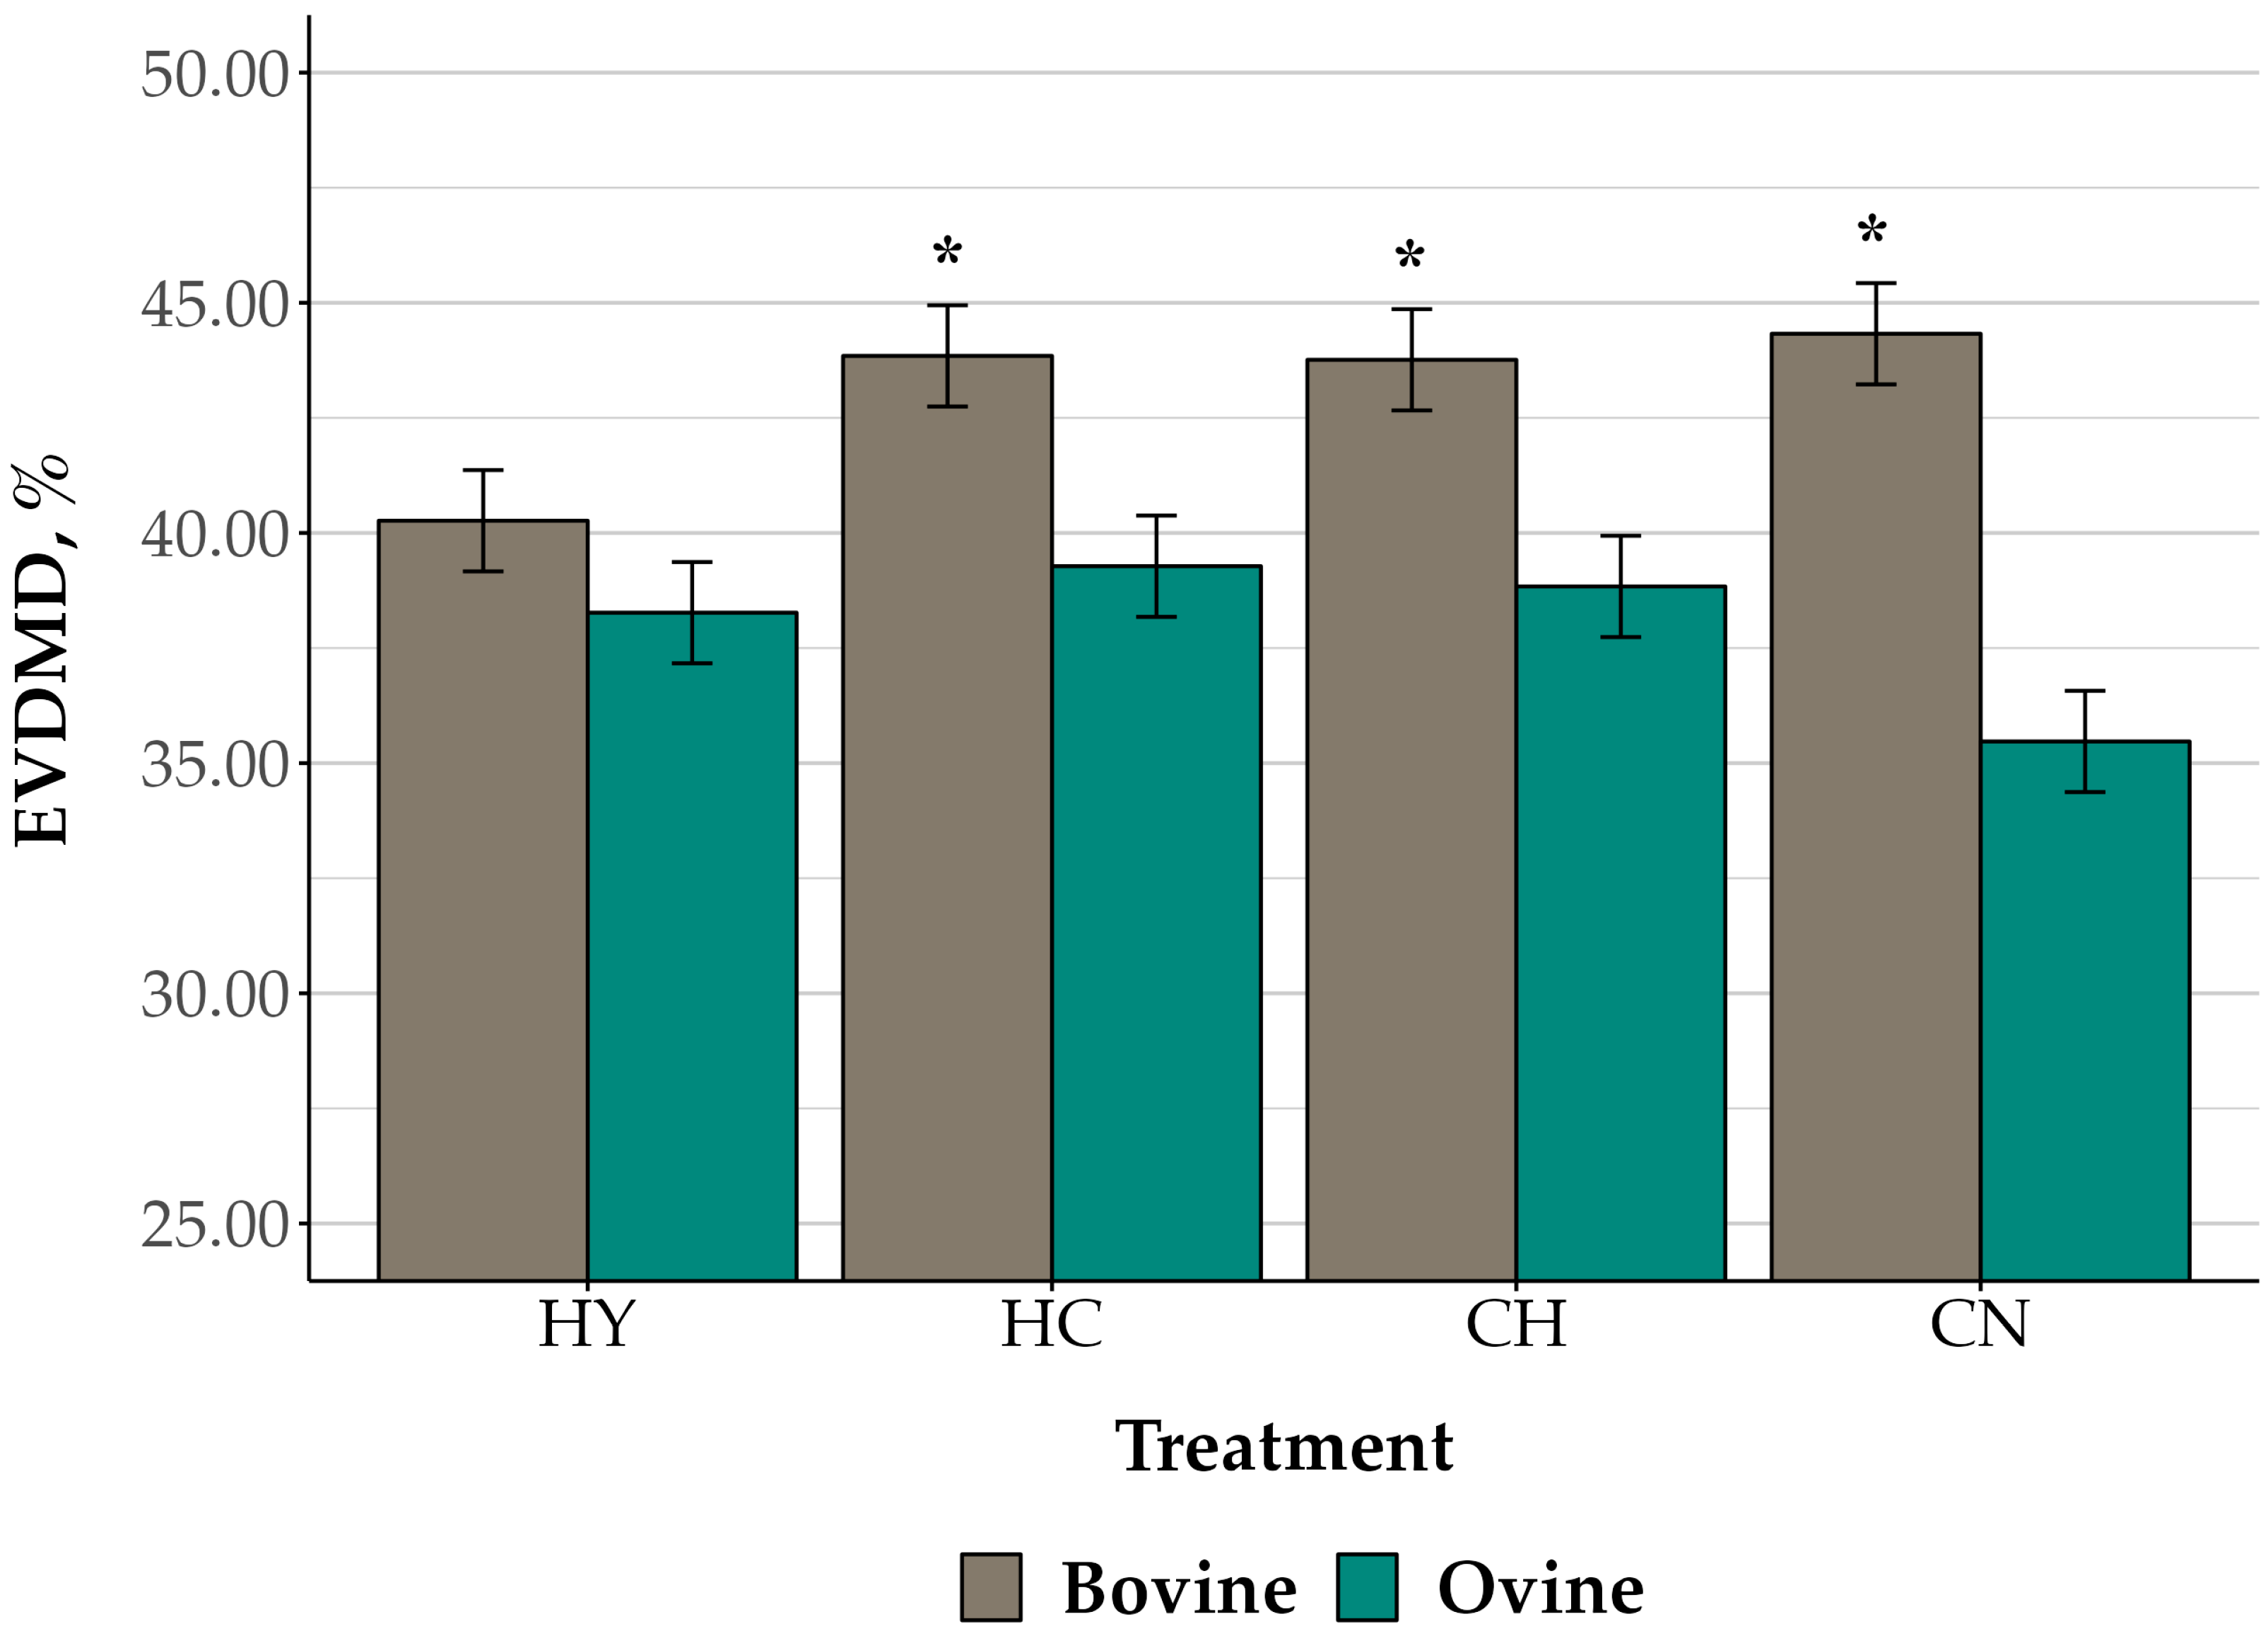
3.3. Ex Vivo Digestibility of Hay and Corn Substrates

After 24 h of incubation, EVDMD differed by species (p < 0.01), with a trend for differences by treatment (p = 0.08). There was also an interaction between species and treatment (p = 0.03; Figure 4). Overall, EVDMD did not differ between species in rumen cell suspensions fermenting HY (bovine: 40.27; ovine: 38.27; SEM: 1.05%; p = 0.20). However, EVDMD was greater for feed substrates fermented in bovine (HC: 43.85; CH: 43.76; CN: 44.33; SEM: 1.05%) than ovine rumen cell suspensions (HC: 39.28; CH: 38.84; CN: 35.47; SEM: 1.05%) for all treatments, including corn (p ≤ 0.02). The EVDMD of bovine rumen cell suspensions fermenting treatments including corn (HC, CH, and CN) did not differ among substrates (p ≥ 0.71), and the EVDMD of each of these treatments was greater than for HY (p = 0.01). In contrast, EVDMD of CN fermented by ovine rumen cell suspensions tended to be lower than for HY (p = 0.08), and there was no difference in EVDMD among feed substrate treatments, including hay (p ≥ 0.25).

4. Discussion

Sheep are often utilized as a model in studies of ruminant animal health and nutrition, and results from cattle and sheep studies are typically referred to interchangeably. However, there are inconsistencies in the current literature regarding the utilization of dietary forages and concentrates in cattle versus sheep [1,2]. Minimal differences between species in rumen microbial community composition at and above the genus and family levels have been reported from two prior 16S rRNA marker-gene surveys [10,37]. However, no previous research has attempted in-depth comparisons of the functional rumen bacterial communities between these species. Additionally, direct interspecies comparative studies evaluating the responses of ruminal bacteria when transitioning from an all-forage to a high-starch diet are lacking. Therefore, the objective of this study was to evaluate the ex vivo fermentation of hay and corn by rumen bacteria harvested from forage-fed cattle and sheep.
Comparison of the rumen microbial community composition, function, and capacity for feed utilization in this study revealed more limited differences between species when hay was the substrate, with more pronounced differences in cell suspensions fermenting corn. The lack of species differences in hay EVDMD in the current study is in agreement with previous research observing no species differences for in situ degradation of hay when comparing cattle and sheep [3,38], but in contrast with the greater in situ digestibility reported in other studies for either cattle [9] or sheep [8]. The comparison of VFA production in this study also aligns with prior interspecies studies of ruminal fermentation, which have found no differences in VFA concentrations in hay-fed animals [9] and greater propionate in cattle versus sheep when fed mixed diets that included a concentrate feedstuff [8,39].
Conversely, EVDMD and VFA production during fermentation of substrates that included corn (which were greater in bovine than ovine rumen cell suspensions) differed from Li et al. [10], which reported greater digestibility and VFA concentrations in sheep-fed diets that included concentrate at a level similar to the CH treatment in this study. While the greater ammonia accumulation in ovine versus bovine suspensions fermenting mixed substrates (hay + corn) was in agreement with results reported by Li et al. [10], ammonia was greater in bovine suspensions fermenting hay, and there was no difference when corn was the sole fermentative substrate. It has been suggested that the intake level of the basal diet and forage quality, specifically NDF concentrations, may influence species differences in ruminal fermentation [1,2,40]. Ruminal protein degradation may also differ between ruminant species [2,10]. Therefore, differences in both ingredient and chemical composition of the basal diet offered to animals and of the fermented substrates may complicate inter-study comparisons and explain, at least in part, the above-noted disparate findings. In the present study, all animals were fed the same basal grass-hay diet. Fermentation by ruminal bacteria was assessed in response to substrates including the same hay fed in the basal diet to which the animals were well-adapted, as well as in response to a challenge with a high-starch corn substrate. The overall concentration of CP in both the hay and corn substrates used in this study was <10% and differed by ~1%, with the primary differences in chemical composition related to fiber and starch.
When ground hay was incubated, ruminal bacteria from cattle and sheep were both able to fully utilize the lactate produced, with increased VFA accumulation over the course of incubation resulting in a slight reduction in pH (−0.33) at 24 h. The viability and activity of rumen cellulolytic bacteria are compromised when pH falls below 6.0 [41,42,43], and with pH above this threshold during hay fermentations, the total viable number of cellulolytic bacteria in cell suspensions fermenting HY remained unchanged from initial levels across the incubation period, regardless of species. Similarities in hay fermentation were observed despite differences in the microbial composition of initial rumen cell suspensions. Initial bovine suspensions contained 10-fold fewer cellulolytic bacteria, 10-fold HAB, and 100-fold greater total viable GPC capable of degrading non-structural carbohydrates.
It should be noted that total lactate accumulation at 4–8 h of incubation in HY fermentations was 40–70% greater in bovine suspensions in comparison with ovine suspensions. Starch concentrations are minimal in cool-season grasses such as the tall fescue utilized as the hay substrate in this study [44]. Therefore, lactate accumulating during hay fermentations was likely produced from the metabolism of other non-structural carbohydrates (i.e., sugars and fructans) that are commonly present in greater quantities [44,45,46]. However, fructan degradation and abundance of fructanolytic bacteria were not evaluated in the current study, and future research is required to better understand interspecies differences in ruminal utilization of forage carbohydrates.
When corn was provided as the only substrate in bovine bacterial cell suspensions, amylolytic and lactate-utilizing bacteria proliferated and VFA accumulated; however, lactate production exceeded the capacity of resident lactate-utilizing bacteria to convert lactate to propionate, resulting in the marked accumulation of lactate at 24 h. Consequently, a more substantial reduction in pH (−0.86) was observed, with pH falling to 5.26, and the total viable number of cellulolytic bacteria declined 100-fold from initial levels after 24 h of incubation. Acute acidosis (pH < 5.0) typically occurs when ruminants abruptly transition from a high-fiber to a high-starch diet in vivo [11,12,47]. Although the transition evaluated in the CN treatment in the current study was most consistent with an acute acidosis challenge, the suspension pH remained above 5.0 due to the heavily buffered nature of the cell suspension medium [11,12,13]. The pH in bovine suspensions fermenting CN was, however, within the range consistent with SARA, and other responses of bovine cell suspensions during corn incubations were also similar to the progression of SARA commonly exhibited in cattle consuming high-grain diets [13]. While there was a reduction in the total viable number of cellulolytic bacteria, cellulolytic bacteria did persist at 103 cells mL−1, lactate-utilizing bacteria continued to proliferate, and VFA accumulated in bovine suspensions across corn incubations.
Streptococcus bovis is considered the primary causative agent of ruminal acidosis, capable of rapid conversion of non-structural carbohydrates, such as starch, into lactic acid [11]. Accordingly, in CN fermentations, GPC proliferated, and S. bovis was identified as the predominant amylolytic bacteria in the current experiment. Bile aesculin azide agar is a commercially available selective medium for Lancefield Group D cocci, such as Enterococcus spp. and some Streptococcus spp., including S. bovis [48]. However, the S. bovis isolates from the starch-based media in this study outnumbered the colony forming units on bile aesculin azide agar. It is clear that the non-selective, custom media type was more reflective of the microbiological changes during rumen acidosis in this particular experiment.
Ruminal acidosis has been reported in sheep [15,16,49], but in-depth direct comparisons of the ruminal environment in response to the abrupt introduction of high-starch feedstuffs in the diet of cattle and sheep have not been evaluated. When mixed rumen microorganisms harvested from forage-fed sheep were incubated with corn in the current study, the pH decline observed in ovine rumen cell suspensions was only one-half that found in bovine suspensions. Lactate accumulation in ovine rumen cell suspensions remained consistently low across the incubation period (<2.6 mmol L−1) and was >90% lower than concentrations detected in bovine suspensions. Unlike in bovine cell suspensions, proliferation of amylolytic bacteria was not observed at 8 h of incubation in ovine cell suspensions, and the viable number of amylolytic bacteria remained 10-fold less in ovine versus bovine suspensions at 24 h. No proliferation of lactate-utilizing bacteria was observed in ovine cell suspensions fermenting CN, whereas in bovine suspensions, the viable number of lactate-utilizers at 24 h was 1000-fold above initial baseline levels. Taken together, these results indicate the rumen microbiota of cattle may be more sensitive to the introduction of corn, which may suggest a greater risk for the development of ruminal acidosis. Castillo-Lopez [50] found an acidosis prevalence of up to 37% during finishing in feedlot cattle, and the incidence of SARA in dairy herds has been reported at 10–33% [51,52,53,54,55,56,57]. Less is known, however, regarding incidence rates at the flock level across the sheep industry under normal management conditions.
It is possible that the species differences in lactate accumulation and consequent pH decline during the fermentation of corn resulted from differences in lactate production. The EVDMD of corn was greater in bovine rumen cell suspensions, indicating there may have been greater starch utilization by amylolytic bacteria. Differences were also found in the total viable number of amylolytic bacteria in cell suspensions fermenting corn, supporting the potential for superior starch utilization by bovine versus ovine rumen bacteria. Although the digestibility of starch itself was not directly evaluated in the current study, the corn substrate utilized was 74% starch on a DM basis. While Streptococcus bovis was identified as the predominant amylolytic bacteria regardless of species, strain-level functional differences can occur within bacterial species [19,58]. Therefore, further research is needed to better understand the functional capacity of the ruminal amylolytic guild in cattle and sheep and its potential contributions to interspecies differences in acidosis susceptibility.
Differences in lactate accumulation in cell suspensions fermenting corn may also indicate differences in lactate utilization efficiencies between ruminant species. The most pronounced difference in fermentation end-products between species was lactate accumulation. In bovine rumen cell suspensions fermenting corn, lactate concentrations at 24 h were ~26 mmol L−1, which was 14 times the concentrations observed in ovine suspensions. Lactate concentrations at 24 h were nearly the equivalent of propionate concentrations in bovine cell suspensions (27.55 mmol L−1), whereas propionate accumulation in ovine suspensions was only 15% lower than in bovine rumen cell suspensions, despite lactate concentrations of <2.0 mmol L−1. Lactate itself is not an energy source for the ruminant animal [11,12,13]. Therefore, excess lactate produced by bovine rumen bacteria in the current study represents a substantial loss of potential energetic end-products (VFA available as an energy source to the host) and indicates a source of ruminal inefficiency in cattle [11,12,13]. In comparison, ovine cell suspensions produced similar total VFA from the corn substrate without incurring the detrimental effects of accumulating lactate and consequent pH decline.
Additionally, while bovine lactate-utilizing bacteria proliferated during corn fermentations, ovine lactate-utilizing bacteria remained at initial baseline levels, resulting in a 1000-fold difference between species at 24 h. Given that ruminal bacteria from sheep were able to produce the same amount of VFA without the need for proliferation of lactate-utilizers, this indicates the resident lactate-utilizing guild of sheep may have superior energetic end-product production efficiency from high-starch diets in comparison with cattle. Multiple pathways contribute to lactate catabolism in the rumen [59], and efficiencies differ across members of the lactate-utilizing guild [60]. Lactate-utilizing bacteria were not isolated in the current study; therefore, these findings merit additional investigation to evaluate potential compositional and functional differences in lactate-utilizing bacteria between cattle and sheep. In addition to traditional isolation and characterization of individual lactate-utilizing bacteria, the integration of culture-independent approaches may provide additional insights.
The ex vivo rumen cell suspension approach utilized in the current study provides several advantages, particularly the washing out of existing rumen metabolites (i.e., VFA, ammonia, etc.) and dietary compounds present in rumen fluid at the time of harvesting to non-detectable levels [19,25]. Additionally, fermentation by-product differences are not due to transport and utilization by the host animal. When treatment responses—or; in the case of this study—species differences—are observed in washed cell suspensions; it can be inferred that the composition or metabolic processes of the microbial cells in response to feed substrate treatments differed between species [61]. This ex vivo system has been successfully implemented as a predictive model of in vivo responses in previous studies of ruminal fermentation [19,25,26,61]. Additionally, responses to hay and corn incubation in bovine cell suspensions in the current study are in agreement with results from previous studies utilizing a similar ex vivo model with rumen cells harvested from forage-fed cattle [19,25]. Thus, future in vivo research is warranted.

5. Conclusions

Overall, this study demonstrated that the microbial community of cattle and sheep differs both in composition and function, resulting in differential capacities to utilize common dietary feed ingredients. Interspecies differences were more limited when hay was the fermentative substrate, with minimal or no differences in abundance of functional guilds, accumulation of lactate and VFA, suspension pH, or substrate digestibility. However, there were marked differences in the response of the rumen microbiota of forage-fed cattle and sheep to the sudden availability of a high-starch feed substrate. When corn was fermented by bovine cell suspensions, lactate accumulated and pH declined, greatly impacting fermentative efficiency. In contrast, little change was observed in ovine cell suspensions. Taken together, these results indicate the rumen microbiota of cattle may be more sensitive to the introduction of corn, whereas the rumen microbial community of sheep may be more resistant to such a dietary insult, with both amylolytic and lactate-utilizing bacteria playing a potential role in this differential response. Further research is needed to better understand the contributions of these guilds to host species differences in utilization of high-fiber and high-starch feedstuffs. In particular, a better understanding of the lactate-utilizing guild within the rumen of sheep may provide insights that could be used to develop new strategies for the prevention and therapeutic management of ruminal acidosis in cattle. Future studies are required to confirm the extent to which the responses to feed substrates observed in this study occur in vivo, as well as the implications for ruminant animal health and production, particularly as it relates to the ability of the rumen microbial community to withstand a rapid transition to a high-concentrate diet.

Supplementary Materials

The following supporting information can be downloaded at: https://www.mdpi.com/article/10.3390/fermentation9110929/s1, Table S1: Liquid Media Composition.

Author Contributions

Conceptualization: J.R.W.-N., D.G.E. and B.E.D. Data Curation: J.R.W.-N., M.D.F., J.L.F. and B.E.D. Formal Analysis: J.R.W.-N. and B.E.D.; Investigation: J.R.W.-N. and B.E.D.; Methodology: J.R.W.-N., D.G.E., M.D.F., T.A.H., J.L.F. and B.E.D. Project Administration: J.R.W.-N. and B.E.D.; Resources: D.G.E., M.D.F. and B.E.D.; Supervision: M.D.F. and B.E.D.; Visualization: J.R.W.-N.; Writing—Original Draft: J.R.W.-N., T.A.H., J.L.F. and B.E.D.; Writing—Review and Editing: J.R.W.-N., D.G.E., M.D.F., T.A.H., J.L.F. and B.E.D. All authors have read and agreed to the published version of the manuscript.

Funding

This research was funded by the USDA-ARS National Program 101, Food Animal Production Project (#: 5042-21000-004-00D). This research was supported in part by the ARS Administrator-Funded Research Associate Program (J.R. Weinert-Nelson; Project #: 0101-88888-016-00D).

Institutional Review Board Statement

The animal study protocols were approved by the Institutional Animal Care and Use Committee at the University of Kentucky (protocols: #2020-3546, 6/2/2020; #2021-3772, 26 March 2021).

Data Availability Statement

Sequence data generated and analyzed during the current study are available in GenBank at: https://www.ncbi.nlm.nih.gov/genbank/, Accession numbers: OR076351–OR076387. All other data are available from the authors upon request.

Acknowledgments

The authors acknowledge the technical assistance of Matthew Hamilton and LeeAnn Jacks, University of Kentucky Department of Animal and Food Sciences Sheep Unit, and Jacob Ibarra, USDA-Agricultural Research Service (ARS), Forage-Animal Production Research Unit. The mention of trade names or commercial products in this publication is solely for the purpose of providing specific information and does not imply a recommendation or endorsement by the U.S. Department of Agriculture. USDA is an equal opportunity provider and employer.

Conflicts of Interest

The authors declare no conflict of interest.

References

  1. Chishti, G.A.; Carvalho, P.H.; Pinto, A.C.; Silva, F.A.; Felix, T.L. Efficacy of sheep as a digestibility model for cattle when fed concentrate-based or forage-based diets. Transl. Anim. Sci. 2019, 3, 1106–1111. [Google Scholar] [CrossRef] [PubMed]
  2. van Gastelen, S.; Dijkstra, J.; Bannink, A. Are dietary strategies to mitigate enteric methane emission equally effective across dairy cattle, beef cattle, and sheep? J. Dairy Sci. 2019, 102, 6109–6130. [Google Scholar] [CrossRef] [PubMed]
  3. Prigge, E.C.; Baker, M.J.; Varga, G.A. Comparative digestion, rumen fermentation and kinetics of forage diets by steers and wethers. J. Anim. Sci. 1984, 59, 237–245. [Google Scholar] [CrossRef]
  4. Reid, R.L.; Jung, G.A.; Cox-Ganser, J.M.; Rybeck, B.F.; Townsend, E.C. Comparative utilization of warm-and cool-season forages by cattle, sheep and goats. J. Anim. Sci. 1990, 60, 2986–2994. [Google Scholar] [CrossRef] [PubMed]
  5. Pearson, R.A.; Archibald, R.F.; Muirhead, R.H. A comparison of the effect of forage type and level of feeding on the digestibility and gastrointestinal mean retention time of dry forages given to cattle, sheep, ponies and donkeys. Br. J. Nutr. 2006, 95, 88–98. [Google Scholar] [CrossRef] [PubMed]
  6. O’Mara, F.P.; Coyle, J.E.; Drennan, M.J.; Young, P.; Caffrey, P.J. A comparison of digestibility of some concentrate feed ingredients in cattle and sheep. Anim. Feed Sci. Technol. 1990, 81, 167–174. [Google Scholar] [CrossRef]
  7. Woods, V.B.; Moloney, A.P.; Mulligan, F.J.; Kenny, M.J.; O’Mara, F.P. The effect of animal species (cattle or sheep) and level of intake by cattle on in vivo digestibility of concentrate ingredients. Anim. Feed Sci. Technol. 1990, 80, 135–150. [Google Scholar] [CrossRef]
  8. Siddons, R.C.; Paradine, J. Protein degradation in the rumen of cattle and sheep. J. Sci. Food Agric. 1983, 34, 701–708. [Google Scholar] [CrossRef]
  9. Soto-Navarro, S.A.; Lopez, R.; Sankey, C.; Capitan, B.M.; Holland, B.P.; Balstad, L.A.; Krehbiel, C.R. Comparative digestibility by cattle versus sheep: Effect of forage quality. J. Anim. Sci. 2014, 92, 1621–1629. [Google Scholar] [CrossRef]
  10. Li, J.; Yan, H.; Chen, J.; Duan, C.; Guo, Y.; Liu, Y.; Zhang, Y.; Ji, S. Correlation of Ruminal Fermentation Parameters and Rumen Bacterial Community by Comparing Those of the Goat, Sheep, and Cow In vitro. Fermentation 2022, 8, 427. [Google Scholar] [CrossRef]
  11. Owens, F.; Secrist, D.; Hill, W.; Gill, D. Acidosis in cattle: A review. J. Anim. Sci. 1998, 76, 275–286. [Google Scholar] [CrossRef] [PubMed]
  12. Krause, K.M.; Oetzel, G.R. Understanding and preventing subacute ruminal acidosis in dairy herds: A review. Anim. Feed Sci. Technol. 2006, 126, 215–236. [Google Scholar] [CrossRef]
  13. Nagaraja, T.; Titgemeyer, E. Ruminal acidosis in beef cattle: The current microbiological and nutritional outlook 1, 2. J. Dairy Sci. 2007, 90, E17–E38. [Google Scholar] [CrossRef] [PubMed]
  14. Therion, J.J.; Kistner, A.; Kornelius, J.H. Effect of pH on growth rates of rumen amylolytic and lactilytic bacteria. Appl. Environ. Microbiol. 1982, 44, 428–434. [Google Scholar] [CrossRef]
  15. Commun, L.; Mialon, M.M.; Martin, C.; Baumont, R.; Veissier, I. Risk of subacute ruminal acidosis in sheep with separate access to forage and concentrate. J. Anim. Sci. 2009, 87, 3372–3379. [Google Scholar] [CrossRef] [PubMed]
  16. Gill, H.S.; Shu, Q.; Leng, R.A. Immunization with Streptococcus bovis protects against lactic acidosis in sheep. Vaccine 2000, 18, 2541–2548. [Google Scholar] [CrossRef]
  17. Minuti, A.; Ahmed, S.; Trevisi, E.; Piccioli-Cappelli, F.; Bertoni, G.; Jahan, N.; Bani, P. Experimental acute rumen acidosis in sheep: Consequences on clinical, rumen, and gastrointestinal permeability conditions and blood chemistry. J. Anim. Sci. 2014, 92, 3966–3977. [Google Scholar] [CrossRef]
  18. Stack, R.J.; Hungate, R.E.; Opsahl, W.P. Phenylacetic acid stimulation of cellulose digestion by Ruminococcus albus 8. Appl. Environ. Microbiol. 1983, 46, 539–544. [Google Scholar] [CrossRef]
  19. Harlow, B.E.; Flythe, M.D.; Aiken, G.E. Effect of biochanin A on corn grain (Zea mays) fermentation by bovine rumen amylolytic bacteria. J. Appl. Microbiol. 2017, 122, 870–880. [Google Scholar] [CrossRef]
  20. Russell, J.B.; Strobel, H.J.; Chen, G.J. Enrichment and isolation of a ruminal bacterium with a very high specific activity of ammonia production. Appl. Environ. Microbiol. 1988, 54, 872–877. [Google Scholar] [CrossRef]
  21. Chen, G.; Russell, J.B. More monensin-sensitive, ammonia-producing bacteria from the rumen. Appl. Environ. Microbiol. 1989, 55, 1052–1057. [Google Scholar] [CrossRef] [PubMed]
  22. Mackie, R.; Heath, S. Enumeration and isolation of lactate-utilizing bacteria from the rumen of sheep. Appl. Environ. Microbiol. 1979, 38, 416–421. [Google Scholar] [CrossRef] [PubMed]
  23. FASS. Guide for the Care and Use of Agricultural Animals in Research and Teaching; FASS Inc.: Champaign, IL, USA, 2020. [Google Scholar]
  24. Flythe, M.D. The antimicrobial effects of hops (Humulus lupulus L.) on ruminal hyper ammonia-producing bacteria. Lett. Appl. Microbiol. 2009, 48, 712–717. [Google Scholar] [CrossRef] [PubMed]
  25. Harlow, B.E.; Flythe, M.D.; Aiken, G.E. Biochanin A improves fibre fermentation by cellulolytic bacteria. J. Appl. Microbiol. 2018, 124, 58–66. [Google Scholar] [CrossRef] [PubMed]
  26. Harlow, B.E.; Flythe, M.D.; Klotz, J.L.; Harmon, D.L.; Aiken, G.E. Effect of biochanin A on the rumen microbial community of Holstein steers consuming a high fiber diet and subjected to a subacute acidosis challenge. PLoS ONE 2021, 16, e0253754. [Google Scholar] [CrossRef] [PubMed]
  27. ANKOM Technology. Method 6: Neutral Detergent Fiber in Feeds—Filter Bag Technique (for A200 and A2001); ANKOM Technology: Macedon, NY, USA, 2006; Available online: https://www.ankom.com/analytical-methods-support/fiber-analyzer-a200?f%5B0%5D=field_faq_group%3A89#:~:text=View%20PDF-,Neutral,-Detergent%20Fiber%20Method (accessed on 26 July 2022).
  28. Weinert-Nelson, J.R.; Ely, D.G.; Flythe, M.D.; Hamilton, T.A.; May, J.B.; Ferrell, J.L.; Hamilton, M.C.; LeeAnn Jacks, W.; Davis, B.E. Red clover supplementation modifies rumen fermentation and promotes feed efficiency in ram lambs. J. Anim. Sci. 2023, 101, skad036. [Google Scholar] [CrossRef] [PubMed]
  29. Janda, J.M.; Abbott, S.L. 16S rRNA gene sequencing for bacterial identification in the diagnostic laboratory: Pluses, perils, and pitfalls. J. Clin. Microbiol. 2007, 45, 2761–2764. [Google Scholar] [CrossRef] [PubMed]
  30. Drummond, A.J.; Krearse, M.; Heled, J.; Moir, R.; Thierer, T.; Ashton, B.; Wilson, A.; Stone-Havas, S. Geneious v2.5. 2006. Available online: http://www.geneious.com (accessed on 19 October 2023).
  31. Benson, D.A.; Cavanaugh, M.; Clark, K.; Karsch-Mizrachi, I.; Lipman, D.J.; Ostell, J.; Sayers, E.W. GenBank. Nucleic Acids Res. 2013, 41, D36–D42. [Google Scholar] [CrossRef]
  32. Chaney, A.L.; Marbach, E.P. Modified reagents for determination of urea and ammonia. Clin. Chem. 1962, 8, 130–132. [Google Scholar] [CrossRef]
  33. ANKOM Technology. Method 6: Acid Detergent Fiber in Feeds—Filter Bag Technique (for A200 and A2001); ANKOM Technology: Macedon, NY, USA, 2005; Available online: https://www.ankom.com/analytical-methods-support/fiber-analyzer-a200?f%5B0%5D=field_faq_group%3A89#:~:text=Acid-,Detergent,-Fiber%20Method%20(A200) (accessed on 26 July 2022).
  34. Van Soest, P.J.; Robertson, J.B.; Lewis, B.A. Methods for dietary fiber, neutral detergent fiber, and nonstarch polysaccharides in relation to animal nutrition. J. Dairy Sci. 1991, 74, 3583–3597. [Google Scholar] [CrossRef]
  35. National Research Council. Nutrient Requirements of Dairy Cattle; National Academy Press: Washington, DC, USA, 2001.
  36. Weiss, W.P.; Conrad, H.R.; Pierre, N.S. A theoretically-based model for predicting total digestible nutrient values of forages and concentrates. Anim. Feed Sci. Technol. 1992, 39, 95–110. [Google Scholar] [CrossRef]
  37. Henderson, G.; Cox, F.; Ganesh, S.; Jonker, A.; Young, W.; Janssen, P.H. Rumen microbial community composition varies with diet and host, but a core microbiome is found across a wide geographical range. Sci. Rep. 2015, 5, 14567. [Google Scholar] [CrossRef]
  38. Huntington, J.A.; Givens, D.I. Studies on in situ degradation of feeds in the rumen: 1. Effect of species, bag mobility and incubation sequence on dry matter disappearance. Anim. Feed Sci. Technol. 1997, 64, 227–241. [Google Scholar] [CrossRef]
  39. Norton, B.W.; Pieris, H.; Elliott, R. Fermentation patterns and diet utilization by cattle, sheep and goats given grain or molasses based diets. In Proceedings-Australian Society of Animal Production; Australian Society of Animal Production: Coolangatta, Australia, 1994; Volume 20, p. 182. [Google Scholar]
  40. Colucci, P.E.; Macleod, G.K.; Grovum, W.L.; Cahill, L.W.; McMillan, I. Comparative digestion in cattle and sheep fed different forage to concentrate ratios at high and low intakes. J. Dairy Sci. 1989, 72, 1774–1785. [Google Scholar] [CrossRef] [PubMed]
  41. Russell, J.B.; Dombrowski, D. Effect of pH on the efficiency of growth by pure cultures of rumen bacteria in continuous culture. Appl. Environ. Microbiol. 1980, 39, 604–610. [Google Scholar] [CrossRef] [PubMed]
  42. Shi, Y.; Weimer, P. Response surface analysis of the effects of pH and dilution rate on Ruminococcus flavefaciens FD-1 in cellulose-fed continuous culture. Appl. Environ. Microbiol. 1992, 58, 2583–2591. [Google Scholar] [CrossRef] [PubMed]
  43. Weimer, P.J. Effects of dilution rate and pH on the ruminal cellulolytic bacterium Fibrobacter succinogenes S85 in cellulose-fed continuous culture. Arch. Microbiol. 1993, 160, 288. [Google Scholar] [CrossRef]
  44. Chatterton, N.J.; Harrison, P.A.; Bennett, J.H.; Asay, K.H. Carbohydrate partitioning in 185 accessions of Gramineae grown under warm and cool temperatures. J. Plant Physiol. 1989, 134, 169–179. [Google Scholar] [CrossRef]
  45. Kagan, I.A.; Kirch, B.H.; Thatcher, C.D.; Strickland, J.R.; Teutsch, C.D.; Elvinger, F.; Pleasant, R.S. Seasonal and diurnal variation in simple sugar and fructan composition of orchardgrass pasture and hay in the Piedmont region of the United States. J. Equine Vet. Sci. 2001, 31, 488–497. [Google Scholar] [CrossRef]
  46. Kagan, I.A.; Lawrence, L.M.; Seman, D.H.; Prince, K.J.; Fowler, A.L.; Smith, S.R. Effects of sampling time, cultivar, and methodology on water-and ethanol-soluble carbohydrate profiles of three cool-season grasses in Central Kentucky. J. Equine Vet. Sci. 2018, 61, 99–107. [Google Scholar] [CrossRef]
  47. Britton, R.; Stock, R. Acidosis: A continual problem in cattle fed high grain diets. In Proceedings of Cornell Nutrition Conference for Feed Manufactures; Cornell University: Ithaca, NY, USA, 1989; pp. 8–15. [Google Scholar]
  48. Atlas, R.M. Handbook of Microbiological Media, 3rd ed.; CRC Press: Boca Raton, FL, USA, 2004. [Google Scholar]
  49. Braun, U.; Rihs, T.; Schefer, U. Ruminal lactic acidosis in sheep and goats. Vet. Rec. 1992, 130, 343–349. [Google Scholar] [CrossRef] [PubMed]
  50. Castillo-Lopez, E.; Wiese, B.I.; Hendrick, S.; McKinnon, J.J.; McAllister, T.A.; Beauchemin, K.A.; Penner, G.B. Incidence, prevalence, severity, and risk factors for ruminal acidosis in feedlot steers during backgrounding, diet transition, and finishing. J. Anim. Sci. 2014, 92, 3053–3063. [Google Scholar] [CrossRef] [PubMed]
  51. Morgante, M.; Stelletta, C.; Berzaghi, P.; Gianesella, M.; Andrighetto, I. Subacute rumen acidosis in lactating cows: An investigation in intensive Italian dairy herds. J. Anim. Physiol. Anim. Nutr. 2007, 91, 226–234. [Google Scholar] [CrossRef]
  52. Bramley, E.; Lean, I.J.; Fulkerson, W.J.; Stevenson, M.A.; Rabiee, A.R.; Costa, N.D. The definition of acidosis in dairy herds predominantly fed on pasture and concentrates. J. Dairy Sci. 2008, 91, 308–321. [Google Scholar] [CrossRef] [PubMed]
  53. O’Grady, L.; Doherty, M.L.; Mulligan, F.J. Subacute ruminal acidosis (SARA) in grazing Irish dairy cows. Vet. J. 2008, 176, 44–49. [Google Scholar] [CrossRef]
  54. Kleen, J.L.; Hooijer, G.A.; Rehage, J.; Noordhuizen, J.P.T.M. Subacute ruminal acidosis in Dutch dairy herds. Vet. Rec. 2009, 164, 681–684. [Google Scholar] [CrossRef]
  55. Kleen, J.L.; Upgang, L.; Rehage, J. Prevalence and consequences of subacute ruminal acidosis in German dairy herds. Acta Vet. Scand. 2013, 55, 48. [Google Scholar] [CrossRef]
  56. Atkinson, O. Prevalence of subacute ruminal acidosis (SARA) on UK dairy farms. Cattle Pract. 2014, 22, 1–9. [Google Scholar]
  57. Stefańska, B.; Nowak, W.; Komisarek, J.; Taciak, M.; Barszcz, M.; Skomiał, J. Prevalence and consequence of subacute ruminal acidosis in Polish dairy herds. J. Anim. Physiol. Anim. Nutr. 2017, 101, 694–702. [Google Scholar] [CrossRef]
  58. Zhang, C.; Zhao, L. Strain-level dissection of the contribution of the gut microbiome to human metabolic disease. Genome Med. 2016, 8, 41. [Google Scholar] [CrossRef]
  59. Counotte, G.H.M.; Prins, R.A.; Janssen, R.H.A.M.; Debie, M.J.A. Role of Megasphaera elsdenii in the fermentation of DL-[2-13C] lactate in the rumen of dairy cattle. Appl. Environ. Microbiol. 1981, 42, 649–655. [Google Scholar] [CrossRef] [PubMed]
  60. Fan, Y.; Xia, G.; Jin, Y.; Wang, H. Ambient pH regulates lactate catabolism pathway of the ruminal Megasphaera elsdenni BE2-2083 and Selenomonas ruminantium HD4. J. Appl. Microbiol. 2021, 132, 2661–2672. [Google Scholar] [CrossRef] [PubMed]
  61. Harlow, B.E.; Flythe, M.D.; Kagan, I.A.; Goodman, J.P.; Klotz, J.L.; Aiken, G.E. Isoflavone supplementation, via red clover hay, alters the rumen microbial community and promotes weight gain of steers grazing mixed grass pastures. PLoS ONE 2020, 15, e0229200. [Google Scholar] [CrossRef] [PubMed]
Figure 1. Suspension pH in bovine and ovine rumen bacteria cell suspensions fermenting (a) tall fescue hay, (b) 2:1 hay to corn, (c) 2:1 corn to hay, and (d) corn The data are presented as true means ± SEM. Suspension pH differed by species (p = 0.04), feed substrate treatment (p < 0.01), and time (p < 0.01), and there was a species-by-treatment-by-time interaction (p < 0.01). Asterisks indicate species differences within time points (p ≤ 0.05). A double asterisk indicates a trend for a species difference (p ≤ 0.10).
Fermentation 09 00929 g001
Figure 2. Lactate accumulation in bovine (gray hatched line) and ovine (black solid line) rumen bacteria cell suspensions fermenting (a) tall fescue hay, (b) 2:1 hay to corn, (c) 2:1 corn to hay, and (d) corn. The data are presented as true means ± SEM. Suspension pH differed by species (p = 0.04), feed substrate treatment (p < 0.01), and time (p < 0.01), and there was a species-by-treatment-by-time interaction (p < 0.01). Asterisks indicate species differences within time points (p ≤ 0.05).
Fermentation 09 00929 g002
Figure 3. Total viable lactate-utilizing bacteria in bovine and ovine rumen bacteria cell suspensions fermenting ground tall fescue hay (HY), 2:1 hay to ground corn (CH), 2:1 corn to hay (HC), and corn (CN) The data are presented as true means ± SEM. The total viable number of lactate-utilizing bacteria (average of 8 and 24 h timepoints) differed by species (p < 0.01) and feed substrate treatment (p = 0.04), and there was a trend for a species by treatment interaction (p = 0.08; pooled SEM: 0.20 [log10 transformed). Asterisks indicate species differences within treatments (p ≤ 0.05).
Fermentation 09 00929 g003
Figure 4. Ex vivo dry matter digestibility (EVDMD) of feed substrate treatments fermented in bovine and ovine rumen bacteria cell suspensions. Feed substrate treatments included: ground tall fescue hay (HY), 2:1 hay to ground corn (CH), 2:1 corn to hay (HC), and corn (CN). The data are presented as true means ± SEM. The EVDMD differed by species (p < 0.01), with a trend for differences by treatment (p = 0.08) and an interaction of species and treatment (p = 0.03). Asterisks indicate species differences within treatments (p ≤ 0.05).
Fermentation 09 00929 g004
Table 1. Volatile fatty acid accumulation in bovine and ovine rumen bacteria cell suspensions fermenting ground tall fescue hay (HY), 2:1 hay to ground corn (CH), 2:1 corn to hay (HC), and corn (CN) (true means; n = 3).
VFA, mmol L−1Time, hp-Values
24824SEMSpeciesTRTTimeSpecies × TRT × Time
BovineOvineBovineOvineBovineOvineBovineOvine
Acetate 0.66<0.01<0.010.74
HY0.630.332.963.8111.7013.1629.6328.821.21
HC1.920.005.002.3511.7711.1930.6627.751.21
CH0.860.000.402.988.299.1930.7428.731.21
CN0.330.000.871.386.766.0322.7524.701.21
Propionate 0.08<0.01<0.01<0.01
HY0.00 γ0.76 γ1.98 β4.22 β,γ10.17 β11.14 β27.55 α25.42 α1.17
HC0.33 γ0.88 γ2.53 β,γ3.16 β,γ10.19 β9.70 β37.74 a,α27.71 b,α1.17
CH0.00 γ1.04 γ1.76 β,γ3.76 β,γ8.95 β8.85 β42.87 a,α29.74 b,α1.17
CN0.00 γ0.33 γ1.34 β,γ2.45 β,γ8.48 β6.81 β33.17 a,α28.12 b,α1.17
Butyrate 0.210.41<0.01<0.01
HY0.00 β0.00 β0.67 β1.00 β1.20 β1.46 β4.79 α5.19 α0.48
HC0.33 β0.00 β0.33 β0.53 β1.24 β1.37 β5.23 y,α6.52 x,α0.48
CH0.00 γ0.00 β0.00 γ1.00 β1.19 β1.28 β5.43 b,α8.17 a,α0.48
CN0.00 γ0.00 β0.67 β,γ0.67 β1.30 β1.02 β5.06 b,α7.46 a,α0.48
Total VFA 0.07<0.01<0.01<0.01
HY1.63 δ1.76 δ8.54 γ10.36 γ23.74 β25.76 β63.53 α60.42 α1.99
HC3.92 δ1.88 γ10.46 γ7.26 γ24.35 β22.62 β74.69 a,α63.39 b,α1.99
CH1.53 γ2.04 γ3.47 γ8.75 γ19.70 β20.07 β80.09 a,α67.65 b,α1.99
CN0.33 γ0.67 γ4.21 γ4.49 γ17.96 β14.87 β61.98 α61.29 α1.99
a,b Indicate significant differences between species within timepoints for individual treatments (TRT; p ≤ 0.05). x,y Indicate a trend for differences between species within timepoints for individual TRT (p ≤ 0.10). α,β,γ,δ Indicate significant differences within species between timepoints for individual TRTs (p ≤ 0.05).
Table 2. Ammonia accumulation (mmol L−1) in bovine and ovine rumen bacteria cell suspensions fermenting ground tall fescue hay (HY), 2:1 hay to ground corn (CH), 2:1 corn to hay (HC), and corn (CN) (true means; n = 3).
TreatmentSpeciesp-Values
BovineOvineSpeciesTRTSpecies × TRT
HY10.37 ± 0.78 a8.11 ± 0.78 b0.01<0.01<0.01
HC3.25 ± 1.04 b6.94 ± 0.78 a
CH2.31 ± 0.78 b6.65 ± 0.84 a
CN2.72 ± 0.843.76 ± 0.78
a,b Indicate significant differences between species within treatments (TRT, p ≤ 0.05).
Table 3. Bacterial enumerations in initial bovine and ovine rumen bacteria cell suspensions (true means; n = 3).
Functional Guilds, Cells mL−1SpeciesStatistics
BovineOvineSEMp-Value
Amylolytic2.15 × 1071.00 × 1070.470.64
GPC 5.03 × 104 x9.90 × 102 y0.510.08
Lactate-Utilizing1.00 × 1072.15 × 1070.380.37
Cellulolytic1.00 × 105 b4.64 × 106 a0.24<0.01
HAB 4.64 × 107 x4.64 × 106 y0.330.10
Lancefield Group D Gram-Positive Cocci (GPC) expressed as cfu mL−1. HAB: hyper-ammonia-producing bacteria. a,b Indicate significant differences between species within treatments (TRT; p ≤ 0.05). x,y Indicate a trend for differences between species within TRT (p ≤ 0.10).
Table 4. Bacterial enumerations in bovine and ovine rumen bacteria cell suspensions fermenting ground tall fescue hay (HY), 2:1 hay to ground corn (CH), 2:1 corn to hay (HC), and corn (CN) (true means; n = 3).
Functional Guilds,
Cells mL−1
Time, hp-Values
824SEM
(Log Transformed)
SpeciesTRTTimeSpecies ×
TRT × Time
BovineOvineBovineOvine
Amylolytic <0.010.050.200.10
HY2.15 × 1010 a2.15 × 108 b4.64 × 109 a1.00 × 108 b0.25
HC1.00 × 1091.00 × 1092.15 × 109 a2.15 × 108 b0.25
CH1.00 × 109 α,a1.00 × 108 b1.00 × 1010 β,a1.00 × 108 b0.25
CN4.64 × 108 a4.64 × 107 β,b2.15 × 109 x4.64 × 108 α,y0.25
GPC  <0.010.11<0.01<0.01
HY4.45 × 106 a1.95 × 103 β,b7.79 × 1061.81 × 105 α0.61
HC6.01 × 105 a1.21 × 103 β,b2.40 × 1061.80 × 105 α0.61
CH1.08 × 108 a8.64 × 102 β,b1.38 × 1071.29 × 106 α0.61
CN3.13 × 106 a8.26 × 102 β,b8.30 × 1064.42 × 105 α0.61
Lactate-Utilizing <0.010.040.080.12
HY2.15 × 1081.00 × 1082.15 × 1094.64 × 1070.28
HC4.64 × 1084.64 × 1074.64 × 1082.15 × 1070.28
CH2.15 × 1084.64 × 1071.00 × 1094.64 × 1070.28
CN1.00 × 1094.64 × 1071.00 × 10104.64 × 1070.28
Cellulolytic 0.08<0.01<0.010.09
HY4.64 × 1052.15 × 1054.64 × 1051.00 × 1060.29
HC4.64 × 105 α4.64 × 1054.64 × 104 β,b4.64 × 105 a0.29
CH4.64 × 105 α4.64 × 1062.15 × 104 β,b4.64 × 105 a0.29
CN4.64 × 104 α1.00 × 10⁵ α2.15 × 10³ β1.00 × 10⁴ β0.29
HAB  <0.010.240.080.02
HY1.00 × 1010 a4.64 × 107 b2.15 × 109 a2.15 × 107 b0.36
HC1.00 × 107 β,a2.15 × 108 b2.15 × 109 α,a1.00 × 108 b0.36
CH2.15 × 109 a1.00 × 108 b2.15 × 109 a1.00 × 108 b0.36
CN1.00 × 109 a2.15 × 107 b4.64 × 109 a1.00 × 108 b0.36
Lancefield Group D Gram-Positive Cocci (GPC) expressed as cfu mL−1. HAB: hyper-ammonia-producing bacteria. a,b Indicate significant differences between species within timepoints for individual treatments (TRT; p ≤ 0.05). x,y Indicate a trend for differences between species within timepoints for individual TRT (p ≤ 0.10). α,β Indicate significant differences within species between timepoints for individual TRT (p ≤ 0.05).
Disclaimer/Publisher’s Note: The statements, opinions and data contained in all publications are solely those of the individual author(s) and contributor(s) and not of MDPI and/or the editor(s). MDPI and/or the editor(s) disclaim responsibility for any injury to people or property resulting from any ideas, methods, instructions or products referred to in the content.

