
Food Waste to Bioethanol: Opportunities and Challenges

 ,
, 

Abstract
1. Introduction
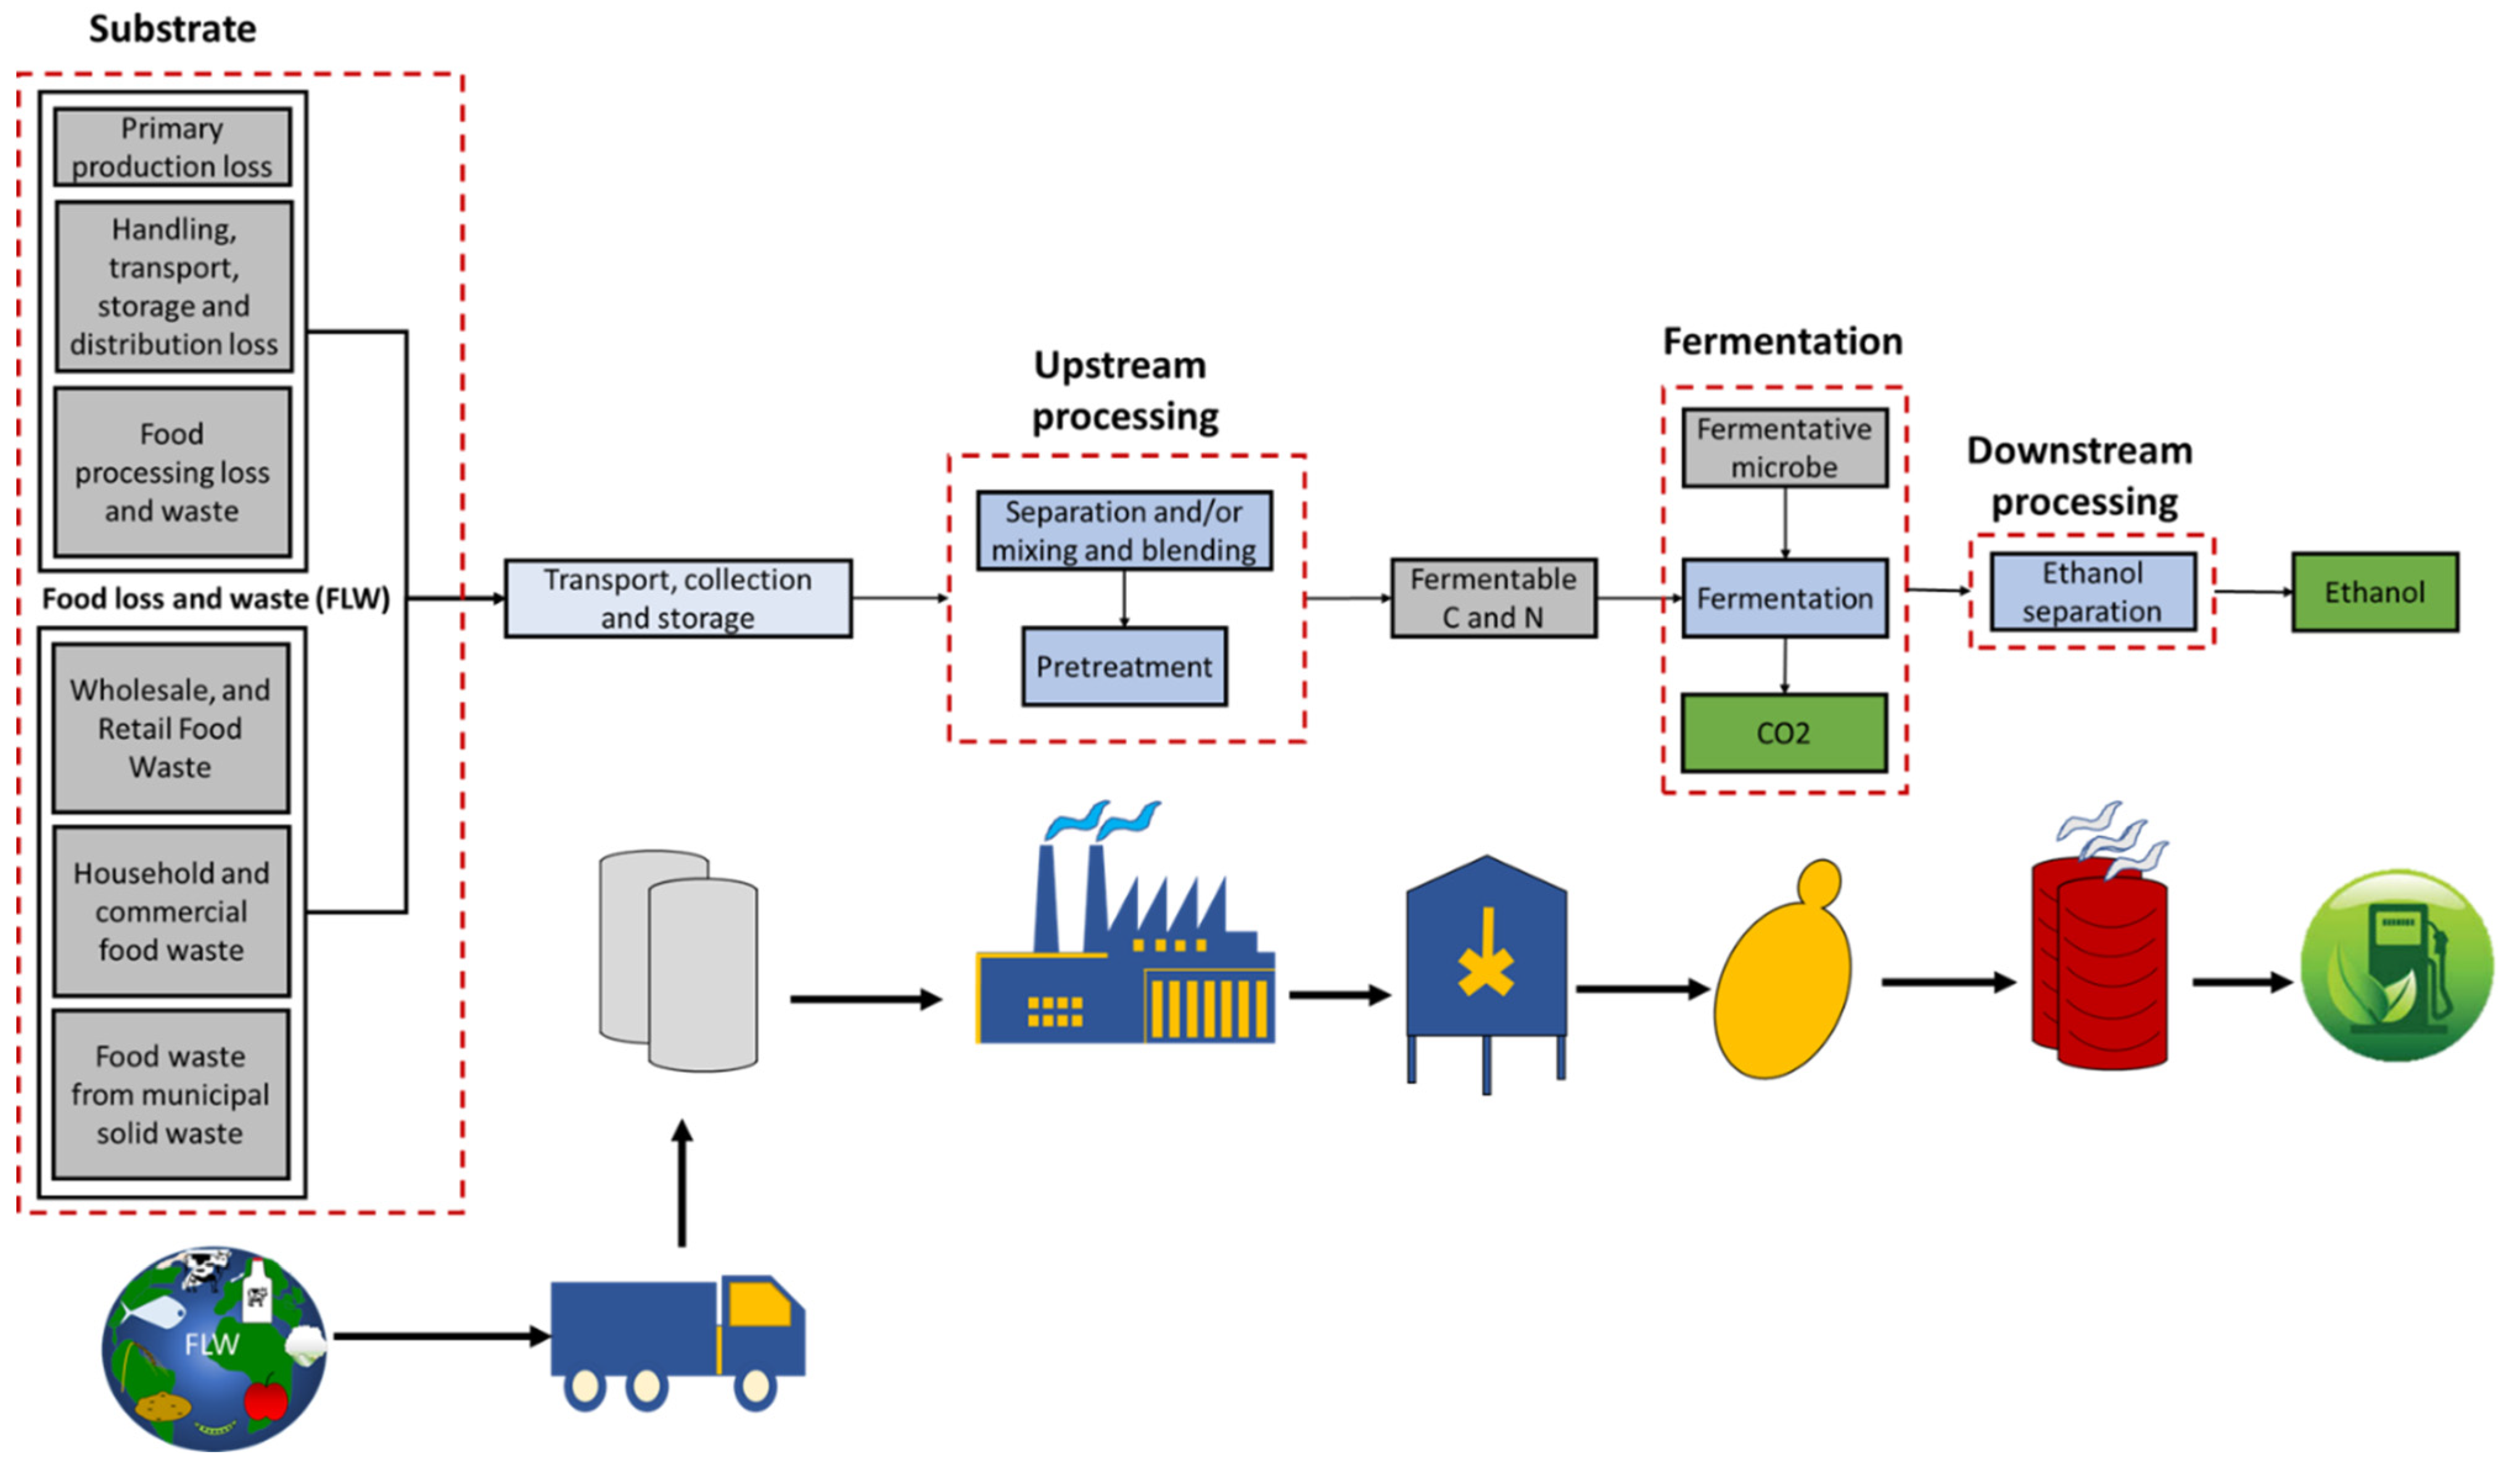
2. Substrate
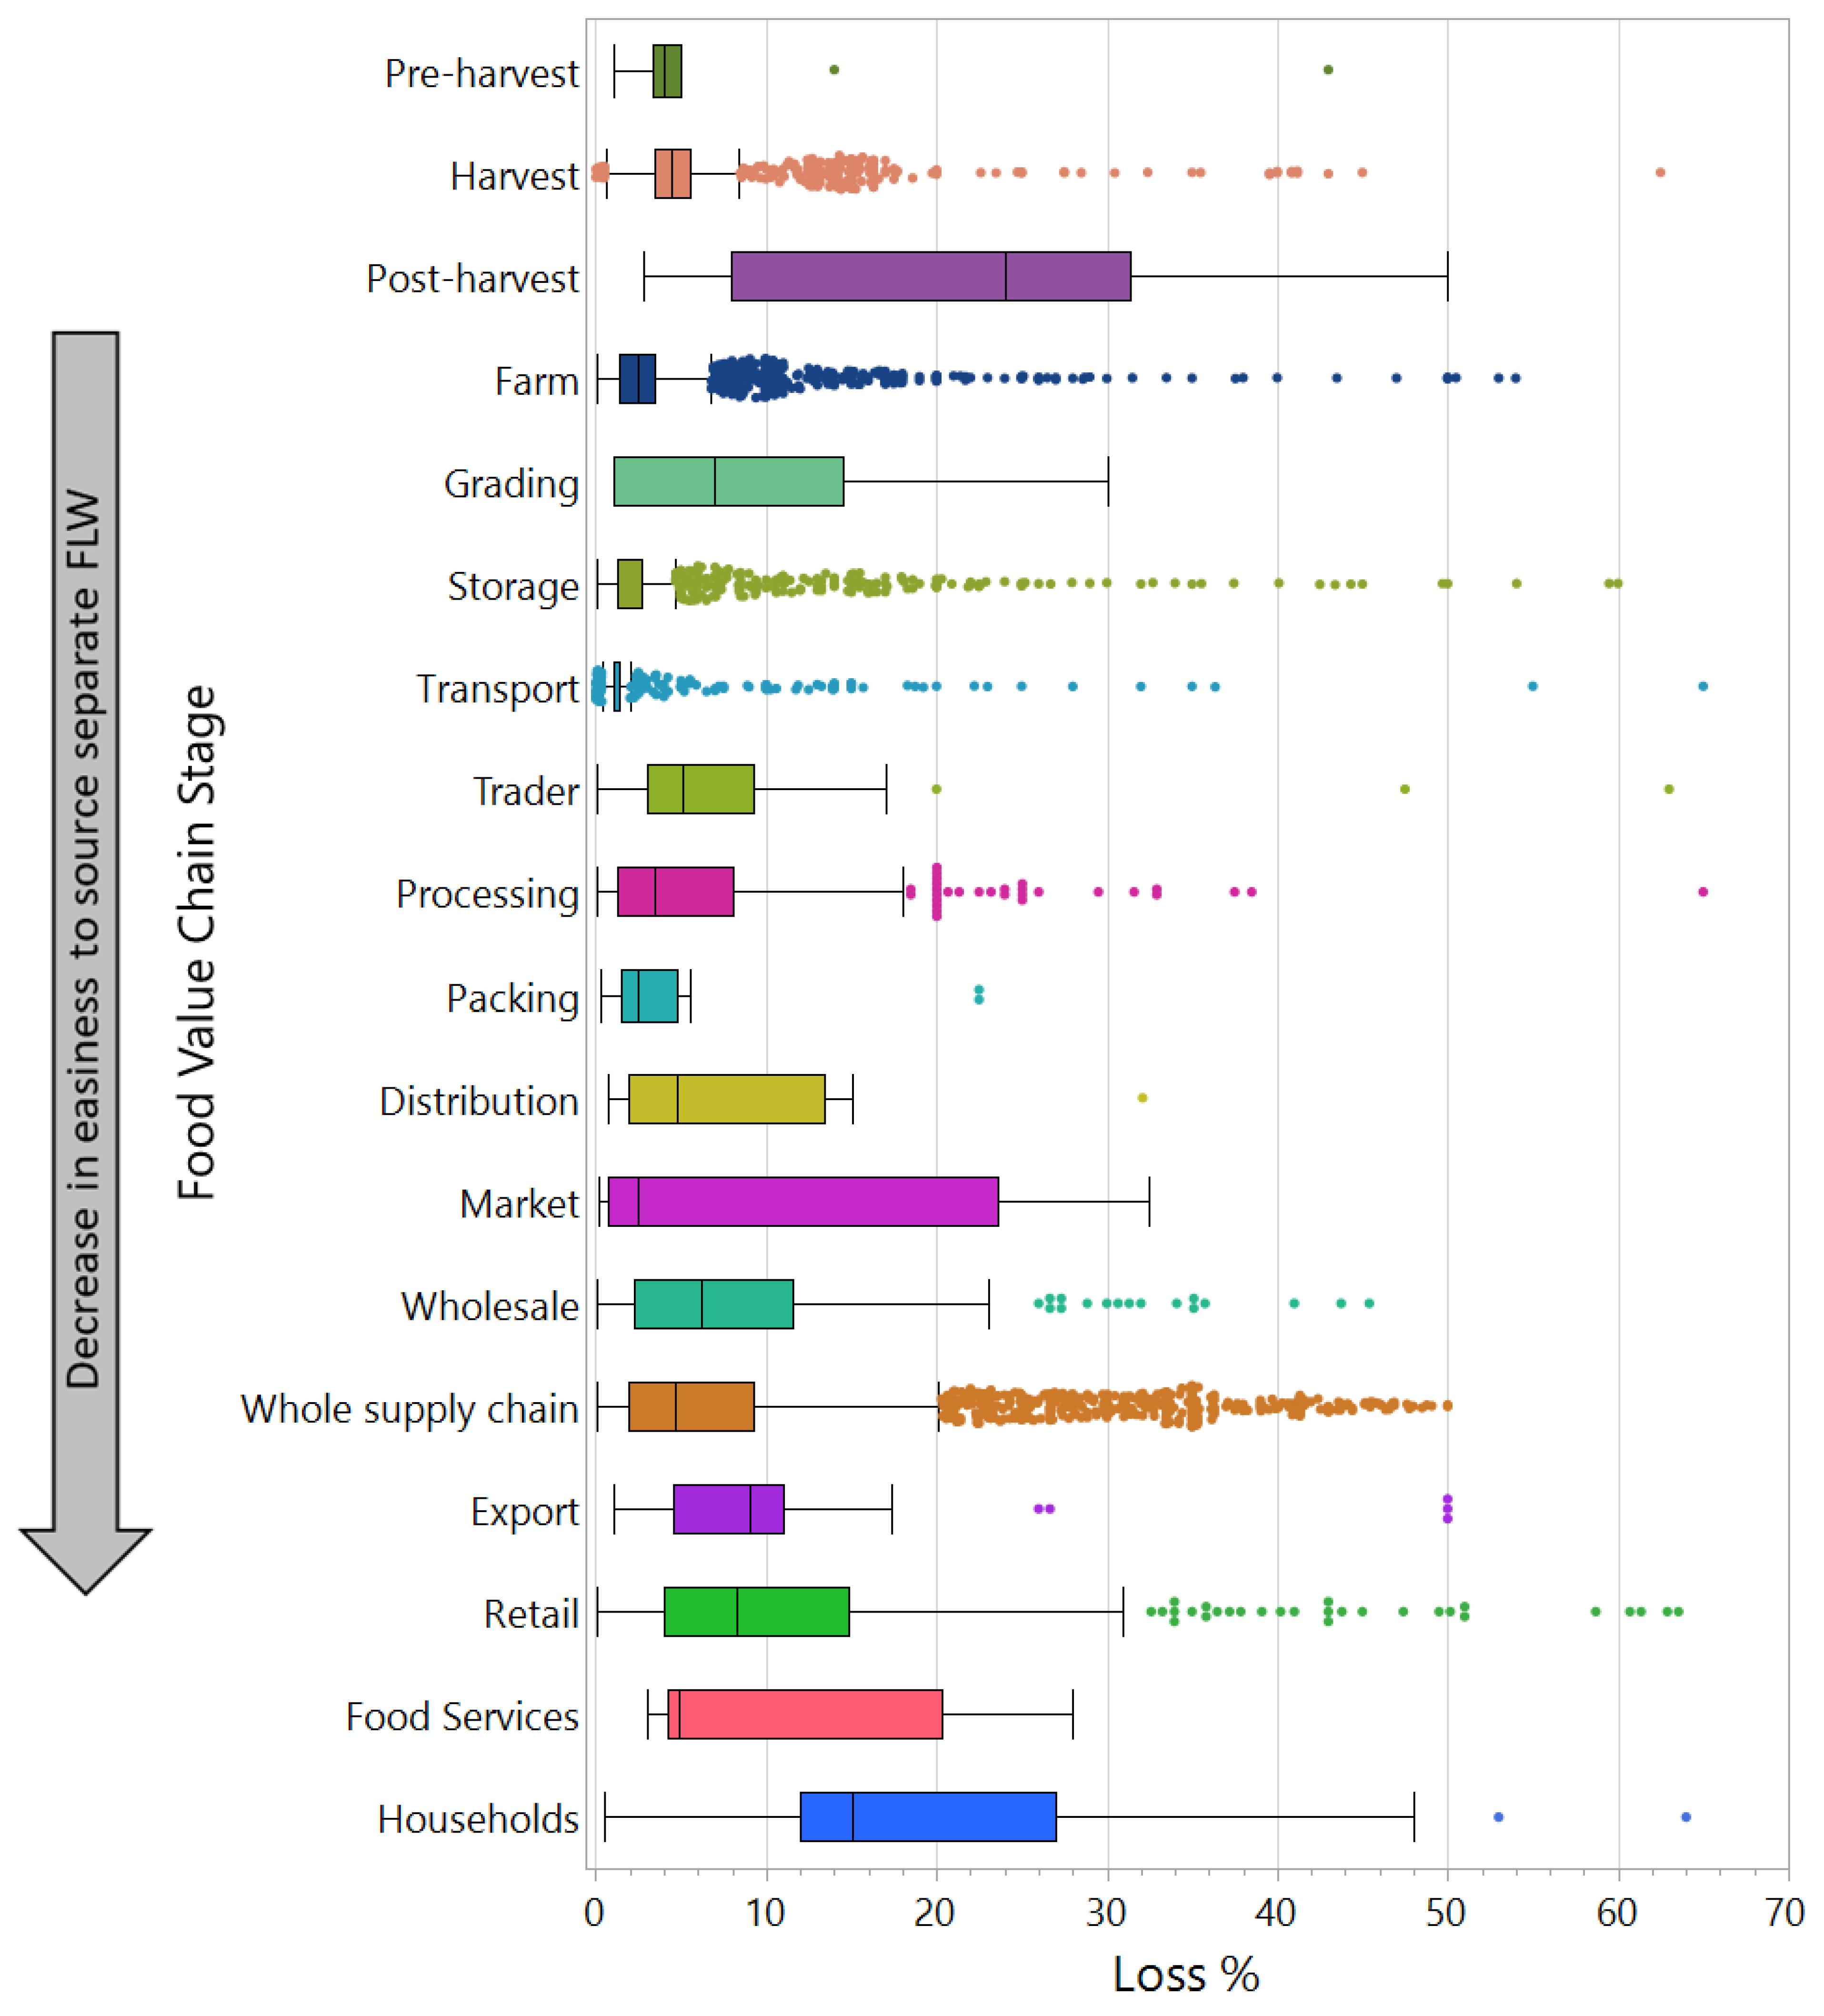
2.1. Food Loss and Waste (FLW)
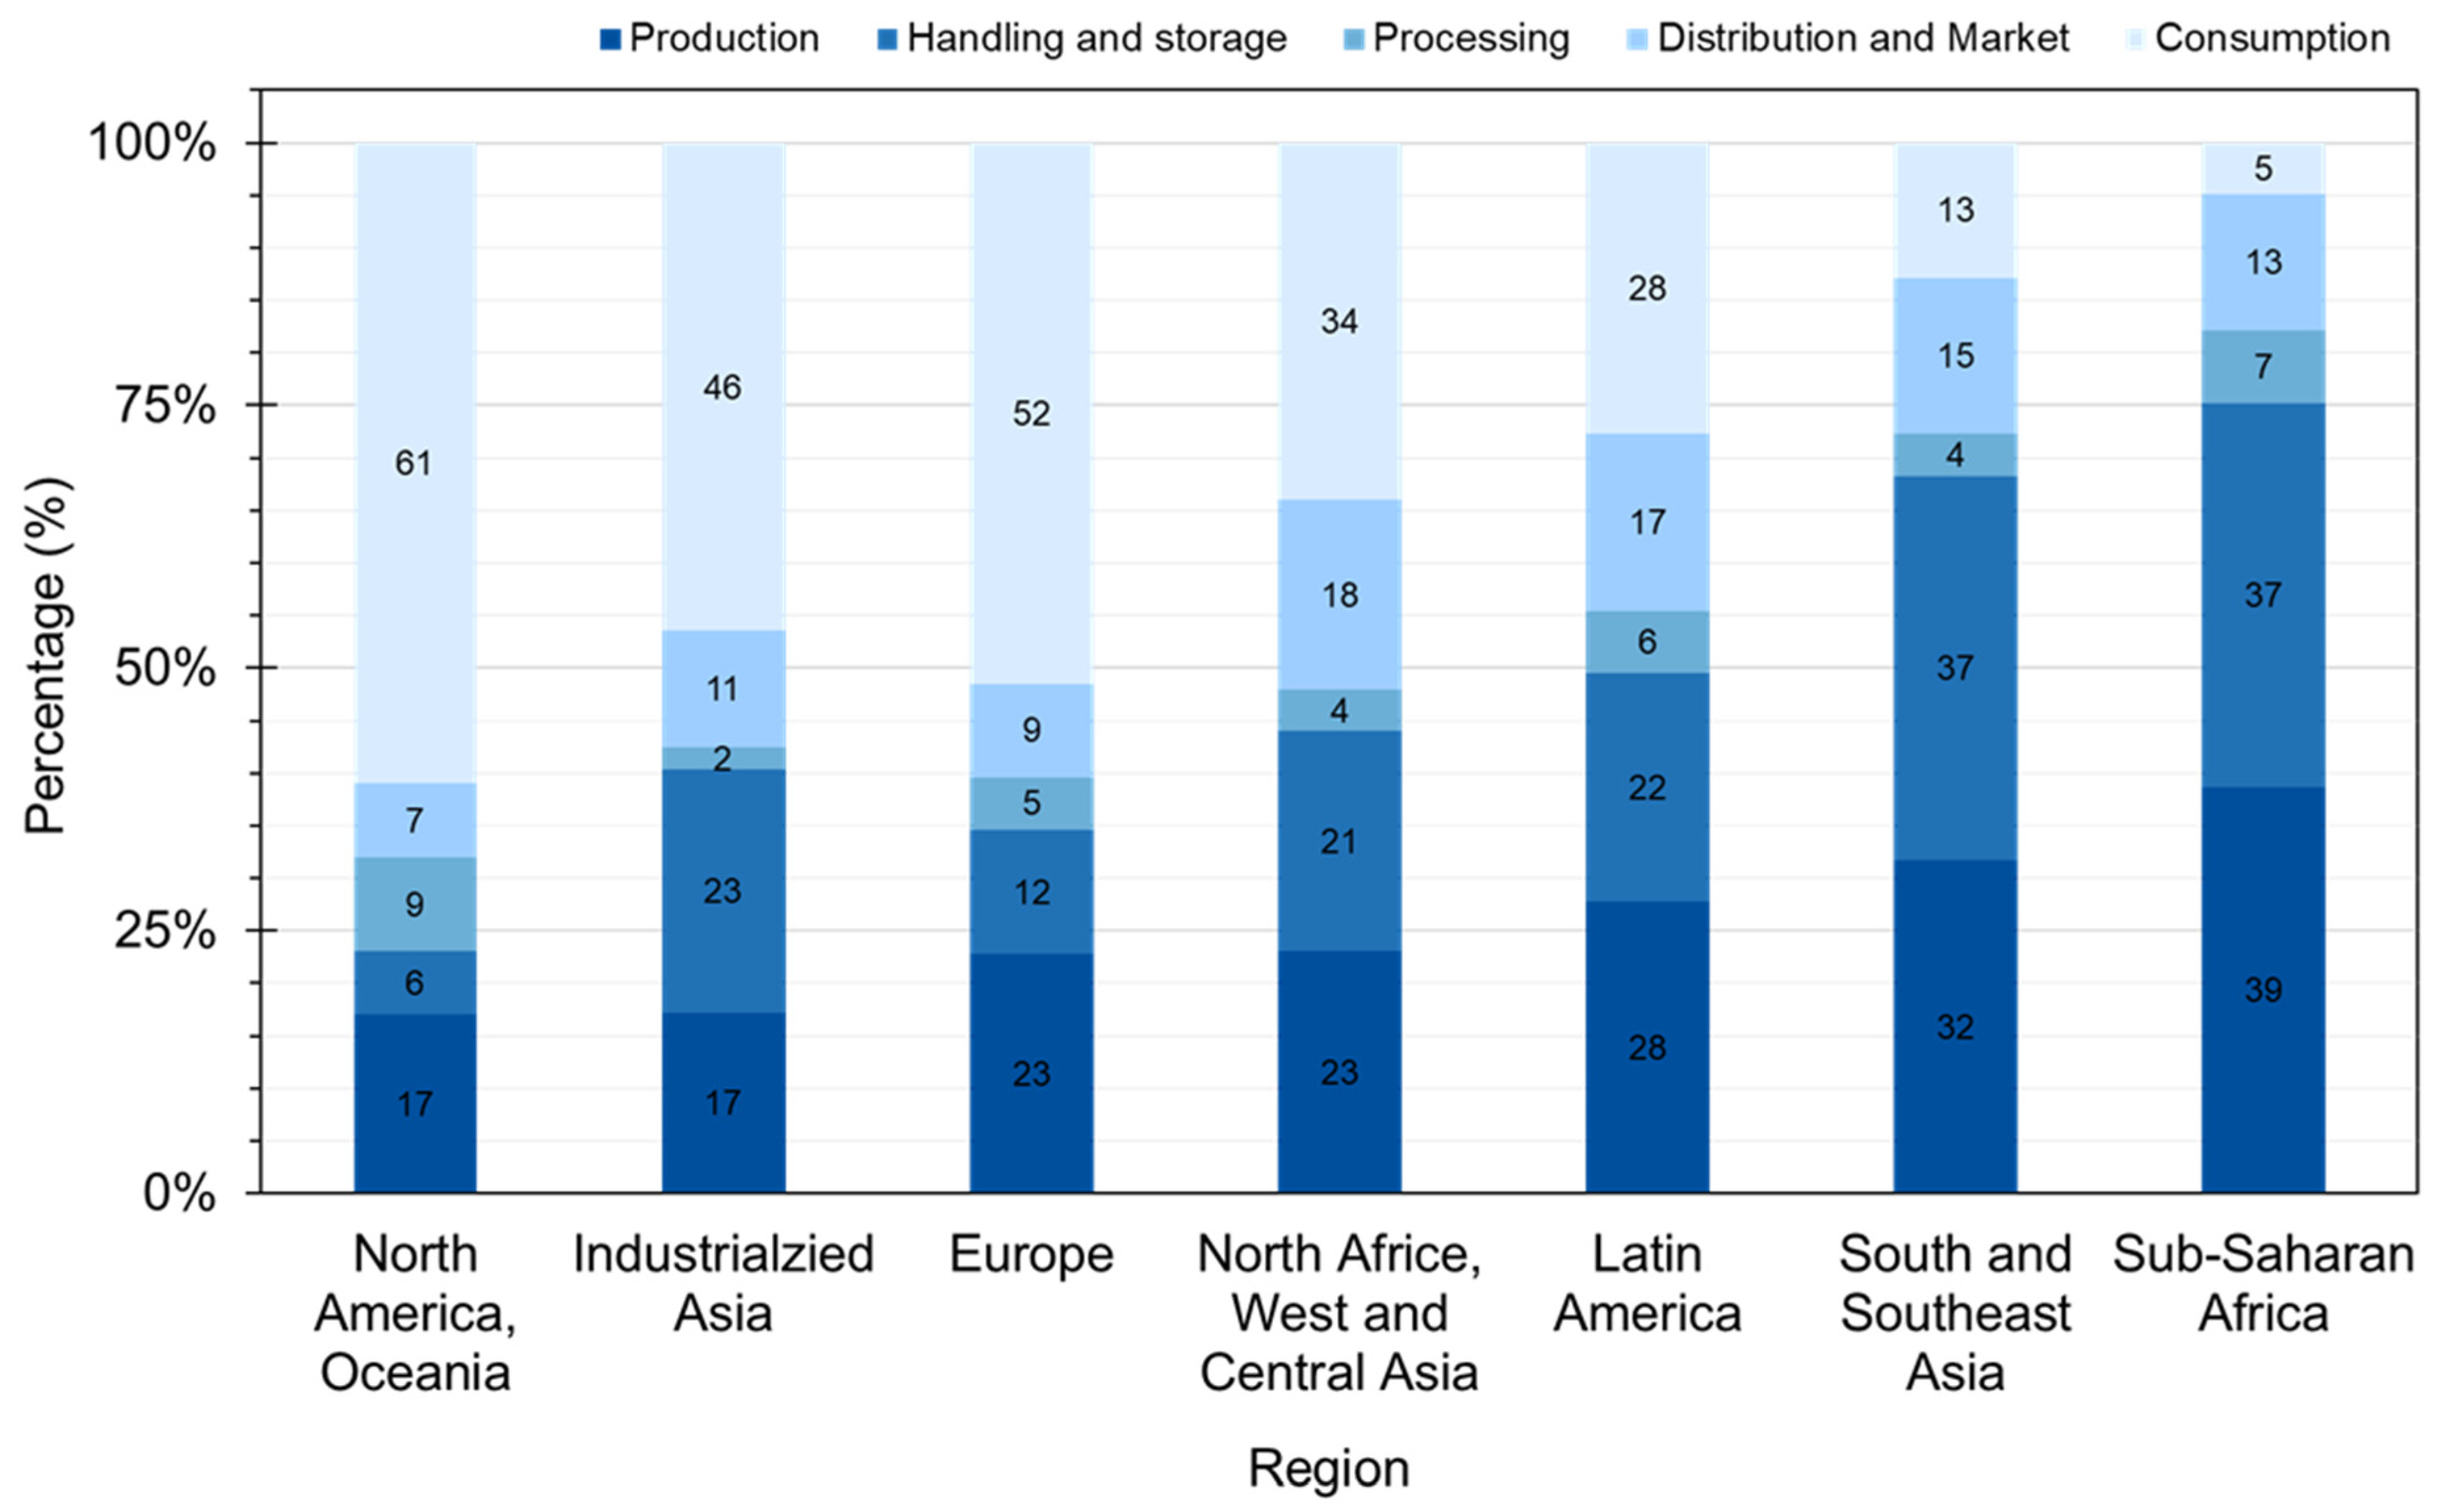
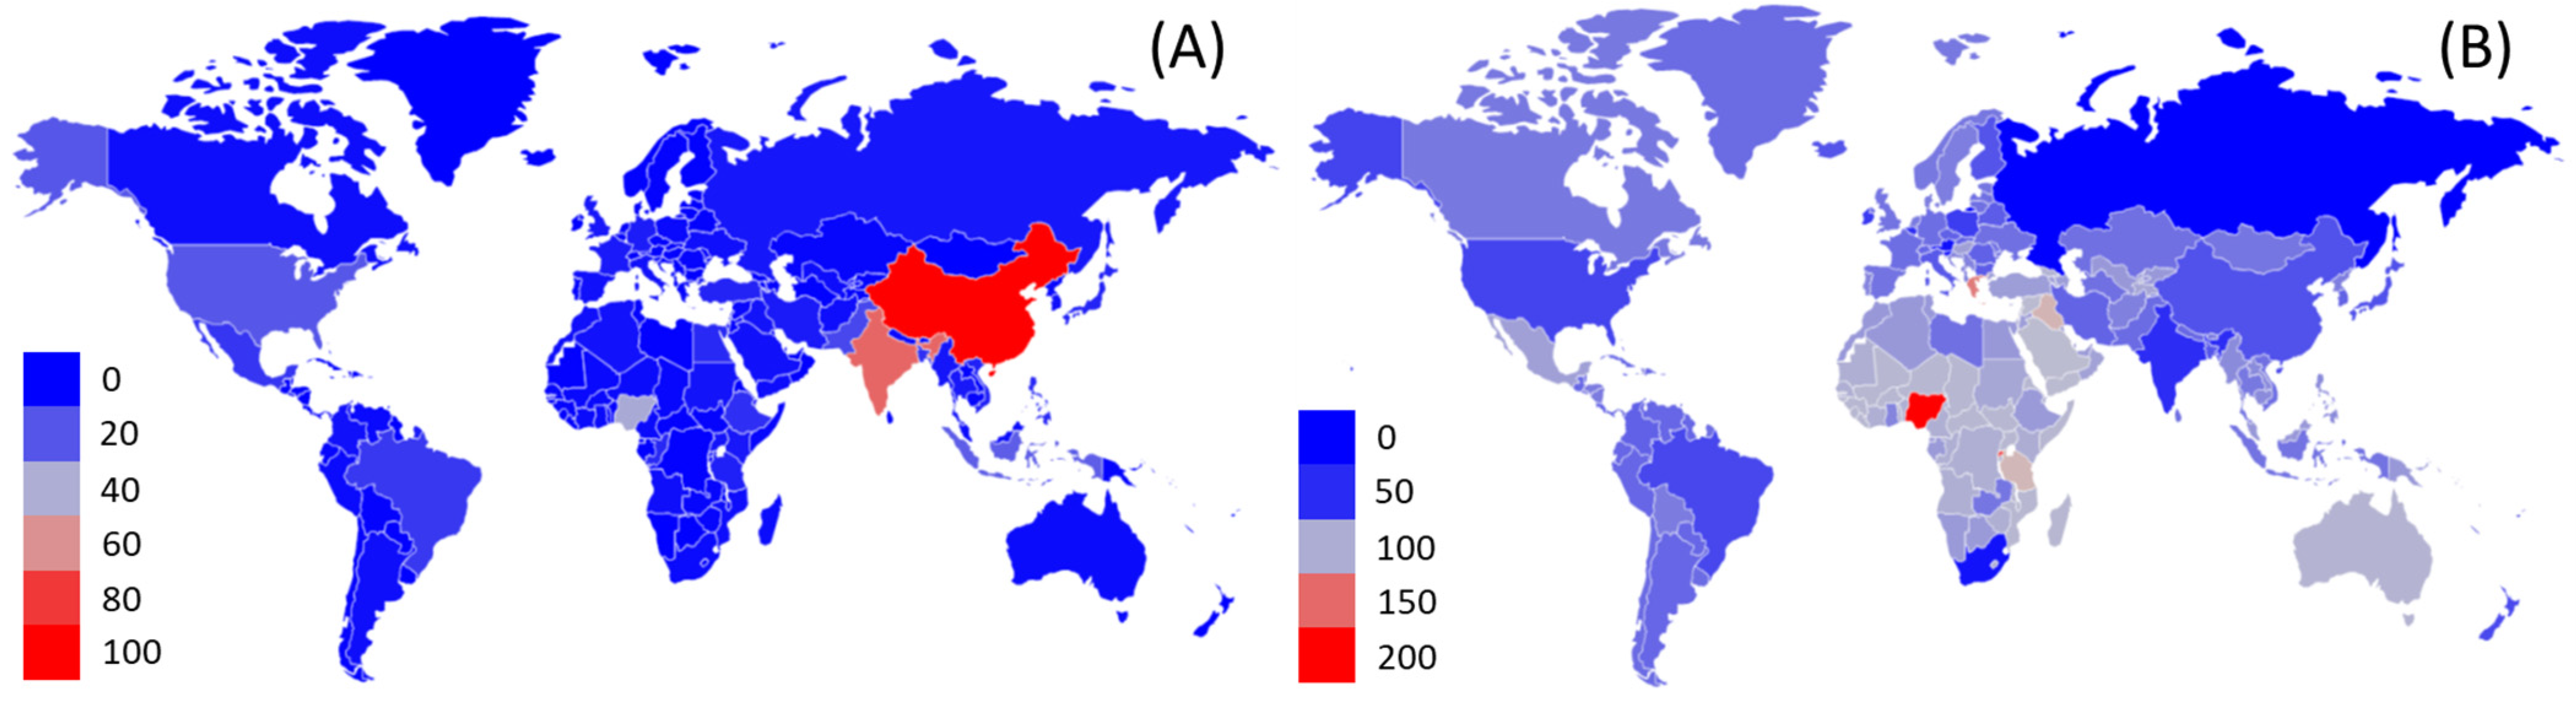
2.2. FLW Production
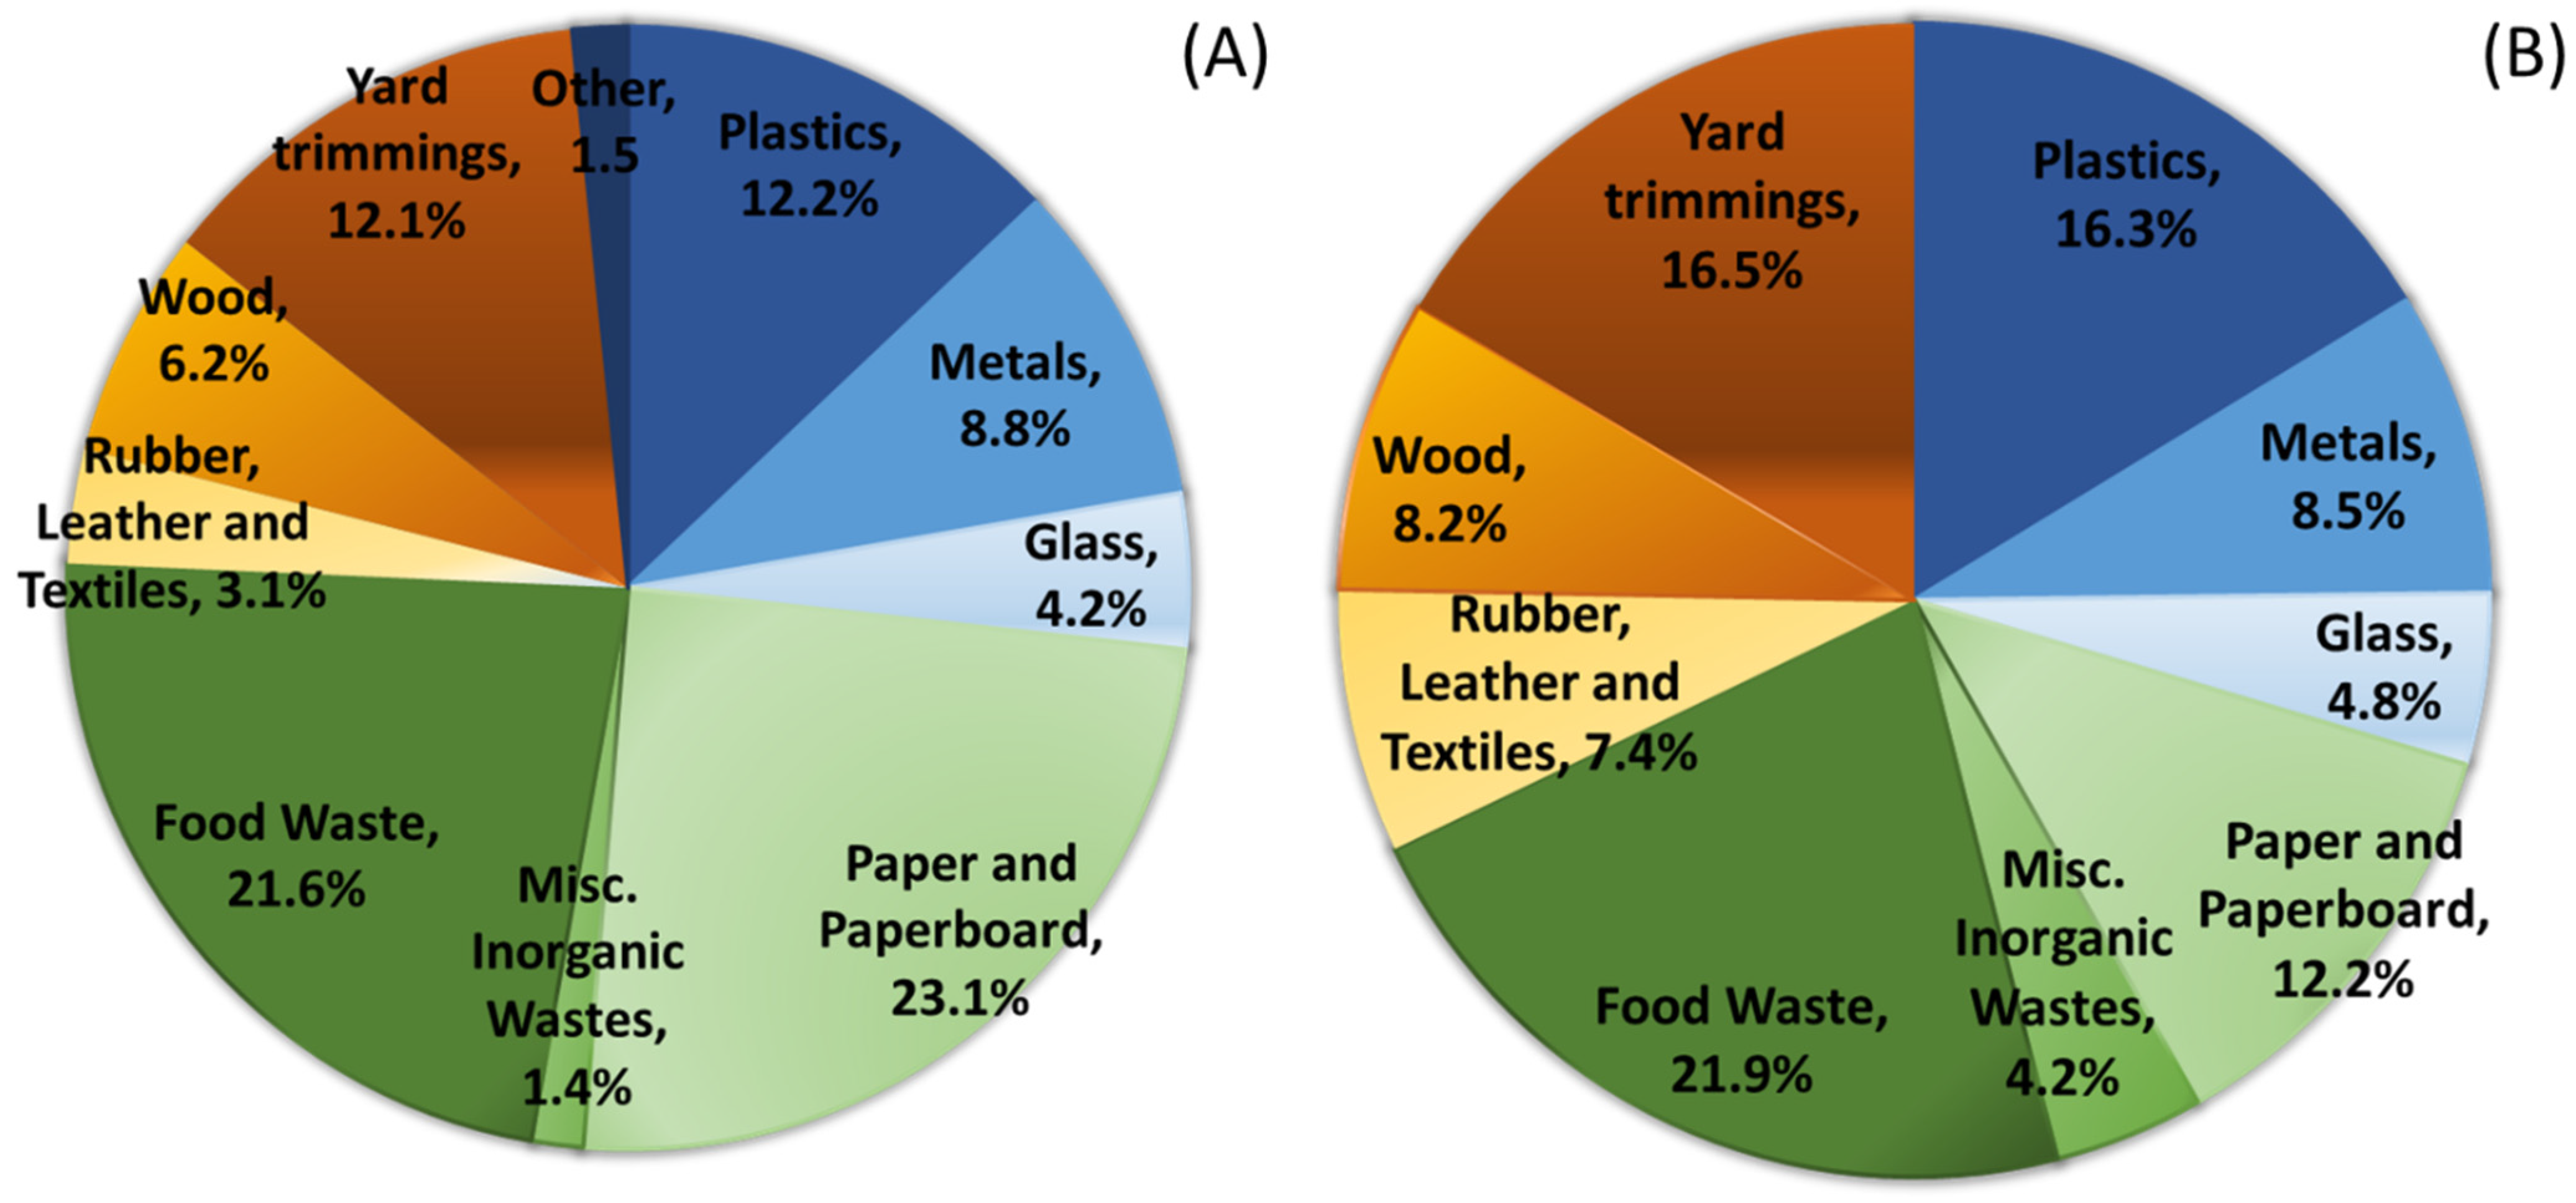
2.3. Composition
2.4. Transportation and Storage
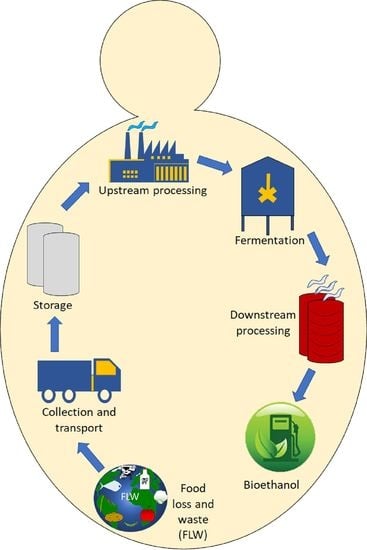
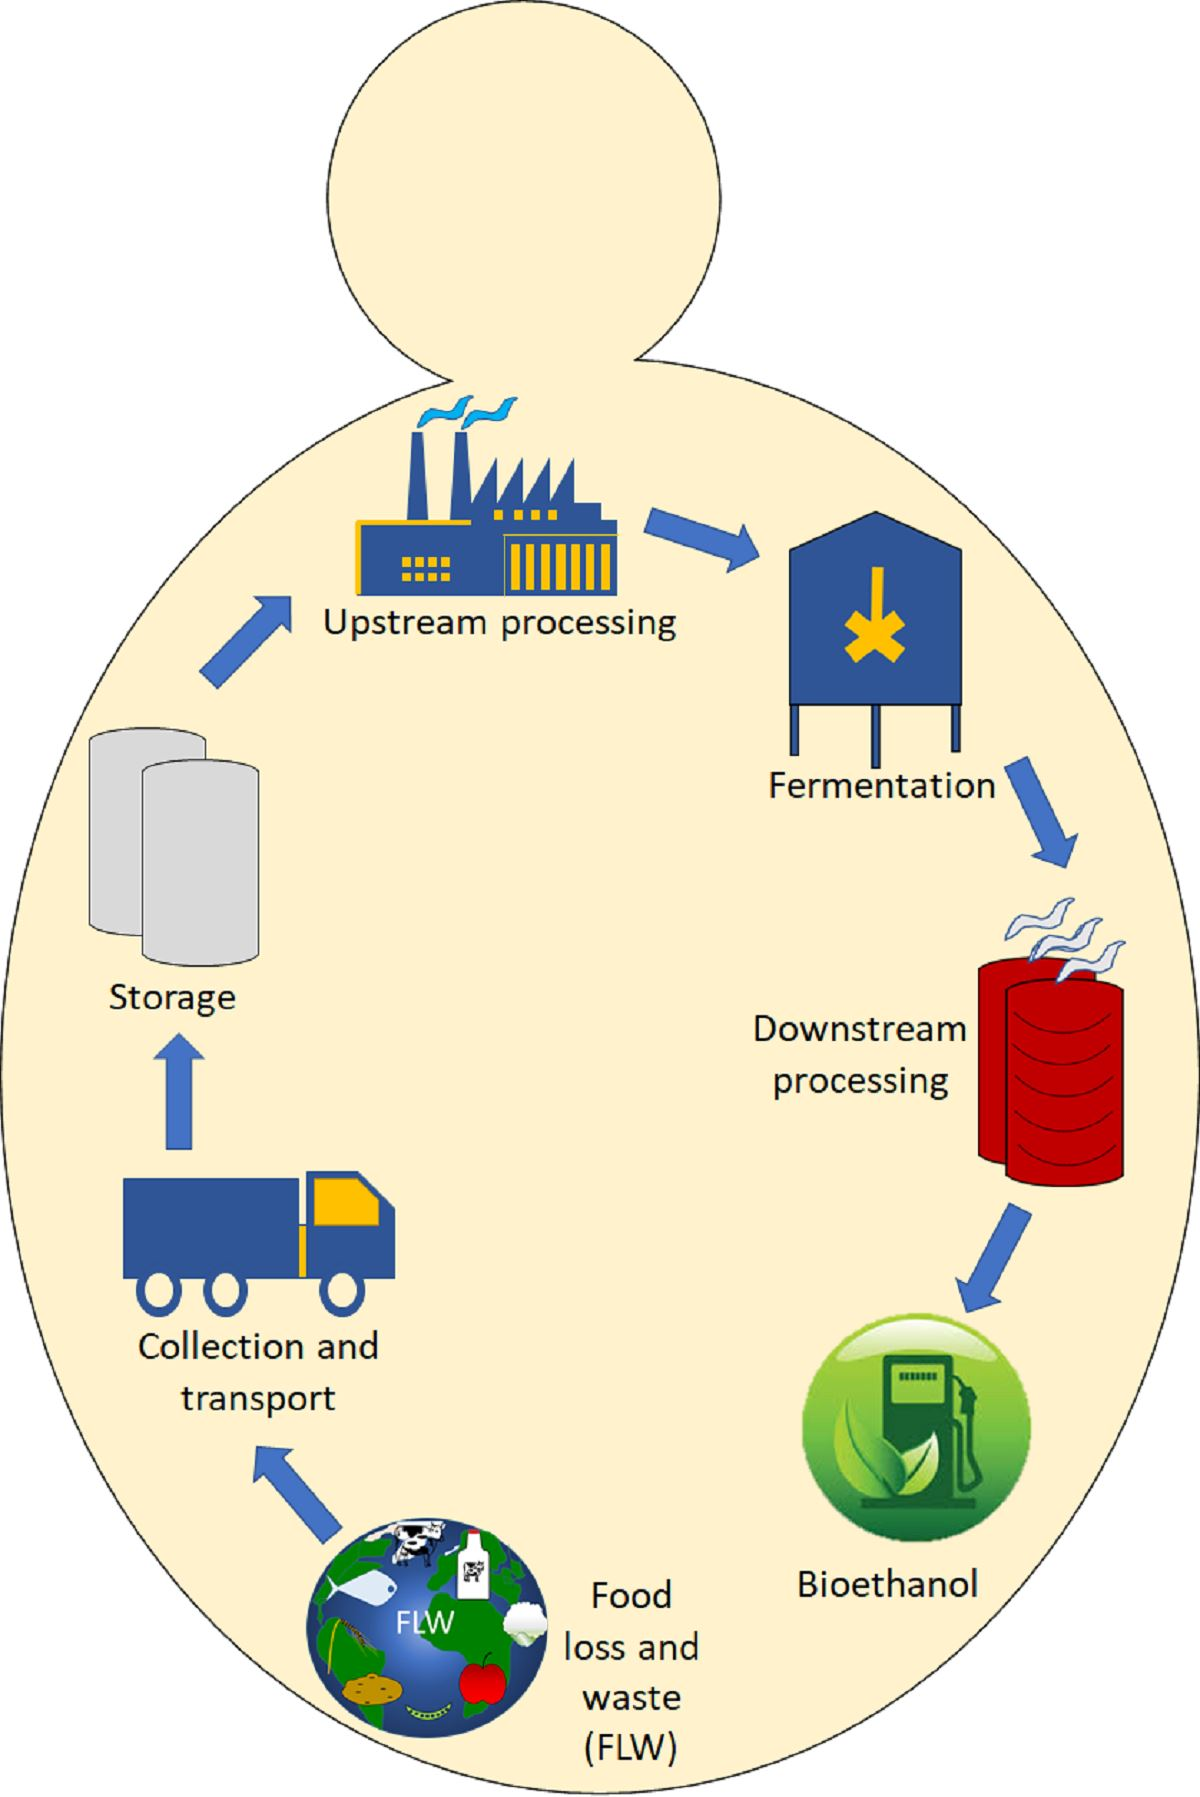
3. Upstream Processing
Separation and Pretreatment
4. Fermentation
4.1. Microorganism
4.2. Increasing Ethanol Production
4.2.1. Physio-Biochemical Factor Optimization
4.2.2. Cell Addition
4.2.3. Inhibition Relaxation
4.2.4. High Solid Loading
4.2.5. Bioreactor
4.2.6. Other
5. In Situ Ethanol Separation and Recovery
6. By-Products
7. Future Directions
8. Conclusions
Author Contributions
Funding
Acknowledgments
Conflicts of Interest
References
- Tyczewska, A.; Woźniak, E.; Gracz, J.; Kuczyński, J.; Twardowski, T. Towards Food Security: Current State and Future Prospects of Agrobiotechnology. Trends Biotechnol. 2018, 36, 1219–1229. [Google Scholar] [CrossRef] [PubMed]
- Bourke, P.; Ziuzina, D.; Boehm, D.; Cullen, P.J.; Keener, K. The potential of cold plasma for safe and sustainable food production. Trends Biotechnol. 2018, 36, 615–626. [Google Scholar] [CrossRef] [PubMed]
- SDG Knowledge Hub. World Population to Reach 9.9 Billion by 2050. 2020. Available online: https://sdg.iisd.org/news/world-population-to-reach-9-9-billion-by-2050/ (accessed on 20 September 2022).
- UN. The Sustainable Development Goals Report 2022. In The Sustainable Development Goals Report 2022; Jensen, L., Ed.; United Nations Publications: New York, NY, USA, 2022; p. 68. [Google Scholar]
- Crude Oil. Available online: https://tradingeconomics.com/commodity/crude-oil (accessed on 10 October 2022).
- Stecker, T. How the Oil Embargo Sparked Energy Independence—In Brazil. In Scientific American; Springer Nature America Inc.: New York, NY, USA, 2013. [Google Scholar]
- Alhajji, A.J. The 1973 oil embargo: Its history, motives, and consequences. Oil Gas J. 2005, 103, 24–26. [Google Scholar]
- Tunison, B.R. Industrial Alcohol. A J. Eng. Constr. 1920, 16, 319–321. [Google Scholar] [CrossRef]
- Chen, H.; Fu, X. Industrial technologies for bioethanol production from lignocellulosic biomass. Renew. Sustain. Energy Rev. 2016, 57, 468–478. [Google Scholar] [CrossRef]
- Buruiana, C.-T.; Garrote, G.; Vizireanu, C. Bioethanol production from residual lignocellulosic materials: A review―Part 2. Ann. Univ. Dunarea de Jos Galati Fascicle VI Food Technol. 2013, 37, 25–38. [Google Scholar]
- Akpan, U.G.; Alhakim, A.A.; Ijah, U.J.J. Production of ethanol fuel from organic and food wastes. Leonardo Electron J. Pract. Technol. 2008, 13, 1–11. [Google Scholar]
- Myburgh, M.W.; Cripwell, R.A.; Favaro, L.; van Zyl, W.H. Application of industrial amylolytic yeast strains for the production of bioethanol from broken rice. Bioresource Technol. 2019, 294, 122222. [Google Scholar] [CrossRef]
- Sönnichsen, N. Fuel Ethanol Production Worldwide in 2021, by Country. In Statista; 2022; Available online: https://www.statista.com/statistics/281606/ethanol-production-in-selected-countries/ (accessed on 20 September 2022).
- Ethanol. U.S. Ethanol Plants. In Ethanol Producer Magzine. 2018. Available online: https://ethanolproducer.com/plants/listplants/US/Operational/All/ (accessed on 20 September 2022).
- Azhar, S.H.M.; Abdulla, R.; Jambo, S.A.; Marbawi, H.; Gansau, J.A.; Faik, A.A.M.; Rodrigues, K.F. Yeasts in sustainable bioethanol production: A review. Biochem. Biophys. Rep. 2017, 10, 52–61. [Google Scholar]
- Kumar, S.; Bhalla, A.; Bibra, M.; Wang, J.; Morisette, K.; Subramanian, M.R.; Salem, D.; Sani, R.K. Thermophilic Biohydrogen Production: Challenges at the Industrial Scale; Apple Academic Press Taylor and Francis: New York, NY, USA, 2015. [Google Scholar]
- Schilling, K.E.; Jha, M.K.; Zhang, Y.K.; Gassman, P.W.; Wolter, C.F. Impact of land use and land cover change on the water balance of a large agricultural watershed: Historical effects and future directions. Water Resour. Res. 2008, 44, W00A09. [Google Scholar] [CrossRef]
- Ma, K.; Ruan, Z.; Shui, Z.; Wang, Y.; Hu, G.; He, M. Open fermentative production of fuel ethanol from food waste by an acid-tolerant mutant strain of Zymomonas mobilis. Bioresource Technol. 2016, 203, 295–302. [Google Scholar] [CrossRef] [PubMed]
- Meigs, J.B. Food for the Table, Not for the Gas Tank. In City-Journal; Manhattan Institute: New York, NY, USA, 2022. [Google Scholar]
- Yan, S.; Yao, J.; Yao, L.; Zhi, Z.; Chen, X.; Wu, J. Fed batch enzymatic saccharification of food waste improves the sugar concentration in the hydrolysates and eventually the ethanol fermentation by Saccharomyces cerevisiae H058. Braz. Arch. Biol. Technol. 2012, 55, 183–192. [Google Scholar] [CrossRef]
- FAO. Food Wastage Footprint: Full Cost-Accounting; Food and Agricultural Organizations of the United Nations: Rome, Italy, 2014; p. 98. [Google Scholar]
- Gustavasson, J.; Cederberg, C.; Sonesson, U.; Otterdijk, R.V.; Meybeck, A. Global Food Losses and Food Waste-Extent, Causes, and Prevention; FAO: Rome, Italy, 2011. [Google Scholar]
- FAO. The state of food and agriculture 2019. In Moving forward on Food Loss and Waste Reduction; FAO: Rome, Italy, 2019; pp. 1–182. [Google Scholar]
- FAO; IFAD; UNICEF; WFP; WHO. The State of Food Security and Nutrition in the World. Repurposing Food and Agricultural Policies to Make Heathy Diets more Affordable. In The State of the World; FAO, Ed.; Food and Agricultural Organization, United Nations: Rome, Italy, 2022; p. 260. [Google Scholar]
- Isah, S.; Ozbay, G. Valorization of food loss and wastes: Feedstocks for biofuels and valuable chemicals. Front. Sustain. Food Syst. 2020, 4, 82. [Google Scholar] [CrossRef]
- Menon, A.; Ren, F.; Wang, J.-Y.; Giannis, A. Effect of pretreatment techniques on food waste solubilization and biogas production during thermophilic batch anaerobic digestion. J. Mater. Cycles Waste Manag. 2016, 18, 222–230. [Google Scholar] [CrossRef]
- De Clercq, D.; Wen, Z.; Gottfried, O.; Schmidt, F.; Fei, F. A review of global strategies promoting the conversion of food waste to bioenergy via anaerobic digestion. Renew. Sustain. Energy Rev. 2017, 79, 204–221. [Google Scholar] [CrossRef]
- Li, S.; Yang, X. Biofuel production from food wastes. In Handbook of Biofuels Production, 2nd ed.; Elsevier: Amsterdam, The Netherlands, 2016; pp. 617–653. [Google Scholar]
- EPA. Advancing Sustainable Materials Management: 2015 Fact Sheet; U.S. Environmental Protection Agency: Washington, DC, USA, 2018; p. 23.
- Samant, S.; Naik, M.M.; Vaingankar, D.C.; Mujawar, S.Y.; Parab, P.; Meena, S.N. Biodegradation of seafood waste by seaweed-associated bacteria and application of seafood waste for ethanol production. In Advances in Biological Science Research; Elsevier: Amsterdam, The Netherlands, 2019; pp. 149–159. [Google Scholar]
- Fabiano, C.; Meyer, E.; Carusiello, C.; Tubright, T. Wasted Food Measurement Methodology Scoping Memo. 2020, United States Environmental Protection Agency, USA. p. 100. Available online: https://www.epa.gov/sites/default/files/2020-06/documents/food_measurement_methodology_scoping_memo-6-18-20.pdf (accessed on 20 September 2022).
- Sridhar, A.; Kapoor, A.; Kumar, P.S.; Ponnuchamy, M.; Balasubramanian, S.; Prabhakar, S. Conversion of food waste to energy: A focus on sustainability and life cycle assessment. Fuel 2021, 302, 121069. [Google Scholar] [CrossRef]
- Raj, T.; Chandrasekhar, K.; Morya, R.; Pandey, A.K.; Jung, J.-H.; Kumar, D.; Singhania, R.R.; Kim, S.-H. Critical challenges and technological breakthroughs in food waste hydrolysis and detoxification for fuels and chemicals production. Bioresource Technol. 2022, 360, 127512. [Google Scholar] [CrossRef]
- Hegde, S.; Lodge, J.S.; Trabold, T.A. Characteristics of food processing wastes and their use in sustainable alcohol production. Renewable Sustainable Energy Rev. 2018, 81, 510–523. [Google Scholar] [CrossRef]
- Mahmoodi, P.; Karimi, K.; Taherzadeh, M.J. Efficient conversion of municipal solid waste to biofuel by simultaneous dilute-acid hydrolysis of starch and pretreatment of lignocelluloses. Energy Convers. Manag. 2018, 166, 569–578. [Google Scholar] [CrossRef]
- UNEP. United Nations Environment Programme. In Food Waste Index Report; Nairobi, A.I., Ed.; United Nations: Nairobi, Kenya, 2021; p. 100. [Google Scholar]
- Dongyu, Q. The State of Food and Agriculture Moving Forward on Food Loss and Waste Reduction; Food and Agriculture Organization of the United Nation: Rome, Italy, 2019. [Google Scholar]
- Hoehn, D.; Vázquez-Rowe, I.; Kahhat, R.; Margallo, M.; Laso, J.; Fernández-Ríos, A.; Ruiz-Salmón, I.; Aldaco, R. A critical review on food loss and waste quantification approaches: Is there a need to develop alternatives beyond the currently widespread pathways? Resour. Conserv. Recycl. 2023, 188, 106671. [Google Scholar] [CrossRef]
- Mouat, A.R. Sustainability in food-waste reduction biotechnology: A critical review. Curr. Opin. Biotechnol. 2022, 77, 102781. [Google Scholar] [CrossRef]
- Delgado, L.; Schuster, M.; Torero, M. Quantity and quality food losses across the value chain: A comparative analysis. Food Policy 2021, 98, 101958. [Google Scholar] [CrossRef]
- Lipinski, B.; Hanson, C.; Waite, R.; Searchinger, T.; Lomax, J. Reducing food loss and waste. Working paper. In Installment 2 of Creating a Sustainable Food Future; UNEP: Washington, DC, USA; World Resources Institue: Washington, DC, USA, 2013; pp. 1–40. [Google Scholar]
- Gustavsson, J.; Cederberg, C.; Sonesson, U.; Van Otterdijk, R.; Meybeck, A. Global Food Losses and Food Waste; FAO: Rome, Italy, 2011. [Google Scholar]
- EPA. Advancing sustainable materials management: 2016 Recycling Economic Information (REI) Report Methodology. In Report Methodology; United States Environmental Protection Agency: Washington, DC, USA, 2016; p. 129. Available online: https://catalog.data.gov/dataset/sustainable-materials-management-smm-recycling-economic-information-rei-report (accessed on 20 September 2022).
- Sharma, P.; Gaur, V.K.; Kim, S.-H.; Pandey, A. Microbial strategies for bio-transforming food waste into resources. Bioresource Technol. 2020, 299, 122580. [Google Scholar] [CrossRef]
- Johnson, L.K.; Dunning, R.D.; Bloom, J.D.; Gunter, C.C.; Boyette, M.D.; Creamer, N.G. Estimating on-farm food loss at the field level: A methodology and applied case study on a North Carolina farm. Resour. Conserv. Recycl. 2018, 137, 243–250. [Google Scholar] [CrossRef]
- Wozniacka, G. Study Finds Farm-Level Food Waste Is Much Worse Than We Thought. 2019. Available online: https://civileats.com/2019/2008/2020/study-finds-farm-level-food-waste-is-much-worse-than-we-thought/ (accessed on 20 September 2022).
- Hartikainen, H.; Mogensen, L.; Svanes, E.; Franke, U. Food waste quantification in primary production–the Nordic countries as a case study. Waste Manag. 2018, 71, 502–511. [Google Scholar] [CrossRef] [PubMed]
- O’Connor, T.; Kleemann, R.; Attard, J. Vulnerable vegetables and efficient fishers: A study of primary production food losses and waste in Ireland. J. Environ. Manag. 2022, 307, 114498. [Google Scholar] [CrossRef]
- Adhikari, B.B.; Chae, M.; Bressler, D.C.J.P. Utilization of slaughterhouse waste in value-added applications: Recent advances in the development of wood adhesives. Polymers 2018, 10, 176. [Google Scholar] [CrossRef]
- Aulakh, J.K.; Regmi, A. Post-Harvest Food Losses Estimation-Development of Consistent Methodology. In Proceedings of the Agricultural & Applied Economics Association’s 2013 AAEA & CAES Joint Annual Meeting, Washington, DC, USA, 6 August 2013; 2013; p. 34. [Google Scholar]
- Hodges, R.J.; Buzby, J.C.; Bennett, B. Postharvest losses and waste in developed and less developed countries: Opportunities to improve resource use. J. Agric. Sci. 2011, 149, 37–45. [Google Scholar] [CrossRef]
- Gross, A.S. One in Six Pints of Milk Thrown away Each Year, Study Shows. The Guardian, 28 November 2018. Available online: https://www.theguardian.com/environment/2018/nov/28/one-in-six-pints-of-milk-thrown-away-each-year-study-shows (accessed on 20 September 2022).
- Roda, P.; Gilman, E.; Huntington, T.; Kennelly, S.J.; Suuronen, P.; Chaloupka, M.; Medley, P. A third assessment of global marine fisheries discards. In FAO Fisheries and Aquaculture Technical Paper; FAO: Rome, Italy, 2019; p. 79. [Google Scholar]
- Food Marketing Institute; Grocery Manufacturers Association; National Rifle Association. Analysis of U.S. food waste among food manufacturers, retailers, and restaurants. In Food Waste Reduction Alliance; Food Marketing Institute: Arlington, VA, USA, 2016; p. 51. [Google Scholar]
- Sedghi, A. How much water is needed to produce food and how much do we waste? The Guardian, 10 January 2013; Volume 11. Available online: https://www.theguardian.com/news/datablog/2013/jan/10/how-much-water-food-production-waste (accessed on 20 September 2022).
- Slavov, A.K. General characteristics and treatment possibilities of dairy wastewater–a review. Food Technol. Biotechnol. 2017, 55, 14. [Google Scholar] [CrossRef]
- REEEP. Tofu Production: A massive oppurtunity for RE biogas in Indonesia. In The Renewable Energy and Energy Efficiency Partnership; Renewable Energy and Energy Efficiency Partnership: Jakarta, Indonesia, 2012. [Google Scholar]
- Isla, M.A.; Comelli, R.N.; Seluy, L.G. Wastewater from the soft drinks industry as a source for bioethanol production. Bioresource Technol. 2013, 136, 140–147. [Google Scholar] [CrossRef]
- de la Torre, I.; Ravelo, M.; Segarra, S.; Tortajada, M.; Santos, V.E.; Ladero, M. Study on the effects of several operational variables on the enzymatic batch saccharification of orange solid waste. Bioresource Technol. 2017, 245, 906–915. [Google Scholar] [CrossRef] [PubMed]
- Favaro, L.; Cagnin, L.; Basaglia, M.; Pizzocchero, V.; van Zyl, W.H.; Casella, S. Production of bioethanol from multiple waste streams of rice milling. Bioresource Technol. 2017, 244, 151–159. [Google Scholar] [CrossRef] [PubMed]
- Alliance, F.W.R. Analysis of US Food Waste Among Food Manufacturers, Retailers and Wholesalers. In Business for Social Responsibility; BSR: New York, NY, USA, 2013. [Google Scholar]
- Lewis, H.; Downes, J.; Verghese, K.; Young, G. Food waste opportunities within the food wholesale and retail sectors. In NSW Environment Protection Authority; Institute of Sustainable Futures: Broadway, NSW, Australia, 2017. [Google Scholar]
- Elimelech, E.; Ayalon, O.; Ert, E. What gets measured gets managed: A new method of measuring household food waste. Waste Manag. 2018, 76, 68–81. [Google Scholar] [CrossRef] [PubMed]
- Xue, L.; Liu, G.; Parfitt, J.; Liu, X.; Van Herpen, E.; Stenmarck, Å.; O’Connor, C.; Östergren, K.; Cheng, S. Missing food, missing data? A critical review of global food losses and food waste data. Environ. Sci. Technol. 2017, 51, 6618–6633. [Google Scholar] [CrossRef]
- EPA. Advancing Sustainable Materials Management: 2018 Fact Sheet. Assessing Trends in Materials Generation and Management in the United States; National Service Center for Environmental Publications (NSCEP): Washington, DC, USA, 2020.
- Berchem, T.; Roiseux, O.; Vanderghem, C.; Boisdenghien, A.; Foucart, G.; Richel, A. Corn stover as feedstock for the production of ethanol: Chemical composition of different anatomical fractions and varieties. Biofuel Bioprod. Biorefin. 2017, 11, 430–440. [Google Scholar] [CrossRef]
- Gawande, S.B.; Patil, I.D. Experimental Investigation and Optimization for Production of Bioethanol from Damaged Corn Grains. Mater. Today Proc. 2018, 5, 1509–1517. [Google Scholar] [CrossRef]
- Priyanka, M.; Kumar, D.; Shankar, U.; Yadav, A.; Yadav, K. Agricultural waste management for bioethanol production. In Biotechnology: Concepts, Methodologies, Tools, and Applications; IGI Global: Hershey, PA, USA, 2019; pp. 492–524. [Google Scholar]
- Ning, Z.; Zhang, H.; Li, W.; Zhang, R.; Liu, G.; Chen, C. Anaerobic digestion of lipid-rich swine slaughterhouse waste: Methane production performance, long-chain fatty acids profile and predominant microorganisms. Bioresource Technol. 2018, 269, 426–433. [Google Scholar] [CrossRef]
- Silvasy, T.; Ahmad, A.A.; Wang, K.-H.; Radovich, T.J. Rate and timing of meat and bone meal applications influence growth, yield, and soil water nitrate concentrations in sweet corn production. Agronomy 2021, 11, 1945. [Google Scholar] [CrossRef]
- Fish, W.W.; Bruton, B.D.; Russo, V.M.J.B.f.B. Watermelon juice: A promising feedstock supplement, diluent, and nitrogen supplement for ethanol biofuel production. Biotechnol. Biofuels 2009, 2, 1–9. [Google Scholar] [CrossRef]
- AFZ. Io—La Banque de Données de l’Alimentation Animale/French Feed Database. Association Française de Zootechnie: Paris, France, 2011. [Google Scholar]
- Marino, C.T.; Hector, B.; Rodrigues, P.; Borgatti, L.; Meyer, P.M.; Alves da Silva, E.; Ørskov, E.J. Characterization of vegetables and fruits potential as ruminant feed by in vitro gas production technique. Livest. Res. Rural Dev. 2010, 22, 168. [Google Scholar]
- Heuzé, V.; Tran, G.; Hassoun, P.; Lebas, F. Apple Pomace and Culled Apples. Feedipedia, a Programme by INRAE, CIRAD, AFZ and FAO. 2020. Available online: https://www.feedipedia.org/node/20703 (accessed on 20 September 2022).
- Koutsos, A.; Tuohy, K.M.; Lovegrove, J.A. Apples and cardiovascular health—is the gut microbiota a core consideration? Nutrients 2015, 7, 3959–3998. [Google Scholar] [CrossRef] [PubMed]
- Gasa, J.; Castrillo, C.; Baucells, M.; Guada, J.J. By-products from the canning industry as feedstuff for ruminants: Digestibility and its prediction from chemical composition and laboratory bioassays. Anim. Feed Sci. Technol. 1989, 25, 67–77. [Google Scholar] [CrossRef]
- García-Rodríguez, J.; Ranilla, M.J.; France, J.; Alaiz-Moretón, H.; Carro, M.D.; López, S. Chemical composition, in vitro digestibility and rumen fermentation kinetics of agro-industrial by-products. Animals 2019, 9, 861. [Google Scholar] [CrossRef] [PubMed]
- Heuzé, V.; Tran, G.; Archimède, H.; Renaudeau, D.; Lessire, M. Banana Fruits. Feedipedia, a Programme by INRAE, CIRAD, AFZ and FAO. 2016. Available online: https://www.feedipedia.org/node/683 (accessed on 20 September 2022).
- Zoair, A.; Attia, S.; Abou Garbia, A.; Youssef, M. Utilization of orange, banana and potato peels in formulating functional cupcakes and crackers. Alex. J. Food Sci. Technol. 2016, 13, 11–18. [Google Scholar]
- Hikal, W.M.; Said-Al Ahl, H.A. Banana peels as possible antioxidant and antimicrobial agents. Asian J. Agric. Res. 2021, 3, 35–45. [Google Scholar]
- Khoshkho, S.M.; Mahdavian, M.; Karimi, F.; Karimi-Maleh, H.; Razaghi, P. Production of bioethanol from carrot pulp in the presence of Saccharomyces cerevisiae and beet molasses inoculum; a biomass based investigation. Chemosphere 2022, 286, 131688. [Google Scholar] [CrossRef]
- Bakshi, M.; Wadhwa, M.; Makkar, H.P. Waste to worth: Vegetable wastes as animal feed. Perspect. Agric. Vet. Sci. Nutr. Nat. Resour. 2016, 2016, 1–26. [Google Scholar] [CrossRef]
- Sharoba, A.M.; Farrag, M.A.; El-Salam, A.M. Utilization of some fruits and vegetables wastes as a source of dietary fibers in cake making. J. Agroaliment. Processes Technol. 2013, 4, 433–453. [Google Scholar] [CrossRef]
- Robledo, A.; Aguilera-Carbó, A.; Rodriguez, R.; Martinez, J.L.; Garza, Y.; Aguilar, C.N. Ellagic acid production by Aspergillus niger in solid state fermentation of pomegranate residues. J. Ind. Microbiol. 2008, 35, 507–513. [Google Scholar] [CrossRef]
- Immonen, M.; Maina, N.H.; Wang, Y.; Coda, R.; Katina, K. Waste bread recycling as a baking ingredient by tailored lactic acid fermentation. Int. J. Food Microbiol. 2020, 327, 108652. [Google Scholar] [CrossRef]
- Han, W.; Liu, W.-X.; Yu, C.-M.; Huang, J.-G.; Tang, J.-H.; Li, Y.-F. BioH2 production from waste bread using a two-stage process of enzymatic hydrolysis and dark fermentation. Int. J. Hydrogen Energy 2017, 42, 29929–29934. [Google Scholar] [CrossRef]
- Han, W.; Xu, X.; Gao, Y.; He, H.; Chen, L.; Tian, X.; Hou, P. Utilization of waste cake for fermentative ethanol production. Sci. Total Environ. 2019, 673, 378–383. [Google Scholar] [CrossRef] [PubMed]
- Zhang, A.Y.-z.; Sun, Z.; Leung, C.C.J.; Han, W.; Lau, K.Y.; Li, M.; Lin, C.S.K. Valorisation of bakery waste for succinic acid production. Green Chem. 2013, 15, 690–695. [Google Scholar] [CrossRef]
- Heuzé, V.; Thiollet, H.; Tran, G.; Sauvant, D.; Bastianelli, D.; Lebas, F. Sugar Beet Pulp, Pressed or Wet. Feedipedia, a Programme by INRAE, CIRAD, AFZ and FAO. 2019. Available online: https://www.feedipedia.org/node/710 (accessed on 20 September 2022).
- INRA-CIRAD-AFZ Feed Tables Composition and Nutritive Values of Feeds for Cattle, Sheep, Goats, Pigs, Poultry, Rabbits, Horses, and Salmonids. Available online: https://www.feedtables.com/ (accessed on 20 September 2022).
- Shoaib, A.; El-Adly, R.; Hassanean, M.; Youssry, A.; Bhran, A. Developing a free-fall reactor for rice straw fast pyrolysis to produce bio-products. Egypt. J. Pet. 2018, 27, 1305–1311. [Google Scholar] [CrossRef]
- Sindhu, R.; Binod, P.; Janu, K.U.; Sukumaran, R.K.; Pandey, A. Organosolvent pretreatment and enzymatic hydrolysis of rice straw for the production of bioethanol. World J. Microbiol. Biotechnol. 2012, 28, 473–483. [Google Scholar] [CrossRef]
- Huyen, N.T.D.; Trach, N.X.; Preston, T. Effects of supplementation of paddy rice and/or rice grain and/or rice husk to sweet potato (Ipomoea batatas) vines as basal diet on growth performance and diet digestibility in rabbits. Livest. Res. Rural Dev. 2013, 25, 19. [Google Scholar]
- Grieshop, C.M.; Kadzere, C.T.; Clapper, G.M.; Flickinger, E.A.; Bauer, L.L.; Frazier, R.L.; Fahey, G.C. Chemical and nutritional characteristics of United States soybeans and soybean meals. J. Agric. Food Chem. 2003, 51, 7684–7691. [Google Scholar] [CrossRef]
- Ipharraguerre, I.; Clark, J. Soyhulls as an alternative feed for lactating dairy cows: A review. J. Dairy Sci. 2003, 86, 1052–1073. [Google Scholar] [CrossRef]
- Heuzé, V.; Tran, G.; Kaushik, S. Soybean hulls %J Feedipedia, a Programme by INRA, CIRAD, AFZ and FAO. 2017. Available online: https://www.feedipedia.org/node/719 (accessed on 20 September 2022).
- Okano, K.; Iida, Y.; Samsuri, M.; Prasetya, B.; Usagawa, T.; Watanabe, T. Comparison of in vitro digestibility and chemical composition among sugarcane bagasses treated by four white-rot fungi. Anim. Sci. J. 2006, 77, 308–313. [Google Scholar] [CrossRef]
- Del Valle, M.; Cámara, M.; Torija, M.E. Chemical characterization of tomato pomace. J. Sci. Food Agric. 2006, 86, 1232–1236. [Google Scholar] [CrossRef]
- Travieso, M.D.C.; de Evan, T.; Marcos, C.N.; Molina-Alcaide, E. Tomato by-products as animal feed. In Tomato Processing by-Products: Sustainable Applications; Jeguirim, M., Zorpas, A., Eds.; Academic Press: Oxford, UK, 2022; pp. 33–76. [Google Scholar]
- Heuzé, V.; Tran, G.; Baumont, R.; Noblet, J.; Renaudeau, D.; Lessire, M.; Lebas, F. Wheat Bran. Feedipedia, a Programme by INRAE, CIRAD, AFZ and FAO. 2015. Available online: https://www.feedipedia.org/node/726 (accessed on 20 September 2022).
- Knudsen, K.E.B. Carbohydrate and lignin contents of plant materials used in animal feeding. Anim. Feed Sci. Technol. 1997, 67, 319–338. [Google Scholar] [CrossRef]
- Heuzé, V.; Tran, G.; Baumont, R.; Noblet, J.; Renaudeau, D.; Lessire, M.; Lebas, F. Wheat Grain. Feedipedia, a Programme by INRAE, CIRAD, AFZ and FAO. 2015. Available online: https://www.feedipedia.org/node/223 (accessed on 20 September 2022).
- Ma, H.; Wang, Q.; Zhang, W.; Xu, W.; Zou, D. Optimization of the medium and process parameters for ethanol production from kitchen garbage by Zymomonas mobilis. Int. J. Green Energy 2008, 5, 480–490. [Google Scholar] [CrossRef]
- Hansen, J.; Nelssen, J.; Goodband, R.; Weeden, T. Evaluation of animal protein supplements in diets of early-weaned pigs. J. Anim. Sci. 1993, 71, 1853–1862. [Google Scholar] [CrossRef]
- Heuzé, V.; Thiollet, H.; Tran, G.; Sauvant, D.; Bastianelli, D.; Lebas, F. Bakery Waste. Feedipedia, a Programme by INRAE, CIRAD, AFZ and FAO. 2018. Available online: https://www.feedipedia.org/node/699 (accessed on 20 September 2022).
- Bibra, M.; Rathinam, N.K.; Johnson, G.R.; Sani, R.K. Single pot biovalorization of food waste to ethanol by Geobacillus and Thermoanaerobacter spp. Renew. Energy 2020, 155, 1032–1041. [Google Scholar] [CrossRef]
- Cristóbal, J.; Caldeira, C.; Corrado, S.; Sala, S.J.B.T. Techno-economic and profitability analysis of food waste biorefineries at European level. Bioresource Technol. 2018, 259, 244–252. [Google Scholar] [CrossRef] [PubMed]
- Kassem, N.; Pecchi, M.; Maag, A.R.; Baratieri, M.; Tester, J.W.; Goldfarb, J.L. Developing Decision-Making Tools for Food Waste Management via Spatially Explicit Integration of Experimental Hydrothermal Carbonization Data and Computational Models Using New York as a Case Study. ACS Sustain. Chem. Eng. 2022. [Google Scholar] [CrossRef]
- Adler, B. Which Is the World’s Most Wasteful City? The Guardian, 27 October 2016. Available online: https://www.theguardian.com/cities/2016/oct/27/which-is-the-worlds-most-wasteful-city (accessed on 20 September 2022).
- Hammond, S.T.; Brown, J.H.; Burger, J.R.; Flanagan, T.P.; Fristoe, T.S.; Mercado-Silva, N.; Nekola, J.C.; Okie, J.G. Food spoilage, storage, and transport: Implications for a sustainable future. BioScience 2015, 65, 758–768. [Google Scholar] [CrossRef]
- Matsakas, L.; Christakopoulos, P. Ethanol production from enzymatically treated dried food waste using enzymes produced on-site. Sustainability 2015, 7, 1446–1458. [Google Scholar] [CrossRef]
- Zhang, W.; Ma, H.; Wang, Q.; Xia, J. Research on the adoption of lactic acid bacteria in food waste storage and ethanol production. Int. J. Green Energy 2012, 9, 456–466. [Google Scholar] [CrossRef]
- Chakraborty, D.; Mohan, S.V. Efficient resource valorization by co-digestion of food and vegetable waste using three stage integrated bioprocess. Bioresource Technol. 2019, 284, 373–380. [Google Scholar] [CrossRef]
- Panaretou, V.; Tsouti, C.; Moustakas, K.; Malamis, D.; Mai, S.; Barampouti, E.; Loizidou, M. Food Waste Generation and Collection. In Current Developments in Biotechnology and Bioengineering, Sustainable Food Waste Management: Resource Recovery and Treatment; Wong, J., Taherzadeh, M., Lasaridi, K., Kaur, G., Pandey, A., Eds.; Elsevier: Amsterdam, The Netherlands, 2021; pp. 43–105. [Google Scholar]
- FAO. Technical Platform on the Measurement and Reduction of Food Loss and Waste; Food and Agricultural Organization of the United Nations: Rome, Italy, 2021; Available online: https://www.fao.org/platform-food-loss-waste/flw-data/en (accessed on 20 September 2022).
- Severn, Trent Green Power Ltd. Agrivert’s Journey from Food waste to Renewable Power. 2017. Available online: https://www.youtube.com/watch?v=vv5vJRP4Xe0 (accessed on 20 October 2022).
- Motte, J.-C.; Escudié, R.; Bernet, N.; Delgenes, J.-P.; Steyer, J.-P.; Dumas, C. Dynamic effect of total solid content, low substrate/inoculum ratio and particle size on solid-state anaerobic digestion. Bioresource Technol. 2013, 144, 141–148. [Google Scholar] [CrossRef] [PubMed]
- Naidu, K.; Singh, V.; Johnston, D.B.; Rausch, K.D.; Tumbleson, M.E. Effects of ground corn particle size on ethanol yield and thin stillage soluble solids. Cereal Chem. 2007, 84, 6–9. [Google Scholar] [CrossRef]
- Yoo, J.; Alavi, S.; Vadlani, P.; Amanor-Boadu, V.J.B.t. Thermo-mechanical extrusion pretreatment for conversion of soybean hulls to fermentable sugars. Bioresource Technol. 2011, 102, 7583–7590. [Google Scholar] [CrossRef]
- Prasad, S.; Singh, A.; Joshi, H. Ethanol as an alternative fuel from agricultural, industrial and urban residues. Resour. Conserv. Recycl. 2007, 50, 1–39. [Google Scholar] [CrossRef]
- Kiran, E.U.; Trzcinski, A.P.; Ng, W.J.; Liu, Y. Bioconversion of food waste to energy: A review. Fuel 2014, 134, 389–399. [Google Scholar] [CrossRef]
- Palma-Rodriguez, H.M.; Agama-Acevedo, E.; Mendez-Montealvo, G.; Gonzalez-Soto, R.A.; Vernon-Carter, E.J.; Bello-Pérez, L.A. Effect of acid treatment on the physicochemical and structural characteristics of starches from different botanical sources. Starch Stärke 2012, 64, 115–125. [Google Scholar] [CrossRef]
- Kim, Y.S.; Jang, J.Y.; Park, S.J.; Um, B.H. Dilute sulfuric acid fractionation of Korean food waste for ethanol and lactic acid production by yeast. Waste Manag. 2018, 74, 231–240. [Google Scholar] [CrossRef]
- Hafid, H.S.; Nor’Aini, A.R.; Mokhtar, M.N.; Talib, A.T.; Baharuddin, A.S.; Kalsom, M.S.U. Over production of fermentable sugar for bioethanol production from carbohydrate-rich Malaysian food waste via sequential acid-enzymatic hydrolysis pretreatment. Waste Manag. 2017, 67, 95–105. [Google Scholar] [CrossRef]
- Huang, H.; Qureshi, N.; Chen, M.-H.; Liu, W.; Singh, V. Ethanol production from food waste at high solids content with vacuum recovery technology. J. Agric. Food Chem. 2015, 63, 2760–2766. [Google Scholar] [CrossRef]
- Kwan, T.H.; Ong, K.L.; Haque, M.A.; Kwan, W.H.; Kulkarni, S.; Lin, C.S.K. Valorisation of food and beverage waste via saccharification for sugars recovery. Bioresource Technol. 2018, 255, 67–75. [Google Scholar] [CrossRef]
- Mihajlovski, K.; Rajilić-Stojanović, M.; Dimitrijević-Branković, S. Enzymatic hydrolysis of waste bread by newly isolated Hymenobacter sp. CKS3, Statistical optimization and bioethanol production. Renew. Energy 2020, 152, 627–633. [Google Scholar] [CrossRef]
- Tao, L.; Schell, D.; Davis, R.; Tan, E.; Elander, R.; Bratis, A. NREL 2012 Achievement of Ethanol Cost Targets: Biochemical Ethanol Fermentation Via Dilute-Acid Pretreatment and Enzymatic Hydrolysis of Corn Stover; National Renewable Energy Lab. (NREL): Golden, CO, USA, 2014.
- Korkie, L.; Janse, B.; Viljoen-Bloom, M. Utilising grape pomace for ethanol production. S. Afr. J. Enol. Vitic. 2002, 23, 31–36. [Google Scholar] [CrossRef]
- Yu, Q.; Zhuang, X.; Lv, S.; He, M.; Zhang, Y.; Yuan, Z.; Qi, W.; Wang, Q.; Wang, W.; Tan, X. Liquid hot water pretreatment of sugarcane bagasse and its comparison with chemical pretreatment methods for the sugar recovery and structural changes. Bioresource Technol. 2013, 129, 592–598. [Google Scholar] [CrossRef] [PubMed]
- Kwan, T.H.; Ong, K.L.; Haque, M.A.; Kulkarni, S.; Lin, C.S.K. Biorefinery of food and beverage waste valorisation for sugar syrups production: Techno-economic assessment. Process Saf. Environ. Prot. 2019, 121, 194–208. [Google Scholar] [CrossRef]
- Iris, K.; Ong, K.L.; Tsang, D.C.; Haque, M.A.; Kwan, T.H.; Chen, S.S.; Uisan, K.; Kulkarni, S.; Lin, C.S.K. Chemical transformation of food and beverage waste-derived fructose to hydroxymethylfurfural as a value-added product. Catal. Today 2018, 314, 70–77. [Google Scholar]
- Yadav, K.S.; Naseeruddin, S.; Prashanthi, G.S.; Sateesh, L.; Rao, L.V. Bioethanol fermentation of concentrated rice straw hydrolysate using co-culture of Saccharomyces cerevisiae and Pichia stipitis. Bioresource Technol. 2011, 102, 6473–6478. [Google Scholar] [CrossRef]
- Magyar, M.; da Costa Sousa, L.; Jayanthi, S.; Balan, V. Pie waste–a component of food waste and a renewable substrate for producing ethanol. Waste Manag. 2017, 62, 247–254. [Google Scholar] [CrossRef]
- Narisetty, V.; Nagarajan, S.; Gadkari, S.; Ranade, V.V.; Zhang, J.; Patchigolla, K.; Bhatnagar, A.; Awasthi, M.K.; Pandey, A.; Kumar, V. Process optimization for recycling of bread waste into bioethanol and biomethane: A circular economy approach. Energy Convers. Manag. 2022, 266, 115784. [Google Scholar] [CrossRef]
- Nunui, K.; Boonsawang, P.; Chaiprapat, S.; Charnnok, B. Using organosolv pretreatment with acid wastewater for enhanced fermentable sugar and ethanol production from rubberwood waste. Renew. Energy 2022, 198, 723–732. [Google Scholar] [CrossRef]
- Ebner, J.; Babbitt, C.; Winer, M.; Hilton, B.; Williamson, A. Life cycle greenhouse gas (GHG) impacts of a novel process for converting food waste to ethanol and co-products. Appl. Energy 2014, 130, 86–93. [Google Scholar] [CrossRef]
- He, M.X.; Wu, B.; Qin, H.; Ruan, Z.Y.; Tan, F.R.; Wang, J.L.; Shui, Z.X.; Dai, L.C.; Zhu, Q.L.; Pan, K. Zymomonas mobilis: A novel platform for future biorefineries. Biotechnol. Biofuels 2014, 7, 101. [Google Scholar] [CrossRef]
- Matsakas, L.; Kekos, D.; Loizidou, M.; Christakopoulos, P. Utilization of household food waste for the production of ethanol at high dry material content. Biotechnol. Biofuels 2014, 7, 4. [Google Scholar] [CrossRef] [PubMed]
- Hossain, T.; Miah, A.B.; Mahmud, S.A. Enhanced bioethanol production from potato peel waste via consolidated bioprocessing with statistically optimized medium. Appl. Biochem. Biotechnol. 2018, 186, 425–442. [Google Scholar] [CrossRef] [PubMed]
- Liu, J.; Dantoft, S.H.; Würtz, A.; Jensen, P.R.; Solem, C. A novel cell factory for efficient production of ethanol from dairy waste. Biotechnol. Biofuels 2016, 9, 33. [Google Scholar] [CrossRef] [PubMed]
- Mihajlovski, K.; Radovanović, Ž.; Carević, M.; Dimitrijević-Branković, S. Valorization of damaged rice grains: Optimization of bioethanol production by waste brewer’s yeast using an amylolytic potential from the Paenibacillus chitinolyticus CKS1. Fuel 2018, 224, 591–599. [Google Scholar] [CrossRef]
- Bahry, H.; Pons, A.; Abdallah, R.; Pierre, G.; Delattre, C.; Fayad, N.; Taha, S.; Vial, C. Valorization of carob waste: Definition of a second-generation bioethanol production process. Bioresource Technol. 2017, 235, 25–34. [Google Scholar] [CrossRef]
- Raita, M.; Ibenegbu, C.; Champreda, V.; Leak, D.J. Production of ethanol by thermophilic oligosaccharide utilising Geobacillus thermoglucosidasius TM242 using palm kernel cake as a renewable feedstock. Biomass Bioenergy 2016, 95, 45–54. [Google Scholar] [CrossRef]
- Buttowski, E.; Tawongsa, W.; Abdelmoula, A. The use of ethanol product from food waste hydrolysate by co-culture of (Zymomonas mobilis) and (Candida shehata) under non-sterile situation. Adv. Food Sci. 2014, 2, 225–231. [Google Scholar]
- Hang, Y.; Lee, C.; Woodams, E.; Cooley, H. Production of alcohol from apple pomace. Appl. Environ. Microbiol. 1981, 42, 1128–1129. [Google Scholar] [CrossRef]
- Ntaikou, I.; Menis, N.; Alexandropoulou, M.; Antonopoulou, G.; Lyberatos, G. Valorization of kitchen biowaste for ethanol production via simultaneous saccharification and fermentation using co-cultures of the yeasts Saccharomyces cerevisiae and Pichia stipitis. Bioresource Technol. 2018, 263, 75–83. [Google Scholar] [CrossRef]
- Izmirlioglu, G.; Demirci, A. Simultaneous saccharification and fermentation of ethanol from potato waste by co-cultures of Aspergillus niger and Saccharomyces cerevisiae in biofilm reactors. Fuel 2017, 202, 260–270. [Google Scholar] [CrossRef]
- Prasoulas, G.; Gentikis, A.; Konti, A.; Kalantzi, S.; Kekos, D.; Mamma, D.J.F. Bioethanol Production from Food Waste Applying the Multienzyme System Produced On-Site by Fusarium oxysporum F3 and Mixed Microbial Cultures. Fermentation 2020, 6, 39. [Google Scholar] [CrossRef]
- Bibra, M.; Wang, J.; Squillace, P.; Pinkelman, R.; Papendick, S.; Schneiderman, S.; Wood, V.; Amar, V.; Kumar, S.; Salem, D. Biofuels and Value-added Products from Extremophiles. In Advances in Biotechnology; Nawani, N.N., Khetmalas, M., Razdan, P.N., Pandey, A., Eds.; I K International Publishing House Pvt. Ltd.: New Delhi, India, 2014; p. 268. [Google Scholar]
- Bibra, M.; Kunreddy, V.; Sani, R. Thermostable xylanase production by geobacillus sp. Strain duselr13, and its application in ethanol production with lignocellulosic biomass. Microorganisms 2018, 6, 93. [Google Scholar] [CrossRef] [PubMed]
- Wang, J.; Bibra, M.; Venkateswaran, K.; Salem, D.R.; Rathinam, N.K.; Gadhamshetty, V.; Sani, R.K. Biohydrogen production from space crew’s waste simulants using thermophilic consolidated bioprocessing. Bioresource Technol. 2018, 255, 349–353. [Google Scholar] [CrossRef] [PubMed]
- Rai, R.; Bibra, M.; Chadha, B.; Sani, R.K. Enhanced hydrolysis of lignocellulosic biomass with doping of a highly thermostable recombinant laccase. Int. J. Biol. Macromol. 2019, 137, 232–237. [Google Scholar] [CrossRef] [PubMed]
- Germec, M.; Turhan, I. Ethanol production from acid-pretreated and detoxified tea processing waste and its modeling. Fuel 2018, 231, 101–109. [Google Scholar] [CrossRef]
- Arora, R.; Behera, S.; Sharma, N.K.; Kumar, S. Augmentation of ethanol production through statistically designed growth and fermentation medium using novel thermotolerant yeast isolates. Renew. Energy 2017, 109, 406–421. [Google Scholar] [CrossRef]
- Abd-Alla, M.H.; Zohri, A.-N.A.; El-Enany, A.-W.E.; Ali, S.M. Conversion of food processing wastes to biofuel using clostridia. Anaerobe 2017, 48, 135–143. [Google Scholar] [CrossRef]
- Li, Y.; Zhai, R.; Jiang, X.; Chen, X.; Yuan, X.; Liu, Z.; Jin, M. Boosting ethanol productivity of Zymomonas mobilis 8b in enzymatic hydrolysate of dilute acid and ammonia pretreated corn stover through medium optimization, high cell density fermentation and cell recycling. Front. Microbiol. 2019, 10, 2316. [Google Scholar] [CrossRef]
- Hemme, C.L.; Fields, M.W.; He, Q.; Deng, Y.; Lin, L.; Tu, Q.; Mouttaki, H.; Zhou, A.; Feng, X.; Zuo, Z. Correlation of genomic and physiological traits of Thermoanaerobacter species with biofuel yields. Appl. Environ. Microbiol. 2011, 77, 7998–8008. [Google Scholar] [CrossRef]
- Dhiman, S.S.; David, A.; Shrestha, N.; Johnson, G.R.; Benjamin, K.M.; Gadhamshetty, V.; Sani, R.K. Conversion of raw and untreated disposal into ethanol. Bioresource Technol. 2017, 244 Pt 1. [Google Scholar]
- Tomás, A.F.; Karagöz, P.; Karakashev, D.; Angelidaki, I. Extreme thermophilic ethanol production from rapeseed straw: Using the newly isolated Thermoanaerobacter pentosaceus and combining it with Saccharomyces cerevisiae in a two-step process. Biotechnol. Bioeng. 2013, 110, 1574–1582. [Google Scholar] [CrossRef]
- Tsai, T.-L.; Liu, S.-M.; Lee, S.-C.; Chen, W.-J.; Chou, S.-H.; Hsu, T.-C.; Guo, G.-L.; Hwang, W.-S.; Wiegel, J. Ethanol production efficiency of an anaerobic hemicellulolytic thermophilic bacterium, strain NTOU1, isolated from a marine shallow hydrothermal vent in Taiwan. Microbes Environ. 2011, 26, 317–324. [Google Scholar] [CrossRef] [PubMed]
- Wang, R.; Wang, D.; Gao, X.; Hong, J. Direct fermentation of raw starch using a Kluyveromyces marxianus strain that expresses glucoamylase and Alpha-amylase to produce ethanol. Biotechnol. Prog. 2014, 30, 338–347. [Google Scholar] [CrossRef] [PubMed]
- Rahayu, F.; Kawai, Y.; Iwasaki, Y.; Yoshida, K.; Kita, A.; Tajima, T.; Kato, J.; Murakami, K.; Hoshino, T.; Nakashimada, Y. Thermophilic ethanol fermentation from lignocellulose hydrolysate by genetically engineered Moorella thermoacetica. Bioresource Technol. 2017, 245, 1393–1399. [Google Scholar] [CrossRef] [PubMed]
- Vohra, M.; Manwar, J.; Manmode, R.; Padgilwar, S.; Patil, S. Bioethanol production: Feedstock and current technologies. J. Environ. Chem. Eng. 2014, 2, 573–584. [Google Scholar] [CrossRef]
- Thongdumyu, P.; Intrasungkha, N.; Sompong, O. Optimization of ethanol production from food waste hydrolysate by co-culture of Zymomonas mobilis and Candida shehatae under non-sterile condition. Afr. J. Biotechnol. 2014, 13, 866–873. [Google Scholar]
- Kim, J.K.; Oh, B.R.; Shin, H.-J.; Eom, C.-Y.; Kim, S.W. Statistical optimization of enzymatic saccharification and ethanol fermentation using food waste. Process Biochem. 2008, 43, 1308–1312. [Google Scholar] [CrossRef]
- Sarks, C.; Jin, M.; Sato, T.K.; Balan, V.; Dale, B.E. Studying the rapid bioconversion of lignocellulosic sugars into ethanol using high cell density fermentations with cell recycle. Biotechnol. Biofuels 2014, 7, 1–12. [Google Scholar] [CrossRef]
- He, R.; Ren, W.; Xiang, J.; Dabbour, M.; Mintah, B.K.; Li, Y.; Ma, H. Fermentation of Saccharomyces cerevisiae in a 7.5 L ultrasound-enhanced fermenter: Effect of sonication conditions on ethanol production, intracellular Ca2+ concentration and key regulating enzyme activity in glycolysis. Ultrason. Sonochem. 2021, 76, 105624. [Google Scholar] [CrossRef]
- Carrillo-Barragán, P.; Dolfing, J.; Sallis, P.; Gray, N. The stability of ethanol production from organic waste by a mixed culture depends on inoculum transfer time. Biochem. Eng. J. 2020, 107875. [Google Scholar] [CrossRef]
- Paulová, L.; Patáková, P.; Rychtera, M.; Melzoch, K.J.F. High solid fed-batch SSF with delayed inoculation for improved production of bioethanol from wheat straw. Fuel 2014, 122, 294–300. [Google Scholar] [CrossRef]
- Puligundla, P.; Smogrovicova, D.; Mok, C.; Obulam, V.S.R. A review of recent advances in high gravity ethanol fermentation. Renew. Energy 2019, 133, 1366–1379. [Google Scholar] [CrossRef]
- Pietrzak, W.; Kawa-Rygielska, J. Simultaneous saccharification and ethanol fermentation of waste wheat–rye bread at very high solids loading: Effect of enzymatic liquefaction conditions. Fuel 2015, 147, 236–242. [Google Scholar] [CrossRef]
- Djelal, H.; Chniti, S.; Jemni, M.; Weill, A.; Sayed, W.; Amrane, A. Identification of strain isolated from dates (Phœnix dactylifera L.) for enhancing very high gravity ethanol production. Environ. Sci. Pollut. Res. 2017, 24, 9886–9894. [Google Scholar] [CrossRef]
- Passadis, K.; Christianides, D.; Malamis, D.; Barampouti, E.; Mai, S. Valorisation of source-separated food waste to bioethanol: Pilot-scale demonstration. Biomass Convers. Biorefin. 2022, 12, 4599–4609. [Google Scholar] [CrossRef]
- Loizidou, M.; Alamanou, D.; Sotiropoulos, A.; Lytras, C.; Mamma, D.; Malamis, D. Pilot scale system of two horizontal rotating bioreactors for bioethanol production from household food waste at high solid concentrations. Waste Biomass Valorization 2017, 8, 1709–1719. [Google Scholar] [CrossRef]
- Todhanakasem, T.; Salangsing, O.-l.; Koomphongse, P.; Kaewket, S.; Kanokratana, P.; Champreda, V. Zymomonas mobilis biofilm reactor for ethanol production using rice straw hydrolysate under continuous and repeated batch processes. Front. Microbiol. 2019, 10, 1777. [Google Scholar] [CrossRef]
- Andler, S.M.; Goddard, J.M. Transforming food waste: How immobilized enzymes can valorize waste streams into revenue streams. NPJ Sci. Food 2018, 2, 1–11. [Google Scholar] [CrossRef]
- Wu, L.; Wei, W.; Liu, X.; Wang, D.; Ni, B.-J. Potentiality of recovering bioresource from food waste through multi-stage Co-digestion with enzymatic pretreatment. J. Environ. Manage. 2022, 319, 115777. [Google Scholar] [CrossRef]
- Sanusi, I.A.; Suinyuy, T.N.; Kana, G.E. Impact of nanoparticle inclusion on bioethanol production process kinetic and inhibitor profile. Biotechnol. Rep. 2021, 29, e00585. [Google Scholar] [CrossRef] [PubMed]
- Rathinam, N.K.; Bibra, M.; Rajan, M.; Salem, D.; Sani, R.K. Short term atmospheric pressure cold plasma treatment: A novel strategy for enhancing the substrate utilization in a thermophile, Geobacillus sp. strain WSUCF1. Bioresource Technol. 2019, 278, 477–480. [Google Scholar] [CrossRef] [PubMed]
- Jin, F.; Hua, D.; Xu, H.; Zhang, X.; Li, Y.; Mu, H.; Zhao, Y.; Si, H. Ethanol recovery from a model broth by the fermentation-extraction-distillation coupling process. Chem. Eng. Process. Process Intensif. 2019, 145, 107669. [Google Scholar] [CrossRef]
- Bui, S.; Verykios, X.; Mutharasan, R.J.I. In situ removal of ethanol from fermentation broths. 1. Selective adsorption characteristics. Ind. Eng. Chem. Process Des. Dev. 1985, 24, 1209–1213. [Google Scholar] [CrossRef]
- Sun, W.; Jia, W.; Xia, C.; Zhang, W.; Ren, Z. Study of in situ ethanol recovery via vapor permeation from fermentation. J. Membr. Sci. 2017, 530, 192–200. [Google Scholar] [CrossRef]
- Kumar, S.; Dheeran, P.; Singh, S.P.; Mishra, I.M.; Adhikari, D.K. Continuous ethanol production from sugarcane bagasse hydrolysate at high temperature with cell recycle and in-situ recovery of ethanol. Chem. Eng. Sci. 2015, 138, 524–530. [Google Scholar] [CrossRef]
- Raquel de Freitas, D.M.; Ofélia de Queiroz, F.A.; de Medeiros, J.L. Second Law analysis of large-scale sugarcane-ethanol biorefineries with alternative distillation schemes: Bioenergy carbon capture scenario. Renew. Sustain. Energy Rev. 2021, 135, 110181. [Google Scholar]
- Walker, K.; Vadlani, P.; Madl, R.; Ugorowski, P.; Hohn, K.L. Ethanol fermentation from food processing waste. Environ. Prog. Sustain. Energy 2013, 32, 1280–1283. [Google Scholar] [CrossRef]
- Seo, D.-J.; Takenaka, A.; Fujita, H.; Mochidzuki, K.; Sakoda, A. Practical considerations for a simple ethanol concentration from a fermentation broth via a single adsorptive process using molecular-sieving carbon. Renew. Energy 2018, 118, 257–264. [Google Scholar] [CrossRef]
- Moukamnerd, C.; Kawahara, H.; Katakura, Y. Feasibility study of ethanol production from food wastes by consolidated continuous solid-state fermentation. J. Sustain. Bioenergy Syst. 2013, 3. [Google Scholar] [CrossRef]
- Ohimain, E.I. Methanol contamination in traditionally fermented alcoholic beverages: The microbial dimension. Springerplus 2016, 5, 1–10. [Google Scholar] [CrossRef] [PubMed]
- Han, Y.; Du, J. Relationship of the methanol production, pectin and pectinase activity during apple wine fermentation and aging. Food Res. Int. 2022, 159, 111645. [Google Scholar] [CrossRef] [PubMed]
- Blumenthal, P.; Steger, M.C.; Einfalt, D.; Rieke-Zapp, J.; Quintanilla Bellucci, A.; Sommerfeld, K.; Schwarz, S.; Lachenmeier, D.W. Methanol mitigation during manufacturing of fruit spirits with special consideration of novel coffee cherry spirits. Molecules 2021, 26, 2585. [Google Scholar] [CrossRef] [PubMed]
- Liao, B.X.; Zhu, S.; Tong, Z.; Liu, G.; Li, Y. Using bioethanol wastes as an alternative phosphorus source for snap bean and radish production. Am. J. Environ. Sci. 2016, 12, 1–7. [Google Scholar] [CrossRef]
- Dry ice to be Manufactured from Ethanol Plant CO2, Supply Agreement Reached between The Andersons Marathon Ethanol and Continental Carbonic Products, Inc. Available online: https://advancedbiofuelsusa.info/dry-ice-to-be-manufactured-from-ethanol-plant-co2/ (accessed on 20 September 2022).
- Process Cooling. Production Facility to Support Dry Ice Manufacturing. 2018. Available online: https://www.process-cooling.com/articles/89287-production-facility-to-support-dry-ice-manufacturing (accessed on 1 November 2022).
- Regenerative CO2. Available online: https://poet.com/co2-dryice (accessed on 1 November 2022).
- Máša, V.; Horňák, D.; Petrilák, D. Industrial use of dry ice blasting in surface cleaning. J. Clean. Prod. 2021, 329, 129630. [Google Scholar] [CrossRef]


| Waste | Type and Food Value Chain | Moisture (%) | Carbohydrate (%) | Protein (%) | Fat (%) | Mineral (%) | Fiber (%) | Reference |
|---|---|---|---|---|---|---|---|---|
| Apple (Whole) | Food loss: Primary production loss | 86 ± 4.72 | 10.39 ± 1.67 | 0.77 ± 0.23 | 0.126 ± 0.04 | 0.32 ± 0.06 | 2.4 ± 0.36 | [72,73,74,75] |
| Apple pomace | Food waste: Food processing waste | 79.2 ± 3.17 | 1.3 ± 0.56 | 1.42 ± 0.54 | 0.87 ± 0.35 | 0.52 ± 0.15 | 17.02 ± 2.62 | [72,76,77] |
| Banana (Whole) | Food loss: Primary production loss | 78.1 ± 4.14 | 16.07 ± 2.32 | 1.14 ± 0.24 | 0.4 ± 0.13 | 1.3 ± 0.64 | 3.1 ± 0.86 | [72,78] |
| Banana peels | Food waste: Food processing waste | 84.6 ± 4.23 | 4.62 ± 0.83 | 1.09 ± 0.032 | 1.79 ± 0.041 | 1.85 ± 0.028 | 6.05 ± 0.13 | [79,80] |
| Carrot | Food loss: Food Processing Waste, Transport, Storage | 89.3 ± 1.4 | 6.17 ± 1.62 | 0.96 ± 0.34 | 0.17 ± 0.08 | 0.79 ± 0.33 | 3.2 ± 0.18 | [81,82] |
| Carrot pomace | Food loss: Primary food production loss | 4.61 ± 0.21 | 24.73 ± 1.22 | 10.06 ± 0.18 | 1.75 ± 0.01 | 7.29 ± 0.32 | 45.12 ± 1.08 | [83] |
| Orange waste | Food loss: Primary food production loss | 4.15 ± 0.32 | 22.28 ± 0.93 | 8.72 ± 0.36 | 1.57 ± 0.02 | 10.03 ± 0.54 | 41.17 ± 1.28 | [83] |
| Pomegranate husk | Food waste: Food processing | 5.5 ± 1.25 | 4.34 ± 0.01 | 1.26 ± 0.17 | 3.57 ± 0.38 | 3.59 ± 0.08 | 17.75 ± 1.61 | [84] |
| Pomegranate seed | Food waste: Food processing | 25.66 ± 0.09 | 4.67 ± 0.02 | 10.42 ± 2.61 | 10.33 ± 0.17 | 3.62 ± 0.13 | 12.12 ± 2.10 | [84] |
| Bread waste | Food loss and waste: Consumer, Wholesale, Retail, Transport, Storage | 24.3 ± 0.8 | 58.6 ± 14.4 | 11 ± 2.1 | 1.8 ± 0.4 | 1.7 ± 0.5 | 3.2 ± 1.29 | [85,86] |
| Cake waste | Food loss: Consume and Retail | 45 ± 6.32 | 36.7 ± 7.26 | 9.35 ± 2.78 | 10.45 ± 2.36 | 0.88 ± 0.023 | - | [87,88] |
| Green Pea peels | Food loss: Primary food production loss | 4.28 ± 0.27 | 19.82 ± 1.36 | 13.27 ± 0.51 | 1.34 ± 0.03 | 7.18 ± 0.34 | 51.48 ± 1.34 | [83] |
| Sugar beet pulp | Food Waste: Food processing | 75.7 ± 2.27 | 1.51 ± 0.54 | 2.13 ± 0.17 | 0.12 ± 0.05 | 2.03 ± 0.71 | 18.51 ± 2.12 | [89] |
| Maize extruded | Food loss: Food processing | 13.7 ± 2.3 | 63.8 ± 10.56 | 7.6 ± 2.31 | 3.6 ± 1.21 | 1.25 ± 0.80 | 10.7 ± 1.6 | [72,90] |
| Rice paddy | Food loss: Primary production waste | 12 ± 0.25 | 55.6 ± 1.4 | 7.5 ± 1.4 | 2.2 ± 0.18 | 5.2 ± 1.23 | 17.52 ± 5.54 | [90] |
| Rice bran | Food waste: Food processing waste | 10 ± 1.3 | 41.22 ± 8.2 | 12.78 ± 1.44 | 11.88 ± 1.6 | 6.21 ± 0.8 | 15.3 ± 1.3 | [72] |
| Rice straw | Food waste: Primary production waste | 8.2 ± 0.12 | - | 4.14 ± 1.02 | 1.3 ± 0.28 | 16.8 ± 2.97 | 64.12 ± 3.9 | [91,92] |
| Rice, polished, broken | Food loss and waste: Food processing | 12.4 ± 1.1 | 75.4 ± 3.85 | 8.1 ± 1.6 | 1.1 ± 0.2 | 1.1 ± 0.13 | 2.1 ± 1.57 | [90,93] |
| Soybean extruded | Food waste: Food processing | 10.5 ± 0.2 | 12.9 ± 2.23 | 36 ± 1.16 | 18.4 ± 1.42 | 5.18 ± 0.45 | 17.06 ± 2.14 | [90,94] |
| Soybean hulls | Food waste: Food processing | 10.9 ± 0.89 | 6.05 ± 4.27 | 11.67 ± 1.6 | 1.96 ± 0.8 | 4.63 ± 0.27 | 65.2 ± 4.54 | [95,96] |
| Sugarcane bagasse | Food waste: Food processing | 54 ± 5.67 | - | 0.97 ± 0.16 | 0.32 ± 0.11 | 3.19 ± 1.08 | 41.52 ± 5.51 | [97] |
| Tomato pomace | Food waste: Food processing waste | 76.74 ± 4.48 | 7.56 ± 1.67 | 4.48 ± 0.63 | 2.28 ± 1.64 | 1.32 ± 0.63 | 8.16 ± 1.38 | [98,99] |
| Wheat Bran | Food waste: Food processing waste | 87 ± 1.1 | 4 ± 0.68 | 2.94 ± 0.17 | 0.67 ± 0.11 | 0.95 ± 0.09 | 4.44 ± 0.82 | [100,101] |
| Wheat (whole) | Food loss: Primary production loss | 87 ± 1.3 | 11.75 ± 0.5 | 2.14 ± 0.22 | 0.3 ± 0.05 | 0.31 ± 0.03 | 1.24 ± 0.03 | [101,102] |
| Kitchen garbage | Food waste: Consumer | 82.78 | 10.8 | 2.68 | 3.11 | 0.39 | [103] | |
| Whey | Food waste: Food Processing | 3.0 ± 0.04 | 71.93 ± 2.71 | 11.64 ± 0.87 | 1.26 ± 0.5 | 7.95 ± 0.5 | - | [104] |
| Bakery Waste | Food waste: Food Processing, Consumer, Transport, Storage | 9.3 ± 0.35 | 70.8 ± 13.42 | 11.25 ± 1.81 | 5.0 ± 3.36 | 2.54 ± 0.82 | 1.1 ± 0.035 | [105] |
| Cafeteria food waste | Food waste: Consumer | 71.6 ± 1.86 | 15.94 ± 1.03 | 2.5 ± 0.23 | 1.87 ± 0.20 | 1.80 ± 0.26 | 6.29 ± 1.56 | [106] |
| Substrate, and Amount of Substrate 1 | Pretreatment | Organism | Fermentation Conditions | Fermentation Type | Bioprocess Type | Ethanol Produced | Yield (g/g) 7 | Productivity 8 | Reference |
|---|---|---|---|---|---|---|---|---|---|
| Food waste (200 g/L) | None | Geobacillus thermoglucosidasius and Thermoanaerobacter ethanolicus | T = 60 °C pH = 6.5 Agitation speed = 100 rpm Inoculum = 5% (v/v) | Fed-Batch, submerged with media components and inoculum addition at intervals | Consolidated bioprocessing 2 | 18.1 g/L | 0.1 g ethanol/g food waste | 0.15 g/L/h | [106] |
| Potato peel waste (40 g/L) | None | Wickerhamia sp. strain SD1 (wild) | T = 30 °C pH = 7.0 Agitation speed = 300 rpm Inoculum = 2% (v/v) | Batch, submerged | Consolidated bioprocessing | 21.7 g/L | 0.54 g ethanol/g potato peel waste | 0.23 g/L/h | [140] |
| Dairy waste (80 g/L lactose) | None | Lactococcus lactis subsp. cremoris strain MG1363 (Recombinant) | T = 30 °C | Fed-Batch (500 g/L lactose feed to at lactose 10 g/L to achieve 20 g/L), submerged | Fermentation | 30.6 g/L | 0.38 g ethanol/g lactose | 0.77 g/L/h | [141] |
| Household food waste (25 g/L) | None | Saccharomyces cerevisiae | T = 30 °C | Batch, submerged | Consolidated bioprocessing | 6 g/L | 0.24 g ethanol/g household food waste | 0.28 g/L/h | [111] |
| Bread waste (613 g/L) | Acid hydrolyzed (HCl 2% v/v and 20% w/v solid autoclaved at 121 °C for 15 min) | Saccharomyces cerevisiae strain KL17 | T = 30 °C pH = 6.0 Agitation speed = 200 rpm Inoculum = 2% (v/v) | Fed-Batch (glucose 400 g/L feed to maintain concentration 20 g/L) | Separate Hydrolysis and Fermentation 3 | 106.9 g/L | 0.17 g ethanol/g bread waste | 3.0 g/L/h | [135] |
| Bread waste (613 g/L) | Enzymatic treatment (Autoclaved at 121 °C for 15 min at pH 4.3, Dextrozyme-0.06% (w/w) loading at 60 °C and pH4.3) | Saccharomyces cerevisiae strain KL17 | T = 30 °C pH = 6.0 Agitation speed = 200 rpm Inoculum = 2% (v/v) | Fed-Batch (glucose 400 g/L feed to maintain concentration 20 g/L) | Separate Hydrolysis and Fermentation | 114.9 g/L | 0.2 g ethanol/g bread waste | 3.2 g/L/h | [135] |
| Grind waste cake (100 g/L) | Enzymatic (α-amylase- 0.08% (v/w) at 95 °C, 200 rpm for 1.33 h) | Saccharomyces cerevisiae | T = 30 °C pH = NV* Agitation speed = 400 rpm Inoculum = 2% (v/v) | Batch, submerged | Separate Hydrolysis and Fermentation | 46.6 g/L | 1.12 g ethanol/g dry cake | 1.17 g/L/h | [87] |
| Food waste (330 g/L) | Screw pressed and dried using steam boiler at 150 °C Dilute acid treatment (H2SO4 0.4% w/v at 160 °C for 64.5 min) | Issatchenkia orientalis | T = 30 °C pH = 3.0 Agitation speed = 200 rpm Inoculum = 5% (v/v) | Batch, submerged | Separate Hydrolysis and Fermentation | 11.1 g/L | 0.04 g ethanol/g food waste | 1.45 g/L/h | [123] |
| Damaged corn grains (140 g/L) | Crushed to powder and enzymatic pretreatment (Amylase- for 1 h) | Saccharomyces cerevisiae MTCC 170 (wild) | T = 31 °C Ph = 5.6 Agitation speed = 150 rpm Inoculum = 1 × 10⁹ cells/mL | Batch, submerged | Simultaneous Hydrolysis and Fermentation | 42.4 g/L | 0.32 g ethanol/g damaged corn grains | 0.88 g/L/h | [67] |
| Organic fraction of municipal solid waste (233 g/L) | Dilute acid pretreatment (H2SO4-1% v/v at 160 °C for 60 min), and Enzymatic treatment (Cellic Ctec2, and HTec 2–20 FPU/g dry substrate at 45 °C, 120 rpm for 72 h) | Mucor indicus CCUG 22,424 (wild) | T = 37 °C pH = 5.5 Agitation speed = 150 rpm Inoculum = 0.02% (w/v) | Batch, submerged | Separate Hydrolysis, Saccharification and Fermentation4 | 27.4 g/L | 0.12 g ethanol/g waste | 0.38 g/L/h | [35] |
| Organic fraction of municipal solid waste (233 g/L) | Dilute acid pretreatment (H2SO4-1% v/v at 160 °C for 60 min) | Mucor indicus CCUG 22,424 (wild) | T = 37 °C pH = 5.5 Agitation speed = 150 rpm Inoculum = 0.02% (w/v) | Batch, submerged | Separate Hydrolysis and Fermentation | 19.1 g/L | 0.082 g ethanol/g waste | 0.27 g/L/h | [35] |
| Acid hydrolysate solid organic fraction of municipal solid waste (23.3 g/L) | Enzymatic treatment (Cellic Ctec2, and HTec 2–20 FPU/g dry substrate at 45 °C, 120 rpm for 72 h) | Mucor indicus CCUG 22,424 (wild) | T = 32 °C | Batch, submerged | Separate Saccharification and Fermentation 5 | 9.5 g/L | 0.41 g ethanol/g waste | 0.13 g/L/h | [35] |
| Damage Rice grains (250 g/L) | Enzymatic (Amylase at 50 °C 100 rpm for 15 h) | Paenibacillus chitinolyticus strain CKS1 (wild) | T = 30 °C | Batch, submerged | Separate Saccharification and Fermentation | 37 g/L | 0.15 g ethanol/g damaged rice grains | 0.62 g/L/h | [142] |
| Carob waste (50 g at 70% humidity) | Physical size reduction | Sacchaaromyces cerevisiae ATCC 7754 (wild) | T = 30 °C pH = 5.0 Inoculum = 3% (v/v) | Batch, solid state | Fermentation | - | 0.15 g ethanol/g carob waste | 0.0043 g/g/h | [143] |
| Carob waste (150 g/L) | Aqueous extraction of milled carob waste at 3% (w/w) solid loading at 70 °C for 90 min) | Sacchaaromyces cerevisiae ATCC 7754 (wild) | T = 30 °C pH = 5.0 Agitation speed = 200 rpm Inoculum = 3% (v/v) | Batch, submerged | Separate Hydrolysis and Fermentation | 26.1 g/L | 0.45 g ethanol/g carob waste | 1.84 g/L/h | [143] |
| Mixture of Rice milling by products (200 g/L) | Alkaline peroxide (7.5% (v/v) 55 °C for 24 h) and Enzymatic pretreatment (Cellic Ctec2-3% enzyme loading) | Sacchaaromyces cerevisiae strain M2 (recombinant#) | T = 30 °C pH = 5.5 | Batch, submerged | Separate Hydrolysis, Saccharification and Fermentation | 51.88 g/L | 0.24 g ethanol/g rice milling by product | 0.98 g/L/h | [60] |
| Food court waste hydrolysate (200 g/L) | Dilute acid pretreatment (H2SO4-1% v/v at 90 °C for 180 min) and enzymatic pretreatment (glucoamylase) | Sacchaaromyces cerevisiae (wild) | T = 30 °C pH = 6.5 Agitation speed = 120 rpm Inoculum = 10% (v/v) | Batch, submerged | Separate Hydrolysis, Saccharification and Fermentation | 10.92 g/L | 0.055 g ethanol/g food waste | 0.46 g/L/h | [124] |
| Pie waste (30% w/v) | Enzyme pretreatment (α amylase, γ amylase, pectinase) 2.5 mg/g glucan | Sacchaaromyces cerevisiae ATCC 4124 (wild) | T = 30 °C pH = 5.5 Agitation speed= 150 rpm Inoculum= OD 2.0 | Batch, Submerged | Simultaneous Saccharification and Fermentation 6 | 103 g/L | 0.34 g ethanol/g pie waste | 2.14 g/L/h | [134] |
| Dairy waste (80 g/L lactose) | None | Lactococcus lactis subsp. cremoris strain MG1363 (recombinant) | T = 30 °C | Fed-Batch (500 g/L lactose feed to at lactose 10 g/L to achieve 20 g/L), submerged | Fermentation | 30.6 g/L | 0.38 g ethanol/g lactose | 0.77 g/L/h | [141] |
| Supermarket food waste (2740 g/L) | Enzymatic pretreatment (glucoamylase-180 mg/kg food waste at 50 °C for 6 h), | Zymomonas mobilis strain ZMA7–2 (mutant*) | T = 30 °C pH = 5.6 RPM = 100 Inoculum = 10% (v/v) | Batch, submerged | Separate Saccharification and Fermentation | 98.17 g/L | 0.036 g ethanol/g waste | 2.2 g/L/h | [18] |
| Palm kernel cake hydrolysate (8.6 g/L) | Steam explosion (20% w/v) at 4.5 bar for 15 min, and enzymatic (mannase-17.9 U/g mannan and Cellic Ctec2-10.4 FPU/g glucan at 5% (w/w) solid loading at T = 50 °C, pH = 5. 250 rpm for 72 h) | Geobacillus thermoglucosida-sius (recombinant) | T = 30 °C pH = 7.0 Agitation speed = 250 rpm Inoculum = 10% (v/w) | Batch, Submerged | Separate Saccharification and Fermentation | 9.9 g/L | 1.15 g ethanol/g waste hydrolysate | 0.21 g/L/h | [144] |
| Household food waste (25 g/L) | Pretreatment by enzymatic treatment pH 5.5, enzyme loading 10 FPU/g waste, at 200 rpm, T = 60 °C for 8 h | Saccharomyces cerevisiae | T = 30 °C pH =5.5 Agitation speed = 100 rpm Inoculum = NV | Batch, submerged | Separate Hydrolysis, Saccharification and Fermentation | 19.26 g/L | 0.77 g ethanol/g household food waste | 0.80 g/L/h | [111] |
| Organic fraction municipal solid waste | Fungal pretreatment for 24 h followed by particle reduction | Zymomonas mobilis and Candida shehatae | T = 35 °C pH = 5.0 Agitation speed = 180 rpm Inoculum = 15% (v/v) | Batch, Submerged | Separate saccharification and Fermentation | 78.8 g/L | 0.16 g ethanol/g food waste | 1.09 | [145] |
| Food waste, (2000 g/L) | Enzymatic pretreatment (amylase 10 U and 120 U glucoamylase/g fed food waste for at 55 °C for 4 h) | Saccharomyces cerevisiae sp. H058 (wild) | T = 30 °C pH = 5.0 Agitation speed = 100 rpm Inoculum = 2% (v/v) | Batch, Submerged | Separate Saccharification and Fermentation | 90.72 g/L | 0.045 g ethanol/g food waste | 1.89 g/L/h | [20] |
| Apple pomace (800 g) | None | Saccharomyces cerevisiae Montrachet strain 522 | T = 30 °C pH = NV RPM = NV | Batch, Solid state | Fermentation | - | 0.044 g ethanol/g of apple pomace | 1.48 g/g/h | [146] |
| Organism | Temperature | Substrate | Ethanol Produced | Advantages | Shortcomings | Reference |
|---|---|---|---|---|---|---|
| T. mathranii strain A3 | 65 °C | Food waste (20% w/v) | 9.3 g/L | Separate dedicated xylose uptake system | Cellulase (-) | [158,159] |
| T. pentosaceus strain DTU01 | 70° C | Liquid pretreated Rapeseed straw (20% v/v) | 2.96 g/L | Can use both | Cannot tolerate high inhibitor concentration | [160] |
| T sp. strain NTOU1 | 70 °C | Rice straw hydrolysate (15% w/v xylose equivalent) | 3.9 g/L | Can utilize xylan | Cannot utilize cellulose | [161] |
| G. thermoglucosi-dasius | 60 °C | Corn stover (5% w/v) Prairie cord grass (5% w/v) | 3.72 g/L 3.53 g/L | Has high ethanol tolerance (10% v/v) | Cannot utilize glucose and xylose simultaneously | [151] |
| G. thermoglucosi-dasius strain TM242 (∆ldh,∆pfl, and pdhup) | 60 °C | Palm kernel cake (8.36 g/L palm kernel cake hydrolysate) | 9.9 g/L | Reduced formate, lactate and other by products | Cannot utilize glucose and xylose simultaneously | [144] |
| K. marxianus YRL 009 (amy+ and amg+) | 42 °C | Cassava starch (20% w/v) | 79.75 g/L | Increased ethanol production | Expresses amylase and glucoamyalse | [162] |
| M. thermoacetica (∆pdul1-), (∆pdul2− and aldh+) | 55 °C | Forest residue hydrolysate (4.5% w/v glucose equivalent) | 0.63 g/L | NA | NA | [163] |
Disclaimer/Publisher’s Note: The statements, opinions and data contained in all publications are solely those of the individual author(s) and contributor(s) and not of MDPI and/or the editor(s). MDPI and/or the editor(s) disclaim responsibility for any injury to people or property resulting from any ideas, methods, instructions or products referred to in the content. |
© 2022 by the authors. Licensee MDPI, Basel, Switzerland. This article is an open access article distributed under the terms and conditions of the Creative Commons Attribution (CC BY) license (https://creativecommons.org/licenses/by/4.0/).
Share and Cite
Bibra, M.; Samanta, D.; Sharma, N.K.; Singh, G.; Johnson, G.R.; Sani, R.K. Food Waste to Bioethanol: Opportunities and Challenges. Fermentation 2023, 9, 8. https://doi.org/10.3390/fermentation9010008
Bibra M, Samanta D, Sharma NK, Singh G, Johnson GR, Sani RK. Food Waste to Bioethanol: Opportunities and Challenges. Fermentation. 2023; 9(1):8. https://doi.org/10.3390/fermentation9010008
Chicago/Turabian StyleBibra, Mohit, Dipayan Samanta, Nilesh Kumar Sharma, Gursharan Singh, Glenn R. Johnson, and Rajesh K. Sani. 2023. "Food Waste to Bioethanol: Opportunities and Challenges" Fermentation 9, no. 1: 8. https://doi.org/10.3390/fermentation9010008
APA StyleBibra, M., Samanta, D., Sharma, N. K., Singh, G., Johnson, G. R., & Sani, R. K. (2023). Food Waste to Bioethanol: Opportunities and Challenges. Fermentation, 9(1), 8. https://doi.org/10.3390/fermentation9010008