Article

Advanced Monitoring and Control of Redox Potential in Wine Fermentation across Scales

1
Department of Electrical and Computer Engineering, University of California, Davis, CA 95616, USA
2
Treasury Wine Estates, Saint Helena, CA 94574, USA
3
Department of Viticulture and Enology, University of California, Davis, CA 95616, USA
4
Department of Chemical Engineering, University of California, Davis, CA 95616, USA
*
Author to whom correspondence should be addressed.
Fermentation 2023, 9(1), 7; https://doi.org/10.3390/fermentation9010007
Submission received: 28 October 2022 / Revised: 6 December 2022 / Accepted: 18 December 2022 / Published: 22 December 2022
(This article belongs to the Topic Bioreactors: Control, Optimization and Applications)

Abstract

:
Combined with real-time monitoring of density and temperature, the control of the redox potential provides a new approach to influencing cell metabolism during growth, cell viability and non-growing yeast activity in wine fermentations. Prior research indicates that the problem of sluggish and incomplete fermentation can be alleviated by maintaining a constant redox potential during the ethanol fermentation. A secondary trait of hydrogen sulfide formation from elemental sulfur also seems to be associated with the development of low redox potentials during fermentation and this might be prevented by the deliberate control of redox potentials in a certain range. While the control of the redox potential during wine fermentations has been demonstrated previously at the research scale (100 L), the ability to control it in larger volumes typically seen in commercial conditions remained unanswered. Wine fermentations from the same load of Cabernet Sauvignon grapes from the 2021 harvest were conducted at three volumes: 100 L and 1500 L in a research winery and 10,000 L in a commercial winery. Using only pulses of air delivery, the redox potential was successfully controlled to −40 mV referenced to a silver/silver chloride electrode throughout the fermentations, at all scales. This appears to be the first published result of a controlled fermentation trial that includes the commercial scale and demonstrates the scalability of control of redox potential in wine fermentations.

1. Introduction

Despite the importance of a complete primary fermentation to the commercial value of wine [1], there are few real-time measurement systems in use that can recognize abnormal fermentations as they develop or control technologies that can modify the conditions to avoid undesirable outcomes such as sluggish, tailing or incomplete fermentations. Redox potential (also referred to as oxidation-reduction potential (ORP) or solution reduction potential or electrode potential) is an electrochemical measurement of the mixture status established by the reactive oxidation and reduction components in a chemical solution. The relationship between the redox potential of a solution and the related microbial growth and activity has been recognized for some time [2]. The measurement of redox potential has been used as a process parameter in fermentation biotechnology for many years and it is known to significantly alter the end products of fermentation in certain amino and organic acid fermentations [3,4,5,6]. More recently, redox potential measurement has seen an adoption for biofuels production [7,8,9], wastewater treatment [10], milk and cheese [11], and in food safety determinations [12].
Compared to pH and dissolved oxygen (DO) measurements that are typically used in the process control of industrial and pharmaceutical fermentations, redox potential measurements provide an independent indicator of reactive redox couples and their changes due to microbial activity. DO may seem to be an intuitive variable to measure; however, it is of little use under anaerobic conditions, such as wine fermentations. The redox potential measures the status of the reactive redox species present, under both aerobic and anaerobic conditions and was reported to be a better variable for process control than DO in penicillin fermentations [13]. As noted in [14], the relationship between partial pressure of oxygen (pO2) and redox potential is likely to depend on the chemical nature of the culture medium. While the authors in [14] found a strong relationship between pO2 and redox potential, they were studying a 7 pH medium where oxygen reactions are occurring, a completely different medium than grape juice. The main components of the redox buffer in wine are considered to be the Fe(II)-tartrate/Fe(III)-tartrate couple and other iron complexes, the Cu(I) and Cu(II) complexes, and the reduced glutathione (GSH)/oxidized glutathione (GSSH) couple [15]. There is an existing natural level of glutathione in grape juice and yeast export glutathione during wine fermentations [16]. Wine fermentation is anaerobic and the redox potential changes by more than 100 mV in completely anaerobic conditions [17,18]. There is little evidence to suggest that redox potential is solely dependent on the concentration of oxygen in wine fermentations. The availability of oxygen activation species (i.e., reducing metals – Fe(II), Cu(I)) are critical to the redox response [19].
Since some redox couples in grape juice involve protons, the overall redox potential of the mixture is pH dependent. From the Nernst equation, the change in pH unit of 1 corresponds to an approximately 59 mV change in redox potential at standard conditions [20]. Grape juice can change pH during fermentation due to a shift in dissociation constants from an increase in ethanol, the precipitation of potassium bitartrate, the utilization of malic acid, the production of succinic acid, the consumption of amino acids by yeast and the possibility of a concurrent maloactic fermentation, however, these changes are expected to be small enough (less than 0.1 pH) to have little impact on the redox potential [21].
Historically, there has been significant interest in redox potential as a medium property and the changes in it during wine fermentation [22,23,24]. In [23], Ribereau-Gayon describes an aeration example of a red wine starting at 22 °C, which was classified as normal and finished in 6 days with a peak temperature of 30 °C, while the unaerated case was slow and not complete even after 20 days and did not reach 30 °C. In [24], Schanderl demonstrated that lowering the juice redox potential by 60 mV resulted in a delay in the onset of fermentation by 3 days even though the fermentation rate and completion appeared to be the same. Even with such observations, redox potential has not been widely accepted as an indicator of the state of reactive redox couples in wine or a factor in the redox signaling in the growth and metabolism of yeast or bacteria during wine fermentations.
Studies in wine fermentation have shown that once a significant yeast population exists, the redox potential value decreases from an initial value of +200 or +100 mV to a minimum as low as −200 mV during the growth phase relative to a saturated calomel electrode [17,22] before returning to intermediate values as the fermentation is finishing. Higher temperatures lead to faster growth rates, which cause the potential to fall more quickly and usually to decrease to a lower minimum [18]. There is significant variation in both the initial redox potential of grape juices and the apparent buffer capacity due to juice composition and in response to the yeast metabolism during fermentation. The addition of air can result in increases in the potential of 150 to 200 mV [25]. Several recent reports indicate changes in the expression of redox-related genes in yeast and bacteria under conditions where the medium has been altered [26,27,28] and it is now generally believed that these are specific cell responses to the redox potential of the external medium. There are reports that yeast viability appears to be altered when the redox potential is controlled at a particular value when compared to the uncontrolled condition, in model high gravity solutions [29] and in wine fermentations [25].
The formation of H2S continues to be a problem in contemporary wine production and is believed to be influenced by the redox potential that prevails during yeast fermentation. Fermentation studies in the presence of elemental sulfur showed that peak H2S formation occurred when redox fell from its initial value to its minimum value [30]. Further work showed that by lowering the redox at the beginning of fermentation, the H2S production developed earlier and at greater levels [31]. This suggests that a low redox environment in wine can enable H2S production, independently or an indirect result of yeast metabolism; thus, the control of redox potential throughout fermentation to higher setpoints might limit or eliminate H2S production. In the redox reaction
S + 2 H + + 2 e H 2 S
The Nernst equation [20] can be rearranged to find the fraction in oxidized form of the S/H2S redox couple. At standard conditions and 3.5 pH, the fraction in oxidized form ( F o x i d i z e d ) for a given redox potential relative to the standard hydrogen electrode (SHE) ( E s e t p o i n t in mV) is given by
F o x i d i z e d = Q Q + 1 ,
Q = ( 10 E s e t p o i n t + E h 59.2 m V ) 1
where Q is the reaction quotient between S and H2S and E h is the standard potential in mV of the reaction shown in Equation (1). At standard conditions and 3.5 pH, E h =−66.5 mV (SHE). In this work, a silver/silver chloride (Ag/AgCl) reference electrode was used, therefore, 220 mV is subtracted from values in SHE to relate to measurements with the Ag/AgCl reference electrode. Figure 1 shows Equations (2) and (3) for E s e t p o i n t between −420 to −20 mV. In this work, a setpoint of −40 mV was used which corresponds to greater than 99.9% in the oxidized form. Given the extremely low sensory threshold for H2S of about 1 ppb [32], even a small amount of H2S can affect the quality of wine. A setpoint of −40 mV provided a compromise between a high fraction in the oxidized form and a redox potential setpoint that was acceptable for the commercial-scale fermentation.
Previous work has demonstrated a system to monitor and control the redox potential in wine fermentations [25]. This system used a redox probe with a platinum electrode referenced to SHE for measurement, and air additions directed by an on–off controller to increase and hold the redox to above +220 mV which is equivalent to 0 mV on the Ag/AgCl scale used in this work. These fermentations were performed at the 100 L scale, larger than any reported bench-scale studies. They demonstrated the control of redox potential in both white (Chardonnay) and red (Grenache and Mataro) fermentations but at a scale still smaller than commercial wine fermentation volumes.
The response of the redox potential to the addition of air bubbles involves a series of steps. One of these is the dissolving of oxygen from the bubble volume across the bubble-liquid interface, while another is the mixing of volume elements within the fermentor. The bubble size depends upon the diameter of the hole (or nominal pore size in a porous material) and the pressure difference between the gas side and the liquid side of the bubbler. In a previous study, 20- μ m porous spargers were used to control redox potential in 100 L fermentations [25]. The small air bubbles were chosen to increase the rate of oxygen dissolution in the juice, however, more recent studies on wine oxidation suggests small (1 mg/L) amounts of oxygen are needed to increase the redox potential of grape juice [15,33]. Since small porous spargers are costly and can introduce frothing and clogging challenges, spargers with larger holes may be more attractive for the industry in achieving the necessary oxygen dissolution. The importance of scale in determining the outcome arises although the rate of gas delivery by different bubbling systems can be the same, the static pressure of the liquid and hence the bubble size, will depend on the height of the liquid which in turn depends on the size of the fermentor. As a bubbling system is applied in different fermentation volumes and shapes, the height and natural and induced convection will influence the effectiveness of the mass transfer from the bubble to the liquid as well as the bulk mixing within the liquid. In the case where the rate of mass transfer of oxygen is limiting the reaction rate and response of a control system, different outcomes are to be expected as the fermentor volume is increased. In the case where it is not limiting the rate, similar control responses across fermentor volumes is expected when mixing times are established as the volume is increased. While the redox potential is known to respond quickly to the addition dissolved oxygen from air [25], the responsiveness to a controlled addition into different fermentation volumes where mixing can be a limitation, cannot be predicted from theory alone.
In this work, we demonstrate the control of redox across a hundred-fold range in volume by conducting fermentations at the research (100 L), pilot (1500 L) and commercial (10,000 L) scales using the grapes from the same vineyard. We demonstrate that the redox potential can be controlled at a chosen value by using small periodic additions of air into these wine fermentations.

2. Materials and Methods

2.1. The Sensing and Control System

Figure 2, Figure 3 and Figure 4 show the cross section of the experimental setup at 100 L, 1500 L and 10,000 L scales, respectively. Table 1 shows the control parameters used at each scale.
Oxidation-reduction potential (ORP) probes (243050, Hamilton Company; Reno, NV, USA) were placed in the fermentors to monitor the redox potential in real time and export the values into a database. The probes were referenced to a silver/silver chloride electrode (+220 mV) and prepared before use according to the manufacturer’s recommendation. The 100 L fermentors and corresponding fermentation controllers are research fermentors that have been designed to precisely control temperature and mixing between replicates and allow fermentations to be conducted similar to large scale primary fermentations as has been demonstrated previously [25,34,35]. At the 1500 L and 10,000 L scales, a programmable logic controller (PLC) was programmed to read the current redox potential and to add air by actuating a solenoid valve if the redox was below the setpoint. The air supply was regulated to 206.8 kPa (30 psi), and the solenoid opening interval and air flow rate were set to achieve a desired redox potential increase of +50 to 100 mV.

2.2. The Wine Fermentations

Fermentations were performed at 100 L, 1500 L and 10,000 L volumes, in jacketed, temperature-controlled, stainless-steel fermentors. Table 2 summarizes the number of fermentations performed at each scale, including three replicates of the uncontrolled fermentation and two replicates of the controlled fermentation at the 100 L scale. Cabernet Sauvignon grapes (Alexander Valley, Sonoma County, CA, USA) from the same block were crushed and distributed across the fermentors. The 100 L and 1500 L fermentations were performed at the UC Davis Teaching and Research Winery (Davis, CA, USA) and the 10,000 L fermentation was performed at the Treasury Wine Estates, Beringer Winery (Saint Helena, CA, USA). In all cases, the juice density, as °Brix, was measured in real time during fermentation by using differential pressures across a vertical distance between the sensors [36].
Sulfur dioxide in the form of potassium metabisulfite was added at 50 mg/L to the must directly after crushing. Yeast (Laffort B0213) was rehydrated in GoFerm (Lallemand) and added at a rate of 240 mg/L. One day after inoculation, an addition (2.5 g/L tartaric acid, 240 mg/L of Fermaid K (Lallemand) and 780 mg/L of diammonium phosphate to provide 83 mgN/L) was made. Pump-overs were performed 3 times per day from inoculation to 15 °Brix and 2 times per day from 15 to 10 °Brix with each pump-over equating to 1 volume of juice. From 10 to 0 °Brix, pump-overs were maintained at 2 times per day with only half a volume of juice moved each time. The volume of the pump-overs on days 9 and 10 of the commercial fermentation was reduced further (1/3 of a volume). The temperature setpoint was 27 °C and the redox potential setpoint was −40 mV Ag/AgCl.

3. Results

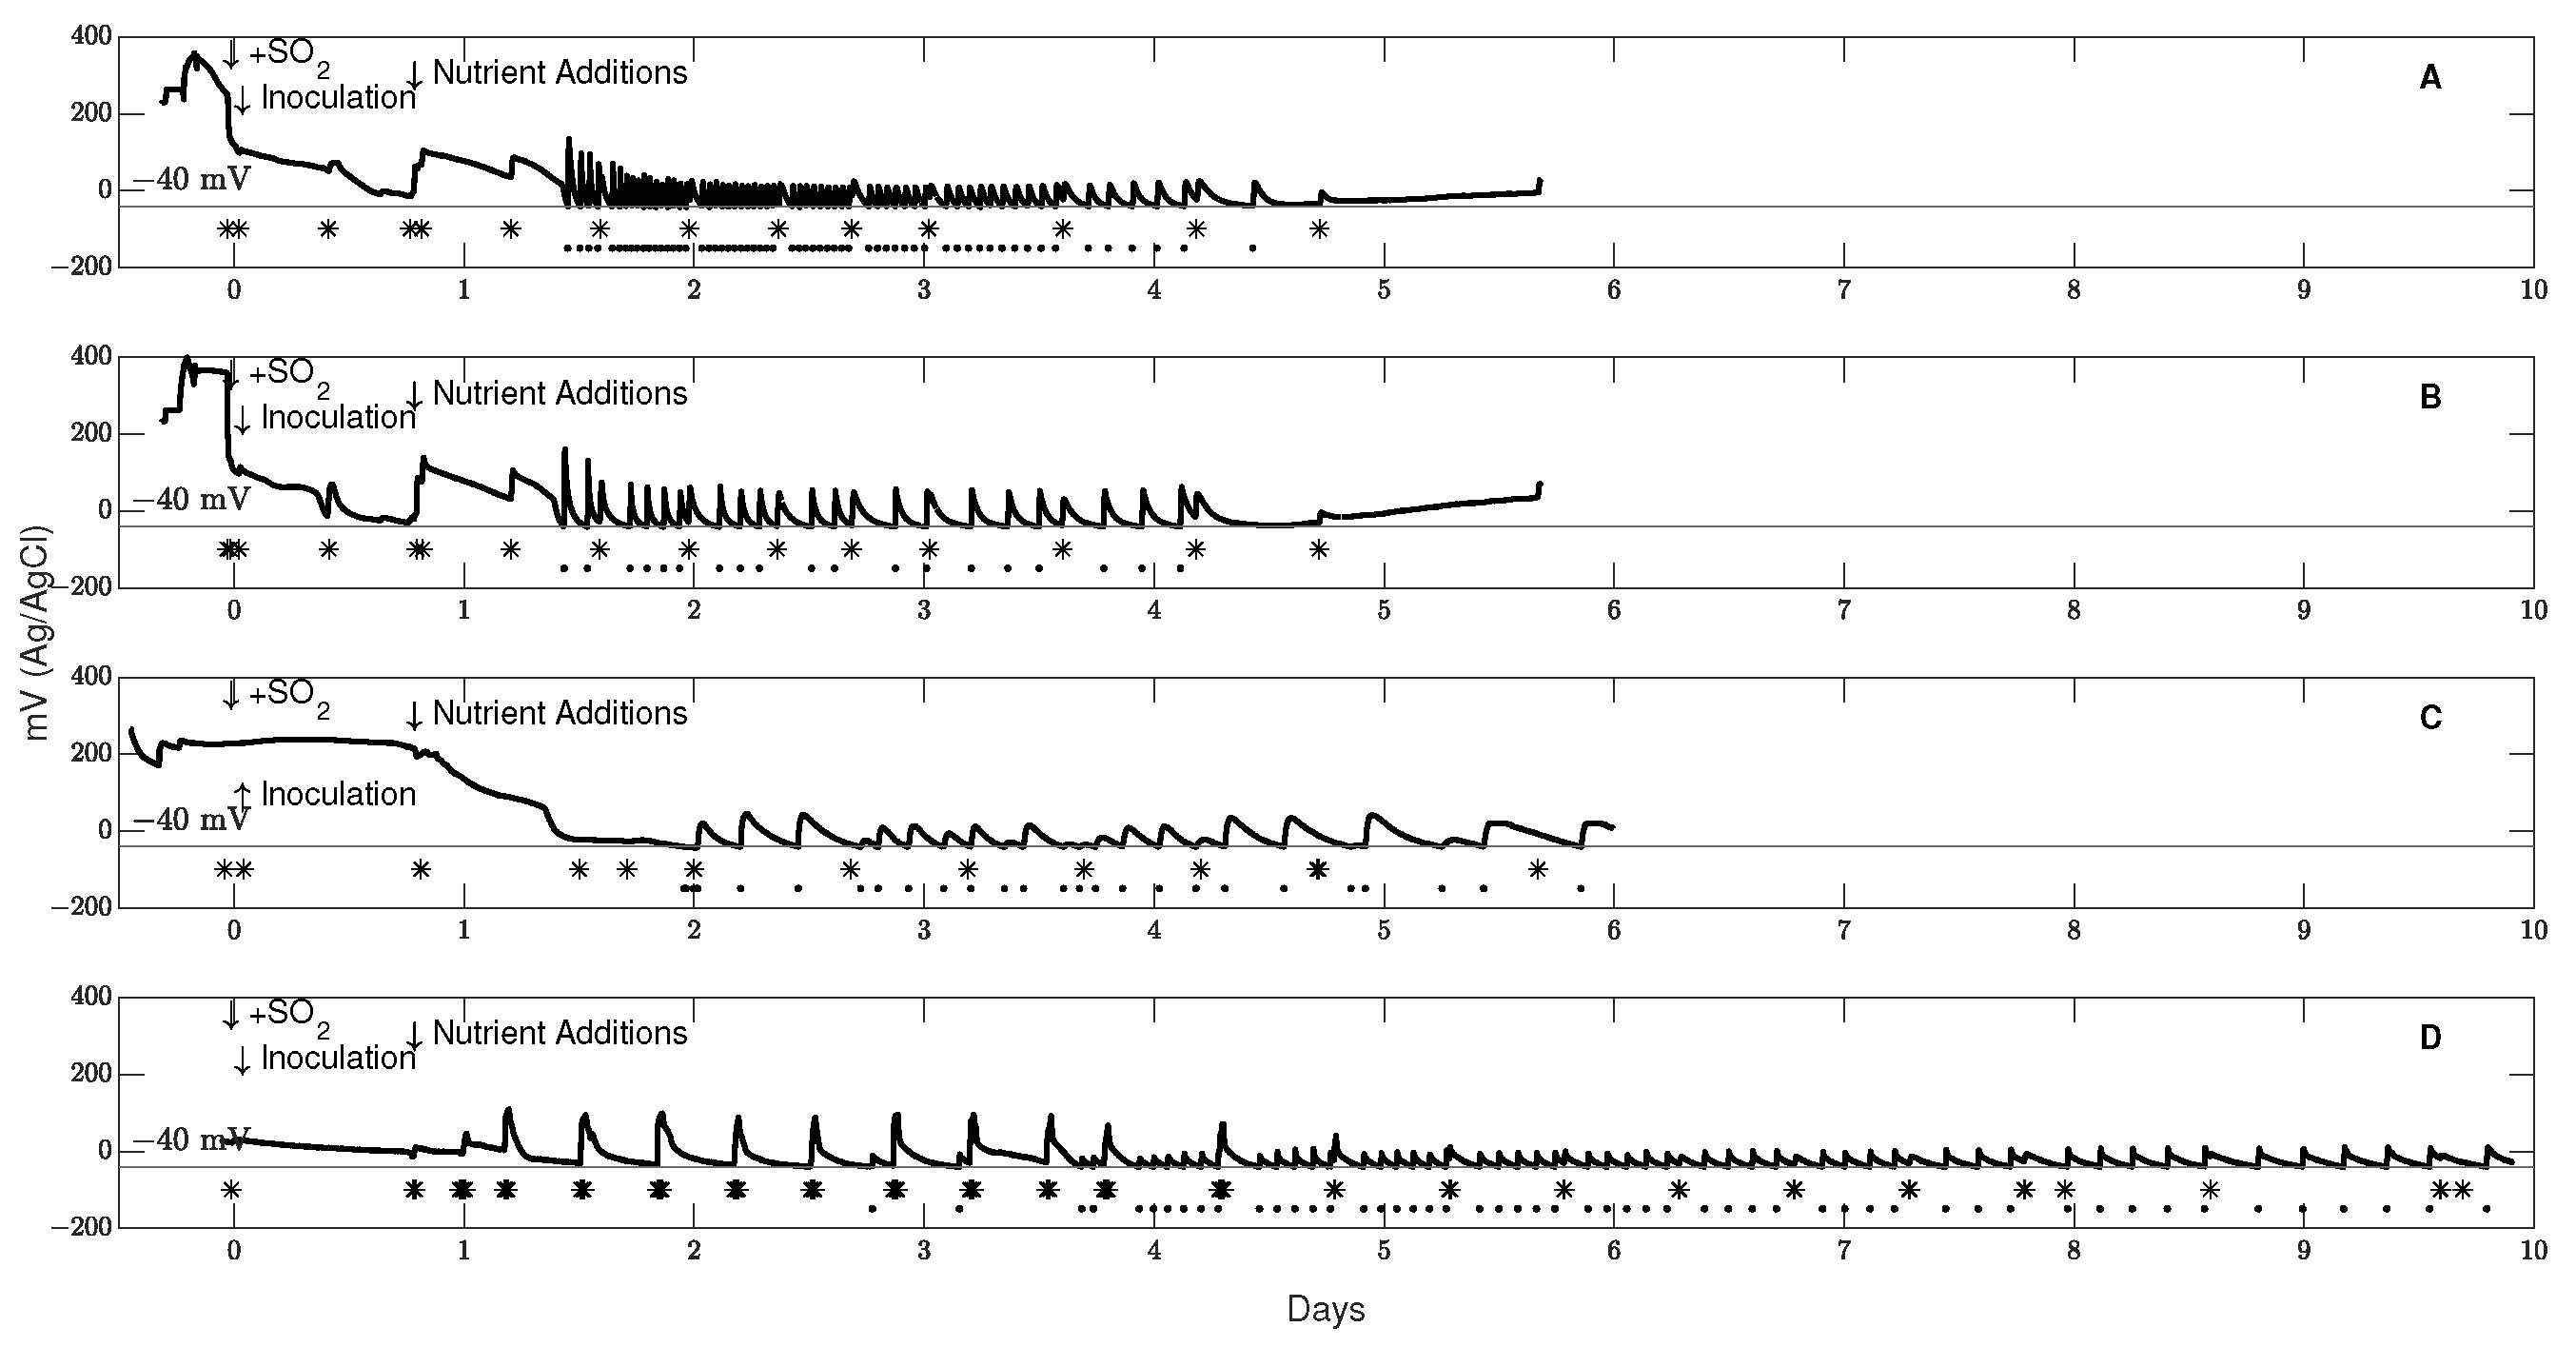
3.1. Control of Redox Potential across Scale

The primary goal of this study was to control the redox potential in research, pilot and commercial-scale fermentations. The setpoint of −40 mV, is a lower setpoint than in an earlier study [25] but higher than the natural minimum of the uncontrolled wine fermentations and an acceptable level for commercial winemaking.
Figure 5 and Figure 6 show the redox potential during uncontrolled and controlled fermentations, respectively. In the uncontrolled fermentations of 100 L, the redox increases by 50–100 mV as a result of the pump-overs; however, the natural minimum redox is between −80 and −90 mV. The introduction of small volumes of air in these research-scale fermentors is an outcome of their design. In the controlled fermentations at the small scale, the redox is prevented from falling below −40 mV in all cases with supplementary air additions, corresponding to the solenoid valve opening, Figure 6A,B. The redox potential is held to above −40 mV in all cases across all fermentation scales Figure 6A–D.
The frequency of solenoid opening shows that more air was needed around the maximum rate of fermentation, 2.5 days for the 100 L and 1500 L and 4.5 days for the 10,000 L case. It is clear from the uncontrolled small fermentations (Figure 5) and at all scales of the controlled fermentations (Figure 6) that the introduction of air with periodic pump-overs is insufficient to keep the redox potential at or above −40 mV. In Figure 6, the 1500 L scale shows a noticeable lag in the redox signal. This might be attributed to differences in yeast inoculum preparation; however, this lag had no impact on the demonstration of redox potential control across 100-fold scales.

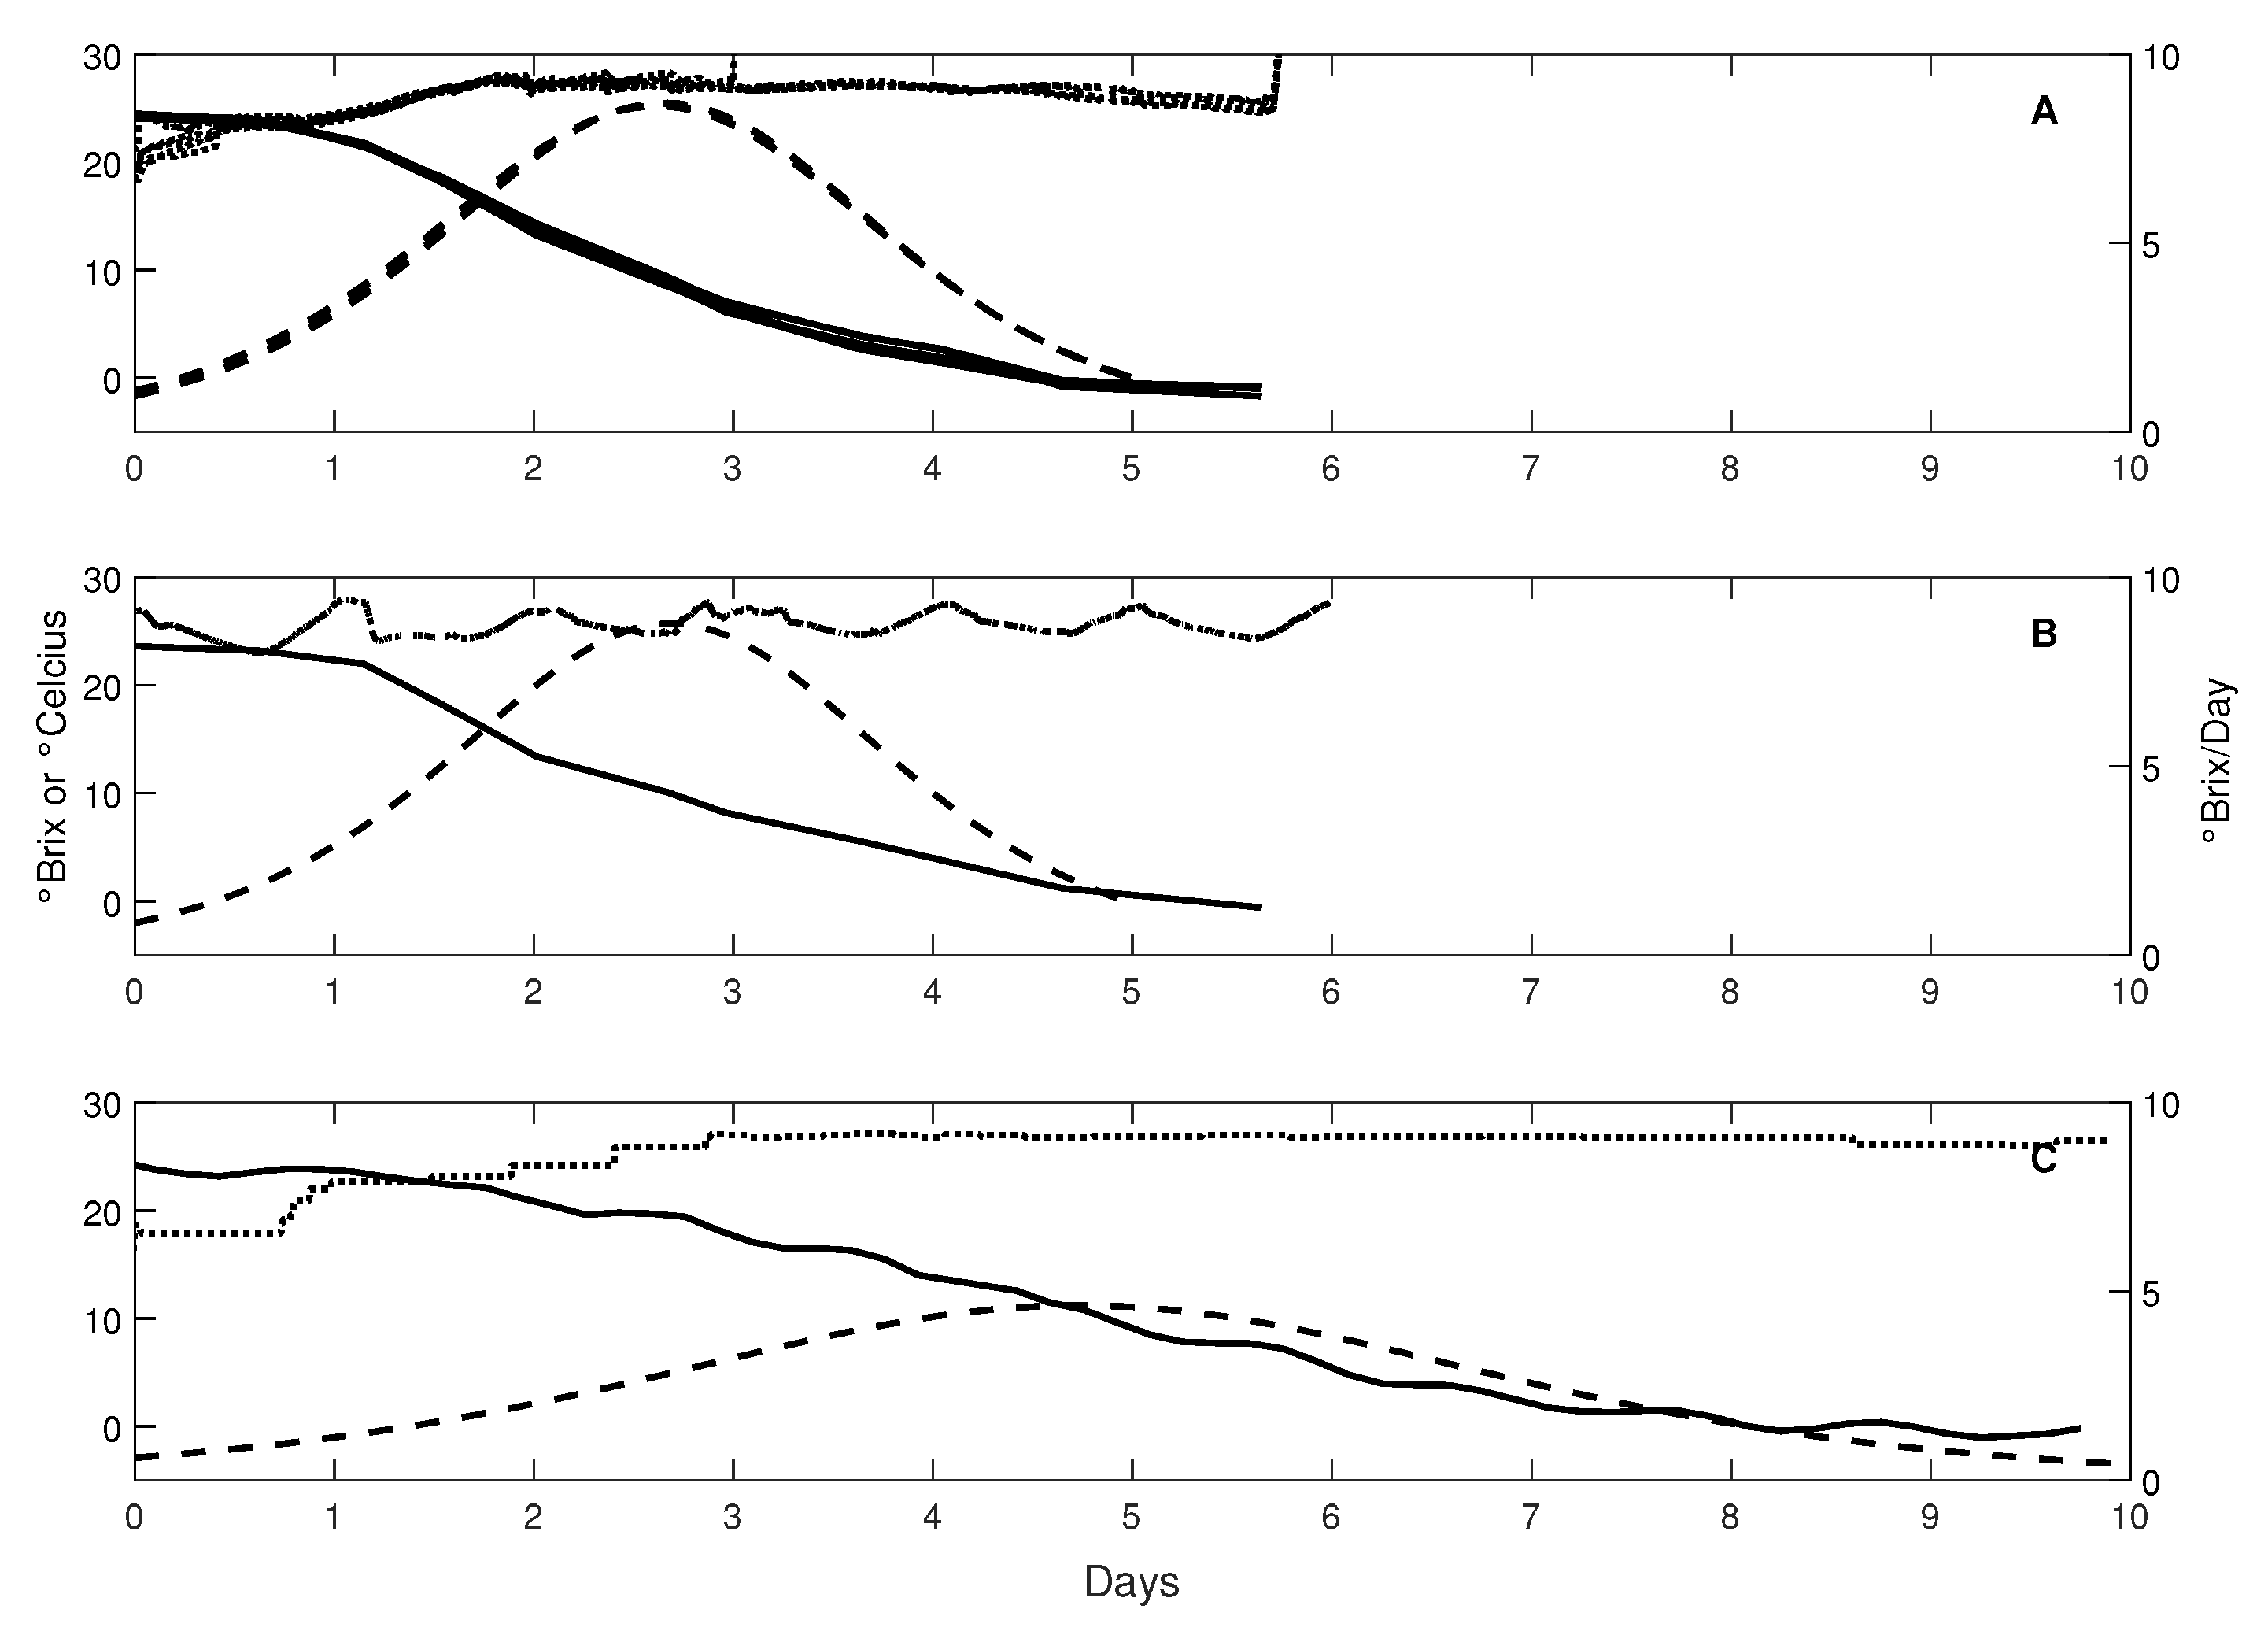
3.2. Fermentation Patterns at Different Scales

The secondary goal of this study was to compare development of the fermentation curves with the same grapes across scale. Figure 7 shows the fermentation patterns across scale. At the 100 L and 1500 L scales, the fermentation rates were nearly identical, with a maximum fermentation rate of 8 °Brix/day at 2.6 days. At the 10,000 L scale, the lower juice temperature at the beginning of fermentation led to a longer fermentation time and lower maximum of fermentation rate. However, this thermal effect did not change the ability to control the redox potential successfully at this scale.

3.3. Fermentation Parameter Estimation at Different Scales

Table 3 and Table 4 show the estimated maintenance rate of the yeast, initial amount of nitrogen in the juice, lag time, maintenance rate of the yeast, viability constant and the ethanol inhibition constant returned from a nonlinear parameter estimation method applied to an existing wine fermentation model (Boulton model) [37]. The parameters of the Boulton model are estimated based on the measurements of °Brix and temperature. The parameter estimation method finds the parameters that minimize the sum of squared residuals between the measured and model °Brix [36]. The Boulton model has been used to diagnose wine fermentations and predict future fermentation heat release for refrigeration applications [36].
In the replicated 100 L fermentations, the specific maintenance rate was on average 0.04 (1/h) greater in the controlled redox potential case, Table 4. The viability constant was also on average 5.1 (1/g·h) lower. This maintenance rate effect is similar to that found in an earlier study, where the fermentations were controlled at +220 mV (SHE) which is equivalent to 0 mV on the Ag/AgCl scale used in this work [25].

4. Discussion

The control of the redox potential during wine fermentation differs from that in other systems due to the effects of pH and the buffer capacity of the redox potential. The ease with which the potential can be shifted by the addition of air (or any other oxidative components) depends on the redox buffer capacity and few other fermentation media include the iron tartrate and glutathione components that are characteristic of grape juices. According to the Nernst equation [20], studies at higher pH typically begin at lower potentials, with the medium potential decreasing by approximately 60 mV for each increase of one pH unit. From a recent study on the kinetics of autoxidation of tartaric acid in the presence of iron [33], at a typical concentration of 3 mg/L of iron, approximately 54 μ m of oxygen is expected to be activated (one electron from Fe (II) per one oxygen atom). This corresponds to only 0.86 mg/L of dissolved oxygen being consumed by activation. The oxygen consumed is limited by the iron content of the juice and becomes independent of the dissolved oxygen concentration beyond this amount because there is no available Fe (II) tartrate complex to react with until the iron returns to the Fe (II) state. The redox potential is not affected by the dissolved oxygen concentration since oxygen is unreactive by itself and only electron transfer reactions that have favorable kinetics are involved in the establishment and changes of the redox potential of the solution. Instead, the increase in redox potential from air additions is attributed to the formation of hydrogen peroxide [33]. The redox buffer capacity of other fermentation media reported [7,8,9,28,38,39] is also expected to be lower because they do not contain the iron tartrate/glutathione system making them easier to control the potential during fermentation than wine.
The reproducibility of the uncontrolled 100 L fermentations shows the natural minimum of redox potential (Figure 5) under these fermentation conditions. The spikes in these fermentations reflect the introduction of some air during the pump-over operation, which is a feature of the design of these fermentors and demonstrates how little oxygen is needed to influence redox potential. The corresponding pattern for the controlled redox potential in other 100 L fermentors of the same design is shown in Figure 6. The first controlled addition of air begins after 36 h, and the additions repeat after approximately 20 min. The nature of the response in redox potential is a rapid increase to a peak value followed by a slower decay back to the starting value. These traces are interpreted as being due to a rapid formation of hydrogen peroxide from low concentrations of dissolved oxygen, followed by the slower consumption of hydrogen peroxide by the oxidation of reduced glutathione in the juice, following the autoxidative nature of juices and wines [33]. In this sequence, the Fe (III) ions return to the Fe (II) ion state where they again form tartrate complexes and are available to activate another increment of dissolved oxygen if it is available. This description does not include any role for phenolic components since they are not involved in these early rapid stages of the autoxidation cascade [15] and results with both white and red wines indicate that the shape and decay time of the peaks seem to be unrelated to the phenolic concentrations. The height of the response peak and its rate of decline are expected to be determined by the iron tartrate complex and glutathione concentrations in the juice and the redox buffering capacity that includes all reactive components. It is clear from Figure 6 that the peak height changes during the fermentation and this is thought to be caused by an increase in the redox buffer capacity due to additional glutathione released by the yeast. This release of glutathione by yeast is also likely to explain the early decline of the potential in all wine fermentations. Ethanol formation appears to slow the extent of peroxide formation and perhaps the reactions with glutathione, as can be seen by the increase in decay time of the redox potential as ethanol accumulates. These outcomes can be observed after day 3 for the 100 L fermentations, day 4 for the 1500 L fermentation and day 8 in the 10,000 L fermentation in Figure 5 and Figure 6.
In contrast to other process variables such as temperature and density, the response dynamics of redox potential seem to indicate that there is little heterogeneity in the redox potential control loop even at 10,000 L. Further work should be performed to understand the redox potential in large fermentors as a function of position. The effect of volume effect in the control of redox potential shows up in the different air flow rate as a function of liquid height on a constant regulated air pressure. The 100 L and 10,000 L volume have rates that are expected from their size, but this does not appear to influence the ability to control the redox potential and is further evidence that only small amounts (<1 mg/L) of Oxygen is needed.
While many models for wine fermentation have been proposed, the Boulton model used in this work allows measurements of density to be compared with the estimation of density from mixture composition. The Boulton model also differs from most fermentation models in its description of cell viability with time, ethanol concentration and temperature. It predicts cell viability-time patterns very similar to those observed for Saccharomyces cerevisiae in juice fermentations at different temperatures [40]. It is the cell viability and maintenance rate of non-growing cells that characterize the second half of wine fermentations, and which allow the detection of abnormal yeast performance by the model at an early stage in sluggish and incomplete fermentations. The model parameters (Table 3 and Table 4) show some variation with scale, possibly due to temperature and composition gradients that are expected within larger vessels. This is particularly so for temperature measurements which are taken near the inside wall, and this can cause the fermentation parameters to reflect temperature effects on the estimated yeast maintenance rate and cell viability.
Winemaking practices that introduce some air during the fermentation, such as splashing into a bin immediately before the pump-over operation, a rack-and-return operation in which the entire fermentation liquid is transferred into a second vessel before being returned to the first usually over the skin cap, in-line air injection during regular pump-overs, use of a Venturi tube to draw air into a pump-over line, intense air pulses to mix the fermenting liquid and cause the skin cap to break up, and punch-downs in open-top fermentors, are all expected to have a short-term effect on the redox potential. However, any effect of these aerations on the redox potential are short-lived, typically 20 to 30 min, meaning that such practices can have only a temporary impact and are unlikely to provide the same result as controlling the redox potential at a predetermined value as described in this work. Because these operations are usually only performed two or at most four times each day, the potential would be altered for 30 min or so before returning to the uncontrolled state for the next 6 to 12 h. One option in the future might be to control the redox potential during part of the fermentation, for example only until yeast growth is completed which is generally indicated by the time of the peak fermentation rate. In contrast to most other commercial fermentations such as brewing, wine fermentation contains both a growing phase in the first half and non-growing, dying phase in the second half. Whether the fermentation will go to completion in second half is largely dependent on the non-growing metabolic activity and death rate as a function of time and ethanol. The need for control of the redox potential after the growing phase may not be necessary in non-growing cells. Additionally, concerns about any oxidative reactions that might be stimulated by the formation of ethanol-related radicals, and subsequent chain reaction products might be minimized with such a control strategy. In this work, a redox potential setpoint of −40 mV was chosen. From Figure 1, −40 mV corresponds to greater than 99.9% in the oxidized form. While a higher redox potential setpoint would theoretically improve H2S mitigation, −40 mV was chosen as a compromise between H2S mitigation and minimizing concern of oxidation effects in the commercial fermentation. Further work should consider the effects of redox potential setpoints on H2S formation in wine under controlled sulfur conditions.
There is currently no simple way to calculate the equilibrium redox potential of a solution mixture such as juice or wine, however, the redox potential appears to depend on the concentration and properties of certain reactive components throughout the fermentation. This is most clearly observed in Figure 6. The frequency of air pulses increases through the first part of fermentation to the maximum rate of fermentation, near the end of day 2, then decreases through the end of fermentation. This is interpreted as being due to the formation and release of reduced glutathione during yeast growth and a slowing effect of the peak decline due to the concentration of ethanol.
In this work, a simple on–off controller where the on action was determined by a time interval was used. The time interval was set to ensure the redox potential remained above the setpoint. A Proportional-Integral-Derivative (PID) controller could have also been used. By combining the extracellular redox potential with a model for wine fermentation kinetics, the actuator could be controlled by real-time measurements and unique predictions of the fermentation trajectory, instead of a single set of PID control settings applied to all fermentations. The introduction of derivative control action can lead to instability in the control loop when applied to peak responses like those found in these fermentations. The integral action is often used to eliminate any residual offset but its use in a rapidly reacting systems, such as found here, is unlikely to capture the time aspect into the integral term. The proportional action with a high gain becomes similar to the on–off controller that was used here.
In this work, more air than needed was used to keep redox potential above the setpoint as evidenced by the magnitude of the peaks after an air addition. In the commercial-scale case, the ratio of air added to the wine volume is 4.32 while the release of carbon dioxide from this fermentation would correspond to a gas to liquid ratio of 55 [21]. The use of oxygen as an alternative to air would have resulted in a gas to liquid ratio of 0.86. The ratio of air applied to juice volume in the 10,000 L fermentation is higher than those at the 100 L scale in this example and less air might be acceptable in an optimized condition. Future studies could investigate this optimization.
From previous work in model wine solutions [33], it is expected that the response to the addition of air to differ between grape juices. This is likely due to compositional factors such as the total iron concentration, the glutathione concentration, pH and the initial redox potential of the juice. While these factors might determine the quantity of hydrogen peroxide produced, they will also influence the buffer capacity, or the resistance to change, of the redox potential of a juice. As a result, the change in the potential observed per unit of oxygen that is activated is expected to differ between juices.
An optimal setpoint potential is expected to depend on fermentation temperatures and perhaps on juice pH. This report describes the results of only one setpoint value and this value has not yet been investigated across a range of wine fermentation conditions. The control of redox potential at certain levels may result in desirable effects on cell age, maintenance rate and cell viability and future studies might investigate changes in the proposed stress-resistance genes of wine yeast [41]. Controlling the redox potential during fermentation is expected to influence end products from yeast metabolism, especially on glycerol and maybe succinate and acetaldehyde. Studies by others have already shown [39,42,43] that different byproducts accumulate under different redox conditions in ethanol fermentations. Since this work was completed, a study of controlled redox potentials in synthetic grape juice has reported changes in several expressed genes involved in the synthesis of fatty acid ethyl esters [28]. There may be other effects on glutathione (and thiols), glycerol, succinate and acetate ester formation as well as effects on the outcomes of simultaneous ethanol and malolactic fermentations. The ability to control the redox potential at all scales, demonstrated here, will provide many research opportunities in the future.

5. Conclusions

The control of the redox potential during wine fermentation was demonstrated at research (100 L), and (1500 L) and commercial (10,000 L) scale, using must from the same lot of grapes. Air was introduced through a sparger or open-ended tube to increase redox potential so that it did not fall below the setpoint. More frequent air delivery was needed during the midpoint of fermentation when the rate of fermentation was greatest. Fermentation modeling indicated that the specific maintenance rate of the yeast was enhanced between controlled and uncontrolled replicates of the 100 L fermentations. These experiments appear to be the first successful application of controlled redox potential in a commercial-scale wine fermentation.

Author Contributions

Conceptualization, R.B., A.K. and R.C. and R.R.; methodology, R.B., A.K, R.C. and R.R.; formal analysis, J.N.; investigation, J.N., L.C.-R., and R.C.; resources, R.C. and L.C.-R.; data curation, J.N.; writing—original draft preparation, J.N. and R.B.; writing—review and editing, J.N., R.B., R.C. and A.K.; visualization, J.N.; supervision, A.K. and R.C.; funding acquisition, A.K. and R.B. All authors have read and agreed to the published version of the manuscript.

Funding

The Rodgers University fellowship in Electrical and Computer Engineering (J.N.) and the Stephen Sinclair Scott Endowment (R.B.).

Institutional Review Board Statement

Not applicable.

Informed Consent Statement

Not applicable.

Data Availability Statement

Data will be made available on request to the corresponding author.

Acknowledgments

We thank Treasury Wine Estates for the grapes used in this experiment.

Conflicts of Interest

The authors declare no conflict of interest.

Abbreviations

The following abbreviations are used in this manuscript:
DODissolved Oxygen
ORPOxidation-reduction Potential
PLCProgrammable Logic Controller
Ag/AgClSilver/Silver Chloride
SHEStandard Hydrogen Electrode
PIDProportional Integral Derivative

References

  1. Bisson, L.F. Stuck and Sluggish Fermentations. Am. J. Enol. Vitic. 1999, 50, 107–119. [Google Scholar] [CrossRef]
  2. Hewitt, L.F. Oxidation-Reduction Potentials in Bacteriology and Biochemistry; London County Council: London, UK, 1931. [Google Scholar]
  3. Hongo, M.; Ishizaki, A.; Uyeda, M. Studies on oxidation-reduction potentials (ORP) of microbial cultures. Part I. L-glutamic acid fermentation. Agric. Biol. Chem. 1972, 36, 141–145. [Google Scholar]
  4. Hongo, M.; Uyeda, M. Studies on oxidation-reduction potentials (ORP) of microbial cultures. Part II. L-valine fermentation by Aerobacter aerogenes No 505 and its conversion to lactic acid and alanine formation under anaerobic conditions. Agric. Biol. Chem. 1972, 36, 269–272. [Google Scholar]
  5. Hongo, M.; Uyeda, M. Studies on oxidation-reduction potentials (ORP) of microbial cultures. Part III. Lactic acid fermentation by Rhizopus G-36 (1). Agric. Biol. Chem. 1972, 36, 273–278. [Google Scholar] [CrossRef]
  6. Hongo, M.; Uyeda, M. Studies on oxidation-reduction potentials (ORP) of microbial cultures. Part IV. Lactic acid fermentation by Rhizopus G-36 (2). Agric. Biol. Chem. 1972, 36, 279–284. [Google Scholar] [CrossRef]
  7. Lin, Y.-H.; Chien, W.-S.; Duan, K.-J.; Chang, P.R. Effect of aeration timing and interval during very-high-gravity ethanol fermentation. Process Biochem. 2011, 46, 1025–1028. [Google Scholar] [CrossRef]
  8. Liu, C.-G.; Wang, N.; Lin, Y.-H.; Bai, F.-W. Very high gravity ethanol fermentation by flocculating yeast under redox potential-controlled conditions. Biotechnol. Biofuels 2012, 5, 61–68. [Google Scholar] [CrossRef] [Green Version]
  9. Khongsay, N.; Yin, Y.-H.; Laopaiboon, P.; Laopaiboon, L. Improvement of very-high-gravity ethanol fer-mentation from sweet sorghum juice by controlling fermentation redox potential. J. Taiwan Inst. Chem. Eng. 2014, 45, 302–307. [Google Scholar] [CrossRef]
  10. Goncharuk, V.V.; Bagrii, V.A.; Mel’nik, L.A.; Chebotareva, R.D.; Bashtan, S.Y. The use of redox potential in water treatment processes. J. Water Chem. Technol. 2010, 32, 1–9. [Google Scholar] [CrossRef]
  11. Brasca, M.; Morandi, S.; Lodi, R.; Tamburini, A. Redox potential to discriminate among species of lactic acid bacteria. J. Appl. Microbiol. 2007, 103, 1516–1624. [Google Scholar] [CrossRef]
  12. Reichart, O.; Szakmar, K.; Jozwiak, A.; Felfoldi, J.; Baranyai, L. Redox potential measurement as a rapid method for microbiological testing and its validation for coliform determination. Int. J. Food Microbiol. 2007, 114, 143–148. [Google Scholar] [CrossRef] [PubMed]
  13. Dahod, S.K. Redox potential as a better substitute for dissolved oxygen in fermentation process control. Biotechnol. Bioeng. 1982, 24, 2123–2125. [Google Scholar] [CrossRef]
  14. Lund, B.M.; Knox, M.R.; Sims, A.P. The effect of oxygen and redox potential on growth of Clostridium botulinum type E from a spore inoculum. Food Microbiol. 1984, 1, 277–287. [Google Scholar] [CrossRef]
  15. Coleman, R.E.; Boulton, R.B.; Stuchebrukhov, A.A. Kinetics of autoxidation in wine. In Recent Advances in Chemical Kinetics; IntechOpen: London, UK, 2022. [Google Scholar]
  16. Park, S.K.; Boulton, R.B.; Noble, A.C. Formation of hydrogen sulfide and glutathione during fermentation of white grape musts. Am. J. Enol. Vitic. 2000, 51, 91–97. [Google Scholar] [CrossRef]
  17. Kukec, A.; Berovic, M.; Celan, S.; Wondra, M. The role of on-line redox potential measurement in Sauvignon blanc fermentation. Food Technol. Biotechnol. 2002, 40, 49–55. [Google Scholar]
  18. Berovic, M.; Mavri, J.; Wondra, M.; Kosmerl, T.; Bavcar, D. Influence of temperature and carbon dioxide on fermentation of Cabernet Sauvignon must. Food Technol. Biotechnol. 2003, 41, 353–359. [Google Scholar]
  19. Coleman, R.E. Kinetics of Oxygen Consumption in Solutions of Iron and Tartaric Acid. Ph.D. Thesis, University of California, Davis, CA, USA, 2019. [Google Scholar]
  20. Peters, R. Oxidation and reduction chains, and the influence of complex ions on the electromotive force. Z. Phys. Chem. Stöchiometrie Verwandtschaftslehre 1898, 26, 193. [Google Scholar] [CrossRef]
  21. Boulton, R.B.; Singleton, V.L.; Bisson, L.F.; Kunkee, R.E. Principles and Practices of Winemaking; Springer: New York, NY, USA, 1996. [Google Scholar]
  22. Joslyn, M.A. California wines. Oxidation-reduction potentials at various stages of production and aging. Ind. Eng. Chem. 1949, 41, 587–592. [Google Scholar] [CrossRef]
  23. Ribereau-Gayon, J. Traite d’Oenologie, Transformations et Traitments des Vins; Libraire Polytechnique Ch. Beranger: Paris, France, 1950. [Google Scholar]
  24. Schanderl, H. Mikrobiologie des Mostes und Weines; Verlag Eugen Ulmer: Stuttgart, Germany, 1959. [Google Scholar]
  25. Killeen, D.J.; Boulton, R.B.; Knoesen, A. Advanced monitoring and control of redox potential in wine fermentation. Am. J. Enol. Vitic. 2018, 69, 394–399. [Google Scholar] [CrossRef]
  26. Murray, D.B.; Haynes, K.; Tomita, M. Redox regulation in respiring Saccharomyces cerevisiae. Biochim. Biophys. 2011, 1810, 945–958. [Google Scholar] [CrossRef]
  27. Liu, C.-G.; Lin, Y.-H.; Bai, F.-W. Global gene expression analysis of Saccharomyces cerevisiae grown under redox potential-controlled very-high-gravity conditions. Biotechnol. J. 2013, 8, 1332–1340. [Google Scholar] [CrossRef] [PubMed]
  28. Xue, S.-J.; Zhang, J.-R.; Zhang, R.-X.; Qin, Y.; Yang, X.-B.; Jin, G.-J. Oxidation-reduction potential affects medium-chain fatty acid ethyl ester production during wine alcohol fermentation. Food Res. Int. 2022, 157, 11369. [Google Scholar] [CrossRef] [PubMed]
  29. Lin, Y.-H.; Chien, W.-S.; Duan, K.-J. Correlations between reduction-oxidation potential profiles and growth patterns of Saccharomyces cerevisiae during very-high-gravity fermentation. Process Biochem. 2010, 45, 765–770. [Google Scholar] [CrossRef]
  30. Rankine, B.C. Nature, origin and prevention of hydrogen sulphide aroma in wines. J. Sci. Food Agric. 1963, 14, 79–91. [Google Scholar] [CrossRef]
  31. Schutz, M.; Kunkee, R.E. Formation of hydrogen sulfide from elemental sulfur during fermentation by wine yeast. Am. J. Enol. Vitic. 1977, 28, 137–144. [Google Scholar]
  32. Siebert, T.E.; Bramley, B.; Solomon, M.R. Hydrogen sulfide: Aroma detection threshold study in white and red wine. AWRI Tech. Rev. 2009, 183, 14–16. [Google Scholar]
  33. Coleman, R.E.; Boulton, R.B.; Stuchebrukhov, A.A. Kinetics of autoxidation of tartaric acid in the presence of iron. J. Chem. Phys. 2020, 153, 064503. [Google Scholar] [CrossRef]
  34. Walker, G.A.; Nelson, J.; Halligan, T.; Lima, M.M.M.; Knoesen, A.; Runnebaum, R.C. Monitoring site-specific fermentation outcomes via oxidation reduction potential and uv-vis spectroscopy to characterize “hidden” parameters of pinot noir wine fermentations. Molecules 2021, 26, 4748. [Google Scholar] [CrossRef]
  35. Lerno, L.; Reichwage, M.; Ponangi, R.; Hearne, L.; Block, D.E.; Oberholster, A. Effects of cap and overall fermentation temperature on phenolic extraction in cabernet sauvignon fermentations. Am. J. Enol. Vitic. 2015, 66, 444–453. [Google Scholar] [CrossRef]
  36. Nelson, J.; Boulton, R.; Knoesen, A. Automated density measurement with real-time predictive modeling of wine fermentations. IEEE Trans. Instrum. Meas. 2022, 71, 1–7. [Google Scholar] [CrossRef]
  37. Boulton, R.B. The prediction of fermentation behavior by a kinetic model. Am. J. Enol. Vitic. 1980, 31, 40–44. [Google Scholar]
  38. Liu, C.-G.; Lin, Y.-H.; Bai, F.-W. Redox potential control and applications in microaerobic and anaerobic fermentations. Biotechnol. Adv. 2013, 31, 257–265. [Google Scholar] [CrossRef] [PubMed]
  39. Gao, J.; Yuan, W.; Li, Y.; Bai, F.; Zhong, S.; Jiang, Y. Application of redox potential control to improve ethanol productivity from inulin by consolidated bioprocessing. Process Biochem. 2016, 51, 1544–1551. [Google Scholar] [CrossRef]
  40. Torija, M.J.; Rozes, N.; Poblet, M.; Guillamon, J.M.; Mas, A. Effects of fermentation temperature on the strain population of Saccharomyces cerevisiae. Int. J. Food Microbiol. 2003, 80, 47–53. [Google Scholar] [CrossRef]
  41. Ivorra, C.; Perez-Ortin, J.E.; del Olmo, M. An inverse correlation between stress resistance and stuck fer-mentations in wine yeasts. A molecular study. Biotechnol. Bioeng. 1999, 64, 698–708. [Google Scholar] [CrossRef]
  42. Farina, L.; Medina, K.; Urruty, M.; Biodo, E.; Dellacassa, E.; Carrau, F. Redox effect on volatile compound formation in wine during fermentation by Saccharomyces cerevisiae. Food Chem. 2012, 134, 933–939. [Google Scholar] [CrossRef]
  43. Bloem, A.; Sanches, I.; Denquin, A.; Camarasa, C. Metabolic impact of redox cofactor perturbations on the formation of aroma compounds in Saccharomyces cerevisiae. Appl. Environ. Microbiol. 2016, 82, 174–183. [Google Scholar] [CrossRef]
Figure 1. Fraction in oxidized form of S/H2S redox couple at 3.5 pH and standard conditions at the Ag/AgCl scale.
Fermentation 09 00007 g001
Figure 2. Experiment cross section at 100 L scale.
Fermentation 09 00007 g002
Figure 3. Experiment cross section at 1500 L scale.
Fermentation 09 00007 g003
Figure 4. Experiment cross section at 10,000 L scale.
Fermentation 09 00007 g004
Figure 5. Uncontrolled redox fermentations (A) (100 L), (B) (100 L) and (C) (100 L) with pump-over indicated by (*).
Fermentation 09 00007 g005
Figure 6. Controlled to –40 mV redox fermentations at scales of 100 L (A,B), 1500 L (C) and 10,000 L (D) with pump-over indicated by (*) and solenoid opening indicated by (·).
Fermentation 09 00007 g006
Figure 7. Fermentation curves (°Brix, -) and rates (°Brix/Day, - -) and temperatures (°C, · · ) across scales of 100 L ((A), 5 fermentations), 1500 L ((B), 1 fermentation) and 10,000 L ((C), 1 fermentation).
Fermentation 09 00007 g007
Table 1. Experimental conditions.
Values100 L1,500 L10,000 L
Air Pressure (kPa)206.8206.8206.8
Air Flow Rate (L/s)0.300.607.5
Solenoid Open Interval (s)2020120
Volume Ratio per Pulse
(L air/L wine)
0.060.0080.09
Sparger Type5- μ m sparger, 5000 mm21 hole, 0.79 mm24 holes, 0.079 mm
Table 2. Description of the fermentation performed.
VolumeControlled RedoxQuantity
100 LNo3
100 LYes2
1500 LYes1
10,000 LYes1
Table 3. Fermentation parameters of controlled redox potential fermentations across scale.
Parameter100 L (n = 2)1500 L10,000 L
Lag Time (h)3.783.3325.1
Initial Nitrogen (mg N/L)215198162
Maintenance Rate (1/h)0.1840.1090.118
Viability Constant (l/g·h)13.830.849.2
Ethanol Inhibition (L/g)0.0350.0440.037
Sum of Squares Residual
per Point (°Brix)
0.0740.8060.029
Table 4. Fermentation parameters of uncontrolled and controlled redox potential fermentations, 100 L scale.
ParameterUncontrolled
Redox Potential (n = 3)
Controlled
Redox Potential (n = 2)
Lag Time (h)2.86 ± 1.853.78 ± 0.48
Initial Nitrogen (mg N/L)213 ± 14.9215 ± 28.9
Maintenance Rate (1/h)0.144 ± 0.010.184 ± 0.01
Viability Constant (l/g·h)18.7 ± 4.2913.8 ± 0.48
Ethanol Inhibition (L/g)0.033 ± 0.0090.035 ± 0.01
Sum of Squares Residual
per Point (°Brix)
0.082 ± 0.020.074 ± 0.02
Disclaimer/Publisher’s Note: The statements, opinions and data contained in all publications are solely those of the individual author(s) and contributor(s) and not of MDPI and/or the editor(s). MDPI and/or the editor(s) disclaim responsibility for any injury to people or property resulting from any ideas, methods, instructions or products referred to in the content.

