Abstract
In order to utilize a wider range of low-grade syngas, the syngas biomethanation was studied in this work with respect to the gas–liquid mass transfer and the reactor start-up strategy. Two reactors, a continuous stirred tank (CSTR) and a bubble column with gas recirculation (BCR-C), were used in the experiment by feeding an artificial syngas of 20% H2, 50% CO, and 30% CO2 into the reactors at 55 °C. The results showed that the CH4 productivity was slightly increased by reducing the gas retention time (GRT), but was significantly improved by increasing the stirring speed in the CSTR and the gas circulation rate in the BCR-C. The best syngas biomethanation performance of the CSTR with a CH4 productivity of 22.20 mmol·Lr−1·day−1 and a yield of 49.01% was achieved at a GRT of 0.833 h and a stirring speed of 300 rpm, while for the BCR-C, the best performance with a CH4 productivity of 61.96 mmol·Lr−1·day−1 and a yield of 87.57% was achieved at a GRT of 0.625 h and a gas circulation rate of 40 L·Lr−1·h−1. The gas–liquid mass transfer capability provided by gas circulation is far superior to mechanical stirring, leading to a much better performance of low-grade syngas biomethanation in the BCR-C. Feeding H2/CO2 during the startup stage of the reactor can effectively stimulate the growth and metabolism of microorganisms, and create a better metabolic environment for subsequent low-grade syngas biomethanation. In addition, during the thermophilic biomethanation of syngas, Methanothermobacter is the dominant genus.
1. Introduction
Biomass energy is an important alternative energy source with respect to the increase in energy demand, the future scarcity of fossil fuels, and the climate crisis, which has a great potential to be utilized for various biofuel/chemical production through thermochemical and biochemical conversion [1,2]. Its carbon neutrality has been well known in the scientific world [3]. Biogas, one of the important biomass-based fuels, is an excellent energy carrier after upgrading to biomethane which is miscible into existing natural gas grid or liquified as LNG [4,5].
Biogas is traditionally referred to as the mixture of methane and carbon dioxide produced from anaerobic digestion (AD) of organic substrates by anaerobic microorganisms [6]. Due to rate limitation in the hydrolysis step, lignin and cellulose from lignocellulosic biomass mostly remain in the digestate and cannot be degraded into biogas [7]. On the other hand, lignocellulosic biomass can be easily gasified into syngas to circumvent the limitation to the biological degradation of refractory compounds. Then, the syngas with the major components of H2, CO2, and CO can be digested into methane by the synergistic action of microorganisms [5]. Such biomethanation of biomass-derived syngas opens a novel pathway for the conversion of recalcitrant lignocellulosic biomass [8], and has received great attention from many researchers in recent years [9,10,11].
The proportion of hydrogen to carbon (CO + CO2) in the syngas from biomass gasification varies depending on the gasification medium of air, oxygen, or steam and other conditions [1,2,3]. The syngas from air gasification typically contains only about 10% H2, but nearly 50% N2 and large amounts of CO and CO2 [12], which seems not to be optimal for biomethanation. Such a low-grade syngas has a low heating value, and its main component, CO, is considered to be toxic to a majority of microorganisms at high partial pressure [13]. Thus, many studies focus on the biomethanation of high-quality syngas containing a high H2 content, or after the addition of exogenous H2 obtained from wind and solar energy [10,14], but ignore the potential for biomethanation of low-grade syngas. However, biomass air gasification is simple, economic, and more suitable for small-scale applications to utilize the dispersed biomass residues [12]. The challenge of a high N2 concentration in the biomethanation outlet gas can be avoided by cryogenic separation when the end product is directed to LNG [15]. Moreover, the sources of syngas for biomethanation can be the CO/CO2-rich industrial off-gas [16,17]. Therefore, the biomethanation of low-grade syngas should be paid attention to, which has been ignored in literature.
The study of syngas biomethanation is also important for the development of power-to-methane (PtM) technology to produce substitute natural gas (SNG) from surplus renewable electricity and the CO2-rich exhausted gas of combustion plants [18,19]. Thus, the flexibility of electricity production from intermittent renewable energy resources can be raised, and carbon capture, utilization, and sequestration (CCUS) can be realized [18].
The major pathways of syngas biomethanation have been well summarized in previous studies, as shown in Figure 1 [20,21,22]. Generally speaking, syngas biomethanation under a thermophilic condition has higher efficiency of CH4 production and less byproducts, such as VFAs, in comparison to a mesophilic condition, and has a high potential for industrial application [10,23]. For mesophilic syngas biomethanation, more abundant microbial communities and more complex metabolic pathways exist, leading to the production of more VFAs (mainly acetate) as intermediate products [13,22,24].
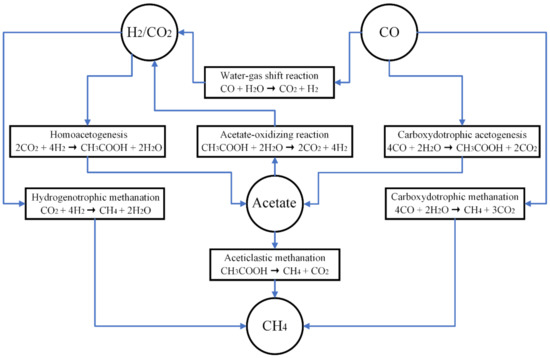
Figure 1.
Major pathways of syngas biomethanation [29].
During the syngas biomethanation process, a crucial limiting factor is the slow gas–liquid mass transfer since the microbial conversions occur mainly in the aqueous phase and the gas must pass the interface film of gas–liquid [10,25]. The continuous stirred tank reactor (CSTR) is commonly used in chemical industry. In the case of syngas biomethanation in a CSTR bioreactor, the mass transfer rate is raised by increasing the impeller speed to break up large bubbles into smaller ones [25]. Another common reactor with a simple structure is the bubble column reactor with gas circulation (BCR-C), which might be more suitable for syngas biomethanation [26]. The bubble movement by gas circulation strengthens the turbulence and promotes the gas–liquid heat and mass transfer. The mass transfer coefficient (kLa) is usually between 10 and 500 h−1 for a CSTR, and between 18 and 860 h−1 for a BCR [27]. In large industrial CSTR fermenters above 102 m3, the power input is limited to about 5 kW m−3 [28]. High power consumption of CSTR limits its scaling-up feasibility in the industry [25]. In a BCR, the power is supplied solely by external compressors with low power consumption and low equipment investment, but back-mixing and coalescence are considered to be the major drawbacks [28]. Besides enhancing mass transfer by utilizing a better reactor design, high pressure operation is another method to promote mass transfer. The growth inhibition of CO on microorganisms caused by increasing pressure has been well studied by Buffiere et al. [23].
Therefore, a comparative investigation of low-grade syngas biomethanation performance in these two reactors for continuous operation is interesting for syngas biomethanation to be applied to the industry.
Moreover, the enrichment or acclimation of inoculum in the start-up stage of the reactor is a conventional treatment method. Most continuous reactors are started directly by feeding the syngas required for the experiment [29,30]. However, H2 in the syngas will act as the electron donor and CO2 as the carbon source can improve the microbial community activity and diversity [5], which is beneficial to the syngas biomethanation in subsequent continuous operation. On the other hand, CO in the syngas can be used as the electron donor in all organisms that contain CODH theoretically and as the carbon source as well [31,32]. However, relatively few anaerobic microbes are able to utilize CO as the sole source of energy due to their growth inhibition by CO [31,32]. CO biomethanantion is an indirect pathway which requires the collaboration of numerous Bacteria and Archaea [20]. To improve the tolerance of microbes to CO, exposure to a CO atmosphere for a period of time has been proved to be effective in many previous studies [13,21].
To date, for continuous syngas biomethanation, few studies have dealt with the effect of the start-up stage on syngas biomethanation, which is studied in this work by feeding different gas substrates at the start-up stage. In this experiment, syngas biomethanation was started with three strategies: 1. enhance the microbial community tolerance to CO by feeding with pure CO; 2. stimulate microbial growth and metabolic activity by feeding microbes with favorable H2/CO2; and 3. direct the start-up syngas biomethanation with the targeted syngas to shorten the lag phase and accelerate the adaptation of syngas.
2. Materials and Methods
2.1. Growth Medium and Inoculum
The growth medium used in all test runs of the experiment was a modified basal anaerobic (BA) medium [33] composed of 4 stock solutions, as presented in Table 1. The medium was prepared by adding 10 mL of A, 2 mL of B, 1mL of C, 1 mL of D, and distilled water to 1 L.

Table 1.
Stock solution of basal anaerobic medium.
The anaerobic granular sludge for this study was collected from an internal circulation (IC) bioreactor (Shuierli Environmental Protection Technology Co., Ltd., Nanchang, China), which was originally operated under mesophilic conditions (35–38 °C) for treating industrial wastewater from juice plants. The total solid (TS) and volatile solid (VS) contents of the anaerobic granular sludge were 49.46 ± 0.64 g/L and 37.44 ± 0.69 g/L, respectively. Before it was used as the inoculum, the sludge was stored at about 25 °C for more than two months in order to achieve complete decomposition of the degradable organic matter in the raw sludge, so that the influence of the organic matter on the result of the later biomethanation experiment was avoided [26]. These sludge granules would be used for anaerobic digestion in subsequent experiments.
2.2. Reactor Configuration and Operation
The purpose of this study is to evaluate the thermophilic biomethanation performance of low-grade syngas with respect to the gas–liquid mass transfer and the effect of the start-up strategy on syngas biomethanation. Two reactor designs were chosen for the experimental test: the continuous stirred tank reactor (CSTR) and the bubble column reactor with gas circulation (BCR-C). The gas–liquid mass transfer in the reactors can be characterized by the gas retention time (GRT) and the stirring speed or gas circulation rate. The biomethanation performance was compared between the CSTR and the BCR-C by feeding artificial syngas of 20% H2, 50% CO, and 30% CO2 at 55 °C. Additionally, different start-up strategies of feeding CO, H2/CO2, or syngas were evaluated to determine which one was better for low-grade syngas biomethanation.
2.2.1. Continuous Stirred Tank Reactor
The CSTR in the experiment is a glass bioreactor with a working volume of 1.8 L and a height to diameter ratio of 2.36, as shown in Figure 2a. The stirring paddle is mounted with two flat blades of 45 mm long. A total of 150 mL of sludge and 900 mL of fresh BA medium was added to the reactor, leaving a headspace of 750 mL. The artificial syngas of 20% H2, 50% CO, and 30% CO2 was introduced through the bottom of the reactor. The gas flow rate was controlled by a mass flow controller (SLD-MFC, Nanjing, China). The artificial syngas composition was a typical H2/CO2/CO product gas from biomass air gasification in addition to N2 [12]. The reactor was operated at a temperature of 55 °C, pH values of 6.5–7.5, a headspace pressure of 1.0 atm, and a hydraulic retention time (HRT) of 30 days. The temperature is maintained by a water bath system as seen in Figure 2.
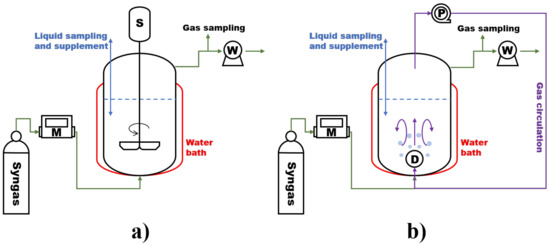
Figure 2.
Schematic diagram of (a) the continuous stirred tank reactor and (b) the bubble column reactor with gas circulation.
The experiment was designed in four major successive periods of syngas biomethanation time (Period I, II, III, and IV) at different stirring speeds of 0, 200, 250, and 300 rpm, respectively. The corresponding approximate mixing power input were 0, 156.74, 306.12 and 528.98 W/m3. During the continuous operation, the stirring speed increased successively from one period to another. In each period, the GRT was set at 2.5, 1.25, 0.833, and 0.625 h, respectively, by increasing the inlet gas flow rate at 300, 600, 900, and 1200 mL/h. An overview of the experimental conditions is provided in Table 2. Each condition lasted for about 2 days. The pH, gas outflow rate, outlet gas composition, and VFA concentration were registered every day.
2.2.2. Bubble Column Reactor with Gas Circulation
The BCR-C in the experiment is a glass bioreactor with a working volume of 1.8 L and a height to diameter ratio of 2.36, as shown in Figure 2b. The gas–liquid mass transfer in the reactor was controlled by a continuous gas circulation. The gas in the headspace was pumped out and re-sparged through the silicon carbide (SiC) gas distributor with a pore size of 300–500 μm equipped at the reactor bottom. The experiment was designed in five major periods of syngas biomethanation time (Period I, II, III, IV, and V) at different gas circulation rates (RC) of 0, 5, 16.67, 40, and 113.33 L·Lr−1·h−1, respectively. The corresponding gas velocities from the bottom to the top through the reactor were 0, 0.26, 0.88, 2.11, and 5.96 mm/s. During the continuous operation, the gas circulation rate increased successively from one period to another. In each period, the GRT was set at 2.5, 1.25, 0.833, and 0.625 h, respectively, by increasing the inlet gas flow rate. An overview of the experimental conditions is provided in Table 3. The operation procedures of the CSTR and the BCR-C are same in order to reasonably compare the biomethanation performances of the two reactors with different gas–liquid mass transfer characteristics.
2.2.3. Start-Up Strategy
In order to evaluate the effect of different start-up strategies on syngas biomethanation, three BCR-C reactors of the same kind were used with three different start-up strategies. In Stage 1 of Days 1–10 for the reactor start-up operation, the three BCR-C were respectively fed with a gas mixture of 50% CO + 50% N2, 50% H2 + 12.5% CO2 + 37.5% N2 and 20% H2 + 50% CO + 30% CO2. In Stage 2 of Days 11–22 for the normal reactor operation, the gas mixtures of 50% CO + 50% N2 and 50% H2 + 12.5% CO2 + 37.5% N2 were switched to the artificial syngas, 20% H2 + 50% CO + 30% CO2. The biomethanation performance during Stage 2 of these three reactors was registered to compare the effects caused by the start-up strategies in Stage 1. The GRT was set at 1.25 h, and the gas circulation rate (RC) was set at 40 L·Lr−1·h−1. The result of the biomethanation performance after different start-up strategies was calculated using the data of Days 13–20 to guarantee the reactors were under a steady-state operation.
2.3. Analytical Methods
The outlet gas composition of H2, CO, CH4, and CO2 was measured everyday using a gas chromatography (Shimadzu GC-2014, Tokyo, Japan) equipped with a thermal conductivity detector (TCD) and a packed column (TDX-01, 2 m × 3 mm, Stainless Steel), as described previously [22]. The flow rate of the outlet gas was measured using a wet gas meter (LMF-1, Nanjing, China).
Volatile fatty acids (VFA) including acetate, propionate, butyrate, and isobutyrate were analyzed everyday using Agilent 8860 (Wilmington, DE, USA) equipped with a flame ionization detector (FID) and a DB-WAX column (30m × 0.53 mm × 1.0 μm). Nitrogen was used as the carrier gas at a flow rate of 40 cm/s. The temperatures of the inlet and the detector were set to be at 250 °C. The GC oven was programmed to begin at 50 °C, held for 1 min, then increased at a rate of 20 °C/min to 250 °C, and finally held at 250 °C for 6 mins.
The total solid (TS) and volatile solid (VS) contents of the anaerobic granular sludge were measured according to standard methods [34]. The pH was measured using a pH meter (pH-100, Shanghai, China).
2.4. Calculations
CH4 productivity () was calculated as the mmol of methane produced per liter of reactor volume and during a certain period of time (mmol·Lr−1·day−1) by multiplying the concentration of CH4 (mmol·mL−1) in the gas sampled from the reactor outlet with the gas outflow rate (mL·Lr−1·day−1). The flow rate was measured at room temperature. The conversion of gas volumes in liter to moles is calculated according to the ideal gas law at 1 bar and 293 K. The volume specific molar conversion rates of H2 () and CO () are also calculated in mmol·Lr−1·day−1 as follows: , where i stands for CO and H2, and and stand for the inflow and outflow rates of compound i in mmol·Lr−1·day−1.
The conversion efficiency for each compound i is calculated as follows:
The product yield was obtained by calculating the electron yield. The electron yield is calculated as follows:
where j is the denotation for CH4 or any of the produced VFAs, and , and are the electron equivalents, which mean the electron moles released from the full oxidation of 1 mol of j, CO, and H2, respectively. Electron equivalents per mmol are as follows: CO, 2; H2, 2; CH4, 8; acetate, 8; propionate, 14; and butyrate and isobutyrate, 20 [35]. Sometimes, the amount of VFAs in the liquid phase was reduced compared to the last day. This part of VFAs were assumed that all of them were converted to CH4 and subtracted from the methane productivity, making (%) represent the methane yield converted from syngas more correctly.
Assuming that the concentration in the liquid phase at the gas–liquid interface is in equilibrium with the gas concentration in the gaseous phase, the specific mass transfer coefficient of CO (kLa) (day−1) is calculated according to the following equation:
where is the gas–liquid mass transfer rate (L·Lr−1·day−1) and can be defined with the CO conversion volume rate at 55 °C and 1 atm, which is calculated as follows:
is the saturated CO concentration (L·L−1) in the gas–liquid interphase in equilibrium with the gas phase, and is the concentration of dissolved CO in the liquid phase (L·L−1). is calculated according to Henry’s law:
where x is the mole fraction of gas in the solution (unitless); is the partial pressure of CO above the liquid phase (atm), which is calculated based on the outlet gas composition; and KH is the Henry’s law constant (atm). The Henry’s law constant used for CO in the analysis is 79,100 atm (at 55 °C and 1 atm). The dissolved CO concentration () is neglected because it is assumed that dissolved CO could be consumed quickly. Therefore, the specific mass transfer coefficient of CO (kLa) (day−1) is an approximate estimation. The above calculation methods have been modified according to previous studies [10,26,35,36].
The calculations were performed for the steady-state operation of the reactors. It was considered that a steady-state was reached when the gas effluent composition did not change more than 1% for every individual gas compound for two consecutive days. After all designed test runs of 4 periods in the CSTR and 5 periods in the BCR-C were completed, the operating conditions of GRT and stirring speed/gas circulation rate were randomly changed back to be the same as used in former periods of the test runs. It was found that as long as the GRT and stirring speed/gas circulation rate were the same, the results such as CH4 productivity and the outlet gas composition were almost similar. This indicates that the data obtained are mainly affected by the GRT and stirring speed/gas circulation rate, rather than the VFA concentration, pH, or other factors changed during the whole experiment. Thus, a point sample can be representative of a steady-state operation.
2.5. Gene Sequencing and Functional Analysis
In order to compare the possible changes in the microbial community during the experiment, the abundance and functional genes of the microbial community were analyzed. The inoculum samples were collected at the end of every period of experiments. The 16S rRNA gene V4~V5 hypervariable region was amplified using the universal forward 515F (5′-GTGCCAGCMGCCGCGG-3′) and the reverse 907R (5′-CCGTCAATTCMTTTRAGTTT-3′) primers for Bacteria, and using the universal forward 519F (5′-CAGCCGCCGCCGTAA-3′) and the reverse 915R (5′-GTGCTCCCCCGCCAATTCCT-3′) primers for Archaea [37]. High-throughput sequencing of 16S rRNA was conducted using the Ion GeneStudio S5 (Thermo Fisher Scientific, Waltham, MA, USA) at the Analysis Center of Agrobiology and Environmental Sciences of Zhejiang University (Hangzhou, China). For functional profiles, taxonomy annotation and enzymes of KEGG Ontology (KO) were created based on the Kyoto Encyclopedia of Genes and Genomes (KEGG) Database [38]. More operational details have been described in previous studies [22].
3. Results and Discussion
3.1. Performance of the Continuous Stirred Tank Reactor
The syngas biomethanation test data for CSTR are listed in Table 2, including the reactor operation conditions of stirring speed and GRT, CH4 productivity and yield, substrate conversion efficiency, and the specific mass transfer coefficient of CO (kLa). An overview of the gas and VFA products of the CSTR is presented in Figure 3.
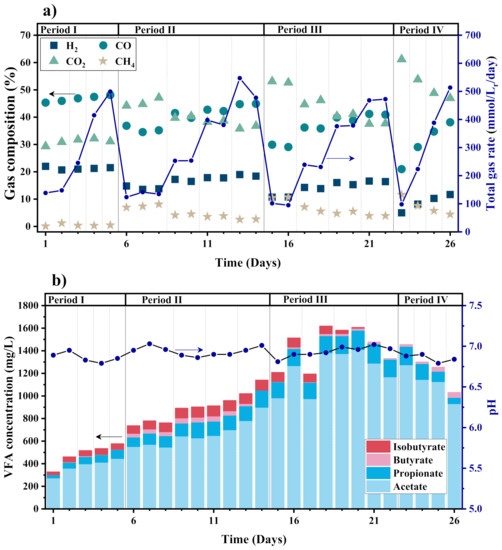
Figure 3.
(a) Composition and rate of output gas, and (b) VFA concentration and pH in the CSTR during syngas biomethanation (The whole test time is divided by 4 periods with different stirring speeds, and each period is divided by dotted lines with different GRT of 2.5, 1.25, 0.833, and 0.625 h from left to right.).
Table 2.
Syngas biomethanation performances of the CSTR in 4 experimental periods with different stirring speeds and GRTs.
Table 2.
Syngas biomethanation performances of the CSTR in 4 experimental periods with different stirring speeds and GRTs.
| Period | Stirring Speed (rpm) | GRT (h) | Day | ηH2 (%) | ηCO (%) | KLa (day−1) | ||
|---|---|---|---|---|---|---|---|---|
| I | 0 | 2.5 | 1–2 | 0.92 ± 0.82 | 8.42 ± 0.13 | 21.57 ± 3.07 | 20.07 ± 18.26 | 63.45 ± 18.13 |
| 1.25 | 3 | 0.83 | 22.81 | 30.93 | 4.99 | 101.24 | ||
| 0.833 | 4 | 1.25 | 11.80 | 21.20 | 7.30 | 89.73 | ||
| 0.625 | 5 | 2.24 | 19.42 | 27.89 | 7.44 | 221.98 | ||
| 9.95 ± 5.92 | ||||||||
| II | 200 | 2.5 | 6–8 | 10.64 ± 0.26 | 43.46 ± 0.90 | 42.28 ± 0.84 | 84.83 ± 0.51 | 128.45 ± 1.33 |
| 1.25 | 9–10 | 10.89 ± 0.49 | 35.97 ± 1.31 | 38.25 ± 1.23 | 49.33 ± 0.18 | 199.68 ± 10.77 | ||
| 0.833 | 11–12 | 14.34 ± 0.20 | 30.61 ± 1.74 | 33.80 ± 1.88 | 49.52 ± 1.95 | 252.94 ± 15.50 | ||
| 0.625 | 13–14 | 13.23 ± 0.58 | 28.05 ± 5.99 | 31.06 ± 4.57 | 38.06 ± 7.92 | 293.49 ± 42.66 | ||
| 55.44 ± 17.60 | ||||||||
| III | 250 | 2.5 | 15–16 | 10.38 ± 0.25 | 68.48 ± 1.01 | 65.24 ± 1.70 | 53.35 ± 2.01 | 234.41 ± 9.55 |
| 1.25 | 17–18 | 14.89 ± 2.08 | 50.47 ± 1.57 | 49.19 ± 1.11 | 46.76 ± 3.61 | 289.30 ± 7.94 | ||
| 0.833 | 19–20 | 19.26 ± 1.48 | 40.89 ± 1.21 | 40.60 ± 0.58 | 52.80 ± 3.50 | 328.14 ± 9.05 | ||
| 0.625 | 21–22 | 18.15 ± 0.07 | 41.77 ± 0.10 | 42.04 ± 0.07 | 34.62 ± 0.01 | 433.91 ± 0.71 | ||
| 46.88 ± 7.54 | ||||||||
| IV | 300 | 2.5 | 23 | 11.35 | 85.41 | 75.36 | 49.82 | 380.66 |
| 1.25 | 24 | 16.94 | 72.63 | 61.02 | 41.55 | 445.16 | ||
| 0.833 | 25 | 22.20 | 60.26 | 46.06 | 49.01 | 421.68 | ||
| 0.625 | 26 | 22.55 | 55.04 | 41.22 | 38.96 | 458.09 | ||
| 44.84 ± 4.68 |
In general, the CSTR has a poor performance of low-grade syngas biomethanation. As shown in Figure 3a, due to the lack of sufficient electron donor (H2) in low-grade syngas, a large amount of CO2 is accumulated in the outlet gas from the basic level of 30% CO2, which makes up 35.79–61.15% of the outlet gas during the steady state. The extra CO2 is produced from CO water–gas shift reaction and carboxydotrophic acetogenesis [31], in response to the reduction of CO concentration from the 50% basic level. In fact, under a thermophilic condition, CO is mainly converted into H2/CO2 as the intermediate product, and subsequently to CH4 [24]. A fairly high level of CH4 concentration up to 10% appears in Periods II, III, and IV, in response to a reduction in H2 concentration. H2 can be easily consumed during the biomethanation process, but still remains at a rather high concentration level of 4.97–18.96% in spite of H2-lean syngas. H2 is not completely consumed mainly due to the reactor performance limitation to the gas–liquid mass transfer. The overall CH4 productivity and yield remain fairly low. The highest CH4 productivity is 22.55 mmol·Lr−1·day−1 as shown in Table 2, which is reached at the maximum stirring speed of 300 rpm and the minimum GRT of 0.625 h. Under this condition, the reactor has relatively better gas–liquid mixing and the highest inlet gas flow rate. However, the highest CH4 concentration of 11.61% appears at the stirring speed of 300 rpm and the longest GRT of 2.5 h, so that the gas substrates have a high mixing degree with inoculum and a sufficient time to be digested.
Except for Period I without mixing, the total outlet gas flow rate and the gas composition in the other periods show a clear relationship with the GRT. With decreasing GRT, the H2 and CO concentrations increase gradually, while the CH4 and CO2 concentrations decrease, as seen in Figure 3a. In fact, CO2 should also be the substrate for biomethanation if H2 is sufficiently high. However, when limited by the reduction equivalent content and the biomethanation capacity of the reactor, CO2 tends to be regarded as the product due to CO water–gas shift reaction. Figure 3b shows that VFAs increase in the early stages and finally stabilize at about 1200 mg/L in Periods III and IV.
3.1.1. Effect of Gas Retention Time
Figure 4 shows the effect of GRT on the biomethanation performance of the CSTR. In the case without stirring, CH4 productivity is kept at an extremely low level, which is not sensitive to GRT, as seen in Figure 4a. The syngas biomethanation is fully limited by the gas–liquid mass transfer, regardless of how the GRT is shortened and how fast the syngas is fed.
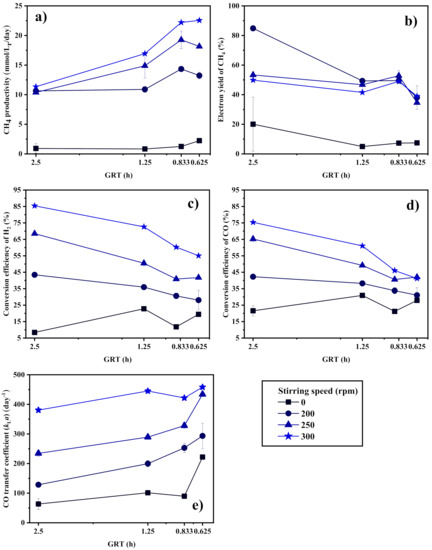
Figure 4.
(a) CH4 productivity, (b) electron yield to CH4, conversion efficiency of (c) H2 and (d) CO, and (e) CO transfer coefficient (kLa) of the CSTR at different GRTs.
In the case with stirring, CH4 productivity increases with the shortening of the GRT due to the supply of more gas substrates as the inlet gas flow rate increases. However, the CH4 yield, as represented by the CH4 electron yield seen in Figure 4b, decreases slightly, which gives a negative contribution to the CH4 productivity. The conversion efficiency of H2 and CO in Figure 4c,d also decrease slightly in response to the CH4 productivity variation trend. Because of the limitation to the gas–liquid mass transfer plus the low microbial biomethanation reaction rate, the syngas substrate is far from being completely utilized by microorganisms. It should be noticed that shortening the GRT does not significantly increase the CO mass transfer coefficient, as shown in Figure 4e, which may be the reason for the CH4 productivity to be held at the same level for the GRT at 0.833 h and 0.625 h. Under a specific stirring intensity, the corresponding gas–liquid mass transfer capacity determines the upper limit of CH4 productivity, leading to a higher slip of gas substrate when more gas substrate is provided. In addition, when the GRT is reduced, the partial pressure of CO in the headspace will be increased, which might be inhibitory to some microorganisms [13]. Arbitrarily increasing the inlet gas flow rate might not be beneficial to syngas biomethanation.
In summary, there is no significant enhancement of gas–liquid mixing by increasing the inlet gas flow rate. The CH4 productivity is increased by providing more gas substrate when a certain degree of gas–liquid mass transfer is guaranteed.
3.1.2. Effect of Stirring Speed
Figure 5 shows the effect of stirring speed on the syngas biomethanation performance of the CSTR. Increasing the stirring speed effectively improves the biomethanation performance of the CSTR since the gas–liquid mass transfer is intensified to benefit the mixing of gas substrates, medium, and microbes. The CH4 productivity, the conversion efficiency of gas substrates, and the mass transfer coefficient are all increased with the stirring speeds. As a conclusion, the syngas biomethanation in the CSTR is controlled by the gas–liquid mass transfer.
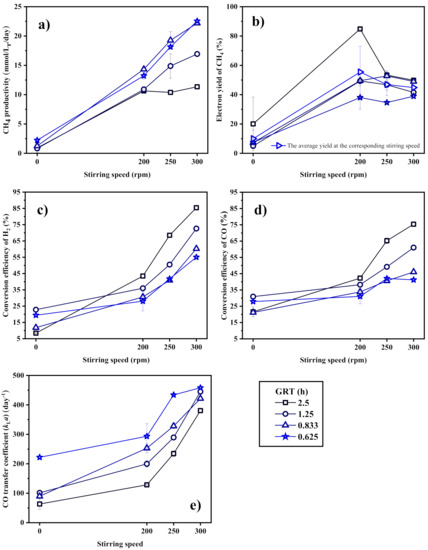
Figure 5.
(a) CH4 productivity, (b) electron yield to CH4, conversion efficiency of (c) H2 and (d) CO, and (e) CO transfer coefficient (kLa) of the CSTR as a function of the stirring speed.
Under stirring condition, CH4 is steadily produced in the CSTR, and the CH4 yield is kept in the range of 38.06% to 53.35%, which suggests that a great amount of carbon is transformed into other metabolites. The mechanical stirring by the rotating blades in the CSTR could easily destroy the structure of the anaerobic sludge granule, which encourages the microbes to produce more extracellular polymeric substances (EPS) to maintain structural stability, or to form lager gathering at the small, broken aggregates [39]. Some EPS have been proved to contribute to the structural stability of sludge granules and the defense against external selection pressure [40]. It may also be the reason why the average CH4 yields decrease slightly with more intensive stirring.
In view of both the CH4 productivity and electron yield, the best syngas biomethanation performance of the CSTR in this experiment is achieved at a GRT of 0.833 h and a stirring speed of 300 rpm, with a CH4 productivity of 22.20 mmol·Lr−1·day−1 and a yield of 49.01%. Since the mass transfer ability mainly limits the biological reaction, arbitrary decrease in GRT will not obviously improve the biomethanation performance, but it leads to the slip of gas substrates and a reduction of CH4 concentration in the product gas. Increasing the stirring speed to extremely high level may further decrease the CH4 yield.
It can be concluded that the blade stirring dominates the gas–liquid mass transfer in the CSTR and determines the syngas biomethanantion performance. The perturbance caused by the change of the inlet gas flow rate is insensitive to the biomethanation process.
3.2. Performance of the Bubble Column Reactor
Compared to the CSTR, the BCR-C has a better performance of digesting low-grade syngas to produce CH4, which manifests in a higher CH4 productivity, yield, and mass transfer coefficient at the steady state, as shown in Table 3 and Figure 6.
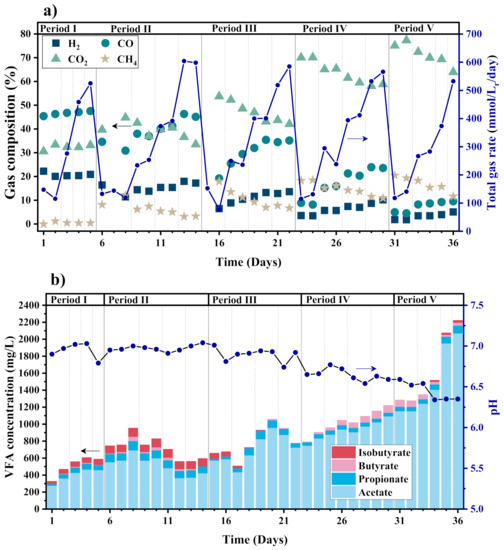
Figure 6.
(a) Composition and rate of output gas, and (b) VFA concentration and pH in the BCR-C during syngas biomethanation (The whole test time is divided by 5 periods with different gas recirculation rates, and each period is divided by dotted lines with different GRT of 2.5, 1.25, 0.833, and 0.625 h from left to right).
Table 3.
Syngas biomethanation performances of the BCR-C in 5 experimental periods at different gas recirculation rates and GRTs.
Table 3.
Syngas biomethanation performances of the BCR-C in 5 experimental periods at different gas recirculation rates and GRTs.
| Period | Rc (L·Lr−1·h−1) | GRT (h) | Day | ηH2 (%) | ηCO (%) | KLa (day−1) | ||
|---|---|---|---|---|---|---|---|---|
| I | 0 | 2.5 | 1–2 | 1.46 | 30.28 | 35.70 | 14.72 | 81.57 |
| 1.25 | 3 | 1.47 | 15.56 | 22.39 | 12.37 | 101.24 | ||
| 0.833 | 4 | 2.02 | 6.11 | 13.33 | 20.55 | 89.73 | ||
| 0.625 | 5 | 2.33 | 17.50 | 24.94 | 7.66 | 221.98 | ||
| 13.82 ± 4.64 | ||||||||
| II | 5 | 2.5 | 6–8 | 14.52 | 58.88 | 55.68 | 88.08 | 190.55 |
| 1.25 | 9–10 | 16.78 ± 2.13 | 48.27 ± 0.92 | 45.06 ± 1.45 | 59.12 ± 13.55 | 254.08 ± 4.77 | ||
| 0.833 | 11–12 | 20.09 ± 0.20 | 40.85 ± 1.49 | 37.62 ± 2.43 | 56.18 ± 2.14 | 293.99 ± 23.18 | ||
| 0.625 | 13–14 | 19.55 ± 0.32 | 20.34 ± 2.02 | 17.33 ± 1.48 | 92.06 ± 7.21 | 160.62 ± 15.82 | ||
| 73.86 ± 16.31 | ||||||||
| III | 16.67 | 2.5 | 15–16 | 13.88 | 84.85 | 82.15 | 56.79 | 452.41 |
| 1.25 | 17–18 | 30.30 ± 3.50 | 64.75 ± 1.79 | 59.93 ± 1.81 | 81.77 ± 5.33 | 464.77 ± 47.84 | ||
| 0.833 | 19–20 | 32.74 ± 4.50 | 49.91 ± 3.27 | 45.81 ± 2.80 | 79.15 ± 6.27 | 433.43 ± 48.25 | ||
| 0.625 | 21–22 | 40.06 ± 0.44 | 44.91 ± 4.89 | 42.19 ± 4.04 | 78.13 ± 6.32 | 513.24 ± 54.15 | ||
| 73.96 ± 10.00 | ||||||||
| IV | 40 | 2.5 | 23–24 | 22.73 ± 1.61 | 86.80 ± 0.66 | 87.35 ± 0.30 | 89.38 ± 6.94 | 1081.93 ± 40.53 |
| 1.25 | 25–26 | 41.57 ± 3.11 | 76.98 ± 2.47 | 75.06 ± 2.09 | 94.67 ± 9.79 | 1017.45 ± 6.06 | ||
| 0.833 | 27–28 | 56.40 ± 0.23 | 70.78 ± 0.13 | 66.38 ± 0.02 | 95.19 ± 0.50 | 1012.03 ± 23.30 | ||
| 0.625 | 29–30 | 61.96 ± 0.24 | 60.79 ± 4.23 | 60.76 ± 0.91 | 87.57 ± 2.99 | 1081.63 ± 8.28 | ||
| 91.70 ± 3.30 | ||||||||
| V | 113.33 | 2.5 | 31–32 | 25.70 ± 1.51 | 92.73 ± 0.52 | 92.58 ± 0.31 | 94.94 ± 5.96 | 2047.22 ± 87.47 |
| 1.25 | 33–34 | 46.28 ± 2.66 | 85.47 ± 0.42 | 85.98 ± 0.80 | 91.97 ± 4.64 | 2148.88 ± 77.83 | ||
| 0.833 | 35 | 58.98 | 85.09 | 86.11 | 78.50 | 2947.22 | ||
| 0.625 | 36 | 62.54 | 79.48 | 84.62 | 64.57 | 3726.54 | ||
| 82.50 ± 12.06 |
Similar to the CSTR, CO2 is the major gas component in the outlet gas, which accounts for 33.54–77.37%. The highest CH4 productivity is 62.54 mmol·Lr−1·day−1, which is achieved at a maximum gas circulation rate of 113.33 L·Lr−1·h−1 and a minimum GRT of 0.625 h. The highest CH4 concentration of 20.51% in the outlet gas appears at a maximum gas circulation rate of 113.33 L·Lr−1·h−1 and the longest GRT of 2.5 h employed in the experiment, as seen in Figure 6a. Except for Period I without gas circulation, the total outlet gas flow rate and the gas composition of the BCR-C in the other periods change with the GRT, in the same trend as the CSTR. Except for the last two days, the VFA concentration remains stable below 1300 mg/L, as seen in Figure 6b. The high VFA concentration can be attributed to the change in the reactor operation condition and the variable gas substrate load, which may not be conducive to the long-term stable operation of the reactors, leading to the accumulation of VFAs [41]. In fact, in the experiment of start-up strategy, when the reactor is operated at a GRT of 1.25 h and a circulation rate of 40 L·Lr−1·h−1 for more than 30 days, the VFA concentration does not even reach 200 mg/L. In future work, it may be an interesting and worthwhile issue to consider whether continuous variable operating conditions will lead to the accumulation of VFAs under a thermophilic condition.
3.2.1. Effect of Gas Retention Time
Figure 7 shows the effect of GRT on the biomethanation performance of the BCR-C. In the case without stirring, similar to the CSTR, CH4 productivity is kept at an extremely low level, which is not sensitive to GRT, as seen in Figure 7a. The syngas biomethanation is fully limited by the gas–liquid mass transfer, regardless of how the GRT is shortened and how fast the syngas is fed.
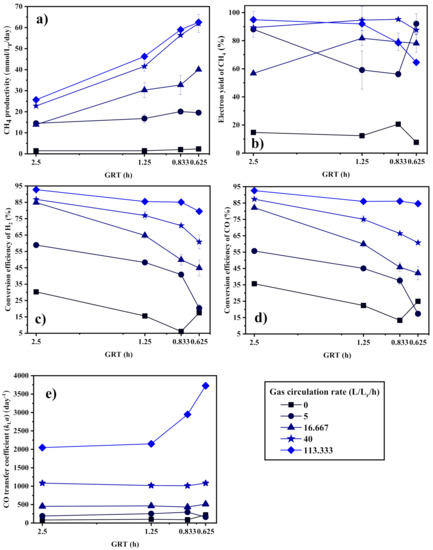
Figure 7.
(a) CH4 productivity, (b) electron yield to CH4, conversion efficiency of (c) H2 and (d) CO, and (e) CO transfer coefficient (kLa) of the BCR-C at different GRTs.
In the case of gas circulation, CH4 productivity increases with the shortening of the GRT, but the conversion efficiency of H2 and CO decreases. Similar to the CSTR, the mass transfer coefficient slightly increases or is not affected by shortening the GRT. The effect of GRT on the syngas biomethanation in the BCR-C is highly dependent on the gas circulation rate. At a higher gas circulation rate, a good gas–liquid mass transfer can be maintained; thus, an improvement of the syngas biomethanation performance by shortening the GRT can be more obvious, as observed in Figure 7. In view of the gas substrate utilization efficiency as seen in Figure 7c,d, the H2 and CO conversion efficiencies decrease with decreasing GRT at lower gas circulation rates, but remain fairly constant at a higher gas circulation rate of 113.33 L·Lr−1·h−1. This suggests that the gas substrates can be well utilized in the BCR-C with sufficiently high gas–liquid mass transfer when the gas feeding rate is raised to a high level. In contrast to the CSTR, the syngas biomethanation performance in the BCR-C operated at a high gas circulation rate is mainly dependent on the supply of the gas substrates instead of the gas–liquid mass transfer. Better gas–liquid mixing is more conducive for microbes to obtain and utilize the gas substrates, raising the upper limit of the reactor’s biomethanation capacity.
3.2.2. Effect of Gas Circulation Rate
Figure 8 shows the effect of gas circulation rate on the biomethanation performance of the BCR-C. The CH4 productivity, the conversion efficiency of gas substrates, and the mass transfer coefficient are obviously improved by increasing the gas circulation rate. In general, the production of CH4 is efficient, and the average yield increases with the gas circulation rate but decreases slightly at the highest circulation rate of 113.33 L·Lr−1·h−1. Too intensive gas–liquid mixing may be unsuitable for efficient CH4 production. In contrast to the CSTR, the syngas biomethanation performance or the gas–liquid mass transfer improves fast and approaches the maximum degree shortly by the gas circulation in comparison to the stirring speed used in the CSTR, as can be observed when comparing Figure 5, Figure 6, Figure 7 and Figure 8.
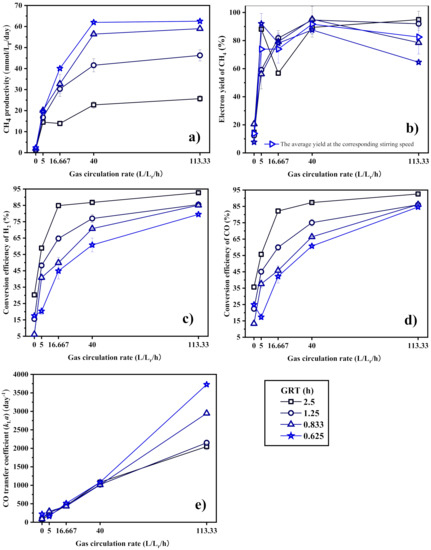
Figure 8.
(a) CH4 productivity, (b) electron yield to CH4, conversion efficiency of (c) H2 and (d) CO, and (e) CO transfer coefficient (kLa) of the BCR-C as a function of gas circulation rate.
It should be noticed in Figure 8e that the CO transfer coefficient is significantly raised by gas circulation over the whole range of the gas circulation rate, while the CH4 productivity (Figure 8a) and the substrate conversion efficiency (Figure 8c,d) increase fast at a lower gas recirculation rate but increase slowly at a higher gas circulation rate and even level off at a rate between 40 and 113.33 L·Lr−1·h−1. Similar to the analysis above, the mass transfer is no longer a limiting factor. The reactor has enough high capacity for microorganisms to digest the substrates provided when the gas circulation rate is raised over 40 L·Lr−1·h−1. For a GRT of 2.5 h, the mass transfer ability is even enough high to consume the inlet gas when the gas circulation rate is 16.667 L·Lr−1·h−1. Another evidence to illustrate that the syngas biomethanation in the BCR-C is not limited by the mass transfer is provided in Figure 6a, showing that the H2 and CO concentrations are held at extremely low levels of 1.90–5.31% and 4.58–9.61%, respectively, in the outlet gas at a gas circulation rate of 113.33 L·Lr−1·h−1. It could be predicted that the CH4 productivity can be increased further when the GRT is shorter. The best syngas biomethanation performance of the BCR-C in this experiment is achieved at a GRT of 0.625 h and a gas circulation rate of 40 L·Lr−1·h−1, where the CH4 productivity is 61.96 mmol·Lr−1·day−1 and the yield is 87.57%. Further increase in gas circulation rate will not help improve the CH4 productivity.
In summary, the gas circulation in the BCR is a highly efficient method to enhance the gas–liquid mass transfer. A high gas circulation rate may result in an excess gas–liquid mass transfer capacity, so that the CH4 productivity can be increased constantly by increasing the inlet gas flow rate.
3.3. Comparison and Discussion of Different Bioreactors
The syngas biomethanation performance of the BCR-C is much better than the CSTR. The experimental results from the BCR-C in this study show that the H2 and CO concentrations in the outlet gas drop significantly down to 1.90% and 4.58%, respectively, while the CH4 concentration goes up to 20.51%, the productivity is 62.54 mmol·Lr−1·day−1, the yield is 94.94%, and the CO transfer coefficient (kLa) is as high as 3726.54 day−1. In addition, the mixing by gas circulation is gentler for anaerobic sludge granules, which might not damage the microorganisms. An obvious drop in the CH4 yield is not observed in the experiment with the BCR-C when the gas recirculation rate is raised to an extremely high level, which occurs for the CSTR as seen in Figure 4.
For the CSTR, a gas–liquid mass transfer limitation is clearly shown in Figure 4 and Figure 5. The reactor has reached the upper limit of biomethanation at a GRT of 0.833 h, at which microorganisms cannot produce more CH4 even if more gas substrates are supplied. Raising the stirring speed can increase the CO transfer coefficient but will damage the activity of the inoculum and decrease the CH4 yield. Compared to mechanical stirring, gas circulation provides a higher gas–liquid mass transfer capacity that can lead to higher CH4 productivity. In term of energy consumption, the power required for stirring is also higher than gas circulation, which will lead to a big issue for scaleup in syngas biomethanation application [25].
Different from the traditional anaerobic digestion of organic matter in liquid, fermentation of gas substrates has higher requirement for the gas–liquid mass transfer [26,30]. It is more reasonable to disperse the gas in the liquid phase through gas circulation, which achieves mixing while supplying gas substrates. In addition, since the biomethanation of low-grade syngas is more difficult than that of H2-rich syngas [9], stronger mixing conditions are necessary. Obviously, the gas–liquid mass transfer capability provided by gas circulation is far superior to that provided by mechanical stirring.
In fact, the quality of the outlet gas obtained in this experiment is fairly different from other studies on biomethanation using syngas with a high concentration of H2 above 40% as the substrate [10,23,26,29,30]. Asimakopoulos et al. have made a good progress in syngas biomethanation using trickle bed reactors in recent years [29,30], in which a methane productivity of 203.76 mmol·Lr−1·day−1 was achieved at 60 °C and 2 atm with the supply of an artificial syngas containing 45% H2, 25% CO2, 20% CO, and 10% N2 [29]. The CH4 concentration in the outlet gas was 31.3%, which was higher than the 20.51% in this work. The CH4 concentration in the outlet gas even reached up to 81% in a biomethanation experiment of a syngas with 62% H2, 15% CO2, and 23% CH4 in an up-flow reactor with gas circulation under a thermophilic condition [26]. The above studies show that the CH4 concentration in the outlet gas can easily increase with the H2 concentration in the syngas substrate. Theoretically, the CH4 concentration can be raised up to 100% with the right proportion of H2 to (3 × CO + 4 × CO2) equals to one [30]. In the same experimental design [26], when the pressure was increased to 1.7 bars, the CH4 concentration was raised up to 90% in the trickle bed reactor [42]. This indicates that pressurization is also beneficial to syngas biomethanation. A high methane productivity of 163.2 mmol·Lr−1·day−1 was achieved in a CSTR at four bars in thermophilic biomethanation [23]. Therefore, future work should address the biomethanation performance of bioreactors with different designs, such as trickle bed reactors, as well as syngas biomethanation under high pressure.
The present study shows that a major issue of low-grade syngas biomethanation is an accumulation of CO2 in the outlet gas, making a barrier of methane application or injection into the natural gas grid. The common techniques for biogas upgrading are water scrubbing and pressure swing adsorption (PSA) to remove CO2 in the biogas, which are expensive [16,43]. In more recent studies, PtM is emphasized as an attractive technology for in situ or ex situ biogas upgrading by adding hydrogen produced from surplus renewable electricity [16,43].
For the gas substrate coming from air biomass gasification, there will be nearly 50% N2 remaining in the syngas. Separation of N2 is also a big economical challenge for outlet gas upgrading [17,24]. This challenge can be mitigated by cryogenic separation when the end product is directed to LNG [15]. A novel concept to avoid the N2 issue is that the syngas can be selectively converted into acetate at first, then the acetate in the liquid phase will be converted into CH4 [24]. However, the whole process needs to be evaluated in detail. No matter which downstream processing technology for outlet gas upgrading is required, the results from this work on low-grade syngas biomethanation are valuable for further R&D and industrial application of syngas biomethanation.
3.4. Effect of Start-Up Strategy
Three strategies were designed to start up the reactors as described in Section 2.2.3. After feeding different gas substrates into the three reactors, respectively, in Stage 1 for the reactor start-up operation, the gas substrates were switched to the artificial syngas for normal reactor operation in Stage 2.
The performance of syngas biomethanation in Stage 2 is shown in Table 4. It can be seen clearly that the reactor started up by feeding H2/CO2/N2 = 50%/12.5%/37.5% has the best performance with the highest CH4 productivity, substrate conversion efficiency, and CH4 concentration in the outlet gas. Compared to the reactor started up by feeding the artificial syngas, the CH4 productivity increases by 6.22%, the H2 conversion efficiency increases by 9.83%, and the CO conversion efficiency increases by 5.32%. These are similar to a previous study that the supply of H2 improves the biogas quality [11]. H2/CO2 are more favorable for microbial growth than CO and result in the proliferation of microbes [21]. The reactor started with pure CO has similar performance to that started with the syngas, even though the CH4 productivity is slightly reduced. The starting gas substrates of both contain 50% CO. The growth inhibition of CO on microorganisms might be a major factor for determining the biomethanation performance [13,35].
Table 4.
Comparison of 3 start-up strategies for syngas biomethanation in the continuous BCR-C. (S2: Stage 2 with normal reactor operation. COS2: the test run was started up by feeding with 50% CO + 50% N2; H2S2: by feeding with 50% H2 + 12.5% CO2 + 37.5% N2; and SynS2: by feeding with 20% H2 + 50% CO + 30% CO2).
To further analyze the different effects caused by the start-up strategies, metagenomic analysis was conducted using the KEGG database, as shown in Figure 9. Metabolism, genetic information processing, environmental information processing, and cellular processes are identified as the four primary pathways on KEGG Level 1. The dominant KEGG pathway is metabolism, including amino acid metabolism, carbohydrate metabolism, and energy metabolism, which normally exists in the AD system with large quantities [38,44]. In addition, translation, replication and repair, and membrane transport are the dominant pathways of genetic information processing and environmental information processing, respectively, which shows that translation regulation mechanism plays an important role in the normal operation of physiological function [45].
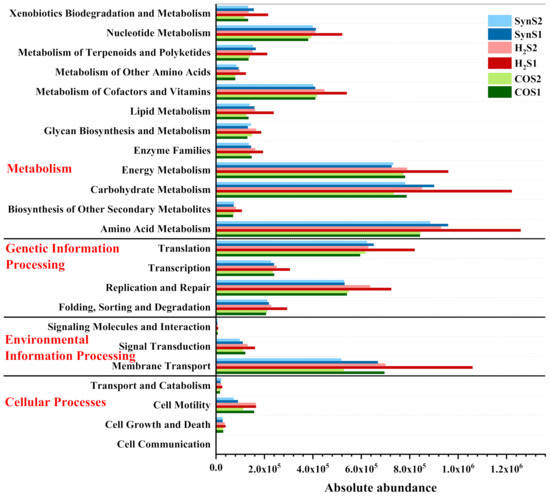
Figure 9.
Absolute abundance of KEGG function classification at Level 2 under the start-up stage and the normal operation stage. (S1: Stage 1 for reactor start-up operation; S2: Stage 2 for normal reactor operation. CO: the test run was started up by feeding with 50% CO + 50% N2. H2: the test run was started up by feeding with 50% H2 + 12.5% CO2 + 37.5% N2. Syn: the test run was started up by feeding with 20% H2 + 50% CO + 30% CO2.).
As shown in Figure 9, most of the functional gene clusters in the reactor started up by H2/CO2 have higher abundance compared to the other reactors at the same period, especially in Stage 1. This indicates that the reactor of this start-up strategy has more active cell growth and metabolic functions. It can be explained by the stimulation of H2/CO2 and the absence of CO inhibition. The improvements in cell growth and metabolism from Stage 1 are forwarded to Stage 2, enabling microbes to better able to utilize more substrates and improving the performance of the low-grade syngas biomethanation. It should be noticed that the abundance of functional gene clusters decreases in the case of H2S2, but the reactor operation remains stable instead of deterioration in Stage 2. How long such positive effect will last may require a longer-term evaluation.
Thus, for low-grade syngas with a high proportion of CO and a low proportion of H2, feeding substrates preferred by microorganisms to stimulate their growth and metabolism during the start-up stage of the reactor will be more effective in improving methanogenic performance, rather than feeding pure CO to force microorganisms to tolerant CO.
3.5. Analysis of the Microbial Communities
Figure 10 shows the community relative abundance of Bacteria at the phylum level and Archaea at the genus level. Under a thermophilic condition, the community composition is simpler than that under a mesophilic condition, because a high temperature is not suitable for the growth of many microorganisms [22]. As shown in Figure 10, the temperature is the major factor shifting the dominant communities for both Bacteria and Archaea. The initial inocula are obtained in a mesophilic industrial bioreactor, and its microbial communities are different from those in the thermophilic reactors of this experiment. The microbial communities are similar to each other in the thermophilic reactors at all periods.
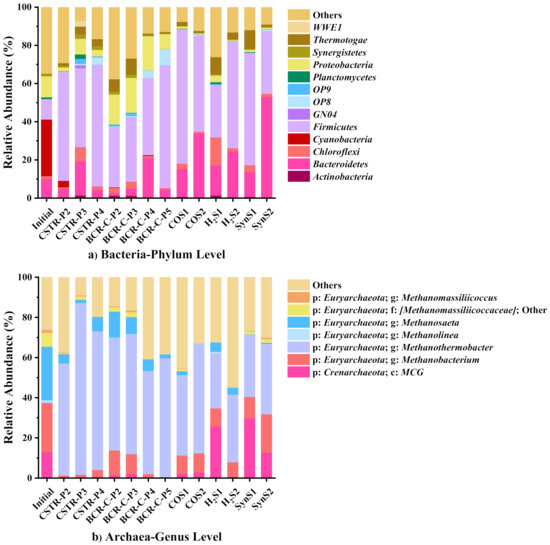
Figure 10.
Relative abundance of (a) Bacteria at the phylum level and (b) Archaea at the genus level using V4-V5 region primer set (Initial: anaerobic granular sludges before inoculation. P2-5: Periods II-V of different test runs. Others: the sum of all genera/phyla with the relative abundance below 3% in the individual samples).
For Bacteria, the communities are dominated by Firmicutes (27.28–70.16%) which are reported to be more tolerant to thermophilic condition because of the ability to form heat-resistant endospores [46]. A small amount of Proteobacteria (0.51–18.24%) and Bacteroidetes (4.51–24.12%) are also discovered. All of these bacteria are commonly found in anaerobic digestion process, participating in the metabolism and the formation of enzymes required by fermentation [21].
For Archaea, the dominant genus is Methanothermobacter, which accounts for 27.45–69.04%. It is a thermophilic hydrogenotrophic methanogen genus, active at a wide temperature range of 45–80 °C with an optimal temperature of 65 °C [21,22]. Another archaea, Methanobacterium (0.39–19.11%), seen in Figure 10b, which belongs to Methanobacteriales, is also a hydrogenotrophic methanogen [47]. However, Methanosaeta, which has made up 26.63% of the initial inocula, almost disappears. It is an aceticlastic methanogen usually growing under a mesophilic condition [47]. The community composition of the test runs in this experiment is exactly consistent with that under a thermophilic condition in other previous studies [21,22,29], which also further proves that the hydrogenotrophic methanogenesis is the dominant pathway for syngas biomethanation [22]. Many studies have shown that hydrogenotrophic methanogenesis has a higher priority than acetoclastic methanogenesis under a thermophilic condition [21,22,24]. This might also be one of the reasons why the reactor started with H2/CO2 has a better biomethanation performance.
The abundance of communities is not obviously affected by the change of the mass transfer conditions or the start-up strategies, because the dominant species are fixed strictly by the temperature. Therefore, the main reason affecting the reactor performance is the physical change of the mass transfer conditions. The start-up strategy raising the biomethanation performance is due to the improvement of microbial growth and metabolic activity, instead of a change in the dominant species.
4. Conclusions
In this work, the biomethanation of low-grade syngas in the CSTR and BCR-C under a thermophilic condition was studied with respect to the gas–liquid mass transfer and reactor start-up strategy. CH4 productivity is slightly increased by reducing the gas retention time (GRT), but significantly improved by increasing the stirring speed in the CSTR and the gas circulation rate in the BCR-C. The best syngas biomethanation performance of the CSTR with a CH4 productivity of 22.20 mmol·Lr−1·day−1 and a yield of 49.01% was achieved at a GRT of 0.833 h and a stirring speed of 300 rpm, while for the BCR-C, the best performance with a CH4 productivity of 61.96 mmol·Lr−1·day−1 and a yield of 87.57% was achieved at a GRT of 0.625 h and a gas circulation rate of 40 L·Lr−1·h−1. The BCR-C is more feasible for low-grade syngas biomethanation due to the high gas–liquid mass transfer capability. Starting the reactor by feeding H2/CO2 can effectively stimulate the growth and metabolism of microorganisms and create a better metabolic environment for subsequent biomethanation of low-grade syngas.
Author Contributions
Conceptualization, B.J. and C.Y.; Funding acquisition, W.Z. and C.Y.; Investigation, B.J., X.H., S.G. and J.A.; Methodology, B.J., D.Z. and G.P.; Project administration, U.S., W.Z., J.A., A.L. and M.T.; Resources, D.Z. and C.Y.; Supervision, C.Y.; Visualization, B.J.; Writing—original draft, B.J.; Writing—review and editing, E.H., W.Z. and C.Y. All authors have read and agreed to the published version of the manuscript.
Funding
This research was funded by the EU Regional Development Program [ERUF20353185] and “Bao Yu Gang” Foundation for Foreign Guest Professor Program at Zhejiang University.
Institutional Review Board Statement
Not applicable.
Informed Consent Statement
Not applicable.
Data Availability Statement
The data presented in this study are available from the corresponding author upon request.
Conflicts of Interest
The authors declare no conflict of interest.
References
- Sorda, G.; Banse, M.; Kemfert, C. An Overview of Biofuel Policies across the World. Energy Policy 2010, 38, 6977–6988. [Google Scholar] [CrossRef]
- Zhang, W. Automotive Fuels from Biomass via Gasification. Fuel Process. Technol. 2010, 91, 866–876. [Google Scholar] [CrossRef]
- He, M.; Sun, Y.; Han, B. Green Carbon Science: Efficient Carbon Resource Processing, Utilization, and Recycling towards Carbon Neutrality. Angew. Chemie Int. Ed. 2022, 61, e202112835. [Google Scholar] [CrossRef]
- Patinvoh, R.J.; Taherzadeh, M.J. Challenges of Biogas Implementation in Developing Countries. Curr. Opin. Environ. Sci. Health 2019, 12, 30–37. [Google Scholar] [CrossRef]
- Grimalt-Alemany, A.; Skiadas, I.V.; Gavala, H.N. Syngas Biomethanation: State-of-the-Art Review and Perspectives. Biofuels, Bioprod. Biorefining 2018, 12, 139–158. [Google Scholar] [CrossRef]
- Achinas, S.; Achinas, V.; Euverink, G.J.W. A Technological Overview of Biogas Production from Biowaste. Engineering 2017, 3, 299–307. [Google Scholar] [CrossRef]
- König, R.; Cuomo, M.; Pianta, E.; Buetti, A.; Mauri, F.; Tanadini, M.; Principi, P. Addition of Conductive Materials to Support Syntrophic Microorganisms in Anaerobic Digestion. Fermentation 2022, 8, 354. [Google Scholar] [CrossRef]
- Browne, J.; Nizami, A.S.; Thamsiriroj, T.; Murphy, J.D. Assessing the Cost of Biofuel Production with Increasing Penetration of the Transport Fuel Market: A Case Study of Gaseous Biomethane in Ireland. Renew. Sustain. Energy Rev. 2011, 15, 4537–4547. [Google Scholar] [CrossRef]
- Li, C.; Zhu, X.; Angelidaki, I. Syngas Biomethanation: Effect of Biomass-Gas Ratio, Syngas Composition and PH Buffer. Bioresour. Technol. 2021, 342, 125997. [Google Scholar] [CrossRef]
- Ghofrani-Isfahani, P.; Tsapekos, P.; Peprah, M.; Kougias, P.; Zhu, X.; Kovalovszki, A.; Zervas, A.; Zha, X.; Jacobsen, C.S.; Angelidaki, I. Ex-Situ Biogas Upgrading in Thermophilic up-Flow Reactors: The Effect of Different Gas Diffusers and Gas Retention Times. Bioresour. Technol. 2021, 340, 125694. [Google Scholar] [CrossRef]
- Li, Y.; Wang, Z.; He, Z.; Luo, S.; Su, D.; Jiang, H.; Zhou, H.; Xu, Q. Effects of Temperature, Hydrogen/Carbon Monoxide Ratio and Trace Element Addition on Methane Production Performance from Syngas Biomethanation. Bioresour. Technol. 2020, 295, 122296. [Google Scholar] [CrossRef]
- Couto, N.; Rouboa, A.; Silva, V.; Monteiro, E.; Bouziane, K. Influence of the Biomass Gasification Processes on the Final Composition of Syngas. Energy Procedia 2013, 36, 596–606. [Google Scholar] [CrossRef]
- Navarro, S.S.; Cimpoia, R.; Bruant, G.; Guiot, S.R. Biomethanation of Syngas Using Anaerobic Sludge: Shift in the Catabolic Routes with the CO Partial Pressure Increase. Front. Microbiol. 2016, 7, 1188. [Google Scholar] [CrossRef]
- Baleeiro, F.C.F.; Kleinsteuber, S.; Sträuber, H. Recirculation of H2, CO2, and Ethylene Improves Carbon Fixation and Carboxylate Yields in Anaerobic Fermentation. ACS Sustain. Chem. Eng. 2022, 10, 4073–4081. [Google Scholar] [CrossRef]
- Li, T.; Jia, X.; Chen, H.; Chang, Z.; Li, L.; Wang, Y.; Li, J. Tuning the Pore Environment of MOFs toward Efficient CH4/N2Separation under Humid Conditions. ACS Appl. Mater. Interfaces 2022, 14, 15830–15839. [Google Scholar] [CrossRef]
- Xia, A.; Cheng, J.; Murphy, J.D. Innovation in Biological Production and Upgrading of Methane and Hydrogen for Use as Gaseous Transport Biofuel. Biotechnol. Adv. 2016, 34, 451–472. [Google Scholar] [CrossRef]
- Hu, X.; Jiang, B.; Yu, C.; Söderlind, U.; Göransson, K.; Zhang, W. Product Gas Biomethanation with Inoculum Enrichment and Grinding. Biomass Convers. Biorefinery 2022, 1–12. [Google Scholar] [CrossRef]
- Maroufmashat, A.; Fowler, M. Transition of Future Energy System Infrastructure; through Power-to-Gas Pathways. Energies 2017, 10, 1089. [Google Scholar] [CrossRef]
- Lewandowska-Bernat, A.; Desideri, U. Opportunities of Power-to-Gas Technology in Different Energy Systems Architectures. Appl. Energy 2018, 228, 57–67. [Google Scholar] [CrossRef]
- Navarro, S.S.; Cimpoia, R.; Bruant, G.; Guiot, S.R. Specific Inhibitors for Identifying Pathways for Methane Production from Carbon Monoxide by a Nonadapted Anaerobic Mixed Culture. Can. J. Microbiol. 2014, 60, 407–415. [Google Scholar] [CrossRef]
- Bu, F.; Dong, N.; Kumar Khanal, S.; Xie, L.; Zhou, Q. Effects of CO on Hydrogenotrophic Methanogenesis under Thermophilic and Extreme-Thermophilic Conditions: Microbial Community and Biomethanation Pathways. Bioresour. Technol. 2018, 266, 364–373. [Google Scholar] [CrossRef] [PubMed]
- Jiang, B.; Hu, X.; Söderlind, U.; Göransson, K.; Zhang, W.; Yu, C. Identification of the Biomethanation Pathways during Biological CO2 Fixation with Exogenous H2 Addition. Fuel Process. Technol. 2022, 238, 107478. [Google Scholar] [CrossRef]
- Figueras, J.; Benbelkacem, H.; Dumas, C.; Buffiere, P. Biomethanation of Syngas by Enriched Mixed Anaerobic Consortium in Pressurized Agitated Column. Bioresour. Technol. 2021, 338, 125548. [Google Scholar] [CrossRef] [PubMed]
- Luo, G.; Jing, Y.; Lin, Y.; Zhang, S.; An, D. A Novel Concept for Syngas Biomethanation by Two-Stage Process: Focusing on the Selective Conversion of Syngas to Acetate. Sci. Total Environ. 2018, 645, 1194–1200. [Google Scholar] [CrossRef] [PubMed]
- Orgill, J.J.; Atiyeh, H.K.; Devarapalli, M.; Phillips, J.R.; Lewis, R.S.; Huhnke, R.L. A Comparison of Mass Transfer Coefficients between Trickle-Bed, Hollow Fiber Membrane and Stirred Tank Reactors. Bioresour. Technol. 2013, 133, 340–346. [Google Scholar] [CrossRef]
- Kougias, P.G.; Tsapekos, P.; Treu, L.; Kostoula, M.; Campanaro, S.; Lyberatos, G.; Angelidaki, I. Biological CO2 Fixation in Up-Flow Reactors via Exogenous H2 Addition. J. Biotechnol. 2020, 319, 1–7. [Google Scholar] [CrossRef]
- Munasinghe, P.C.; Khanal, S.K. Biomass-Derived Syngas Fermentation into Biofuels: Opportunities and Challenges. Bioresour. Technol. 2010, 101, 5013–5022. [Google Scholar] [CrossRef]
- Weber, S.; Schaepe, S.; Freyer, S.; Kopf, M.H.; Dietzsch, C. Impact of Nozzle Operation on Mass Transfer in Jet Aerated Loop Reactors. Characterization and Comparison to an Aerated Stirred Tank Reactor. Eng. Life Sci. 2018, 18, 579–588. [Google Scholar] [CrossRef]
- Asimakopoulos, K.; Łężyk, M.; Grimalt-Alemany, A.; Melas, A.; Wen, Z.; Gavala, H.N.; Skiadas, I.V. Temperature Effects on Syngas Biomethanation Performed in a Trickle Bed Reactor. Chem. Eng. J. 2020, 393, 124739. [Google Scholar] [CrossRef]
- Asimakopoulos, K.; Grimalt-Alemany, A.; Lundholm-Høffner, C.; Gavala, H.N.; Skiadas, I.V. Carbon Sequestration Through Syngas Biomethanation Coupled with H2 Supply for a Clean Production of Natural Gas Grade Biomethane. Waste Biomass Valorization 2021, 12, 6005–6019. [Google Scholar] [CrossRef]
- Oelgeschläger, E.; Rother, M. Carbon Monoxide-Dependent Energy Metabolism in Anaerobic Bacteria and Archaea. Arch. Microbiol. 2008, 190, 257–269. [Google Scholar] [CrossRef]
- Sipma, J.; Henstra, A.M.; Parshina, S.M.; Lens, P.N.; Lettinga, G.; Stams, A.J.M. Microbial CO Conversions with Applications in Synthesis Gas Purification and Bio-Desulfurization. Crit. Rev. Biotechnol. 2006, 26, 41–65. [Google Scholar] [CrossRef]
- Zhang, Z.; Ding, C.; Wang, L.; Jiang, B.; Söderlind, U.; Zhang, W.; Yu, C. CO Biomethanation with Different Anaerobic Granular Sludges. Waste Biomass Valorization 2021, 12, 3913–3925. [Google Scholar] [CrossRef]
- Lide, D. CRC Handbook of Chemistry and Physics. J. Mol. Struct. 1992, 268, 320. [Google Scholar] [CrossRef]
- Esquivel-Elizondo, S.; Delgado, A.G.; Krajmalnik-Brown, R. Evolution of Microbial Communities Growing with Carbon Monoxide, Hydrogen, and Carbon Dioxide. FEMS Microbiol. Ecol. 2017, 93, 1–12. [Google Scholar] [CrossRef]
- Díaz, I.; Fdz-Polanco, F.; Mutsvene, B.; Fdz-Polanco, M. Effect of Operating Pressure on Direct Biomethane Production from Carbon Dioxide and Exogenous Hydrogen in the Anaerobic Digestion of Sewage Sludge. Appl. Energy 2020, 280, 115915. [Google Scholar] [CrossRef]
- Huang, L.; Wang, Q.; Jiang, L.; Zhou, P.; Quan, X.; Logan, B.E. Adaptively Evolving Bacterial Communities for Complete and Selective Reduction of Cr(VI), Cu(II), and Cd(II) in Biocathode Bioelectrochemical Systems. Environ. Sci. Technol. 2015, 49, 9914–9924. [Google Scholar] [CrossRef]
- Yang, Z.; Sun, H.; Zhou, L.; Arhin, S.G.; Papadakis, V.G.; Goula, M.A.; Liu, G.; Zhang, Y.; Wang, W. Bioaugmentation with Well-Constructed Consortia Can Effectively Alleviate Ammonia Inhibition of Practical Manure Anaerobic Digestion. Water Res. 2022, 215, 118244. [Google Scholar] [CrossRef]
- Liu, Y.; Xu, H.L.; Yang, S.F.; Tay, J.H. Mechanisms and Models for Anaerobic Granulation in Upflow Anaerobic Sludge Blanket Reactor. Water Res. 2003, 37, 661–673. [Google Scholar] [CrossRef]
- Liang, Z.; Tu, Q.; Su, X.; Yang, X.; Chen, J.; Chen, Y.; Liu, C.; Li, H.; He, Q. Formation, Extracellular Polymeric Substances and Microbial Community of Aerobic Granules Enhanced by Microbial Flocculant Compared with Poly-Aluminum Chloride. J. Clean. Prod. 2019, 220, 544–552. [Google Scholar] [CrossRef]
- Zhao, J.; Li, Y.; Euverink, G.J.W. Effect of Bioaugmentation Combined with Activated Charcoal on the Mitigation of Volatile Fatty Acids Inhibition during Anaerobic Digestion. Chem. Eng. J. 2022, 428, 131015. [Google Scholar] [CrossRef]
- Ebrahimian, F.; De Bernardini, N.; Tsapekos, P.; Treu, L.; Zhu, X.; Campanaro, S.; Karimi, K.; Angelidaki, I. Effect of Pressure on Biomethanation Process and Spatial Stratification of Microbial Communities in Trickle Bed Reactors under Decreasing Gas Retention Time. Bioresour. Technol. 2022, 361, 127701. [Google Scholar] [CrossRef] [PubMed]
- Quarton, C.J.; Samsatli, S. Power-to-Gas for Injection into the Gas Grid: What Can We Learn from Real-Life Projects, Economic Assessments and Systems Modelling? Renew. Sustain. Energy Rev. 2018, 98, 302–316. [Google Scholar] [CrossRef]
- Li, Q.; Zhang, K.; Yang, Z.; Guo, H.; Zheng, X.; Zhang, Q.; Xiong, J.; Lu, X. Dynamic Changes of Microbial Community and Moisture Ratio during Bio-Drying of Sludge after Electro-Dewatering. J. Environ. Manage. 2022, 324, 116366. [Google Scholar] [CrossRef]
- Wang, X.; Wang, P.; Meng, X.; Ren, L. Performance and Metagenomics Analysis of Anaerobic Digestion of Food Waste with Adding Biochar Supported Nano Zero-Valent Iron under Mesophilic and Thermophilic Condition. Sci. Total Environ. 2022, 820, 153244. [Google Scholar] [CrossRef]
- Guo, X.; Xia, X.; Tang, R.; Zhou, J.; Zhao, H.; Wang, K. Development of a Real-Time PCR Method for Firmicutes and Bacteroidetes in Faeces and Its Application to Quantify Intestinal Population of Obese and Lean Pigs. Lett. Appl. Microbiol. 2008, 47, 367–373. [Google Scholar] [CrossRef]
- Luo, G.; Wang, W.; Angelidaki, I. Anaerobic Digestion for Simultaneous Sewage Sludge Treatment and CO Biomethanation: Process Performance and Microbial Ecology. Environ. Sci. Technol. 2013, 47, 10685–10693. [Google Scholar] [CrossRef]
Disclaimer/Publisher’s Note: The statements, opinions and data contained in all publications are solely those of the individual author(s) and contributor(s) and not of MDPI and/or the editor(s). MDPI and/or the editor(s) disclaim responsibility for any injury to people or property resulting from any ideas, methods, instructions or products referred to in the content. |
© 2022 by the authors. Licensee MDPI, Basel, Switzerland. This article is an open access article distributed under the terms and conditions of the Creative Commons Attribution (CC BY) license (https://creativecommons.org/licenses/by/4.0/).