1. Introduction
In recent years, several efforts have been directed towards the development and improvement of techniques that allow the evaluation of foods and diets that accurately predict food intake and digestibility. These techniques include biological methods that simulate the food digestion process, which involve the direct use of animals (in vivo and in situ methods), and laboratory methods, which do not require the direct use of animals and simulate the ruminal environment and digestion process using ruminal fluid collected from donor animals (in vitro methods).
Gas production measurement has become a common tool to characterize food and investigate rumen fermentation kinetics. Since the first report of the technique by Menke et al. in [
1], several new techniques have been developed to measure gas production during the fermentation of food [
2,
3,
4]. The principle of these techniques includes electronically measuring gas production during the incubation of a food sample with ruminal liquid.
The standardization of food evaluation protocols is an important premise for consideration, which was a fundamental goal during the development of the Tilley and Terry [
5] technique and allows for reproducible results between laboratories. However, protocols vary between different laboratories that use gas production measurement techniques. In addition, the technique itself varies between laboratories, especially with regard to the use of semiautomatic or automatic measurement techniques.
The in vitro semiautomatic gas production measurement technique [
6] is widely used to predict the nutritional value of foods and diets [
7,
8], mainly due to its ability to evaluate many foods, low cost and high repeatability, in addition to being able to describe ruminal fermentation kinetics and estimate the rate and extent of degradation. However, this measurement technique still depends on the manual insertion of a portable pressure transducer into each fermentation bottle, increasing the need for manual operation.
In turn, fully automated gas production measurement techniques, whether ventilated or unventilated, have the advantage of requiring limited manual operation in studies of gas production. The Ankom
RF gas production system provides an easy-to-use method for monitoring and measuring gas production. This system has been used in studies on horse nutrition [
9] and in the evaluation of the kinetics of microbial metabolism [
10]. A comparison of gas production measurement between different laboratories was also performed using the Ankom
RF system [
11], and it was also implemented in a comparison with different gas production systems [
12]. However, there are still few studies using the Ankom
RF system to evaluate gas production in vitro; in addition, no work has compared the results of this technique with semiautomatic systems.
Therefore, the gas production kinetics from ruminal fermentation in two different diets were evaluated using two in vitro gas production measurement techniques: the semiautomatic measurement technique proposed by Mauricio et al. [
6] and the fully automated measurement technique developed by ANKOM (Ankom
RF gas production system).
2. Materials and Methods
The research was conducted in the Gas Production Unit of the Laboratory of Food Analysis and Animal Nutrition, located in the Center for Agricultural Sciences, in the Federal University of Paraiba (UFPB), Paraiba State, Brazil (06°57′48″ S and 35°41′30″ W).
The study was carried out in accordance with the criteria relating to the care of experimental animals, and the use of animals fistulated in the rumen was submitted to the ethics and animal welfare committee of the Federal University of Paraíba (UFPB) (CEUA n° 9866190719).
2.1. Experimental Diets
For the test, two diets based on Tifton hay, milled corn, and soybean meal were used as the substrates, with different roughage:concentrate ratios of 60:40 (low nonfiber carbohydrate content) and 30:70 (high nonfiber carbohydrate content) based on DM (
Table 1). All ingredients were ground in a Willey mill (Model MA 580, Marconi Ltd., Piracicaba, Brazil) using 1.0 mm mesh screens and analyzed to dry matter (DM), ash, crude protein (CP) and ether extract (EE) according to the AOAC [
13]. The neutral detergent fiber (NDF) and acid detergent fiber (ADF) contents were determined by the method of Van Soest et al. [
14]. The total carbohydrate (TC) content was estimated according to Sniffen et al. [
15] and the nonfibrous carbohydrate (NFC) content was estimated according to Van Soest et al. [
14].
2.2. In Vitro Gas Production Measurement Techniques
For the evaluation of gas production kinetics, two distinct measurement techniques were used: semiautomatic [
6] and automatic (ANKOM
RF System) measurement.
In the semiautomatic system, the gas production kinetics were evaluated using the methodology proposed by Mauricio et al. [
6] and modified by Menezes et al. [
16]. The pressure in the flasks was measured by a pressure transducer (DPI 705, Druck Ltd., General Electrics
®; Leicester, UK), inserting a 21 G × 1″ (0.80 × 25 mm) needle through the vial caps that was attached to the pressure transducer. The transducer was then removed and the needle kept inserted into the cap for a few seconds for complete stabilization between internal and external pressures. The gas pressure (psi) measured during the test was transformed into volume (mL of gas) using the following equation: V = (4.4392 × p) + 0.8943, where p = pressure in kilopascals (kPa).
In the automatic gas production measurement technique, the methodology developed by Ankom Technology
® (Macedon, NY, USA; ANKOM
RF gas production system) [
17] was used. The technique makes it possible to evaluate the kinetics of ruminal fermentation in an automated way, monitoring the gas pressure within multiple modules. The system is capable of including up to 50 individual modules that communicate information to a computer using radio frequency (RF) transmission. Each unit (module) consists of a glass bottle (actual capacity: 310 mL) equipped with an ANKOM pressure sensor module (pressure range: −69 to +3447 kPa; resolution: 0.27 kPa; accuracy 0.1% measured values), including a microchip and a radio sender. The measured gas pressure was converted into moles of gas produced using the ‘ideal’ gas law (Equation (1)) and then converted to milliliters (mL) of gas produced by Avogadro’s law (Equation (2)).
where n = gas produced in moles (mol);
p = pressure in kilopascals (kPa);
V = headspace volume in the glass bottle in liters (L);
T = temperature in Kelvin (K);
R = gas constant (8.314472 L·kPa/K/mol).
Gas production was recorded at 2, 4, 6, 8, 10, 12, 14, 17, 20, 24, 28, 34 and 48 h. Manual flask shaking was performed after each pressure reading.
2.3. In Vitro Gas Production Kinetics and Degradability
2.3.1. Donor Animals and Microbial Inoculum Preparation
Rumen fluid was collected 2 h after feeding of two Santa Ines sheep (with an average body weight of 40 kg (s.e. 3.0 kg) and permanent rumen cannulas) using an elephant-grass-based-diet supplemented with 0.4 kg of corn concentrate. The fluid was filtered through four layers of cotton cloth, stored in thermoses previously heated to 39 °C and sent to the laboratory.
2.3.2. Incubation Medium Preparation
The buffer medium was prepared as described by Theodorou et al. [
3]. The buffer was carbonated with carbon dioxide (CO
2) for three hours before use until the pH was stable between 6.8 and 6.9.
2.3.3. Incubation Flask Preparation
The feed ingredients were ground (weight = 1 mm) and weighed separately in nylon bags (5 × 10 cm2) with 50 µm pores (1 g of feed/bag) that were placed in 160 mL glass bottles (semiautomatic technique) and in 250 mL borosilicate flasks (automatic technique). Ninety milliliters (90 mL) of the previously prepared incubation medium was added to each flask. Then, the solutions of the flasks for both techniques were saturated with CO2. The bottles of the semiautomatic system were sealed with rubber stoppers, packed in wooden boxes and kept overnight under refrigeration at 4 °C. In turn, the automatic system bottles were closed with a screw cap, placed in wooden boxes and kept under refrigeration at 4 °C.
Five hours before the start of the test, the boxes containing the incubation flasks were transferred to the gas production oven and maintained at a temperature of 39 °C to ensure that the buffer solution was at the same temperature as that of the ruminal liquid at the time of inoculation.
In the semiautomatic system, ruminal fluid (10 mL) was injected into the incubation flasks through the rubber stopper using a 20 mL syringe with an 18 G × 1½ hypodermic needle (40 mm × 1.20 mm) [
8]. Soon afterwards, the internal pressure of the flasks was eliminated and the flasks were transferred to a greenhouse to begin incubation.
In the automatic system, the injection of the ruminal fluid was performed directly through the tops of the vials. Thus, the screw caps were removed from the flasks, 10 mL of ruminal fluid was added, the solution was saturated with CO2 and then the flasks were closed with the measurement modules. Subsequently, all the valves of the modules were opened to release the existing pressure and then immediately closed to begin the incubation.
2.3.4. Kinetic Parameter Estimation and Substrate Disappearance
Cumulative gas production data were analyzed by a two-compartment model [
18]. For the gas production data to fit the tested mathematical model, it was necessary to estimate gas production at 72 h by applying a derivative using an exponential model.
Dry matter, organic matter and crude protein degradabilities in the diets were estimated by removing the polyester bags after 48 h of incubation. The removal took place after the flasks were cooled to 4 °C to stop microbial fermentation. Then, the bags were washed in running water and weighed after drying for 12 h in a 65 °C oven and 2 h in a 105 °C oven.
2.4. Rumen Parameter (pH, NH3-N) Determination
To evaluate ruminal fermentation parameters, collection of the incubation liquid from the fermentation flasks was conducted. The liquid was homogenized and the pH was measured by direct reading using a portable digital potentiometer (K39-0014PA-KASVI). Subsequently, approximately 40 mL of the acid-free medium was stored to measure ammoniacal nitrogen (NH
3-N) content according to the technique described by Detmann et al. [
19] (INCT-CA N-007/1), where at the time of analysis, the samples were thawed, mixed with trichloroacetic acid and centrifuged at 3000 rpm for 10 min.
2.5. Experimental Design and Statistical Analyses
The experimental design was a randomized block design in a 2 × 2 factorial arrangement (two techniques and two diets). Four repetitions were used per treatment/per test, with a total of three tests, which were used as blocks.
Gas production parameters and curve fitting were estimated using PROC NLIN of SAS University statistical software (SAS Institute, Cary, NC, USA). The data were subjected to analysis of variance by the PROC MIXED procedure of SAS, and the comparison between means was obtained by applying the Tukey test at 5% probability.
Aiming to complement the comparison analyzes between the two methods (automatic and semiautomatic), Pearson’s correlation analysis was performed, presenting the correlation significance by the
p value of the
t test and chi-square test (
X2) for association between the two gas production techniques, the variation being determined by the value of
p (
p ≤ 0.05). Then, the strength of the association was established using the Cramer’s test (
V). In addition to presenting the determination coefficient (R
2) between the two methods and equations following a linear model. The analyzes were carried out in the Past program v4.01 [
20].
The data from the two gas production measurement techniques in the diets with high- and low-CNF contents were submitted to multivariate analysis through the dissimilarity measure using the Gower distance and the unweighted pair–group method with the arithmetic mean (UPGMA) clustering method using the Molecular Evolutionary Genetics Analysis version 7.0 (MEGA7) program for large datasets [
21] for elucidation of the cluster from the dissimilarity matrix. Principal component (PC) analysis was also performed to identify the variables that most contributed to the behavior of treatments using the factoextra package of the R program [
22].
3. Results
The production of gas from the fermentation of fiber carbohydrates (
Vf2), estimated for up to 72 h of incubation, was 22% higher with the automatic technique than with the semiautomatic technique. However, the gas production rate of fiber carbohydrates (
m2) was 15% higher with the semiautomatic technique. On the other hand, the gas production from nonfiber carbohydrate (
Vf1) fermentation did not differ between the two techniques (
p = 0.109), with an average value of 123.05 mL/g DM. Diet influenced
Vf1, which was 18% higher for the high-NFC diet than for the low-NFC diet. The lag time was not altered according to the measurement technique or diet used, with an average value of 3.81 h (
Table 2).
There was an interaction effect when estimating the total gas production (
Vt) at 72 h of incubation (
p = 0.034). The
Vt of the high-NFC diet was higher than that of the low-NFC diet, regardless of the technique used, with an average value of 198.33 mL of gas/g DM. However, the
Vt of the low-NFC diet differed between techniques and was 22.9% higher when measured with the automatic technique than with the semiautomatic technique. In the comparison of
Vt between diets, there was variation in both systems, with that of the high-NFC diet being 12.1 and 30.4% higher than that of the low-NFC diet in the automatic and semiautomatic systems, respectively (
Figure 1A).
There was an interaction effect observed for crude protein degradability at 48 h of incubation (
p = 0.0026), where in the semiautomatic system there was an increase in crude protein degradability of 3.03 and 7.19% in relation to that in the automatic system for the high- and low-NFC diets, respectively. When comparing diets, there was variation only in the semiautomatic system (
p < 0.0001), with an increase of 5.12% crude protein degradability in the high-NFC diet (
Figure 1B).
The curves of cumulative gas production from nonfiber (
Figure 2A) and fiber (
Figure 2B) carbohydrates did not differ when evaluated by different measurement techniques over the evaluation periods. Gas production resulting from the fermentation of nonfiber carbohydrates showed a highly positive correlation (r = 0.94) between the two techniques, in addition to there being no variation by the
X2 test (
p = 0.199) (
Figure 2D) with a high coefficient of determination of R
2 = 0.96, whereas for the production of gas from fiber carbohydrates, a strong positive correlation was observed (r = 0.702); similarity between the methods by the
X2 test (
p = 0.9288), however, the determination coefficient (R
2 = 0.77) was relatively low between the techniques (
Figure 2E).
There was a “technique × time” interaction for total gas production (
p = 0.0009) observed up to 48 h of incubation. The cumulative gas production curve after 14 h of incubation was 6.3% greater (
p < 0.05) with the automatic technique than with the semiautomatic technique (
Figure 2C), producing approximately 6.3% (
p = 0.0004) more gas at 48 h of incubation. In the dispersion diagram, a highly positive correlation (r = 0.96) was observed between the techniques and similarity between the methods by the
X2 test (
p = 0.4683); moreover, there was a high coefficient of determination of R
2 = 0.97 between the two techniques (
Figure 2F).
Figure 2G–I shows that there was no difference between the automatic and semiautomatic techniques in estimating the average gas production from fermentation of nonfiber (
p = 0.429), fiber (
p = 0.092) and total (
p = 0.279) carbohydrates, respectively.
After eight hours of incubation, the gas production from fermentation of NFCs (
Figure 3A) and the total gas production (
Figure 3B) were significantly higher (
p < 0.05) in the high-NFC diet than in the low-NFC diet, with an increasing difference over time.
Dry matter and organic matter degradability were 3.85 and 3.33% greater, respectively, when evaluated using the semiautomatic technique than when using the automatic technique. Compared with the low-NFC diet, the high-NFC diet resulted in a lower pH (5.88) and lower NH
3-N concentration (39.61 mg/dL) in the incubation medium. In addition, the high-NFC diet had greater dry matter and organic matter degradability (
p < 0.0001) than the low-NFC diet (
Table 3).
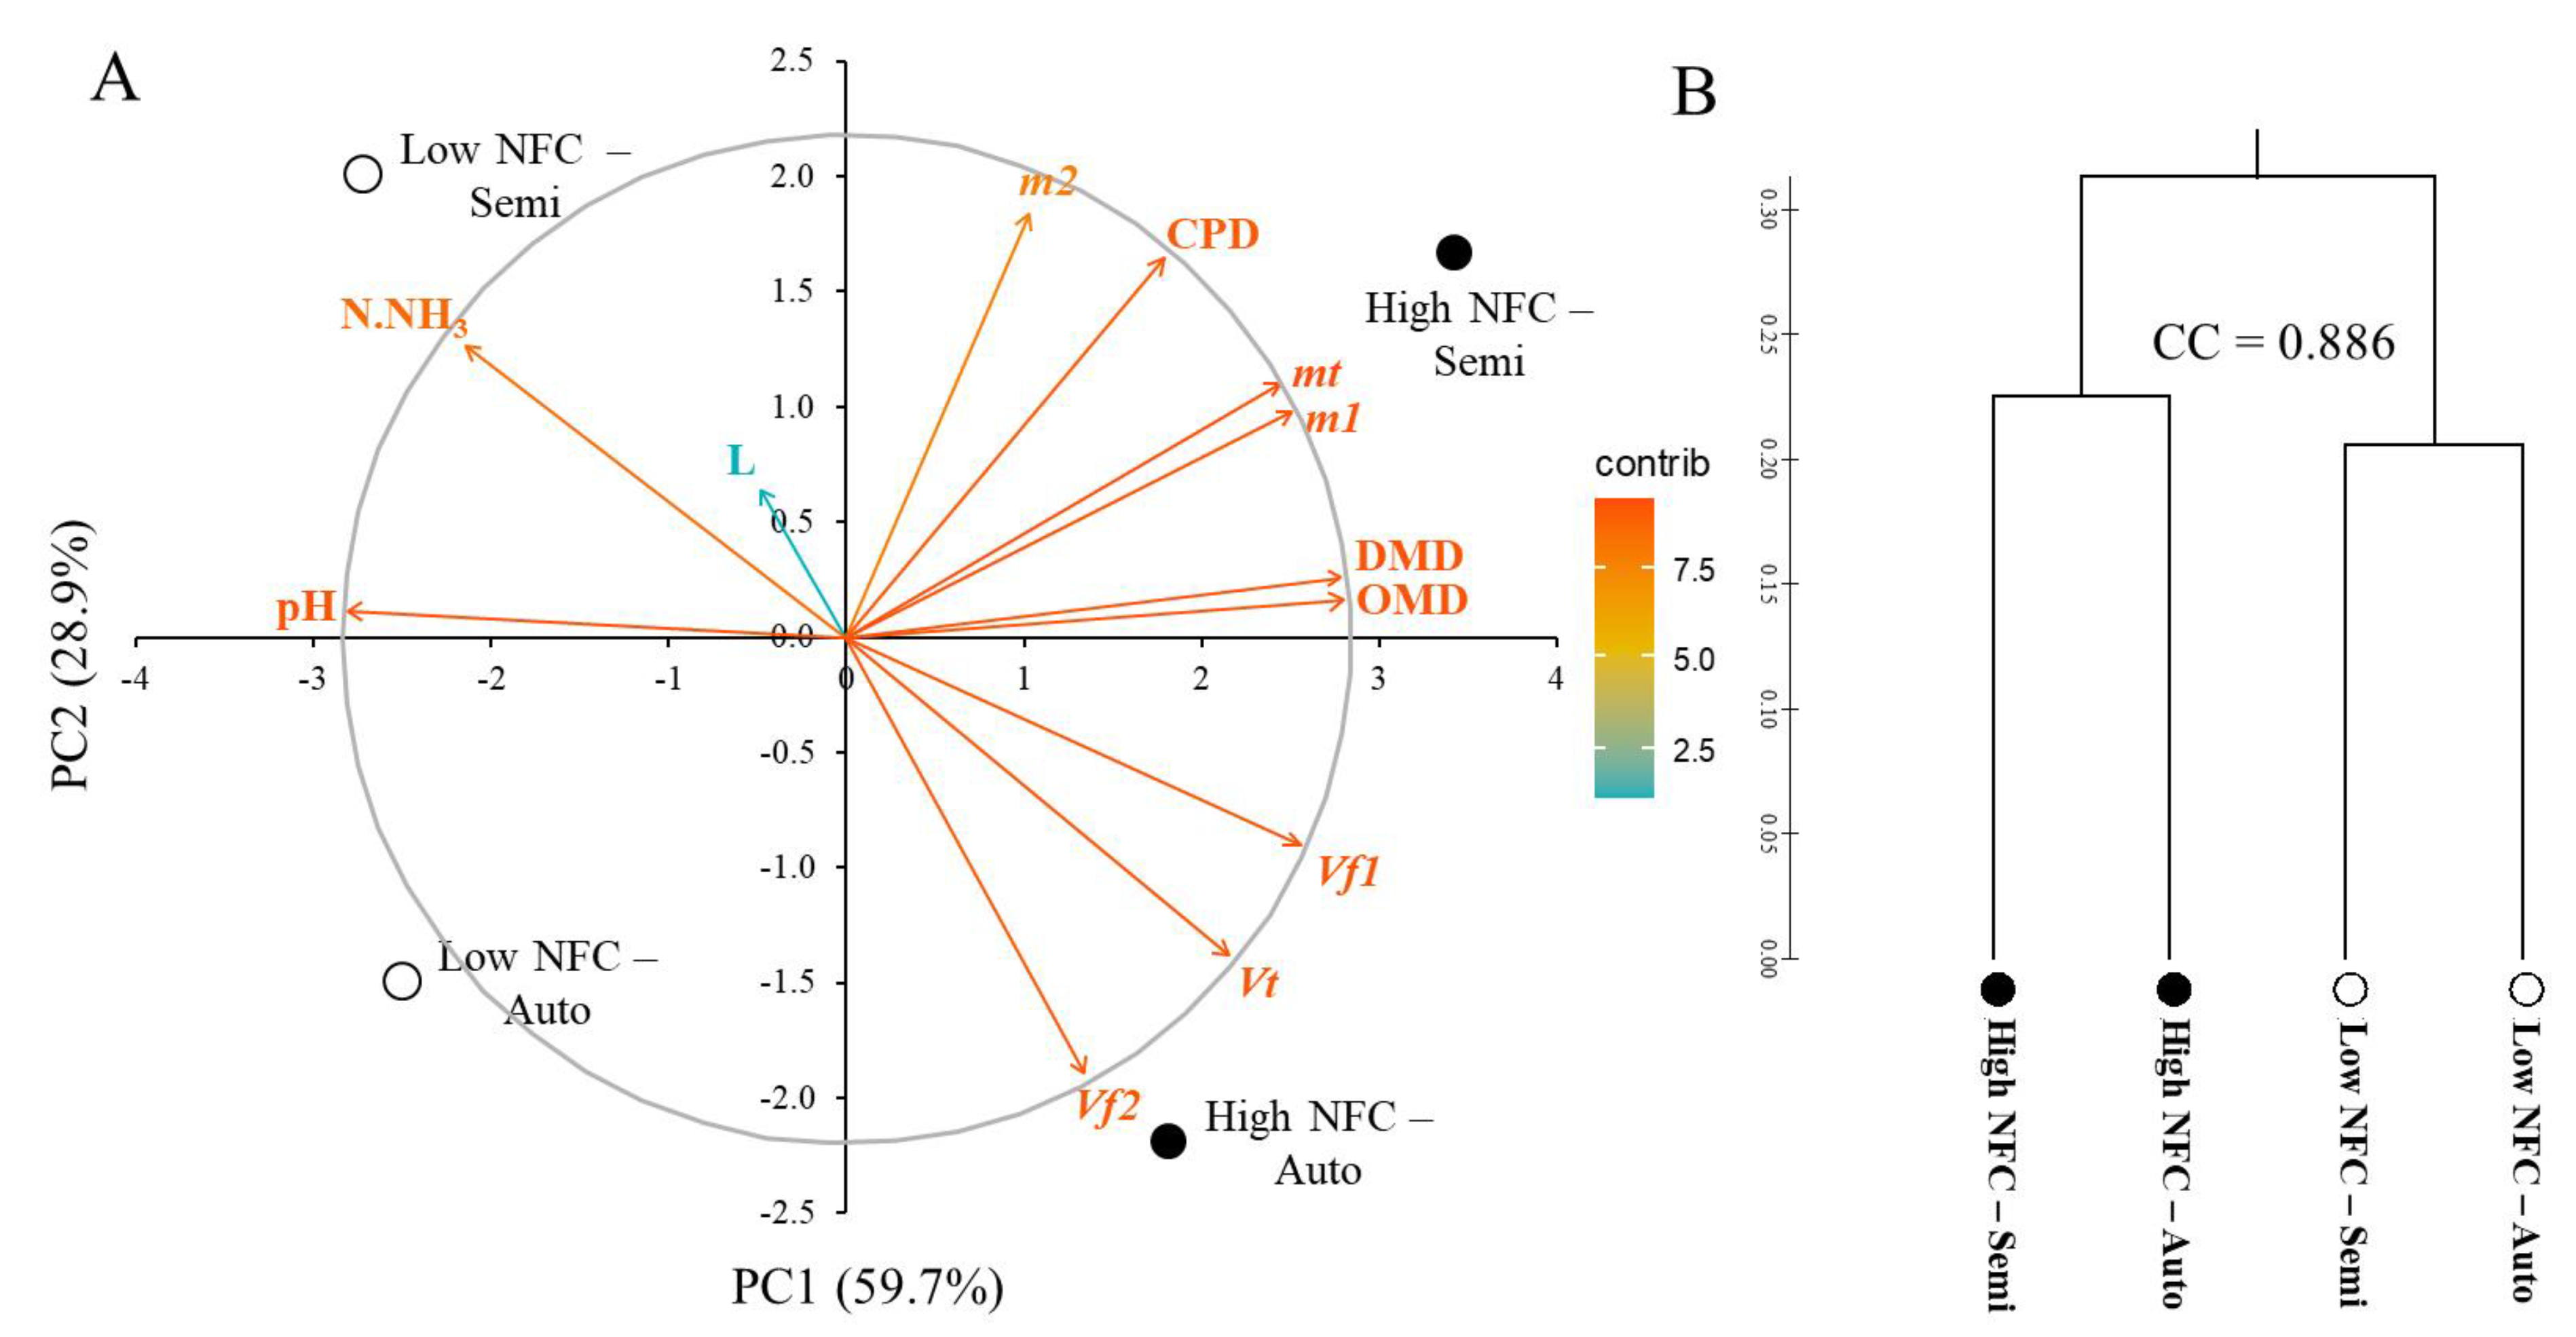
In the principal component analysis, the first two components explained 88.6% of the total variation in the data. The factor loads with the greatest contribution to component 1 variance were pH, OMD, DMD,
Vf1,
m1 and
Vt, accounting for 81.19% of the variance. For the second component,
Vf2,
m2,
Vt, CPD and NH
3-N accounted for 78.91% of the variance. Factors such as
mt,
m1 and CPD directly influenced the response of the high-NFC diet gas production in the semiautomatic system, whereas
Vf2,
Vt and
Vf1 contributed to the response of the gas production of the same diet in the automatic system. Regarding the low-NFC diet in the semiautomatic system, the NH
3-N content and pH directly impacted gas production of this treatment group, whereas these factors negatively impacted gas production from the low-NFC diet in the automatic system (
Figure 4A).
Negative correlations of high magnitude were observed between pH ×
Vf1,
m1,
Vt,
mt, DMD and OMD with r = −0.93, −0.87, −0.81, −0.83 −0.94 and −0,95, respectively, whereas positive correlations were observed between
Vf1 ×
Vf2,
Vt, DMD and OMD with r = 0.81, 0.97, 0.81 and 0.83, respectively, and between
m1 ×
mt, DMD, OMD and CPD with r = 0.99, 0.90, 0.88 and 0.92, respectively (
Figure 4A).
Through cluster analysis using the UPGMA grouping method based on Gower distance, it was possible to visualize the formation of two groups, the first being formed by the high-NFC diet in both systems and the second by the low-NFC diet in the automatic and semiautomatic systems (
Figure 4B).
4. Discussion
Cumulative gas production, using gas production measurement techniques, has successfully been used to estimate the digestion rates of different carbohydrate fractions, assuming that the gases produced came from the fermentation of the incubated material by ruminal microorganisms [
2]. Thus, the comparison of different gas production measurement techniques is necessary to increase the confidence of the generated data [
23], since, in addition to the equipment used, several other factors can affect gas production measurement, such as incubation procedure (buffer, collection of ruminal fluid, buffer ratio and ruminal fluid), donor species and diet of the donor animal [
24].
In this study, the same incubation procedures were used for both evaluated techniques, aiming to minimize the sources of variation that affect in vitro gas production measurement. The results obtained showed that the estimate of the kinetic parameters of gas production from the fermentation of fiber carbohydrates (Vf2) after 72 h of incubation was different between the evaluated techniques, being 22% higher when evaluated using the automatic technique than when using the semiautomatic technique. However, when evaluating the “technique × diet” interaction for the total gas production estimated for up to 72 h of incubation, we observed that the effect of the technique only occurred for the low-NFC diet, with the total gas production being approximately 23% higher when evaluated using the automatic technique than when using the semiautomatic technique.
One of the factors affecting gas measurement is the high pressure of gases in the headspace of incubation flasks. Thus, according to Henry’s law, when the gas pressure accumulates in these flasks a certain proportion of gas remains dissolved in the culture medium [
3], which may lead to underestimation of gas production [
25]. In this study, the bottles of the semiautomatic system were ventilated at fixed times after each pressure reading. In addition, it is important to highlight that in the present study, the technique was modified, where the diets were weighed inside nylon bags and inserted inside the fermentation flasks, according to Menezes et al. [
16]. On the other hand, in the automatic system, ventilation of the flasks occurred when the pressure in the headspace reached a limit of 5 psi (34.47 kPa). This pressure threshold was much higher than those used by other authors (6.8 kPa) [
11] in automated systems. However, it has been suggested that it is only when the pressure in the headspace exceeds 7 psi (48 kPa) that microbial activity can be disturbed [
3], which can decrease the fermentation of carbohydrates and, consequently, the production of gas.
Another factor that could have affected gas production is the headspace is the volume ratio of the incubation medium. In the automatic system (ANKOM
RF system), this ratio was 2.1:1, whereas in the pressure transducer system (semiautomatic) it was 0.6:1. Thus, the lower gas production in the automatic system than in the semiautomatic system was expected given that large surface areas allow for greater gas exchange between phases than small surface areas [
26], which increases the solubility of gases, mainly CO
2, into the incubation medium [
27], a fact not observed in the present study.
It is worth mentioning that the automatic system used in the present study (ANKOM
RF system) allows for the detection of small pressure changes in the headspace of closed bottles with high frequency, as it is equipped with an automatic ventilation system that allows for the maintenance of low pressure levels inside the bottle. In addition, the valves are opened very quickly (250 ms) to prevent air from entering [
17]. On the other hand, during the pressure reading in the semiautomatic system, the needles remain inserted in the rubber caps until the complete pressure reading of all vials, which certainly results in gas losses during this period. Thus, the high sensitivity of the automatic system, associated with gas losses during pressure reading in the semiautomatic system, may have contributed to the greater production of gas in the automatic system.
Although the total gas production was lower in the semiautomatic system than in the automatic system, the cumulative gas production profiles showed that the gas production data acquired with both techniques fitted well with the mathematical logistic model of Schofield et al. [
18]. Thus, as seen in
Figure 2C, the gas production profiles showed an initial phase with nonexistent or slow gas production, an exponential phase of rapid gas production and a third asymptotic phase, where gas production was reduced. In addition, the dispersion diagrams in
Figure 2D–F show that the gas production of both techniques are strongly and positively correlated.
The estimated colonization time or lag phase (L) was not affected by the technique, with an average value of 3.81 h. The lag phase represents the first phase of the gas production curve, which explains the latency time of hydration, fixation and colonization of the insoluble substrate by ruminal microorganisms [
28]. Factors such as the type of substrate available, particle size, roughage:concentrate ratio and dilution of ruminal liquid in the incubation medium can affect the colonization time, mainly because it compromises microbial activity [
29]. Thus, the results obtained for this variable are in line with what was expected, given that the same parameters were used for both techniques.
Dry matter and organic matter degradability were reduced by 3.7 and 3.2%, respectively, when evaluated using the automatic technique. In addition, crude protein degradability was reduced by 3.0 and 7.2% in the low- and high-NFC diets, respectively, when evaluated using the automatic technique. Most of the gas produced was the result of the fermentation of carbohydrates to acetate, propionate and butyrate [
30], with a low contribution of gas production from protein degradation and a negligible amount of gas production from fat degradation [
31]. Thus, it is possible that this slight reduction in protein degradability was not sufficient to cause a change in gas production results.
The gas production results of both techniques showed a high correlation, demonstrating their potential for the nutritional assessment of food. It is important to highlight that despite being very sensitive and accurate, the high initial cost and the high need for system maintenance limits the use of automated gas production measurement techniques in many laboratories. Difficulties in maintaining the fermentation modules were observed in this study. In addition, data from 3 of the 24 modules used in the tests (12.5%) had to be discarded due to gas leaks in the system. In addition to evaluating gas production using the ANKOM
RF system, Cornou et al. [
11] reported the same difficulties observed in this study.
Total gas production (Vt) estimation showed that a high-NFC diet produced 24.5% more gas than a low-NFC diet. In addition, the production of gas from the fermentation of NFCs (Vf1) was 22.3% higher with a low-NFC diet than with a high-NFC diet and the gas from FCs was approximately 30% higher. Despite the considerable increase in the volume of gas produced, gas production rates did not differ between the two diets.
In high-NFC diets, gas production is high due to the relatively high availability of fast-fermenting carbohydrates [
32]. Assessing the use of different sources of carbohydrates associated with urea, Santos et al. [
33] observed a greater volume of gas when using cassava as a source of carbohydrates in the diet, a fact that was associated with its relatively high NFC content.
Due to the higher proportion of NFCs in the high-NFC diet than in the low-NFC diet, the DM, OM and CP degradability was 15.36, 16.42 and 3.17% higher, respectively.
The automatic and semiautomatic gas production measurement techniques similarly estimated the kinetic parameters and the profiles of total gas production, demonstrating the potential of different techniques for assessing the nutritional value of diets with different proportions of nonfiber carbohydrates.

 ,
, 


