Abstract
The goal of this study was to improve resource use efficiency in agricultural systems and agro-based industries, reduce wastes that go to landfills and incinerators, and consequently, improve the economics of 2,3-butanediol (2,3-BD) production. This study evaluated the feasibility of 2,3-BD production by replacing the mineral nutrients, and buffers with anaerobic digestate (ADE), poultry-litter (PLBC)- and forage-sorghum (FSBC)-derived biochars. Fermentation media formulations with ADE and 5–20 g/L PLBC or FSBC were evaluated for 2,3-BD production using Paenibacillus polymyxa as a biocatalyst. An optimized medium containing nutrients and buffers served as control. While 2,3-BD production in the ADE cultures was 0.5-fold of the maximum generated in the control cultures, 2,3-BD produced in the PLBC and FSBC cultures were ~1.3-fold more than the control (33.6 g/L). Cost analysis showed that ADE and biochar can replace mineral nutrients and buffers in the medium with the potential to make bio-based 2,3-BD production profitably feasible.
1. Introduction
Corn, soybeans, wheat, cotton, barley, oats, and hay are major agricultural products in the United States. These crops are typically grown for food and livestock feed production except for cotton that is commonly grown to produce textile materials and cosmetics. Interestingly, about 40% of food produced annually in the U.S. goes to landfills, and this is equivalent to a loss of $165 billion [1]. Meanwhile, the livestock population in the USA is estimated at 94 million cattle, 7.8 million sheep and goats, 518 million chickens, 224 million turkeys, and 77 million pigs (National Agricultural Statistics Service, Agricultural Statistics Board, United States Department of Agriculture). Although livestock are particularly important to humans as they can convert readily available vegetation into high-quality protein products, such as milk and meat for human consumption, they are responsible for approximately 12% of global anthropogenic greenhouse gas emissions [2]. In fact, the US Department of Agriculture estimates that livestock generate more than 450 million tons of manure annually. While human waste is strictly treated by the municipal sewer systems, livestock waste is stored in open ponds or lagoons, and subsequently applied to farm fields as fertilizer. It is, therefore, not surprising that livestock produce approximately 7.1 gigatons of CO2-equivalent greenhouse gas emissions globally per year, which is 14.5% of all human-induced greenhouse gas emissions [3]. Against this backdrop, repurposing agricultural wastes as nutrients in fermentative production of fuels and feedstock chemicals such as 2,3-butanediol (2,3-BD) is a potential approach to transforming industrial and societal systems toward resource conservation, improved recovery, and reuse of nutrients from domestic, agricultural, or industrial waste streams. 2,3-BD is a feedstock chemical produced commercially via cracking of petroleum-derived hydrocarbons such as butenes [4,5]. It has a wide range of applications such as an anti-freeze with −60 °C freezing point, jet fuel, ‘octane booster’ in gasoline, flavoring agent in food processing, an ingredient in cosmetics, personal care products, and pharmaceuticals [4,6]. The other industrial applications of 2,3-BD include the production of its dehydration products; 1,3-butadiene (1,3-BD; used as a monomer for producing synthetic rubber) and methyl ethyl ketone (MEK) used as an organic solvent for making lacquers, resins, and paints [5,7,8]. Given the wide variety of important downstream chemicals from 2,3-BD, it is imperative to find alternatives to petroleum-derived 2,3-BD. This is because 2,3-BD production from petroleum is not sustainable long term, because crude oil supply is finite [5]. In addition, commercial 2,3-BD production from petroleum has negative environmental impacts like increment of atmospheric carbon footprint vis à vis climate change [5]. Microbial production of 2,3-BD is a sustainable and environmentally friendly method of ensuring the supply of 2,3-BD and its downstream products. However, the high cost of biobased 2,3-BD production is the major factor impacting the global 2,3-BD market [9]. Commercialization of biobased 2,3-BD production is hampered by high production cost mainly due to costs of nutrients (including buffers and minerals) used in the fermentation process [10,11].
Over 30% of the overall cost of 2,3-BD produced via fermentation stems from the cost of mineral nutrients, organic nitrogen, and buffers [11]. Therefore, finding low-cost alternatives to the minerals and buffers involved in 2,3-BD production will greatly improve the economics of fermentative 2,3-BD production. For instance, anaerobic digestate (ADE) is the waste generated following anaerobic digestion (AD) of municipal solid wastes (MSW), food processing and agricultural wastes, and manure leading to the production of biogas [12]. The resulting ADE, which is rich in ammonia and phosphorus, poses a significant threat to the environment if it is not properly managed [12,13,14]. Likewise, biochars derived through pyrolysis or gasification of agricultural residues or wastes are rich in micro- and macro-nutrients with desirable properties which include pH buffering capacity, alkalinity, ability to exchange cations, and the presence of functional sidechains such as phosphine oxides, carboxylate (RCOO−) and hydroxyl (-OH) groups [15,16,17]. In this study, we sought to minimize the cost of biological 2,3-BD production by Paenibacillus polymyxa using agricultural wastes and residues as alternative sources of nutrients and fermentation aids. A process simulation and economic analysis for a facility producing 41,000 MT (~11 × 106 gallons) of 2,3-BD per year was also performed for several scenarios with and without ADE and biochar supplementation.
2. Materials and Methods
2.1. Microorganism and Culture Conditions
Paenibacillus polymyxa DSM 365 (hereafter referred to as P. polymyxa) used in this study was purchased from the German Collection of Microorganisms and Cell Culture, Braunschweig, Germany (DSMZ—Deutsche Sammlung von Mikroorganismen und Zellkulturen). Medium composition and preparation, reactivation of the lyophilized stock of P. polymyxa and preparation of preculture for the 2,3-BD fermentation were conducted as described previously [8].
2.2. 2,3-Butanediol Fermentation with Anaerobic Digestate Supplementation
The ADE used in this study was prepared, filter-sterilized, and stored as previously described [12]. The total nitrogen and phosphorus content of the ADE ranged from 1000 to 2000 mg/L, and 2500 to 3000 mg/L, respectively [12]. Fermentations were conducted using assorted media with different concentrations of ADE relative to relevant controls (Ctrl) as depicted in Table 1. All fermentations were performed in triplicate (n = 3) in 150-mL screw-capped Pyrex bottles containing 50 mL broth. The fermentation conditions tested are labeled A-D (Table 1). The Ctrl medium was a previously optimized 2,3-BD fermentation medium [18] against which various fermentation media containing 0–100% (v/v) ADE without supplementation of standard minerals present in the Ctrl medium (except for MgSO4 and trace element solution) were tested (Table 1, treatment A). All treatments contained ~115 g/L glucose. The glucose stock solution and other medium components were prepared separately and sterilized at 121 °C for 15 min. Subsequently, the fer–mentation medium for each treatment was prepared aseptically with presterilized medium component stock solutions after cooling to 50 °C. For the 100% ADE treatment, glucose was sterilized in bottles followed by the addition of ADE. The pH of all the media was adjusted to ~6.6 (except where stated otherwise) with 2 M NaOH or 1 M HCl. Fermentation media were inoculated with 10% (v/v) of the preculture and incubated in a Innova™ 4000 Shaker Incubator (New Brunswick Scientific, Waltham, MA, USA) at 35 °C and 200 rpm. Samples (2 mL) from each culture treatment were collected at 0 h and 12-hourly and were analyzed for growth, and products (2,3-BD, ethanol, and exopolysaccharides).

Table 1.
Compositions of treatments A, B, C, and D used in the 2,3-butanediol fermentation.
2.3. 2,3-Butanediol Fermentation in Media Containing Biochar
The feasibility of replacing minerals and buffer components with biochar in 2,3-BD fermentation was also evaluated (Table 1, treatment B). The biochar was prepared from forage sorghum (Sorghum spp.; FSBC) and poultry litter (PLBC). FSBC was produced in the Oklahoma State University Gasification Laboratory where forage sorghum was gasified at 700–800 °C in a fluidized-bed gasifier, whereas PLBC was produced through slow pyrolysis of poultry litter with steam at 498 °C and 108 kPa using Eprida Technologies (Marietta, GA, USA).
The treatment cultures comprised Ctrl A (optimized fermentation medium), Ctrl B (Ctrl deficient in minerals and buffer), PLBC or FSBC (5, 10 and 20 g/L) as shown in Table 1. Treatment B media contained ~115 g/L glucose supplemented with organic nitrogen sources (5 g/L yeast extract and 3.5 g/L tryptone) and trace element solution. All fermentations were performed in 150-mL screw-capped Pyrex bottles with 50 mL working volume in triplicate (n = 3) as described in Section 2.2.
2.4. 2,3-Butanediol Fermentation in Media with Combination of ADE and Biochar
The practicability of replacing mineral nutrients, organic nitrogen, and buffer components with a combination of ADE (to replace organic nitrogen) and biochar (to replace minerals and buffer) in 2,3-BD fermentation was evaluated using treatment C (Table 1, treatment C). Fermentation media in treatment C contained ~115 g/L glucose in six treatment cultures (Ctrl A, Ctrl B, ADE + PLBC, ADE + FSBC, PLBC and FSBC) as shown in Table 1 (treatment C). Ctrl A contained standard nutrient components (Table 1B). Ctrl B contained only glucose and trace element solution [8], hence was deficient in vital mineral nutrients and organic nitrogen (Table 1B), whereas ADE + PLBC and ADE + FSBC contained 75% (v/v) ADE and 5 g/L PLBC or 10 g/L FSBC, respectively. Additionally, media containing 5 g/L PLBC and 10 g/L FSBC were tested. The fermentations were conducted in 150-mL screw-capped Pyrex bottles containing 50 mL working volume in triplicate (n = 3) performed as described in Section 2.2.
2.5. 2,3-Butanediol Fermentation in Media with Both ADE and Biochar and Organic Nitrogen Supplementation
The effect of supplementing ADE + PLBC and ADE + FSBC cultures with 0%, 12.5%, 25% and 50% organic nitrogen sources on 2,3-BD production was tested (Table 1, treatment D). The organic nitrogen sources (5 g/L yeast extract and 3.5 g/L tryptone) used in the Ctrl medium were considered as 100% organic nitrogen. As shown in Table 1, fermentations were conducted using different media referred to treatments A to D. Treatment D contained ~115 g/L glucose in eight treatment cultures (Ctrl A, Ctrl B, ADE + PLBC + 12.5% N, ADE + PLBC + 25% N, ADE + PLBC + 50% N, ADE + FSBC + 12.5% N, ADE + FSBC + 25% N and ADE + FSBC + 50% N). The complete media compositions are shown in Table 1 (treatment D). Ctrl A contained standard nutrient components, whereas Ctrl B contained glucose and trace element solution while being deficient in organic nitrogen and minerals. Treatments ADE + PLBC + 12.5% N, ADE + PLBC + 25% N, and ADE + PLBC + 50% N contained 75% (v/v) ADE and 5 g/L PLBC with 12.5%, 25% and 50% organic nitrogen, respectively. In addition, the treatments ADE + FSBC + 12.5% N, ADE + FSBC + 25% N, and ADE + FSBC + 50% N contained 75% (v/v) ADE and 10 g/L FSBC with 12.5%, 25% and 50% organic nitrogen supplementation, respectively. The fermentations were conducted in 150-mL screw-capped Pyrex bottles containing 50 mL working volume in triplicate (n = 3) performed as described in Section 2.2.
2.6. Analytical Methods and Calculations
Cell growth was determined by monitoring optical density (OD600nm) of P. polymyxa cultures in a DU® 800 Spectrophotometer (Beckman Coulter Inc., Brea, CA, USA). The growth of P. polymyxa in cultures containing biochar was determined by a protein assay method [19] and was correlated with a pre-determined optical density (OD600)—protein concentration standard curve as described previously [16]. 2,3-BD and ethanol concentrations were quantified using a 7890A Agilent gas chromatograph (Agilent Technologies Inc., Santa Clara, CA, USA) as described previously [4]. Exopolysaccharides were quantified by ethanol-precipitation and phenol-sulfuric acid methods as previously described [4]. The concentration of residual glucose was determined using the Waters 2796 Bioseparations Module HPLC (Waters Corporation, Mildford, MA, USA) as previously described [4,20]. Except for N, the concentrations of metallic and non-metallic nutrients (Al, B, Ba, Ca, Co, Cu, Fe, K, Mg, Mn, Mo, Na, Ni, P, S, Se, Si, Sr, Ti, and Zn) were measured at 0 h and at the end of fermentation using Agilent 5110 Inductively Coupled Plasma-Optical Emission Spectrometer (ICP-OES; Agilent Technologies Inc., Wilmington, DE, USA) as previously described [12]. The concentrations of NH4-N and NO3−/NO2−N were determined using Latchat Quikchem 8500 Flow Injection Analyzer (FIA; Hach Company, Loveland, CO, USA) as previously described [12]. The 2,3-BD yield [Equation (1)] and productivity [Equation (2)] were calculated using the equations below:
2,3-BD yield (g/g) = [Maximum 2,3-BD produced]/[Total amount of glucose consumed]
2,3-BD productivity (g/L/h) = [Maximum 2,3-BD produced (g/L)]/[Time (h)]
2.7. Process Design and Economic Evaluation
To evaluate economic feasibility of replacing organic nitrogen, mineral nutrients, and buffers in 2,3-BD production with agricultural waste derived nutrients, process models were designed for six different 2,3-BD production scenarios with P. polymyxa using different media including optimized medium (Ctrl A) relative to media containing 5 g/L FSBC + organic nitrogen (scenario I), 5 g/L PLBC + organic nitrogen (scenario II), 75% ADE + 10 g/L FSBC (scenario III), 75% ADE + 10 g/L FSBC + 12.5% organic nitrogen (scenario IV), and 75% ADE only (scenario V) [Table 2]). Techno-economic analysis was conducted using SuperPro Designer® in batch mode (v12, Intelligen Inc., Scotch Plains, NJ, USA). The considered plant production capacity was 41,000 MT (~11 × 106 gallons) 2,3-BD per year. The information used in the analysis was taken from the experimental data in Section 2.2, Section 2.3, Section 2.4 and Section 2.5, and the material costs, and other fiscal variables were obtained from the manufacturer websites and the literature (Table 3; [16,21,22,23,24]).
Table 2.
Production scenarios used for process design.
Table 3.
Prices of raw materials, feedstocks, and consumables considered in the cost analysis of the 2,3-BD production models.
Distillation cost estimation was done by incorporating a single-step batch distillation vessel into the process. The purchase, facility-dependent and utility costs of this distillation vessel were derived from the built-in cost model of the SuperPro Designer. The distillation process was adjusted based on the volatility data of the reference component (99 wt.% 2,3-BD) and was performed using the built-in design specification function and the thermodynamic model. The feed composition considered for the distillation was obtained from the fermentation broth. Energy requirements of each production scenarios (I–V, and control) varied based on the water content of the fermentation broth feed. The distillation column pressure was set at 101.3 kPa [30] while the process time for each scenario was calculated using inbuilt software models based on the feed flow of each scenario. Subsequently, 2,3-BD production cost and a cost–benefit analysis of the control and five production scenarios were then evaluated.
2.8. Statistical Analysis
Analysis of variance (ANOVA) using Dunnett’s method for pairwise comparisons between controls and treatments was conducted using Minitab 19 (Minitab Inc., State College, PA, USA). Maximum growth, 2,3-BD, ethanol, and acetoin concentrations, element/metal concentrations, 2,3-BD yields, and productivities were analyzed at 95% confidence interval and treatments with a p < 0.05 were considered significant.
3. Results and Discussion
3.1. 2,3-Butanediol Fermentation in Media with Anaerobic Digestion Effluent
As shown in Figure 1, P. polymyxa cultures containing 75% (v/v) ADE showed higher growth profile (OD600 of 2.87) relative to all the other ADE concentrations although the overall growth of P. polymyxa in ADE was at least 2.6-fold lower (p < 0.05) than the growth in the Ctrl cultures (Figure 1). Elemental/metal analyses of ADE showed that the ADE used in this study contained Ca, Co, Mg, Cu, Fe, and P, which appeared to promote the growth of P. polymyxa and 2,3-BD production (Figure 2). Ca, Mg, Cu and Fe are important cofactors previously shown to increase the activity of enzymes required for P. polymyxa growth and 2,3-BD production [4,31,32]. However, P. polymyxa cultures supplemented with 25–100% (v/v) ADE also contained Al, Ba, and Ni (Figure 2). The presence of Ni in the ADE cultures may have accounted for the poor growth of P. polymyxa, relative to the Ctrl cultures in which Ni was not detected (Figure 2). Although, P. polymyxa has a robust capacity for adsorbing heavy metals, the presence of Ni in the environment has been previously reported to inhibit the growth of microorganisms [33]. In addition, inhibitor analysis indicated that the ADE cultures contained up to 82 mg/L of total phenolic compounds, which are toxic to microorganisms at very low concentrations [5]. The concentrations of other elements in ADE such as B, K, Mn, Mo, Na, S, Se, Si, Sr, Ti, and Zn are shown in E-supplementary data (Figure S1). P. polymyxa cultures supplemented with different concentrations of ADE, however, produced 6.6–16.3 g/L of 2,3-BD (Table 4), which were 51–273% (p < 0.05) more than that in the 0% (v/v) ADE cultures (Table 4, Figure 1) but only 20–50% (p < 0.05) of the final 2,3-BD titer in the Ctrl cultures (Figure 1). Notably, 75% (v/v) ADE appeared to contain sufficient nutrients relative to the other ADE cultures, having accumulated the highest 2,3-BD titer (Table 4, Figure 1). In addition, except for 100% (v/v) ADE which produced 1.1-fold less 2,3-BD compared to 75% (v/v), 2,3-BD production increased in a concentration-dependent manner over the course of fermentation (Table 4). ADE cultures accumulated at least 3.8-fold (p < 0.05) less ethanol than in the Ctrl cultures (Table 4 and Figure 1), which was due to the low cell biomass in ADE cultures.
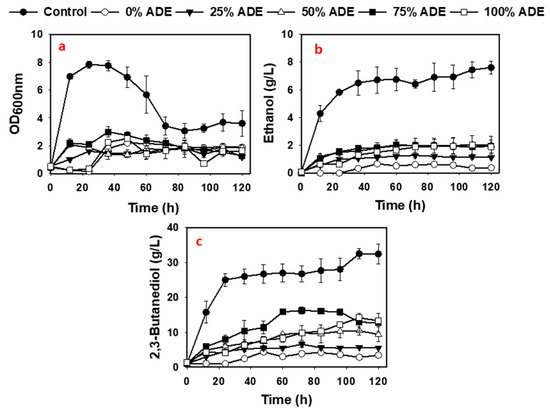
Figure 1.
Fermentation profiles of 0–100% (v/v) ADE cultures of P. polymyxa (a–c).
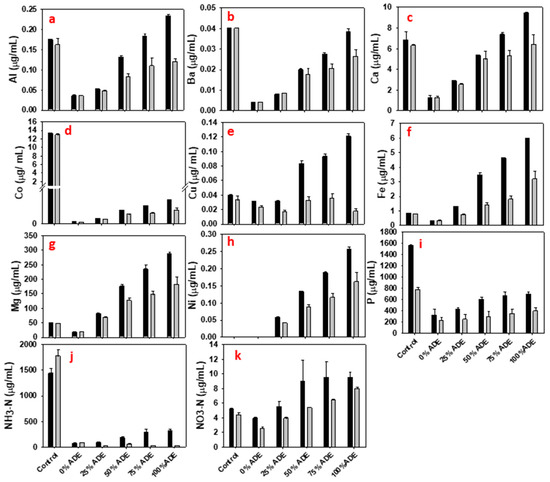
Figure 2.
Concentrations of aluminum, barium, calcium, cobalt, copper, iron, magnesium, nickel, phosphorus, ammonia, and nitrate (a–k) in ADE cultures of P. polymyxa at 0 h (black color) and at the end of fermentation (gray color).
Table 4.
Fermentation parameters of P. polymyxa grown in treatment A media containing ~115 g/L glucose supplemented with anaerobic digestion effluent (ADE).
Further, in the 25%, 50%, 75% and 100% (v/v) ADE cultures supplemented with ~115 g/L glucose, 27.9, 42.1, 57.6, and 59.5 g/L of glucose, respectively, were utilized (Table 4). The glucose consumed in the 25%, 50%, 75% and 100% (v/v) ADE cultures culminated in 2,3-BD yields that were 1.25-, 1.41-, 1.15- and 1.29-fold, respectively, lower than the yield calculated for Ctrl cultures (Table 4). The 2,3-BD productivity in the 25%, 50%, 75% and 100% (v/v) ADE cultures were 3.00-, 3.00-, 1.30-, and 2.31-fold, respectively, smaller than in the Ctrl cultures (Table 4). However, the 2,3-BD yields in the 25%, 50%, 75% and 100% (v/v) ADE cultures increased 1.25-, 1.10-, 1.35- and 1.20-fold (p < 0.05), respectively, compared to 0% (v/v) ADE cultures (Table 4). Similarly, the 2,3-BD productivity increased 2.00-, 2.00-, 4.60-, and 2.6-fold (p < 0.05) in the 25%, 50%, 75% and 100% (v/v) ADE cultures, respectively, relative to the 0% (v/v) ADE cultures (Table 4). The diminished 2,3-BD yield observed in the ADE cultures relative to the Ctrl suggests that P. polymyxa diverted more substrate to the synthesis of exopolysaccharides (EPS). EPS production by P. polymyxa is well characterized [4,34,35]. Indeed, P. polymyxa produced 1.6–3.2-fold more EPS in ADE relative to the Ctrl medium (Table 4). The increased production of EPS in the ADE cultures may have accounted for the observed increase in the viscosity of the growth medium relative to the Ctrl cultures during 2,3-BD fermentation.
Although the Ctrl cultures contained similar or higher amounts of Al, Ba, and Co, which results from the added nutrients and buffer when compared to the ADE cultures, the EPS accumulated in the ADE cultures may have been triggered by relatively higher concentrations of Mg and heavy metals such as Cu, Fe, and Ni in the ADE (Figure 1). More specifically, at the start of fermentation (0 h) the concentrations of Cu, Fe, and Mg in the 50–100% (v/v) ADE cultures were at least 2.1-, 4.1-, and 3.5-fold, respectively, higher than those in the Ctrl cultures (Figure 2). Ni concentration in the ADE cultures was up to 0.26 µg/mL (Figure 2). Remarkably, concentrations of these metals decreased up to 6.8-fold (p < 0.05; Figure 2) in the ADE cultures at the end of fermentation (120 h). This indicates that P. polymyxa removed Cu, Fe, Mg, and Ni from ADE during fermentation. It has been demonstrated that the presence of divalent metals especially Cu trigger the production of EPS in P. polymyxa [36,37]. In addition, it was reported that the EPS produced by P. polymyxa has a high affinity for Cu [37]. Interestingly, Cu showed the highest fold reduction in the 75% and 100% (v/v) ADE cultures (2.7- and 6.8-fold, respectively; Figure 2). Reductions in the concentrations of these metals may be attributed to significant increases (p < 0.05) in EPS production in the ADE cultures. Overall, the degree of metal sequestration from ADE by P. polymyxa underscores the potential of this microorganism for bioremediation of environmental wastes.
The ammonia content of ADE decreased at least 4.1-fold at the end of fermentation, whereas the ammonia in the 0% ADE cultures (negative control) increased ~1.2-fold (Figure 2). For the Ctrl cultures, the ammonia content increased 1.3-fold relative to the initial concentration (Figure 2). However, it was interesting to note that ADE cultures did not accumulate ammonia as the ammonia concentration decreased after fermentation. The increase in the ammonia content of the Ctrl and 0% (v/v) ADE cultures suggests that P. polymyxa may have fixed atmospheric nitrogen which resulted in slightly higher ammonia content at the end of fermentation. Different studies have indicated that P. polymyxa possesses nitrogenases with the capability to fix nitrogen [38,39]. In fact, recently published annotated whole genome sequence of P. polymyxa uncovered the presence of the molecular repertoire for nitrogen fixation in this microorganism [40].
The nitrate content of the ADE and the Ctrl cultures decreased after fermentation, indicating that P. polymyxa may possess the capability to uptake nitrate from the environment. Clearly, the nitrate content decreased ~1.4-, 1.7-, 1.5- and 1.2-fold, respectively in the 25%, 50%, 75% and 100% (v/v) ADE cultures (Figure 2). Additionally, nitrate concentration in the Ctrl and 0% ADE cultures decreased ~1.2- and 1.6-fold, respectively, relative to their starting concentrations (Figure 2). This is not surprising because P. polymyxa possesses nitrate and nitrite reductases which are encoded by the narGHJI and nirBD gene clusters, respectively, and these enzymes are involved in the dissimilatory reduction of nitrate via nitrite to ammonia [41]. Collectively, these results indicate that ADE contains non-carbohydrate nutrients that can support the growth of P. polymyxa and 2,3-BD production when supplied at the appropriate non-toxic concentration.
3.2. 2,3-Butanediol Fermentation in Media Containing Biochar
The PLBC and FSBC supported the growth of P. polymyxa at all biochar concentrations tested (Table 5 and Figure 3). However, growth of P. polymyxa in the biochar supplemented media was slightly lower compared to the Ctrl A cultures. Although the growth of P. polymyxa was relatively low in the biochar media compared to the Ctrl A medium, 2,3-BD production in the biochar (except for 10 and 20 g/L PLBC) cultures was more efficient (Table 5 and Figure 3). As shown in Table 5, replacing the mineral components of the fermentation medium with PLBC and FSBC resulted in at least a 1.2-and 1.4-fold decrease, respectively, in the overall growth of P. polymyxa relative to the Ctrl A cultures. Conversely, the addition of 5 g/L PLBC and 10 g/L FSBC enhanced the growth of P. polymyxa by ~1.4- and 1.2-fold, respectively, relative to the Ctrl B cultures (Table 5).
Table 5.
Fermentation parameters of P. polymyxa grown in Group B media containing ~115 g/L glucose supplemented with poultry liter biochar (PLBC) and forage sorghum biochar (FSBC).
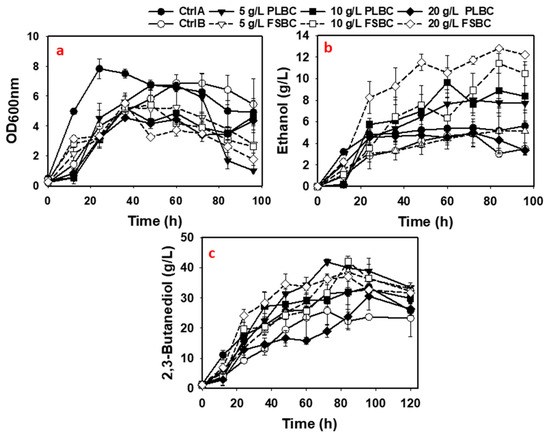
Figure 3.
The fermentation profiles of P. polymyxa cultures supplemented with 5–20 g/L PLBC and 5–20 g/L FSBC (a–c).
Fermentations containing 5 g/L PLBC, and 5–20 g/L FSBC accumulated 37.1–42.1 g/L of 2,3-BD that correspond to ~1.10–1.25-fold increase in 2,3-BD titer relative to the 33.6 g/L 2,3-BD accumulated in the Ctrl A cultures (Table 5). Similarly, relative to the Ctrl B cultures, addition of 5, 10 and 20 g/L PLBC, and 5, 10 and 20 g/L FSBC to fermentation medium improved P. polymyxa efficiency to make 2,3-BD 1.62-, 1.27- and 1.18-fold, and 1.49-, 1.63- and 1.43-fold, respectively (Table 5). The 2,3-BD production profiles of the two tested biochars—PLBC and FSBC—differ remarkably (Table 5 and Figure 3). While a 1.25-fold improvement in 2,3-BD accumulation was observed with the 5 g/L PLBC when compared to the Ctrl A cultures, further increase in the concentration of PLBC to 10 and 20 g/L resulted in 1.02- and 1.10-fold reduction in 2,3-BD production, respectively (Table 5). This shows that the addition of 10 and 20 g/L PLBC to the fermentation medium may have resulted in the release of excess minerals into the fermentation medium, which perhaps resulted in increased stress on P. polymyxa, and hence lower 2,3-BD production. PLBC has higher concentrations of elements when compared to FSBC (Figure 4).
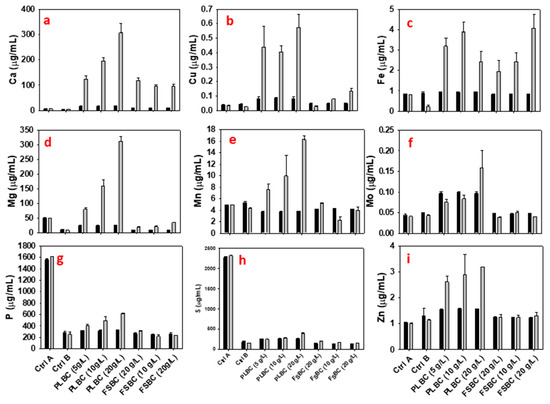
Figure 4.
Concentrations of calcium, copper, iron, magnesium, manganese, molybdenum, phosphorus, sulfur, and zinc (a–i) in PLBC and FSBC cultures of P. polymyxa at 0 h (black color) and at the end of fermentation (gray color).
Additionally, PLBC has a higher buffering capacity than FSBC and tends to slow the drop in pH, which might explain why the higher PLBC concentrations reduced 2,3-BD production. Further, as depicted in Table 5, 110.6, 94.6, and 86.0 g/L glucose were utilized by P. polymyxa in the 5, 10 and 20 g/L PLBC cultures, respectively. The high glucose consumption by P. polymyxa in the 5 and 10 g/L PLBC cultures resulted in 2,3-BD yield and productivity that were 1.15- and 1.03-fold, and 1.57- and 1.03-fold, respectively, more than those observed in the Ctrl A cultures (Table 5). The 2,3-BD yield in the 20 g/L PLBC-supplemented cultures was 1.09-fold more than that in the Ctrl A cultures (Table 5). For the FSBC cultures, 0.38, 0.37 and 0.32 g/g 2,3-BD yields were obtained in the 5, 10 and 20 g/L FSBC cultures, respectively (Table 5). These 2,3-BD yields in the FSBC cultures were up to 1.15-fold greater than that in the Ctrl A cultures. In addition, 2,3-BD productivity was at least ~1.4-fold greater in the FSBC than in the Ctrl A cultures (Table 5).
Improvements in the 2,3-BD titer, yield, and productivity in PLBC- and FSBC-supplemented cultures can be attributed to the minerals contained in the biochars. Figure 4 shows that PLBC and FSBC contain a plethora of elements with PLBC having the higher elemental content. In fact, PLBC contains up to 3.2-, 8.8-, 1.7-, 9.1-, 4.4-, 3.2-, 2.4-, 2.7-, and 2.4-fold higher concentrations of Ca, Cu, Fe, Mg, Mn, Mo, P, S, and Zn, respectively, than FSBC (Figure 4). The concentrations of other elements in PLBC and FSBC are shown in E-supplementary data (Figure S2). Evidently, the mineral content of 5 g/L PLBC appears to be sufficient to support growth and 2,3-BD production by P. polymyxa (Figure 4). Indeed, the initial concentrations of Ca, Cu, Fe, Mg, Mn, Mo, P, S, and Zn in both PLBC and FSBC cultures were relatively low (0 h of fermentation) compared to Ctrl A cultures. However, as fermentation progressed these minerals were leached out of the biochar due to acidification of the medium [15] and thus, became available to P. polymyxa. This is reflected in the net increase in the mineral contents of the biochar-supplemented cultures at the end of fermentation (Figure 4). The elements in biochar have been shown to support the growth and metabolism of fermenting microorganisms [15].
3.3. 2,3-Butanediol Fermentation in Media with Combination of ADE and Biochar
The 75% (v/v) ADE was chosen for further study because it produced more 2,3-BD than other ADE concentrations (Table 4). Supplementation of the ADE media with 5 g/L PLBC and 10 g/L FSBC significantly improved 2,3-BD production when compared to the Ctrl A cultures (Table 6 and Figure 5c). Perhaps, the low concentrations of elements in ADE compared to biochar-supplemented cultures may account for the reduced growth and low 2,3-BD production. Notably, fermentations involving biochar were supplemented with full strength yeast extract and tryptone (i.e., 100% organic nitrogen: Table 1, treatment B). These cultures, however, accumulated less biomass relative to the Ctrl A cultures, possibly due to low concentrations of P and S in the biochars (Figure 4). Considering that ADE contains more than 300 mg/L ammonia N (Figure 2), and biochar contains higher contents of minerals, we reasoned that the combination of biochar and ADE could provide sufficient nitrogen and minerals necessary for 2,3-BD biosynthesis. Therefore, 75% (v/v) ADE was combined with 5 g/L PLBC or 10 g/L FSBC (Table 1, treatment C) since these levels generated the most desirable results in the independent studies (see Section 3.1 and Section 3.2). The results showed that only 18.1 and 22.4 g/L 2,3-BD were produced when 5 g/L PLBC and 10 g/L FSBC were added to 75% (v/v) ADE cultures, without the addition of yeast extract and tryptone in the medium (Table 6). These values were significantly (p < 0.05) lower when compared to the 2,3-BD accumulated in the Ctrl A cultures (Table 3 and Table 5). The low 2,3-BD titers recorded in the PLBC and FSBC cultures without yeast extract and tryptone addition attest to the limitation of organic nitrogen in the respective ADE- and biochar-based media [18,42,43]. The maximum OD600 values of P. polymyxa in the media containing 75% ADE + 5 g/L PLBC and 75% ADE + 10 g/L FSBC were 3.1 and 3.3, respectively (Table 6 and Figure 5a). In comparison with the 75% (v/v) ADE-based cultures (Table 4), addition of PLBC and FSBC did not provide any significant (p > 0.05) advantage in growth (Table 6 and Figure 5a).
Table 6.
Fermentation parameters of P. polymyxa grown in treatment C media containing ~115 g/L glucose supplemented with anaerobic digestion effluent (ADE) and poultry liter biochar (PLBC) or forage sorghum biochar (FSBC).
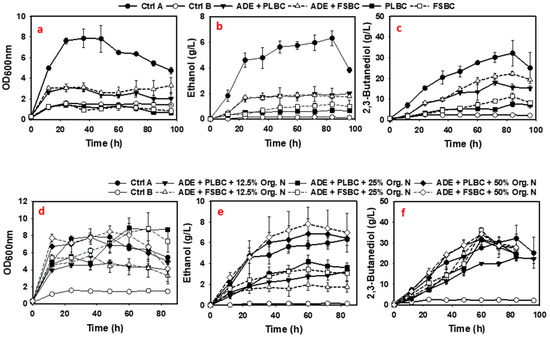
Figure 5.
Fermentation profiles of P. polymyxa cultures in 75% (v/v) ADE supplemented with 5 g/L PLBC and 10 g/L FSBC (a–c), and in 75% (v/v) ADE supplemented with biochar (5 g/L PLBC or 10 g/L FSBC) supplemented with 12.5%, 25%, and 50% organic nitrogen sources (d–f).
3.4. 2,3-Butanediol Fermentation in Media with Both ADE and Biochar and Organic Nitrogen Supplementation
Based on our estimates, the 75% (v/v) ADE could provide ~56% of the total N required for the growth of P. polymyxa and 2,3-BD production in addition to metals and elements. Therefore, additional organic nitrogen was added to the ADE + PLBC and ADE + FSBC cultures. Precisely, 12.5%, 25% and 50% of the total organic nitrogen requirement in the form of yeast extract and tryptone were added to the ADE + PLBC and ADE + FSBC media (Table 1, treatment D). Results showed that the addition of 12.5%, 25% and 50% of organic nitrogen increased the growth of P. polymyxa by ~1.5-, 2.9- and 2.5-fold, respectively, in the ADE + PLBC cultures, and ~1.7-, 2.7- and 2.6-fold, respectively, in the ADE + FSBC cultures compared to the un-supplemented cultures (Table 5 and Table 6). In addition, 2,3-BD concentrations in the ADE + PLBC cultures increased ~1.3-, 1.7- and 1.78-fold after addition of 12.5%, 25% and 50% organic nitrogen, respectively, when compared to the un-supplemented cultures (Table 5 and Table 6). The 2,3-BD titers (31.4 and 31.9 g/L) in the organic nitrogen-supplemented ADE + PLBC cultures were comparable to the 2,3-BD titer (32.2 g/L) in the Ctrl A cultures except for ADE + PLBC cultures supplemented with 12.5% organic nitrogen that accumulated only 22.9 g/L 2,3-BD (Figure 5f and Table 7). Interestingly, for the 12.5%, 25% and 50% organic nitrogen-supplemented ADE + FSBC cultures, P. polymyxa produced ~1.2-, 1.1- and 1.1-fold more 2,3-BD titer, respectively, compared to the Ctrl A cultures (Figure 5 and Table 7). Overall, these results demonstrate that addition of fractions of the standard organic nitrogen to ADE + biochar media provided sufficient N required for the growth of P. polymyxa and 2,3-BD production.
Table 7.
Fermentation parameters of P. polymyxa grown in Group D media containing ~115 g/L glucose supplemented with ADE, organic nitrogen, and poultry liter biochar (PLBC) or forage sorghum biochar (FSBC).
3.5. Cost Analysis and Economic Evaluation
Process models were developed to analyze the cost and economic implications of replacing select nutrients and minerals in the 2,3-BD production medium using P. polymyxa at industrial-scale of 41,000 MT (~11 × 106 gallons) 2,3-BD per year. The 2,3-BD concentrations used for cost estimation are from Table 4, Table 5, Table 6 and Table 7. The overall 2,3-BD production costs without 2,3-BD distillation for the positive Ctrl (Table 1, treatment C—Control A); 5 g/L FSBC + organic nitrogen (Table 1, treatment B—Scenario I); 5 g/L PLBC + organic nitrogen (Table 1, treatment B—Scenario II); ADE + biochar (75% ADE + 10 g/L FSBC in Table 1, treatment C—Scenario III); 75% ADE + 10 g/L FSBC + 12.5% organic nitrogen (Table 1, treatment D—Scenario IV); and ADE-only (75% ADE in Table 1, treatment A—Scenario V) [Table 2] were $5.96, $2.91, $2.63, $2.70, $3.26, and $3.42 per liter, respectively (Figure 6). When distillation cost was included, the overall 2,3-BD production costs per liter for the control and five different scenarios increased to $8.38, $4.14, $3.73, $4.63, $4.98, and $5.95, respectively. The overall production cost of 2,3-BD decreased with an increase in 2,3-BD concentration in the fermentation broth due to a decrease in distillation cost. An increase in 2,3-BD concentration from 16.3 to 41.9 g/L caused 2.28- and 1.6-fold reduction in the distillation and overall 2,3-BD production costs, respectively. Additionally, substituting select nutrients and minerals in the 2,3-BD production medium with ADE and biochar resulted in at least 1.41- and 1.74-fold reduction in the overall 2,3-BD production cost with and without distillation, respectively (Figure 6 and Table 8). Raw materials, facility-dependent costs, and utilities accounted for56.6–71.7%, 20.8–31.9%, and 6.5–11.1% of the total production cost ($112.9 × 10⁶—$247.6 × 10⁶) of 41,000 MT of 2,3-BD, respectively, without distillation (Table 9). With the incorporation of a single step distillation unit, raw materials, facility-dependent costs, and utilities accounted for 37.5–47.9%, 43.5–53.9%, and 7.0–9.7% of the total production cost ($159.1 × 10⁶–$346.1 × 10⁶), respectively (Figure 6 and Table 10). While the distillation cost contributed to increment of the facility-dependent and utility costs (Figure 6b and Table 10), the use of ADE and biochar in the production of 2,3-BD reduced the cost of the raw materials by at least 1.36-fold with or without distillation. Thus, scenario II containing 5 g/L PLBC had the lowest 2,3-BD production cost without distillation ($2.63; Figure 6a) and with distillation ($3.73; Figure 6b), likely due to the high 2,3-BD concentration (41.9 g/L) and yield achieved in scenario II, coupled with the reduced distillation cost. An average of 2.63 MT of glucose is expected to be utilized to produce 1 MT of 2,3-BD, that is, ~$2030 worth of glucose (0.77 $/kg glucose, Table 3) will produce 1 MT of 2,3-BD (Table 11).
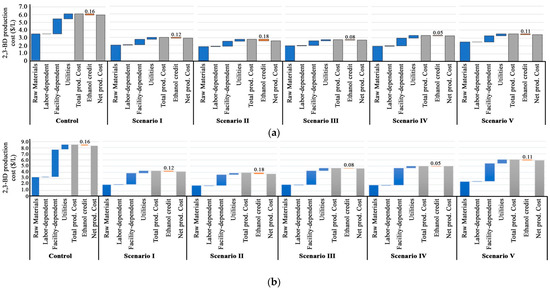
Figure 6.
2,3-BD production costs using P. polymyxa in (a) without distillation and (b) with distillation (Note: The blue bars represent itemized production costs; orange bars represent ethanol credits and gray bars represent gross production costs). Ctrl A medium (Table 1 treatment C—Control), 5 g/L FSBC + organic nitrogen (Table 1 treatment B—scenario I), 5 g/L PLBC + organic nitrogen (5-PLBC. in Table 1 treatment B—scenario II), 75% ADE + 10 g/L FSBC (Table 1 treatment C—scenario III), 75% ADE + 10 g/L FSBC + 12.5% organic N (Table 1 treatment D—scenario IV), and 75% ADE only (Table 1 treatment A—scenario V). Collectively, our data show that replacing elemental nutrients in the 2,3-BD production medium with ADE and biochar can improve 2,3-BD production and reduce the overall 2,3-BD production cost.
Table 8.
Production costs of different 2,3-BD production scenarios.
Table 9.
Production cost parameters for 2,3-BD fermentation without distillation.
Table 10.
Production cost parameters for 2,3-BD fermentation with distillation.
Table 11.
Average glucose utilization per MT of 2,3-BD produced.
Previous studies have indicated that the minimum cost of 2,3-BD production without distillation from substrates such as molasses, pure glycerol and sucrose is over $3.00/L when a discounted cash flow of 10% was considered [10,11,44]. However, these analyses were performed based on market purchase price of $0.2/kg molasses, $0.3/kg pure glycerol, and $0.25/kg sucrose [11,44], which were more than 2-fold lower than the $0.77/kg of glucose considered in this study. In the present study, the cost of 2,3-BD production without distillation ranges from $2.63 to $3.42/L, which is below the range reported in the literature, except for the control medium that had a 2,3-BD production cost of $5.96/L. The replacement of select nutrients and minerals with ADE and biochar does offset the effects of relatively expensive glucose ($0.77/kg) used in this study compared to the $0.2–$0.3/kg of the substrates used in other studies [11,44]. More work is needed to reduce the production cost of 2,3-BD given the increase to $3.73–$5.95 per liter when distillation cost was included. Consequently, a further reduction in the cost of 2,3-BD production could be achieved when agricultural residues are used as substrates.
Despite the tremendous economic potential of replacing expensive mineral nutrients and buffers in 2,3-BD production media with biochar and ADE, the economics still do not compare favorably to the commercial petrochemical cracking route. Further studies are needed to improve the economics of bio-based 2,3-BD production. For example, our data show that ADE negatively affected the growth of P. polymyxa as evidenced by the low 2,3-BD titer of all ADE-containing P. polymyxa cultures (Table 4, Table 6 and Table 7) because ADE contains high levels of phenolic compounds that have been shown to inhibit the growth of P. polymyxa [5]. Evolutionary adaptation and/or metabolic engineering tools could be used to generate ADE-tolerant P. polymyxa strains, improve 2,3-BD titers and potentially improve the economics of bio-based 2,3-BD production. Given the current volatility in petrochemical supplies and costs, the strategy presented in this study represents progress in the right direction and an economic advantage to supplementing petrochemical-derived 2,3-BD with its bio-based counterpart, thereby reducing the carbon footprint of petrochemical-derived 2,3-BD.
4. Conclusions
P. polymyxa effectively utilizes the mineral nutrients derived from ADE, PLBC and FSBC for growth and 2,3-BD production. Cost analyses indicate that replacement of buffer and minerals with 5 g/L PLBC reduced the production cost of 2,3-BD by 55.5% while replacing organic nitrogen and buffer plus minerals with 75% (v/v) ADE and 10 g/L FSBC (biochar), respectively, reduced the production cost of 2,3-BD by 40% relative to Ctrl A cultures. Reduction in 2,3-BD production cost is critical for making fermentative 2,3-BD production more competitive and profitable. The development of ADE and agricultural waste derived biochar as nutrient supplements in the production of 2,3-BD creates value for agricultural wastes and anaerobic digestion residues and serves as veritable strategy towards improving agro-based waste management and nutrient recycle.
Supplementary Materials
The following supporting information can be downloaded at: https://www.mdpi.com/article/10.3390/fermentation9010036/s1.
Author Contributions
Conceptualization, T.C.E. and C.C.O.; methodology, C.C.O., T.C.E., A.D. and I.I.; software, C.C.O. and A.D.; validation, C.C.O., T.C.E. and V.C.U.; formal analysis, C.C.O. and A.D.; investigation, C.C.O., T.C.E., V.C.U., H.K.A. and N.Q.; resources, T.C.E., H.K.A., N.Q. and V.C.U.; data curation, C.C.O., T.C.E. and V.C.U.; writing—original draft preparation, C.C.O. and A.D.; writing—review and editing, T.C.E., C.C.O., V.C.U., H.K.A. and N.Q.; visualization, T.C.E., V.C.U. and C.C.O.; supervision, T.C.E.; project administration, T.C.E.; funding acquisition, T.C.E. and H.K.A. All authors have read and agreed to the published version of the manuscript.
Funding
This research was funded in part by the USDA NIFA Hatch grant (Project No. OHO01333), USDA NIFA Hatch grant (Project No. OKL03163) and Oklahoma Agricultural Experimental Station.
Institutional Review Board Statement
Not applicable.
Data Availability Statement
Data are contained within the article.
Acknowledgments
The authors would like to thank Ajay Kumar and Hailin Zhang from Oklahoma State University for providing the biochar used in this study, and to James Kinder for his critical review of this manuscript.
Conflicts of Interest
The authors declare no conflict of interest.
References
- Natural Resources Defense Council Report. Available online: http://www.nrdc.org/food/wasted-food.asp (accessed on 19 August 2022).
- Havlik, P.; Valin, H.; Herrero, M.; Obersteiner, M.; Schmid, E.; Rufino, M.C.; Mosnier, A.; Thornton, P.K.; Böttcher, H.; Conant, R.T.; et al. Climate change mitigation through livestock system transitions. Proc. Natl. Acad. Sci. USA 2014, 111, 3709–3714. [Google Scholar] [CrossRef] [PubMed]
- Task Force on National Greenhouse Gas Inventories. Available online: https://www.ipcc-nggip.iges.or.jp/index.html (accessed on 19 August 2022).
- Okonkwo, C.C.; Ujor, V.; Cornish, K.; Ezeji, T.C. Inactivation of the levansucrase gene in Paenibacillus polymyxa DSM 365 diminishes exopolysaccharide biosynthesis during 2,3-butanediol fermentation. Appl. Environ. Microbiol. 2020, 86, e00196-20. [Google Scholar] [CrossRef] [PubMed]
- Okonkwo, C.C.; Ujor, V.; Ezeji, T.C. Production of 2,3-butanediol from non-detoxified wheat straw hydrolysate: Impact of microbial inhibitors on Paenibacillus polymyxa DSM 365. Ind. Crops Prod. 2021, 159, 113047. [Google Scholar] [CrossRef]
- Celinska, E.; Grajek, W. Biotechnological production of 2,3-butanediol—Current state and prospects. Biotechnol. Adv. 2009, 27, 715–725. [Google Scholar] [CrossRef] [PubMed]
- Kopke, M.; Mihalcea, C.; Liew, F.M.; Tizard, J.H.; Ali, M.S.; Connolly, J.J.; Al-Sinawi, B.; Simpson, S.D. 2,3-Butanediol production by acetogenic bacteria, an alternative route to chemical synthesis, using industrial waste gas. Appl. Environ. Microbiol. 2011, 77, 5467–5475. [Google Scholar] [CrossRef] [PubMed]
- Okonkwo, C.C.; Ujor, V.; Ezeji, T.C. Investigation of relationship between 2,3-butanediol toxicity and production during growth of Paenibacillus polymyxa. New Biotechnol. 2017, 34, 23–31. [Google Scholar] [CrossRef] [PubMed]
- Transparency Market Research. 2,3-Butanediol Market (Application: Intermediate Chemicals, Plastics, Food Additives, Cosmetics, and Others [Pesticides and Anti-Freeze Agents])-Industry Analysis, Size, Share, Growth, Trends, and Forecasts, 2020–2030. 2020. Available online: www.transparencymarketresearch.com/2,3-butanediol-market.html (accessed on 22 July 2021).
- Tinoco, D.; Pateraki, C.; Koutinas, A.A.; Freire, D.M.G. Bioprocess development for 2,3-butanediol production by Paenibacillus strains. ChemBioEng Rev. 2021, 8, 44–62. [Google Scholar] [CrossRef]
- Koutinas, A.A.; Yepez, B.; Kopsahelis, N.; Freire, D.M.G.; Machado de Castro, A.; Papanikolaou, S.; Kookos, I.K. Techno-economic evaluation of a complete bioprocess for 2,3-butanediol production from renewable resources. Bioresour. Technol. 2016, 204, 55–64. [Google Scholar] [CrossRef]
- Ujor, V.C.; Okonkwo, C.C.; Rush, B.B.; McCrea, G.E.; Ezeji, T.C. Harnessing the residual nutrients in anaerobic digestate for ethanol fermentation and digestate remediation using Saccharomyces cerevisiae. Fermentation 2020, 6, 52. [Google Scholar] [CrossRef]
- Campos, J.L.; Crutchnik, D.; Franchi, O.; Pavissich, J.P.; Belmonte, M.; Pedrouso, A.; Mosquera-Corral, A.; Val del Rio, A. Nitrogen, and phosphorus recovery from anaerobically pretreated agro-wastes: A review. Front. Sustain. Food Syst. 2019, 2, 91. [Google Scholar] [CrossRef]
- Kumar, S.; Posmanik, R.; Spatari, S.; Ujor, V.C. Repurposing anaerobic digestate for economical biomanufacturing and water recovery. Appl. Microbiol. Biotechnol. 2022, 106, 1419–1434. [Google Scholar] [CrossRef] [PubMed]
- Sun, X.; Atiyeh, H.K.; Kumar, A.; Zhang, H. Enhanced ethanol production by Clostridium ragsdalei from syngas by incorporating biochar in the fermentation medium. Bioresour. Technol. 2018, 247, 291–301. [Google Scholar] [CrossRef] [PubMed]
- Sun, X.; Atiyeh, H.K.; Adesanya, Y.; Okonkwo, C.; Zhang, H.; Huhnke, R.L.; Ezeji, T. Feasibility of using biochar and mineral nutrients replacement for acetone-butanol-ethanol production from non-detoxified switchgrass hydrolysate. Bioresour. Technol. 2020, 298, 122569. [Google Scholar] [CrossRef]
- Qian, K.; Kumar, A.; Patil, K.; Bellmer, D.; Wang, D.; Yuan, W.; Huhnke, R. Effects of biomass feedstocks and gasification conditions on the physicochemical properties of char. Energies 2013, 6, 3972. [Google Scholar] [CrossRef]
- Okonkwo, C.C.; Ujor, V.; Mishra, P.K.; Ezeji, T.C. Process development for enhanced 2,3-butanediol production by Paenibacillus polymyxa DSM 365. Fermentation 2017, 3, 18. [Google Scholar] [CrossRef]
- Bradford, M.M. A rapid and selective method for the quantitation of microgram quantities of protein utilizing the principle of protein-dye binding. Anal. Biochem. 1976, 72, 248–254. [Google Scholar] [CrossRef]
- Okonkwo, C.C.; Azam, M.M.; Ezeji, T.C.; Qureshi, N. Enhancing ethanol production from cellulosic sugars using Scheffersomyces (Pichia) stipitis. Bioprocess Biosyst. Eng. 2016, 39, 1023–1032. [Google Scholar] [CrossRef]
- Adesanya, Y.; Atiyeh, H.K.; Olorunsogbon, T.; Asmita, K.; Okonkwo, C.C.; Ujor, V.C.; Shah, A.; Ezeji, T.C. Viable strategies for enhancing acetone-butanol-ethanol production from non-detoxified switchgrass hydrolysates. Bioresour. Technol. 2022, 344, 126167. [Google Scholar] [CrossRef]
- Zang, G.; Shah, A.; Wan, C. Techno-economic analysis of co-production of 2,3-butanediol, furfural, and technical lignin via biomass processing based on deep eutectic solvent pretreatment. Biofuels Bioprod. Biorefining 2020, 14, 326–343. [Google Scholar] [CrossRef]
- Kwan, T.H.; Ong, K.L.; Haque, M.A.; Kulkarni, S.; Lin, C.S.K. Biorefinery of food and beverage waste valorisation for sugar syrups production: Techno-economic assessment. Process Saf. Environ. Prot. 2019, 121, 194–208. [Google Scholar] [CrossRef]
- LPELC. Impact of Fluctuating Fertilizer Prices on Poultry Manure Nutrient Value—Livestock and Poultry Environmental Learning Community. 2019. Available online: https://lpelc.org/impact-of-fluctuating-fertilizer-prices-on-poultry-manure-nutrient-value/ (accessed on 20 November 2021).
- Superpro Database. Superpro Designer®; v12; Intelligen Inc.: Scotch Plains, NJ, USA, 2021. [Google Scholar]
- Echemi.com. Available online: https://www.echemi.com/produce/pr1703241191-ammonium-acetate.html/ (accessed on 16 July 2021).
- Eisen-Golden. Available online: https://www.eisengolden.com/storefront/index.php?route=product/product&product_id=2236&search=Potassium+phosphate (accessed on 16 July 2021).
- Cardoso, V.M.; Campani, G.; Sanos, M.P.; Silva, G.G.; Pires, M.C.; Goncalves, V.M.; Giordano, R.C.; Sargo, C.R.; Horta, A.C.L.; Zangirolami, T.C. Cost analysis based on bioreactor cultivation conditions: Production of a soluble recombinant protein using Escherichia coli BL21(DE3). Biotechnol. Rep. 2020, 26, e00441. [Google Scholar] [CrossRef] [PubMed]
- Qureshi, N.; Saha, B.; Cotta, M.; Singh, V. An economic evaluation of biological conversion of wheat straw to butanol: A biofuel. Energy Convers. Manag. 2013, 65, 456–462. [Google Scholar] [CrossRef]
- Harvianto, G.R.; Haider, J.; Hong, J.; van Duc Long, N.; Shim, J.J.; Cho, M.H.; Kim, W.K.; Lee, M. Purification of 2,3-butanediol from fermentation broth: Process development and techno-economic analysis. Biotechnol. Biofuels 2018, 11, 18. [Google Scholar] [CrossRef] [PubMed]
- Xu, G.-C.; Bian, Y.-Q.; Han, R.-Z.; Dong, J.-J.; Ni, Y. Cloning, expression, and Characterization of budC gene encoding meso-2,3-butanediol dehydrogenase from Bacillus licheniformis. Appl. Biochem. Biotechnol. 2016, 178, 604–617. [Google Scholar] [CrossRef]
- Zhang, L.; Xu, Q.; Zhan, S.; Li, Y.; Lin, H.; Sun, S.; Sha, L.; Hu, K.; Guan, X.; Shan, Y. A new NAD(H)-dependent meso-2,3-butanediol dehydrogenase from an industrially potential strain Serratia marcescens H30. Appl. Microbiol. Biotechnol. 2014, 98, 1175–1184. [Google Scholar] [CrossRef]
- Colak, F.; Olgun, A.; Atar, N.; Yazicioglu, D. Heavy metal resistances and biosorptive behaviors of Paenibacillus polymyxa: Batch and column studies. J. Ind. Eng. Chem. 2013, 19, 863–869. [Google Scholar] [CrossRef]
- Yegorenkova, I.V.; Tregubova, K.V.; Matora, L.Y.; Burygin, G.L.; Ignatov, V.V. Biofilm formation by Paenibacillus polymyxa strains differing in the production and rheological properties of their exopolysaccharides. Curr. Microbiol. 2011, 62, 1554–1559. [Google Scholar] [CrossRef]
- Wang, Y.-Q.; Huang, J.-X.; Zhou, W.-W. Isolation, characterization and cytoprotective effects against UV radiation of exopolysaccharide produced from Paenibacillus polymyxa PYQ1. J. Biosci. Bioeng. 2020, 130, 283–289. [Google Scholar] [CrossRef]
- Grinev, V.S.; Tregubova, K.V.; Anis’kov, A.A.; Sigida, E.N.; Shirokov, A.A.; Fedonenko, Y.P.; Yegorenkova, I.V. Isolation, structure, and potential biotechnological applications of the exopolysaccharide from Paenibacillus polymyxa 92. Carbohydr. Polym. 2020, 232, 115780. [Google Scholar] [CrossRef]
- Acosta, M.P.; Valdman, E.; Leite, S.; Battaglini, F.; Ruzal, S. Biosorption of copper by Paenibacillus polymyxa cells and their exopolysaccharide. World J. Microbiol. Biotechnol. 2005, 21, 1157–1163. [Google Scholar] [CrossRef]
- Puri, A.; Padda, K.P.; Chanway, C.P. Evidence of nitrogen fixation and growth promotion in canola (Brassica napus L.) by an endophytic diazotroph Paenibacillus polymyxa P2b-2R. Biol. Fertil. Soils 2016, 52, 119–125. [Google Scholar] [CrossRef]
- Jeong, H.; Choi, S.-K.; Ryu, C.-M.; Park, S.-H. Chronicle of a soil bacterium: Paenibacillus polymyxa E681 as a tiny guardian of plant and human health. Front. Microbiol. 2019, 10, 467. [Google Scholar] [CrossRef] [PubMed]
- Kumar, S.; Ujor, V.C. Complete Genome Sequence of Paenibacillus polymyxa DSM 365, a soil bacterium of agricultural and industrial importance. Microbiol. Resour. Announc. 2022, 11, e0032922. [Google Scholar] [CrossRef]
- Pasari, N.; Gupta, M.; Eqbal, D.; Yazdani, S.S. Genome analysis of Paenibacillus polymyxa A18 gives insights into the features associated with its adaptation to the termite gut environment. Sci. Rep. 2019, 9, 6091. [Google Scholar] [CrossRef]
- Wang, X.-X.; Hu, H.-Y.; Liu, D.-H.; Song, Y.-Q. The implementation of high fermentative 2,3-butanediol production from xylose by simultaneous additions of yeast extract, Na2EDTA, and acetic acid. New Biotechnol. 2016, 33, 16–22. [Google Scholar] [CrossRef] [PubMed]
- Okonkwo, C.C. Process Development and Metabolic Engineering to Enhance 2,3-Butanediol Production by Paenibacillus polymyxa DSM 365. PhD Dissertation, The Ohio State University, Wooster, OH, USA, 2017. Available online: https://www.proquest.com/docview/2458764038/fulltextPDF/DC07C1D7989342BEPQ/1?accountid=8120 (accessed on 1 December 2022).
- Psaki, O.; Maina, S.; Vlysidis, A.; Papanikolaou, S.; Machado de Castro, A.; Freire, D.M.G.; Dheskali, E.; Kookos, I.; Koutinas, A. Optimization of 2,3-butanediol production by Enterobacter ludwigii using sugarcane molasses. Biochem. Eng. J. 2019, 152, 107370. [Google Scholar] [CrossRef]


Disclaimer/Publisher’s Note: The statements, opinions and data contained in all publications are solely those of the individual author(s) and contributor(s) and not of MDPI and/or the editor(s). MDPI and/or the editor(s) disclaim responsibility for any injury to people or property resulting from any ideas, methods, instructions or products referred to in the content. |
© 2022 by the authors. Licensee MDPI, Basel, Switzerland. This article is an open access article distributed under the terms and conditions of the Creative Commons Attribution (CC BY) license (https://creativecommons.org/licenses/by/4.0/).