Article

A High-Throughput Absolute Abundance Quantification Method for the Characterisation of Daqu Core Fungal Communities

Laboratory of Brewing Microbiology and Applied Enzymology, Key Laboratory of Industrial Biotechnology of Ministry of Education School of Biotechnology, Jiangnan University, Wuxi 214100, China
*
Author to whom correspondence should be addressed.
These authors contributed equally to this work.
Fermentation 2022, 8(8), 345; https://doi.org/10.3390/fermentation8080345
Submission received: 28 May 2022 / Revised: 2 July 2022 / Accepted: 14 July 2022 / Published: 22 July 2022
(This article belongs to the Special Issue Applied Microorganisms and Industrial/Food Enzymes)

Abstract

:
An inherent issue in high-throughput sequencing applications is that they provide compositional data for relative abundance. This often obscures the true biomass and potential functions of fungi in the community. Therefore, we presented a high-throughput absolute quantification (HAQ) method to quantitatively estimate the fungal abundance in Daqu. In this study, five internal standard plasmids (ISPs) were designed for the fungal ITS2 subregion with high length variations. Five ISPs were then utilised to establish standard curves with a quantitative concentration range of 103–107 cells/g, and this was used to quantify the core fungi, including Basidiomycota, Ascomycota, and Mucoromycota. Using three types of mature Daqu from different regions, we demonstrated that the HAQ method yielded community profiles substantially different from those derived using relative abundances. Then, the HAQ method was applied to the Daqu during fermentation. The initial formation of the Daqu surface occurred in the fourth stage, which was mainly driven by moisture. The key fungi that caused the initial formation of the Daqu surface included Hyphopichia burtonii, Saccharomycopsis fibuligera, and Pichia kudriavzevii. The initial formation of the Daqu core occurred in the fifth stage, which was mainly affected by moisture and reducing the sugar content. The key fungi that cause the initial formation of the Daqu core included S. fibuligera and Paecilomyces verrucosus. We conclude that the HAQ method, when applied to ITS2 gene fungal community profiling, is quantitative and that its use will greatly improve our understanding of the fungal ecosystem in Daqu.

1. Introduction

Chinese liquor, called Baijiu, is a traditional fermented alcoholic drink originating in China, one of the oldest distilled liquors in the world. It has a profound influence on the global liquor industry [1]. Most of the famous liquors, such as Moutai liquor, Wuliangye, and Fen liquor, are brewed using the traditional Daqu method. According to the temperature of the production, traditional Chinese Daqu can be divided into medium-temperature Daqu (45~50 °C), medium-high-temperature Daqu (50~59 °C), and high-temperature Daqu (Above 60 °C) [2]. The brewing of Chinese liquor is inseparable from Daqu [3,4,5]. It can directly transfer the abundant microbial strains that are useful to liquor brewing to the fermented grains [6]. At the same time, Daqu also provides fermented grains with rich metabolites, mainly the decomposition products of protein and starch and their transformed substances [7], which play an important role in the taste and flavour of Chinese liquor [8]. Daqu contains abundant fungi, including Mucoromycota, Ascomycota, and Basidiomycota [4,5,9,10]. These fungi are important saccharifying and fermenting agents [11] that provide various enzymes [1] essential for the production of Chinese liquor. Daqu contributes 61–80% of the fungi present during Baijiu fermentation and is closely related to the yield and flavour of fresh Baijiu [12]. Therefore, an in-depth analysis of fungal community succession rates during the Daqu-making process is of great importance for providing a dynamic perspective to optimise the Daqu-making process, improving the quality of Daqu and liquor production. The fungal community has multiple components that are normally abundant and are typically investigated using high-throughput sequencing technology [13]. Nevertheless, the relative abundance determined using high-throughput sequencing cannot reflect the number of fungal communities or dissimilarity among the samples [13,14]. When the total number of microorganisms in different samples is inconsistent, the relative abundance comparison may lead to erroneous conclusions [14,15]. Therefore, to unravel the complexity of fungi in different samples, the fungal communities must be characterised quantitatively. However, the research on the absolute quantification of Daqu fungal communities has not yet been carried out.
Currently, various methods are used for the absolute quantification of microorganisms based on high-throughput sequencing technology [16,17,18,19,20,21,22]. High-throughput sequencing is combined with microbial quantification techniques, such as fluorescence staining and flow cytometry (FCM) [19,20,21,22,23], quantitative PCR (qPCR) [22,24], or microbial biomass carbon (MBC) [25], to obtain the absolute abundance of microbial communities. However, a combination of multiple methods increases the study time and may affect the accuracy of the final results. In contrast, the absolute quantification of microorganisms using the internal standard method has been identified as more reliable [13,22,26,27]. This method involves spiking an internal standard to the sample, followed by performing high-throughput sequencing consistent with the target strains. This brings the experimental error of the internal standard close to that of the target strains. For example, previously, internal DNA standards were spiked into samples to quantitatively estimate the microbial abundances per unit volume of filtered seawater, which yielded more accurate results [14]. Despite the advantages of the internal standard method, this method is commonly used for the quantification of bacteria and still faces many challenges when applied to the quantification of fungi. The main constraints are as follows: First, unlike the concentrated distribution of the bacterial 16S sequence, the fungal ITS2 sequence is highly variable in length. It causes the ITS lengths of different fungi to be quite different, and the difference in sequence lengths can cause deviations in high-throughput sequencing [28]. This makes the quantitative analysis of fungi more challenging than that of bacteria. Second, the production process of Daqu is time-sequential, and microorganisms experience growth, reproduction, and death during the production process. Therefore, the absolute content of fungi in Daqu production is dynamic, but the description of absolute quantitative data of fungi is lacking.
To overcome the existing deficits in the fungal quantification method, we selected mature Daqu as the model ecosystem to establish the high-throughput absolute quantification (HAQ) method. Mature Daqu fungal communities usually form under controlled conditions, and many replicate communities can be generated [9,29]. Moreover, these fungal communities can be reproducibly cultured using known media. In this study, we improved the absolute quantification method based on the internal standard. First, three representative aroma characteristics of Chinese liquors were selected: light-aroma type, strong-aroma type, and sauce-aroma type. Based on the experimental data of our group, analysing the data of Daqu and fermented grains, the core fungi were screened. Next, based on the screened fungal ITS2 information, five ISPs were constructed to increase the accuracy of the quantification. Then, high-throughput sequencing and qPCR were used to determine the added concentration of the mixed ISPs and genome extraction efficiency. Standard curves were used to quantify the core fungi. Lastly, we verified the feasibility of this method for three types of mature Daqu. It was also applied to the fermentation process of medium-high-temperature Daqu for quantitative analysis of the formation law of the spatial structure of fungi during fermentation. This study indicates a novel direction for quantitative fungi profiling and provides new insights into the functions of Daqu core fungi.

2. Materials and Methods

2.1. Design and Verification of ISF and ISP

The primers ITS3: 5′-GCATCGATGAAGAACGCAGC-3′ [30] and ITS4: 5′-TCCTCCGCTTATTGATATGC-3′ [30] were selected at both ends of the internal standard fragments (ISFs). The 116-bp sequence (Table S3) was cited as a specific DNA fragment in the ISF [15]. Other sequences were designed using random DNA generation tools (http://www.novopro.cn/tools/random_dna.html, accessed on 1 June 2020). The obtained ISF was compared in the NCBI (https://www.ncbi.nlm.nih.gov/, accessed on 8 July 2020), UNITE (https://mothur.org/wiki/unite_its_database/, accessed on 8 July 2020), and ITS2 (http://its2.bioapps.biozentrum.uni-wuerzburg.de/, accessed on 8 July 2020) databases, and homologous sequences were observed. The ISF was synthesised by Genewiz Company (Suzhou, China), and BamHI (3′) and SalI (5′) restriction sites were added at both ends.
Plasmid pET-28a (Table S3), digested by BamHI and SalI, and ISF were ligated using an In-Fusion HD cloning kit, and the ligation product, pET-28a-ISF, was transformed into Escherichia coli JM109 (Table S3) for plasmid cloning. Subsequently, the desired transformants were directly screened on LB plates containing antibiotics (50 μg/mL kanamycin) and were verified using PCR. The preparation of E. coli JM109-competent cells and gene fragments and the plasmid transformation were all performed according to the methods described by Zhang [31]. After measuring the ISP concentration using a Thermo Scientific NanoDrop 8000 UV–Vis Spectrophotometer (NanoDrop Technologies, Wilmington, DE, USA), the plasmid copy number was calculated according to the equation described by Dhanasekaran [32]. After dilution with sterile deionised water, the gradient concentrations of ISP in the order of 1 × 10¹¹ to 1 × 10⁶ copies/mL were stored at −20 °C for later use.

2.2. Screening and Fungi

The mature Daqu and Jiupei of the Chinese soy sauce aroma type, Chinese strong aroma type, and Chinese light aroma type were analysed to screen for fungi. For our study, we put forth three requirements as follows: (1) average abundance > 1% in a single sample, (2) the frequency of occurrence > 50% in all samples, and (3) the absolute value of Spearman’s coefficient (|R|) > 0.5.

2.3. Sample Collection

Mature Daqu were collected from traditional Chinese liquor production industries. Among them, high-temperature mature Daqu, medium-high-temperature mature Daqu, and medium-temperature mature Daqu were used in the production of Chinese soy sauce aroma wine, Chinese strong aroma wine, and Chinese light aroma liquor, respectively. Three mature Daqu samples were collected from different production teams. Lastly, all nine samples were transferred to the lab on ice and stored at −80 °C until DNA extraction.
The samples during Daqu fermentation were collected from a typical medium-high-temperature Daqu in a winery in Anhui Province. Choose 3 Qufang to collect the samples. Take 500 g Daqu surface and Daqu core in each Qufang and then transfer to a −80 °C refrigerator for storage. The samples were collected at the end of each stage of the medium- and high-temperature Daqu, namely on 1, 3, 10, 18, 24, and 31 days respectively, for a total of 18 samplings.

2.4. Construction of the HAQ Method

2.4.1. Selection of ISPs Addition Concentration

To explore the optimal added concentration of ISPs and genome extraction efficiency, we designed a simple method, using ISP II for the experiment. The above experiments included 24 treatments as follows: 7 g of high-temperature mature Daqu was spiked with 1 mL of ISP II at seven different concentrations (1011, 1010, 109, 108, 107, 106, and 0 copies/mL corresponding to treatments T11, T10, T9, T8, T7, T6, and Control, respectively). qPCR was performed using these genomes as templates and SpecF and SpecR as primers to plot the standard curve of the ISPII extracted from Daqu. Equation (1) calculates the extraction efficiency of the ISP in Daqu. Then, 1 mL of mixed fungi at five concentrations (103–107 cells/mL each) were spiked with 1 mL of the optimal ISP II concentration, corresponding to treatments M3, M4, M5, M6, and M7, respectively. Moreover, the medium-high-temperature mature Daqu (7 g) and medium-temperature mature Daqu (7 g) were spiked with 1 mL ISP II at six concentrations (1011, 1010, 109, 108, 107, and 106 copies/mL) to compare the extraction efficiency of ISP II in different mature Daqu.

2.4.2. Establishment of the Core Fungal Standard Curve

One fungus was selected per genus for absolute quantification based on the ease of culture, and a total of 16 core fungi were cultured. Absolute quantitative fungi were isolated from different mature types of Daqu and Jiupei. After culturing in the YEPD medium, a hemocytometer was used to quantify each core fungus. Here, molds were counted in units of spores (germ cells). Lastly, all fungi were mixed at five concentration gradients (each fungus was 103–107 cells/mL) for later use. First, 1 mL of mixed fungi (5 mL) was spiked with 1 mL of mixed ISPs; then, the genome was extracted and HTS performed in triplicate. The obtained HTS data were analysed and organised, using Equation (2) to calculate the concentration of a certain fungus in the mix, and the correspondence between the ISP and the fungus should be noted. Taking the LG value of the concentration of fungus A (copies/g) as the X-axis, and the LG value of the corresponding fungal A concentration (cells/g) as the Y-axis, a standard curve y = ax + b was established, where x refers to the concentration of fungi (copies/g), and y refers to the concentration of fungi (cells/g).

2.5. Application of HAQ Method

High-temperature mature Daqu (7 g), medium-high-temperature mature Daqu (7 g), and medium-temperature mature Daqu (7 g) were spiked with 1 mL of five mixed ISPs (HQ, MHQ, and MQ). Medium-high-temperature mature Daqu were spiked with 1 mL of sterile water (MHC). Eighteen medium-high-temperature Daqu samples during Daqu fermentation were spiked with 1 mL of five mixed ISPs. All samples were analysed in triplicate.
All samples were mixed thoroughly, and genomic DNA was extracted according to the methods described by Song [33]. The extracted DNA was stored at −80 °C before qPCR.

2.6. Quantitative PCR

qPCR was performed using a StepOnePlus instrument (Applied Biosystems, Foster City, CA, USA) and a commercial kit (AceQ Universal SYBR qPCR MasterMix. Vazyme, Nanjing, China). We selected a pair of primers, SpecF (5′-GCGGTAAGGTGAAGAGTG-3′) and SpecR 5′-GGCTAACGAGACAACTGC-3′), to detect the copy numbers of the Spec gene of the ISP.
The standard curve was generated using the 10-fold serial dilution of ISP II. The 20-µL qPCR reaction mixture contained 10 µL of SYBR mix (Vazyme), 0.4 µL of each primer (10 mmol/L), 1 µL of DNA template, and 8.2 µL of sterile and DNA-free water. The reaction was executed under the following thermocycler conditions: 95 °C for 5 min and 40 cycles of 95 °C for 10 s and 60 °C for 30 s. Then, the specificity of the PCR products was determined using a melting curve analysis [34]. All qPCR reactions were conducted in triplicate.

2.7. Amplification and Sequencing

The fungal ITS region was amplified using primers ITS3 and ITS4 [30]. The PCR products were purified and carefully evaluated using a Thermo Scientific NanoDrop 8000 UV–Vis Spectrophotometer (NanoDrop Technologies, Wilmington, DE, USA). The high-throughputs were then sequenced using an Illumina MiSeq platform (Illumina, San Diego, CA, USA) at AuwiGene Technology Co., Ltd., Beijing, China.
All raw sequences generated via Qiime (v1.8.0) were processed [35]. In short, the raw sequences were filtered for quality determination, and only those over 200 bp were selected for further analysis. Then, sequences with ambiguous bases (‘N’) were removed using Trimmomatic (version 0.32) [36]. Chimera sequences were removed using the UCHIME algorithm [37]. The QIIME UPARSE pipeline was used to cluster (97% sequence similarity) the high-quality sequences into OTUs. In addition, OTUs of ITS high-throughput sequences were mapped to Unite (version 7.0) [38]. For further accurate verification of species information, the fungal OTUs were manually corrected using the CBS database (http://www.westerdijkinstitute.nl, accessed on 11 June 2021).

2.8. Statistical Analysis

The extraction efficiency of the ISP was calculated using the following equation:
E = Rb Ra
where E is the extraction efficiency of the ISP II; Ra and Rb are the concentrations of the ISP II (copies/g); and, after genome extraction, the concentration of ISP II (copies/g) in the sample, respectively.
The semi-quantitative fungal data from samples were collected using the following equation:
Aa = Ra ( 1 Rr ) × Ar Rr × E
where Aa is semi-quantitative measurements of the fungi (copies/g), Ar is the relative abundance of the fungi, and Rr is the relative abundances of ISP. Different fungi corresponded to the different ISP. Then, using Equations (1) and (2), the semi-quantitative results in the mixed fungi were calculated with different concentrations. Finally, using the semi-quantitative result of the fungus as the X-axis and the cell concentration of the fungus by the haemocytometer as the Y-axis, standard curves were established based on the mixed ISPs.
The alpha diversity was calculated by analysing the Shannon index using QIIME after rarefying all samples to the same sequencing depth (46,339 reads). Statistical significance of the differences between alpha diversity was investigated using one-way analysis of variance, followed by Tukey’s post hoc test using IBM® SPSS® Amos™ 22 (Arbuckle, 2013). PCoA was performed to examine the fungal community dissimilarity of different samples based on Bray–Curtis distances. A hierarchical clustering analysis was performed using the SIMCAP+ software package (v.13.0. Umetrics, Umea, Sweden) to illustrate the differences in fungal community compositions among the samples.

2.9. Data Availability

All sequences generated were submitted to the NCBI database under the accession number PRJNA649523.

3. Results

3.1. Sequence Distribution of Fungal ITS2 and Construction of ISP

By analysing the fungal ITS2 sequence information, we found that its length in mature Daqu was usually 200–440 bp (Table S1). Among them, the sequences of 320–360 bp accounted for 49.94%, those of 260–320 bp accounted for 36.23%, those of 200–260 bp accounted for 12.06%, and those of 360–380 bp accounted for 1.04%. The sequences of other lengths accounted for less than 1% (Figure 1A). These data demonstrate that the length of the fungal ITS2 sequence varies greatly. To improve the quantitative accuracy, we designed five internal standard fragments (ISFs) (Table 1) based on the lengths and GC contents of 30 screened fungal ITS2 sequences (Table S2). Then, we used five ISFs (Figure 1B) to obtain five internal standard plasmids (ISPs) (Table 2). Enzyme digestion and ISP PCR were used to successfully verify the five ISPs (Figure S1).

3.2. Selection of ISP Concentrations and Application Verification

To determine the optimal added concentration of ISPs and the efficiency of genome extraction, a convenient method was developed based on ISP II (Table 2). Here, we used the extraction efficiency of ISP II to reflect that of the sample genome. Using Equation (1), the extraction efficiency of ISP II at different concentrations in high-temperature mature Daqu was determined to be 17.42~18.71% (Figure 2b). Meanwhile, we selected the data with CT values between 15 and 25 for further analysis. Accordingly, 1 × 10⁷–1 × 10⁹ copies/mL was the initial concentration of the mixed ISPs that was added (Figure 2a).
To further determine the suitable concentrations of the ISPs, the high-temperature mature Daqu genome DNA containing different concentrations of ISP II was subjected to high-throughput sequencing (Figure 2c). The results showed that the T10 and T9 experimental groups significantly changed the abundance of fungal communities in the high-temperature mature Daqu compared to that in the control. The relative abundance of Aspergillus ruber in the T8 experimental group was reduced by approximately 10% compared to that in the control. The abundance of fungal communities in the T7 experimental group was most similar to that of the control. Therefore, a concentration of 1 × 10⁷ copies/mL of the mixed ISPs was selected as the optimal concentration of the mixed ISPs.
Moreover, there existed a linear relationship (R2 > 0.99) between the relative abundance of the fungal communities and the ISP II that was added to the high-temperature mature Daqu (Figure 3a). This indicated that the added ISP II could be correspondingly reflected in high-throughput sequencing so that the abundance of other fungi could be accurately determined. Meanwhile, the melting curve revealed a consistent melting temperature (Figure 3b), indicating that the amplified fragment had higher specificity. In addition, we compared the extraction efficiency of ISP II in three types of mature Daqu (Figure 3c) and determined it to be 17.42~19.89%, which indicated that ISP II was stable and could be used in different types of mature Daqu.

3.3. Construction of the HAQ Method

First, 16 core fungi (Table 2), including Ascomycota, Basidiomycota, and Mucoromycota, were selected for cultivation from 30 screened fungi (Table 1) and mixed at five different concentration gradients (103~107 cells/mL for each fungal solution). Using Equation (1), the extraction efficiency of ISP II in mixed fungi was found to be 19.24~19.58% (Figure S2). The average extraction efficiency (19.42%) of ISP II in mixed fungi was used in the calculation. Similarly, we established 16 standard curves for the core fungi using Equation (2). Figure 4 shows that the HAQ method was accurate (R2 > 0.99), and the concentration range of fungal quantification was 103~107 cells/g. Finally, we calculated the semi-quantitative results of 16 core fungi in mature Daqu using Equation (2), and the results were substituted into the standard curve to achieve absolute quantification of the target fungi.

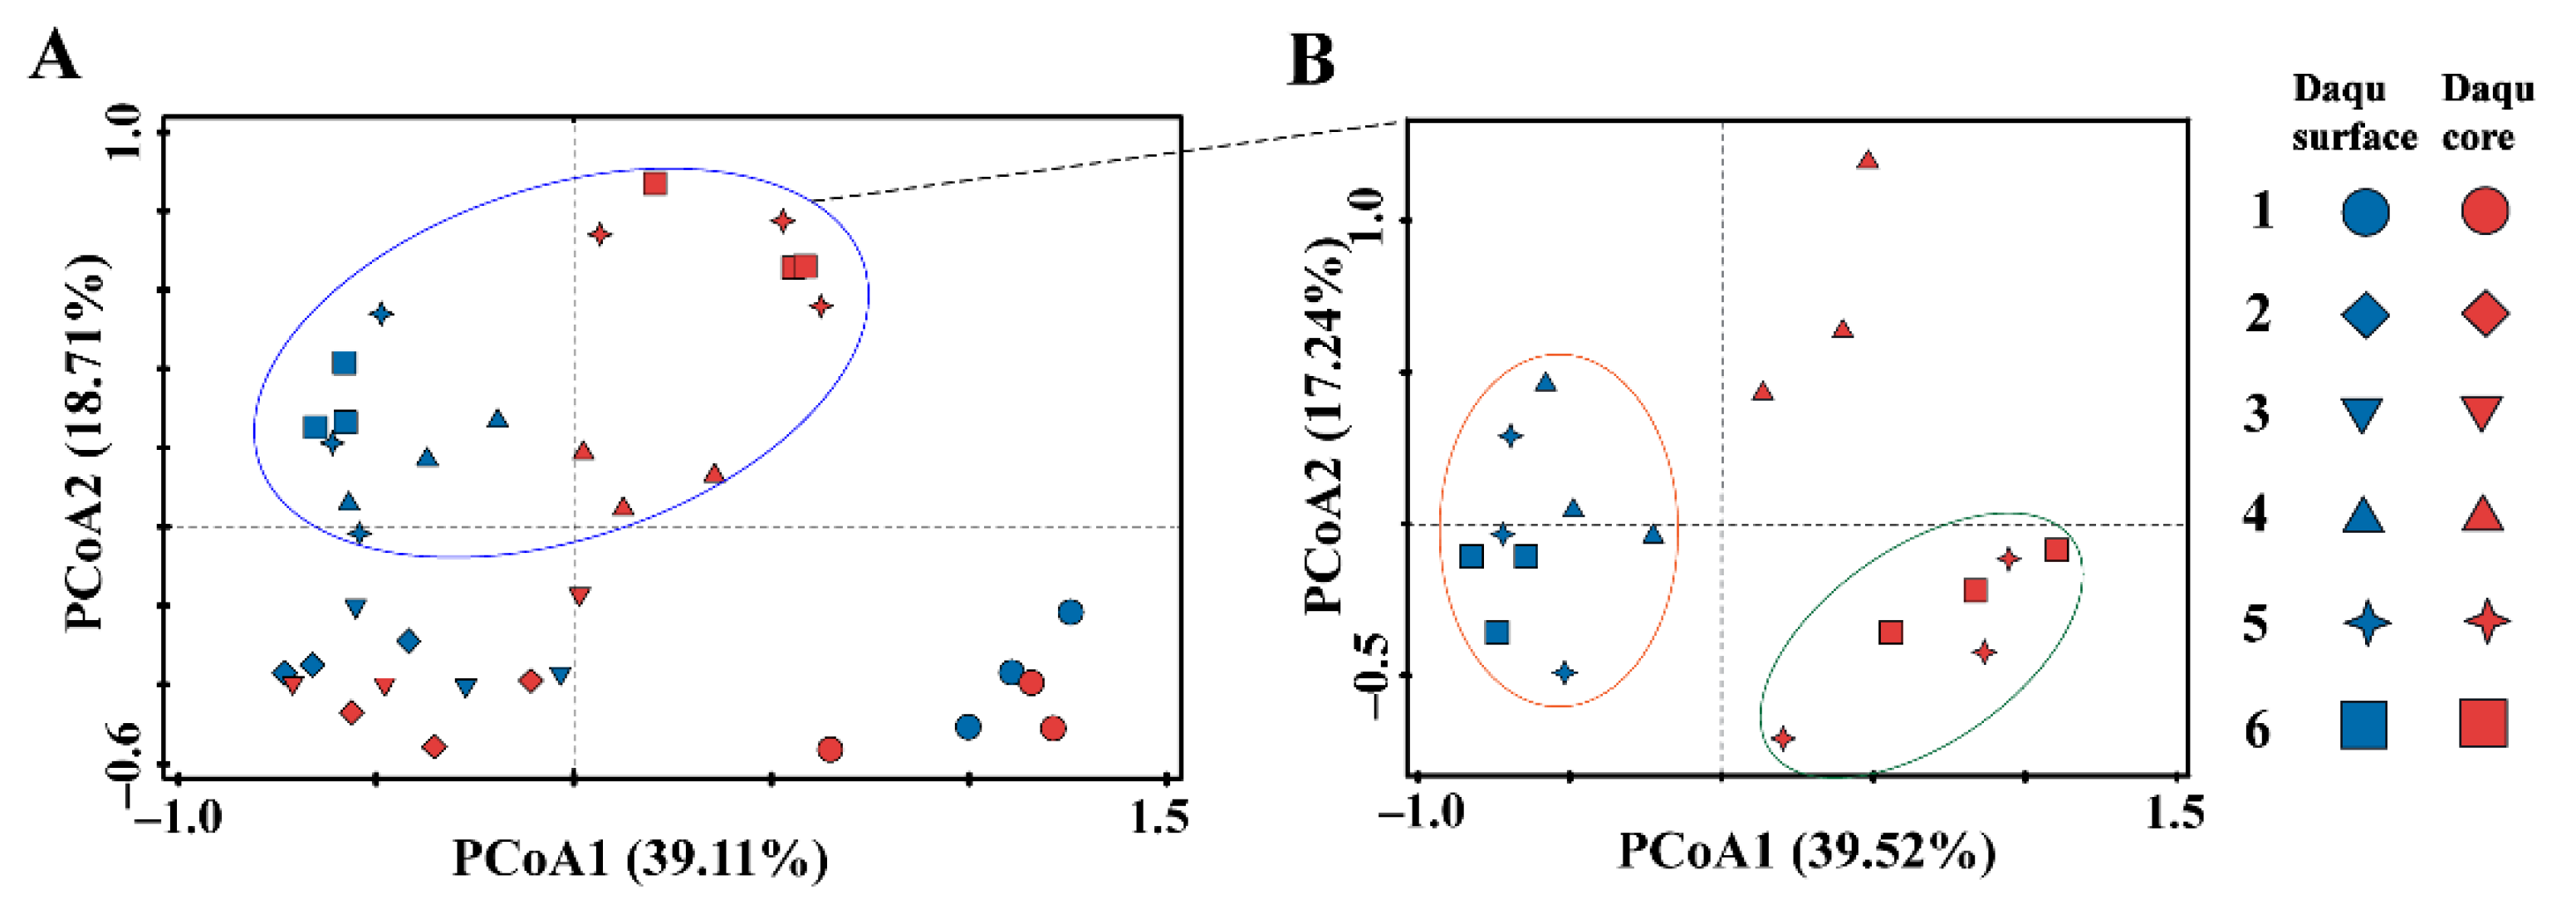
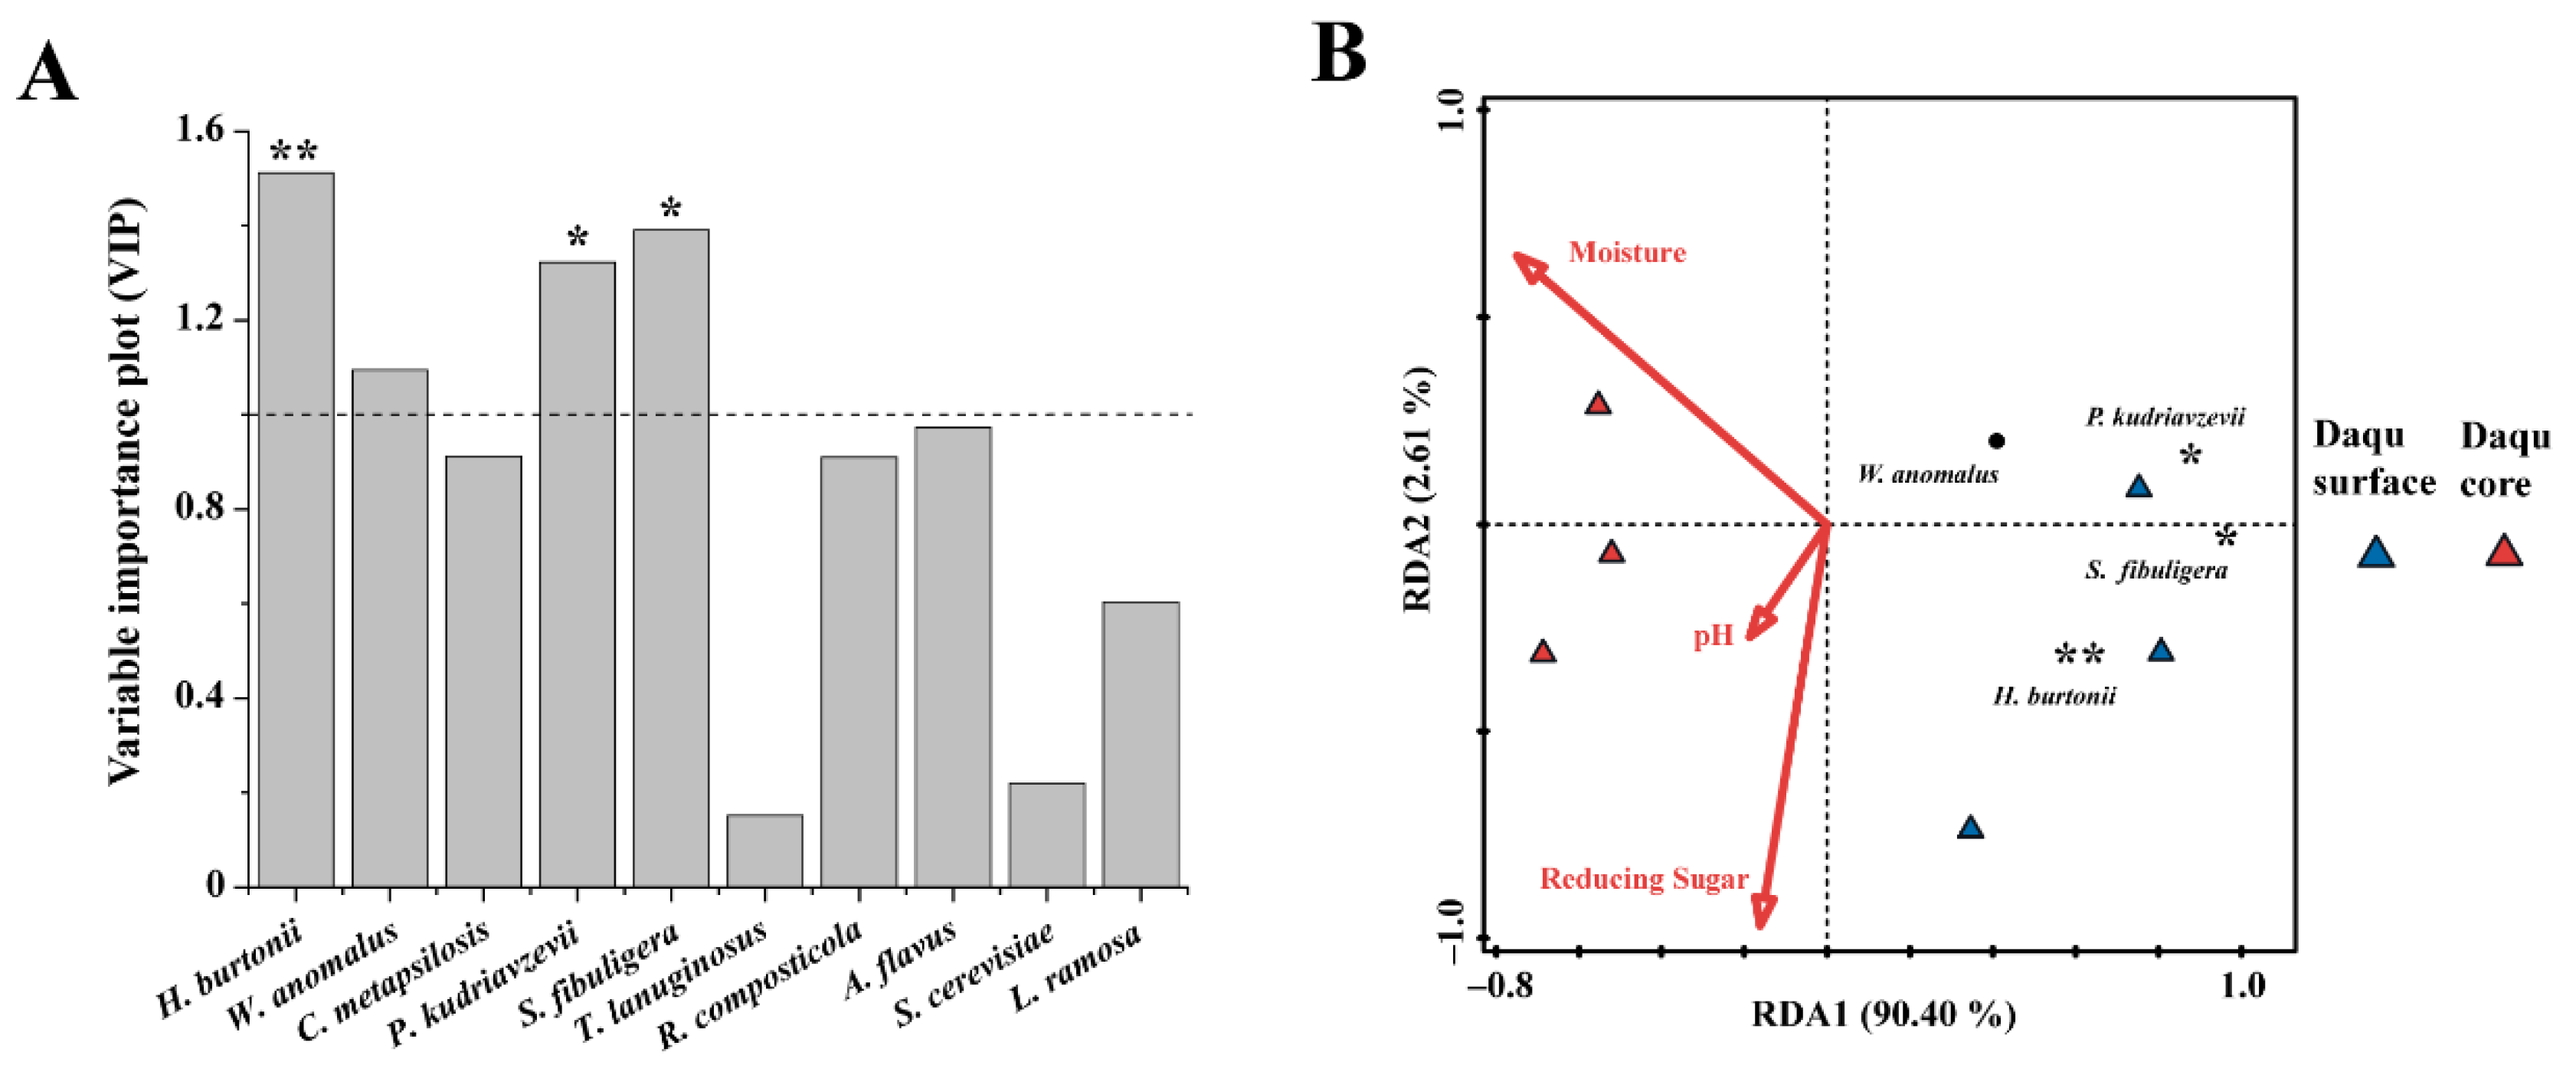
3.4. Application I: Case Studies of Different Mature Daqu

Figure 5 showed that a total of 128 species of fungi were detected in the medium-temperature Daqu samples, a total of 157 species of fungi were detected in the medium-high-temperature Daqu samples, and a total of 164 species of fungi were detected in the high-temperature Daqu samples. Among them, 121 fungi were detected in the middle-temperature Daqu and the high-temperature Daqu, and the shared fungal rate reached 73.78%. One hundred and fifteen fungi were detected in both medium-temperature Daqu and medium-high-temperature Daqu, and the shared fungal rate reached 73.25%. One hundred and thirty fungi were detected in both medium-high-temperature Daqu and high-temperature Daqu, and the shared fungal rate reached 79.27%. A total of 108 fungi were detected in the three types of Daqu, and the shared fungal rate reached 65.85%. The above conclusions showed that the three different Daqu had small differences in the fungal community structure of Daqu. Therefore, we speculated that the difference in fungal biomass was an important factor that caused the differences in the three types of Daqu.
High-throughput sequencing was used to characterise the fungal community structures in different types of mature Daqu. A total of 556,068 high-quality reads from the internal transcribed spacer (ITS) region were obtained from all 12 samples. The rarefaction curves of the fungal communities approached the saturation plateau, which illustrated that the fungal communities were well-represented at the sequencing depth (Figure S2A). The alpha diversity of mature Daqu was determined using the Shannon index (Figure S2B). We found that there was no significant difference in the fungal diversity between the MHQ (medium-high-temperature mature Daqu were spiked with 1 mL of five mixed ISPs) and MHC (medium-high-temperature mature Daqu was spiked with 1 mL of sterile water), which indicated that the addition of mixed ISPs had little effect on fungal diversity. A principal coordinate analysis (PCoA) of the fungal community was carried out based on the Bray–Curtis distances (Figure 6a). Overall, these findings explained 67.5% of the total variation in the differences between fungal communities. The results showed that the fungal community structure of MHQ was very close to that of MHC. This further proved that the addition of mixed ISPs had little effect on the fungal community structures. These were also verified by HCA, which demonstrated a clustering pattern similar to that of PCoA (Figure 6b).
To more accurately characterise the fungal community structures in three types of mature Daqu, 16 core fungi were quantified using the HAQ methods. Figure 7a shows that all 16 core fungi had extremely high abundance in MQ (medium-temperature mature Daqu were spiked with 1 mL of five mixed ISPs), MHQ, and HQ (high-temperature mature Daqu were spiked with 1 mL of five mixed ISPs), occupying 93.52 ± 2.45%, 81.03 ± 1.80%, and 77.59 ± 1.08% respectively. These findings indicated that the abundances of the 16 selected fungi could be used as reference standards for analysing mature Daqu fungal community structures. After absolute quantification, we found that the absolute abundance of the 16 core fungi in the three types of mature Daqu varied, and the total amounts of the 16 core fungi were also dissimilar (Figure 7b). Table 3 shows that the total abundance of the 16 core fungi in MHQ (1.76 × 10⁷ ± 4.36 × 10⁵ cells/g) was the highest, followed by that in MQ (4.36 × 10⁶ ± 6.12 × 10⁵ cells/g) and HQ (2.86×10⁵ ± 5.09 × 10⁴ cells/g). Moreover, only the absolute abundance of Paecilomyces verrucosus was of the same order of magnitude (103 cells/g) in the three types of mature Daqu (Figure S4). The absolute abundances of the remaining 15 fungi in HQ were all lower than those in MQ and MHQ. The absolute abundances of Thermomyces lanuginosus and Wickerhamomyces anomalus in MQ, MHQ, and HQ were 106, 105, and 104 cells/g, respectively, whereas that of Lichtheimia ramosa in MQ, MHQ, and HQ was 106, 105, and 103 cells/g, respectively. Therefore, this could be a criterion for identifying different types of mature Daqu.
Figure 7c,d show that the relative abundance of the 16 core fungi in MQ was dominated by Saccharomycopsis fibuligera (82.33%), followed by Pichia kudriavzevii (6.13%) and Hyphopichia burtonii (2.02%). The fungi with the highest absolute abundance were S. fibuligera (1.74 × 10⁶ ± 2.25 × 10³ cells/g), T. lanuginosus (4.56 × 10⁵ ± 3.39 × 10⁴ cells/g), and H. burtonii (4.30 × 10⁵ ± 1.16 × 10⁵ cells/g). The relative abundances of the 16 core fungi in MHQ were dominated by S. fibuligera (41.78%), followed by P. kudriavzevii (16.07%) and T. lanuginosus (8.61%). The fungi with the highest absolute abundance were Lichtheimia ramosa (7.37 × 10⁶ ± 2.33 × 10⁵ cells/g), T. lanuginosus (5.13 × 10⁶ ± 7.67 × 10³ cells/g), and S. fibuligera (1.62 × 10⁶ ± 2.57 × 10⁵ cells/g). The relative abundances of the 16 core fungi in HQ were dominated by S. fibuligera (33.41%), followed by H. burtonii (17.31%) and Monascus purpureus (7.27%). Fungi with the highest absolute abundance were M. purpureus (7.04 × 10⁴ ± 2.46 × 10⁴ cells/g), T. lanuginosus (6.72 × 10⁴ ± 1.07 × 10⁴ cells/g), and H. burtonii (3.62 × 10⁴ ± 7.14 × 10³ cells/g). These results indicated that the relative and absolute abundances may be inconsistent even in the same sample.
In addition, we found (Figure S6) that the abundance of H. burtonii was underestimated by 7.71% in MQ and overestimated in MHQ (8.54%) and HQ (9.64%) compared to the absolute abundance. The abundances of W. anomalus, T. lanuginosus, Rasamsonia composticola, M. purpureus, Saccharomyces cerevisiae, L. ramosa, and Schizosaccharomyces pombe were all underestimated in MQ, MHQ, and HQ. Among them, the fungus that was most underestimated in the three types of Daqu was T. lanuginosus, which, in MQ, MHQ, and HQ, was underestimated by 10.0%, 18.6%, and 16.8%, respectively. The abundances of P. kudriavzevii and Saccharomyces fibuligera in MQ, MHQ, and HQ were overestimated; in particular, the abundance of S. fibuligera in MQ, MHQ, and HQ was overestimated by 48.1%, 42.3%, and 31.4%, respectively. The abundances of the remaining six core fungi had almost no deviation (absolute value of abundance deviation < 1%).

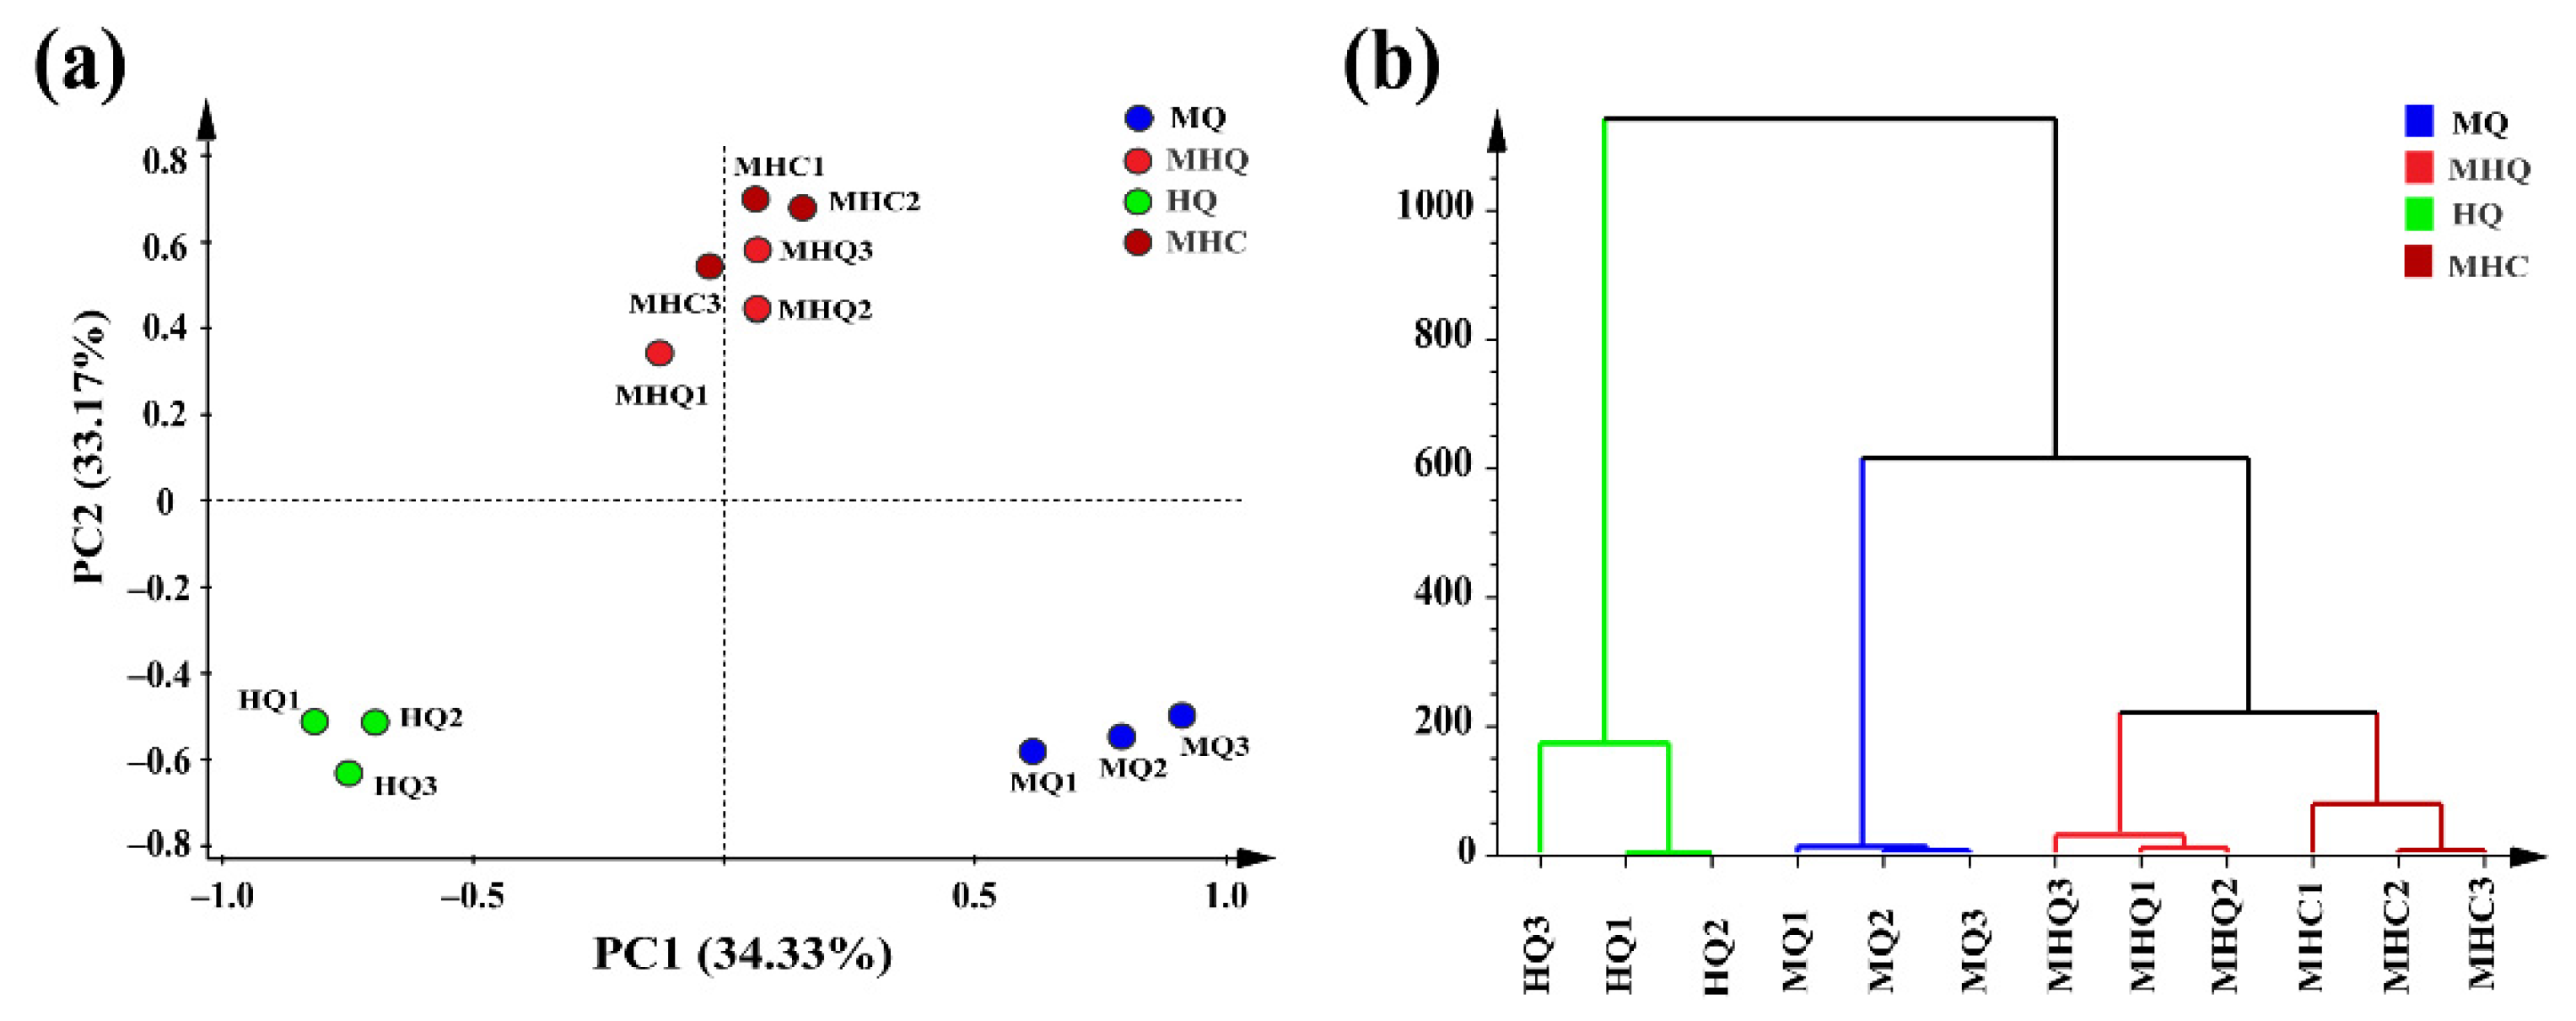
3.5. Application II: Case Studies of Medium-High Temperature Daqu during Fermentation

ITS amplicon technology has accelerated the study of Daqu fungi, deepening the understanding of the fungal community structure of Daqu. However, the formation principle of the space structure of fungi in medium-high-temperature Daqu is unclear.
During the whole process of Daqu fermentation, a total of 81 fungi were detected in the Daqu surface sample, and a total of 84 fungi were detected in the Daqu core sample. Among them, 78 species of fungi were common in the Daqu surface samples and Daqu core samples. The shared fungi rate was over 90% (Figure 8). This showed that there was almost no difference in the structure of the fungal community during Daqu fermentation. Therefore, we speculated that the gap in the fungal biomass was an important factor causing the difference between the Daqu surface and Daqu core.
To find the key time points for the formation of the medium-high-temperature Daqu surface and Daqu core, the PCoA was used to characterise the fungal community during Daqu fermentation (Figure 9). Figure 9A,B showed that these findings, respectively, explained 57.82% and 56.76% of the total variation in the differences between fungal communities. From the perspective of the spatial sequence level, 4~6 stages during Daqu fermentation were the important stages for the initial formation of the Daqu surface and Daqu core. Among them, Daqu surface fungi had undergone significant changes compared with Daqu core from the fourth stage, and the fungal community of Daqu core became stable, indicating that Daqu core had initially formed in the fourth phase. The clusters of fungal community in the 5~6 stages showed that the Daqu core had initially formed at the fifth stage.
A variety of fungi were involved when the Daqu surface formed in the fourth stage. However, the importance of different fungi to Daqu surface formation would vary. SIMCA software was used to perform partial least squares regression (PLS) to evaluate the importance of fungi and Daqu surface formation. In the fourth stage, there are four important fungi that differ from the Daqu surface and Daqu core, namely H. burtonii, W. anomalus, P. kudriavzevii, and S. fibuligera. These four kinds of yeasts play an important role in the formation of Daqu surface. Among them, there was a significant difference (p < 0.05) between P. kudriavzevii and S. fibuligera in the Daqu surface and these in the Daqu core. There was a very significant difference in H. burtonii (p < 0.01). These three yeasts were key fungi in the formation of the Daqu surface.
To analyse the driving factors of the initial formation about the Daqu surface during Daqu fermentation, a redundant analysis (RDA) was used to analyse the influence of pH, moisture, and reducing the sugar content on the fungal community. Overall, these findings explained 93.01% of the total variation in the differences between fungal communities. Combining Figure 10 and Table 4, it was found that the initial formation of the Daqu surface during Daqu fermentation was mainly driven by moisture (51.8%). H. burtonii, S. fibuligera, and P. kudriavzevii were the key fungi for the initial formation of the Daqu surface during Daqu fermentation. W. anomalus also made an important contribution to the initial formation of the Daqu surface.
In order to explore the reason for the initial formation of the Daqu core during Daqu fermentation, we compared the differences in the fungal community between the fourth stage and the fifth~sixth stages. Meanwhile, use SIMCA software to find fungi with a VIP value greater than 1.0. As shown in Figure 11, there are six important differences between the fourth stage of the Daqu core and the fifth~sixth stages of the Daqu core. Among them, three kinds of yeasts are C. metapsilosis, P. kudriavzevii, and S. fibuligera. Three kinds of molds are P. verrucosus, T. lanuginosus, and A. flavus. These six fungi played an important role in the initial formation of the Daqu core during Daqu fermentation. There was a significant difference (p < 0.05) between S. fibuligera and P. verrucosus in the fourth stage of the Daqu core and those in the fifth~sixth stages of the Daqu core. They were the key fungi that caused the initial formation of the Daqu core.
To analyse the driving factors of the initial formation of the Daqu core during Daqu fermentation, RDA was used to analyse the influence of pH, moisture, and reducing sugar on the Daqu core fungal community. Overall, these findings explained 92.61% of the total variation in the differences between fungal communities. Combining Figure 11 and Table 5, it could be found that the initial formation of the Daqu core was affected by moisture and reducing sugar. S. fibuligera and P. verrucosus were the key fungi for the initial formation of the Daqu core during Daqu fermentation. T. lanuginosus, R. composticola, C. metapsilosis, and P. kudriavzevii also made an important contribution to the initial formation of the Daqu core.
In this study, the microbial community interaction network was used to analyse the relationship between Daqu fungus microorganisms. Figure 12 showed that there were 13 positive correlations and 12 negative correlations between the four key fungi and other fungi. Among them, H. burtonii had a significant positive correlation with W. anomalus, P. kudriavzevii, S. fibuligera, and A. flavus and a significant negative correlation with P. verrucosus and M. purpureus. P. kudriavzevii had a significant positive correlation with H. burtonii, W. anomalus, and S. fibuligera and a significant negative correlation with R. mucilaginosa, P. verrucosus, T. lanuginosus, R. composticola, M. purpureus, and A. flavus. S. fibuligera had a significant positive correlation with H. burtonii, W. anomalus, P. kudriavzevii, and A. flavus and a significant negative correlation with P. verrucosus, T. lanuginosus, R. composticola, and M. purpureus. P. verrucosus had a significant positive correlation with C. metapsilosis, T. lanuginosus, R. composticola, and M. purpureus and a significant negative correlation with H. burtonii, W. anomalus, P. kudriavzevii, and S. fibuligera.

4. Discussion

Absolute quantitation of the microbiota is essential for all aspects of microbial ecology [13]. The relative abundance obtained by high-throughput sequencing can partially characterise the fungal community in the sample, while the absolute abundance based on quantitative methods can more objectively describe the actual abundance of the fungi. To quantify the core fungal community, we designed a HAQ method in which the structurally stable and highly reproducible mature Daqu was selected as a model ecosystem. Unlike the direct use of sequencing data to quantify microorganisms, this method quantifies fungi based on the construction of a standard curve.
Despite the advantages of the internal standard method, this method is commonly used for the quantification of bacteria and still faces many challenges when applied to the quantification of fungi. Figure 1A shows that the fungal ITS2 sequence is highly variable in length. Moreover, the difference in sequence lengths can cause deviations in high-throughput sequencing [28]. In the face of the absolute quantification of fungi, the corresponding internal standard sequence length should be designed according to the ITS sequence length of different fungi. Therefore, we constructed five ISPs based on the sequence lengths and GC contents of 30 screened fungal ITS2. The 16 core fungi from the screening culture were divided by five ISPs as a way to compensate for the lack of accuracy in quantifying all fungi using one internal standard substance (Figure 1B and Table S2). Recently, several studies have used one internal standard to attempt an absolute quantification of all fungi [13,14,15]. For example, a synthetic plasmid was used as the internal standard for the absolute quantitation of fungal abundance in environmental samples, which is easier to operate [13]. However, owing to the high length variations of the fungal ITS2 sequence, this method may reduce the accuracy of quantification [15,28]. Therefore, it would be more accurate to quantify core fungi using five internal standards compared to merely using one internal standard to quantify all fungi.
It is strongly recommended to determine the optimal level of ISP addition for a given sample. Since spiking the internal standard to the sample before DNA isolation can obtain the most accurate results [13], our method too followed this principle. Figure 1B shows that the five ISFs have a similar basic composition. Furthermore, the most common sequence of fungal ITS is 272 bp [39], and 50% GC is the regular GC content (same sequence length and GC content as ISF II) [28]. Therefore, we used ISP II to determine the added concentration of mixed ISPs. Since the CT values between 15 and 25 had a higher accuracy for a given target concentration [40,41], combined with the results of high-throughput sequencing, we selected 107 copies/mL as the final added concentration of the mixed ISPs (Figure 2a,c). When the concentration of ISP II was high, the fungal community structures showed obvious changes (Figure 2c). However, a concentration of the mixed ISPs hardly altered the measured structure of the fungal community in the three types of mature Daqu (Figure 6 and Figure S2B). The linear relationship (Figure 3b) demonstrated a strong association between the relative abundance of ISP II and its added concentration in high-temperature mature Daqu. Similar results were reported by Yang et al. [15] and Lou et al. [24], wherein the slopes of the internal standard output and input amounts were close to 1. This indicated that the ISP II concentration of the changes could be linearly reflected in the high-throughput sequencing results. Therefore, the constructed mixed ISPs could be used as internal standards for the determination of the absolute abundance of the fungal community.
In studies of the high-throughput absolute quantification of bacteria, it has been shown that, once the internal standard strain is added to the sample to be tested, it is difficult to extract it completely, and the losses are significant [15]. This also reflects that the same problem exists for the extraction of genomes from samples to be tested. Therefore, the extraction efficiency of the sample to be tested should be taken into account when quantifying the microbial community by the internal standard method. The extraction efficiency of the sample genome was calculated using ISP II with a 116-bp specific fragment. The accuracy of this method mainly depends on the linearity of the standard curves [42]. The R2 (>0.99) of the standard curves indicated the accuracy of the qPCR (Figure 2a) [41]. Meanwhile, the consistent melting temperature showed that the amplified 116-bp fragment had a strong specificity (Figure 3b). Therefore, the calculation of the extraction efficiency of the sample genome based on ISP II was reliable. Furthermore, the extraction efficiency of ISP II in the three types of mature Daqu was 17.42~19.89% (Figure 3c), which was similar to the results obtained by Yang [28]. We also used this method of qPCR to characterise the extraction efficiency of mixed fungi, the results of which were within the above range (Figure S3).
Presently, the absolute quantitative method is mainly used to quantify microbial communities in soil. In this study, we used the culturable technique to establish standard curves of 16 core fungi to achieve absolute abundance quantification of core fungal communities and applied them to different mature Daqu. The results showed that the differences in the fungal community structure of the three mature Daqu were small (Figure 5). Therefore, we inferred that the difference in fungal biomass was an important factor in the difference between the three mature Daqu. Using the HTS technique, we found that the 16 core fungi used for absolute quantification all occupied high abundance in three mature Daqu (Figure 7a), indicating that the 16 core fungi have important reference values for resolving the fungal community structure of the mature Daqu. Meanwhile, we also found that the relative and absolute abundances have opposite trends in different samples [15,24,25,26]. Notably, we found similar results in the same sample. For example, the fungus with highest relative abundance among the 16 core fungi in MHQ was S. fibuligera (41.78%), whereas, in terms of their absolute abundance, L. ramosa ramosa (41.95%) was the most dominant, and S. fibuligera only accounted for 9.22% (Figure S5). Moreover, we revealed the deviation in abundance of the 16 core fungi (Figure S6). Compared to their absolute abundance, we found that two fungi were overestimated in the three types of mature Daqu. Among them, the overestimation of S. fibuligera (36% GC) may be caused by the low GC content of the ITS2 sequence. All seven fungi were underestimated in the three types of mature Daqu. Among them, the underestimation of T. lanuginosus (59% GC), R. composticola (62% GC), and M. purpureus (60% GC) may result from the high GC content of the ITS2 sequence. The underestimation of S. cerevisiae (381 bp, 43% GC), L. ramosa (399 bp, 39% GC), and S. pombe (421 bp, 31% GC) may result from the long sequence length and low GC content of the ITS2 sequence. The above results indicate that the use of multiple internal standards can help obtain accurate quantitative results.
In this study, the changes of the physical and chemical indexes of the Daqu surface and Daqu core were tracked during the Daqu fermentation, and the driving factors of the initial formation about Daqu surface and Daqu core were quantitatively analysed by means of RDA in combination with the HAQ. The figure (Figure 8) showed that the fungal community structure of the Daqu surface and Daqu core fungi was similar. The difference in fungal biomass was an important factor in the formation of the Daqu surface and Daqu core. To find the key time points for the formation of the medium-high-temperature Daqu surface and Daqu core, the fungal community during Daqu fermentation characterised at the OUT level based on PCoA. Figure 9 showed that, from the spatial structure level, 4–6 stages during Daqu fermentation were important stages for the initial formation of the Daqu surface and Daqu core. Among them, H. burtonii, S. fibuligera, P. kudriavzevii, and P. verrucosus were the key fungi that caused the formation of Daqu surface and Daqu core. To further analyse the correlations between the four key fungi and other core fungi, we used a microbial interaction network analysis to resolve the relationship between Daqu fungus microorganisms, and the results showed a total of 13 positive and 12 negative correlations between the four key fungi and other fungi. H. burtonii, S. fibuligera, and P. kudriavzevii have been proven to be important functional fungi in Chinese liquor fermentation [43]. H. burtonii could produce various important flavour substances, such as ethyl acetate and 4-hydroxy-2-butanone [44,45]. P. kudriavzevii could produce metabolites such as phenethyl alcohol that had an important contribution to liquor flavour [46]. It could also ensure the stability of the microbial community and the fermentation process [47]. S. fibuligera could increase the activity of saccharified starch and acid protease and the rate of ethanol synthesis in the early stage of fermentation [48]. It could also improve the aroma of wine and produce many pleasant aroma compounds, such as ethyl acetate and ethyl butyrate [49].

5. Conclusions

In conclusion, the relative abundance determined using high-throughput sequencing can be partially helpful in characterising fungal communities. The actual abundance of fungi can be described more objectively based on the absolute abundance of the quantitative method. In this study, five ISPs were constructed to quantify fungi because of the length variations of the fungal ITS2 sequence. The HAQ method can absolutely quantify 16 fungi and more truly characterise the core fungal community structures. Furthermore, we found that fungal ITS2 sequences with lower GC contents may be easily overestimated or vice versa. The Daqu surface during fermentation initially formed in the fourth stage, which was mainly driven by the moisture. Among them, H. burtonii, S. fibuligera, and P. kudriavzevii were the key fungi. The Daqu core during fermentation initially formed in the fifth stage, which was mainly affected by the moisture and reducing sugar. Among them, S. fibuligera and P. verrucosus were the key fungi. The HAQ method can be used for the quantification of core fungi in different samples and serve as a valuable reference for studying fungal interactions, potential functions, and energy metabolism.

Supplementary Materials

The following supporting information can be downloaded at: https://www.mdpi.com/article/10.3390/fermentation8080345/s1. Figure S1. Verification of ISFs and ISPs. (A) Enzyme digestion of pET-28a plasmid and ISFs. (B) Plasmid map of ISP. (C) PCR verification. Figure S2. Rarefaction curves and box plots. (A) Rarefaction curves of the fungal ITS2 region sequences of all samples. (B) Box plots showing the Shannon index values of fungal communities among MQ, MHQ, HQ, and MHC. Sample groups with different letters and colours indicate significant differences (p < 0.05), as determined using one-way analysis of variance and Tukey’s post hoc test. Figure S3. Extraction efficiency of ISP II in mixed fungi with different concentrations. Figure S4. Absolute abundance of 16 core fungi in different mature Daqu. Figure S5. Relative and absolute abundance of 16 core fungi. (A) The total relative abundance of the 16 core fungi was regarded as ‘1’. (B) The total absolute abundance of the 16 core fungi was regarded as ‘1’. Figure S6. The abundance deviation of 16 core fungi. The abundance deviation was calculated according to the following equation: A s = A r R A a A . Where As is the abundance deviation of a fungus (%); Ar and Aa are the relative and absolute abundance of a fungus, respectively; and R and A are the total relative and absolute abundances of the 16 core fungi, respectively. The positive value of abundance deviation represented overestimation, and the negative value represented underestimation. (A–C) were in MQ, MHQ, and HQ, respectively. Table S1. High-quality sequence distribution statistics. Table S2. ITS2 sequence and GC content of screened core fungi. Table S3. Strain, plasmid, and sequence used in this study.

Author Contributions

Conceptualisation, Writing—original draft, Formal analysis, Investigation, Data curation, H.D. and J.S.; Conceptualisation, Formal analysis, Investigation, Data curation, Writing—review and editing, T.Z.; and Conceptualisation, Writing—review and editing, Y.X. All authors have read and agreed to the published version of the manuscript.

Funding

This research was funded by the National Natural Science Foundation of China (NSFC) (grant 32172176), and the Natural Science Foundation of Jiangsu Province of China (grant BK20201341).

Institutional Review Board Statement

Not applicable.

Informed Consent Statement

Not applicable.

Data Availability Statement

Not applicable.

Conflicts of Interest

The authors declare no conflict of interest.

References

  1. Jin, G.; Zhu, Y.; Xu, Y. Mystery behind Chinese liquor fermentation. Trends Food Sci. Technol. 2017, 63, 18–28. [Google Scholar] [CrossRef]
  2. Xing, G.; Zonghua, A.O.; Wang, S.; Deng, B.; Wang, X.; Dong, Z. Analysis of the Change in Physiochemical Indexes during the Production Process of Daqu of Different Temperature. Liquor-Mak. Sci. Technol. 2014, 11, 592421. [Google Scholar]
  3. Zou, W.; Zhao, C.Q.; Luo, H.B. Diversity and Function of Microbial Community in Chinese Strong-Flavor Baijiu Ecosystem: A Review. Front. Microbiol. 2018, 9, 671. [Google Scholar] [CrossRef] [PubMed]
  4. Du, H.; Wang, X.S.; Zhang, Y.H.; Xu, Y. Exploring the impacts of raw materials and environments on the microbiota in Chinese Daqu starter. Int. J. Food Microbiol. 2019, 297, 32–40. [Google Scholar] [CrossRef]
  5. Fan, G.S.; Fu, Z.L.; Teng, C.; Liu, P.X.; Wu, Q.H.; Rahman, M.K.R.; Li, X.T. Effects of aging on the quality of roasted sesame-like flavor Daqu. Bmc Microbiol. 2020, 20, 67. [Google Scholar] [CrossRef]
  6. Pan, L.; Lin, W.; Xiong, L.; Wang, X.; Luo, L. Environmental Factors Affecting Microbiota Dynamics during Traditional Solid-state Fermentation of Chinese Daqu Starter. Front. Microbiol. 2016, 7, 1237. [Google Scholar]
  7. Li, P.; Sha, L.; Cheng, L.; Luo, L. Analyzing the relation between the microbial diversity of DaQu and the turbidity spoilage of traditional Chinese vinegar. Appl. Microbiol. Biotechnol. 2014, 98, 6073. [Google Scholar] [CrossRef]
  8. Pang, X.N.; Han, B.Z.; Huang, X.N.; Zhang, X.; Hou, L.F.; Cao, M.; Gao, L.J.; Hu, G.H.; Chen, J.Y. Effect of the environment microbiota on the flavour of light-flavour Baijiu during spontaneous fermentation. Sci. Rep. 2018, 8, 3396. [Google Scholar] [CrossRef]
  9. Li, P.; Lin, W.F.; Liu, X.; Wang, X.W.; Gan, X.; Luo, L.X.; Lin, W.T. Effect of bioaugmented inoculation on microbiota dynamics during solid-state fermentation of Daqu starter using autochthonous of Bacillus, Pediococcus, Wickerhamomyces and Saccharomycopsis. Food Microbiol. 2017, 61, 83–92. [Google Scholar] [CrossRef]
  10. Wang, X.S.; Du, H.; Zhang, Y.; Xu, Y. Environmental Microbiota Drives Microbial Succession and Metabolic Profiles during Chinese Liquor Fermentation. Appl. Environ. Microbiol. 2018, 84, e02369-17. [Google Scholar] [CrossRef]
  11. Zheng, X.W.; Yan, Z.; Nout, M.J.R.; Smid, E.J.; Zwietering, M.H.; Boekhout, T.; Han, J.S.; Han, B.Z. Microbiota dynamics related to environmental conditions during the fermentative production of Fen-Daqu, a Chinese industrial fermentation starter. Int. J. Food Microbiol. 2014, 182, 57–62. [Google Scholar] [CrossRef] [PubMed]
  12. Fan, G.S.; Fu, Z.L.; Teng, C.; Wu, Q.H.; Liu, P.X.; Yang, R.; Minhazul, K.; Li, X.T. Comprehensive analysis of different grades of roasted-sesame-like flavored Daqu. Int. J. Food Prop. 2019, 22, 1205–1222. [Google Scholar] [CrossRef]
  13. Tkacz, A.; Hortala, M.; Poole, P.S. Absolute quantitation of microbiota abundance in environmental samples. Microbiome 2018, 6, 110. [Google Scholar] [CrossRef] [PubMed]
  14. Lin, Y.J.; Gifford, S.; Ducklow, H.; Schofield, O.; Cassar, N. Towards Quantitative Microbiome Community Profiling Using Internal Standards. Appl. Environ. Microbiol. 2019, 85, e02634-18. [Google Scholar] [CrossRef] [PubMed]
  15. Yang, L.; Lou, J.; Wang, H.Z.; Wu, L.S.; Xu, J.M. Use of an improved high-throughput absolute abundance quantification method to characterize soil bacterial community and dynamics. Sci. Total Environ. 2018, 633, 360–371. [Google Scholar] [CrossRef]
  16. Dannemiller, K.C.; Lang-Yona, N.; Yamamoto, N.; Rudich, Y.; Peccia, J. Combining real-time PCR and next-generation DNA sequencing to provide quantitative comparisons of fungal aerosol populations. Atmos. Environ. 2014, 84, 113–121. [Google Scholar] [CrossRef]
  17. Nishino, S.; Okahashi, N.; Matsuda, F.; Shimizu, H. Absolute quantitation of glycolytic intermediates reveals thermodynamic shifts in Saccharomyces cerevisiae strains lacking PFK1 or ZWF1 genes. J. Biosci. Bioeng. 2015, 120, 280–286. [Google Scholar] [CrossRef]
  18. Nayfach, S.; Pollard, K.S. Toward Accurate and Quantitative Comparative Metagenomics. Cell 2016, 166, 1103–1116. [Google Scholar] [CrossRef]
  19. Props, R.; Kerckhof, F.M.; Rubbens, P.; De Vrieze, J.; Sanabria, E.H.; Waegeman, W.; Monsieurs, P.; Hammes, F.; Boon, N. Absolute quantification of microbial taxon abundances. ISME J. 2017, 11, 584–587. [Google Scholar] [CrossRef]
  20. Liu, X.R.; Li, J.; Yu, L.; Pan, H.; Liu, H.Y.; Liu, Y.M.; Di, H.J.; Li, Y.; Xu, J.M. Simultaneous measurement of bacterial abundance and composition in response to biochar in soybean field soil using 16S rRNA gene sequencing. Land Degrad. Dev. 2018, 29, 2172–2182. [Google Scholar] [CrossRef]
  21. Jiang, S.Q.; Yu, Y.N.; Gao, R.W.; Wang, H.; Zhang, J.; Li, R.; Long, X.H.; Shen, Q.R.; Chen, W.; Cai, F. High-throughput absolute quantification sequencing reveals the effect of different fertilizer applications on bacterial community in a tomato cultivated coastal saline soil. Sci. Total Environ. 2019, 687, 601–609. [Google Scholar] [CrossRef] [PubMed]
  22. Du, R.B.; Wu, Q.; Xu, Y. Chinese Liquor Fermentation: Identification of Key Flavor-Producing Lactobacillus spp. by Quantitative Profiling with Indigenous Internal Standards. Appl. Environ. Microbiol. 2020, 86, e00456-20. [Google Scholar] [CrossRef] [PubMed]
  23. Vandeputte, D.; Kathagen, G.; D’Hoe, K.; Vieira-Silva, S.; Valles-Colomer, M.; Sabino, J.; Wang, J.; Tito, R.Y.; De Commer, L.; Darzi, Y.; et al. Quantitative microbiome profiling links gut community variation to microbial load. Nature 2017, 551, 507–511. [Google Scholar] [CrossRef]
  24. Lou, J.; Yang, L.; Wang, H.Z.; Wu, L.S.; Xu, J.M. Assessing soil bacterial community and dynamics by integrated high-throughput absolute abundance quantification. PeerJ 2018, 6, e4514. [Google Scholar] [CrossRef] [PubMed]
  25. Zhang, Z.J.; Qu, Y.Y.; Li, S.Z.; Feng, K.; Wang, S.; Cai, W.W.; Liang, Y.T.; Li, H.; Xu, M.Y.; Yin, H.Q.; et al. Soil bacterial quantification approaches coupling with relative abundances reflecting the changes of taxa. Sci. Rep. 2017, 7, 4837. [Google Scholar] [CrossRef]
  26. Smets, W.; Leff, J.W.; Bradford, M.A.; McCulley, R.L.; Lebeer, S.; Fierer, N. A method for simultaneous measurement of soil bacterial abundances and community composition via 16S rRNA gene sequencing. Soil Biol. Biochem. 2016, 96, 145–151. [Google Scholar] [CrossRef]
  27. Tourlousse, D.M.; Yoshiike, S.; Ohashi, A.; Matsukura, S.; Noda, N.; Sekiguchi, Y. Synthetic spike-in standards for high-throughput 16S rRNA gene amplicon sequencing. Nucleic Acids Res. 2017, 45, e23. [Google Scholar] [CrossRef]
  28. Nilsson, R.H.; Anslan, S.; Bahram, M.; Wurzbacher, C.; Baldrian, P.; Tedersoo, L. Mycobiome diversity: High-throughput sequencing and identification of fungi. Nat. Rev. Microbiol. 2019, 17, 95–109. [Google Scholar] [CrossRef]
  29. Ban, S.B.; Chen, L.N.; Fu, S.X.; Wu, Q.; Xu, Y. Modelling and predicting population of core fungi through processing parameters in spontaneous starter (Daqu) fermentation. Int. J. Food Microbiol. 2022, 363, 109493. [Google Scholar] [CrossRef]
  30. Rama, T.; Davey, M.; Norden, J.; Halvorsen, R.; Blaalid, R.; Mathiassen, G.; Alsos, I.; Kauserud, H. Fungi Sailing the Arctic Ocean: Speciose Communities in North Atlantic Driftwood as Revealed by High-Throughput Amplicon Sequencing. Microb. Ecol. 2016, 72, 295–304. [Google Scholar] [CrossRef]
  31. Zhang, L.J.; Cao, Y.L.; Tong, J.N.; Xu, Y. An Alkylpyrazine Synthesis Mechanism Involving L-Threonine-3-Dehydrogenase Describes the Production of 2,5-Dimethylpyrazine and 2,3,5-Trimethylpyrazine by Bacillus subtilis. Appl. Environ. Microbiol. 2019, 85, e01807-19. [Google Scholar] [CrossRef] [PubMed]
  32. Dhanasekaran, S.; Doherty, T.M.; Kenneth, J.; Grp, T.B.T.S. Comparison of different standards for real-time PCR-based absolute quantification. J. Immunol. Methods 2010, 354, 34–39. [Google Scholar] [CrossRef] [PubMed]
  33. Song, Z.W.; Du, H.; Zhang, Y.; Xu, Y. Unraveling Core Functional Microbiota in Traditional Solid-State Fermentation by High-Throughput Amplicons and Metatranscriptomics Sequencing. Front. Microbiol. 2017, 8, 1294. [Google Scholar] [CrossRef]
  34. Xu, W.; Huang, Z.Y.; Zhang, X.J.; Li, Q.; Lu, Z.M.; Shi, J.S.; Xu, Z.H.; Ma, Y.H. Monitoring the microbial community during solid-state acetic acid fermentation of Zhenjiang aromatic vinegar. Food Microbiol. 2011, 28, 1175–1181. [Google Scholar] [CrossRef] [PubMed]
  35. Caporaso, J.G.; Kuczynski, J.; Stombaugh, J.; Bittinger, K.; Bushman, F.D.; Costello, E.K.; Fierer, N.; Pena, A.G.; Goodrich, J.K.; Gordon, J.I.; et al. QIIME allows analysis of high-throughput community sequencing data. Nat. Methods 2010, 7, 335–336. [Google Scholar] [CrossRef] [PubMed]
  36. Bolger, A.M.; Lohse, M.; Usadel, B. Trimmomatic: A flexible trimmer for Illumina sequence data. Bioinformatics 2014, 30, 2114–2120. [Google Scholar] [CrossRef]
  37. Edgar, R.C.; Haas, B.J.; Clemente, J.C.; Quince, C.; Knight, R. UCHIME improves sensitivity and speed of chimera detection. Bioinformatics 2011, 27, 2194–2200. [Google Scholar] [CrossRef]
  38. Koljalg, U.; Larsson, K.H.; Abarenkov, K.; Nilsson, R.H.; Alexander, I.J.; Eberhardt, U.; Erland, S.; Hoiland, K.; Kjoller, R.; Larsson, E.; et al. UNITE: A database providing web-based methods for the molecular identification of ectomycorrhizal fungi. New Phytol. 2005, 166, 1063–1068. [Google Scholar] [CrossRef]
  39. French, K.E.; Tkacz, A.; Turnbull, L.A. Conversion of grassland to arable decreases microbial diversity and alters community composition. Appl. Soil Ecol. 2017, 110, 43–52. [Google Scholar] [CrossRef]
  40. Bustin, S.A.; Benes, V.; Garson, J.A.; Hellemans, J.; Huggett, J.; Kubista, M.; Mueller, R.; Nolan, T.; Pfaffl, M.W.; Shipley, G.L.; et al. The MIQE Guidelines: Minimum Information for Publication of Quantitative Real-Time PCR Experiments. Clin. Chem. 2009, 55, 611–622. [Google Scholar] [CrossRef]
  41. Rodriguez, A.; Luque, M.I.; Andrade, M.J.; Rodriguez, M.; Asensio, M.A.; Cordoba, J.J. Development of real-time PCR methods to quantify patulin-producing molds in food products. Food Microbiol. 2011, 28, 1190–1199. [Google Scholar] [CrossRef] [PubMed]
  42. Martinez-Blanch, J.F.; Sanchez, G.; Garay, E.; Aznar, R. Development of a real-time PCR assay for detection and quantification of enterotoxigenic members of Bacillus cereus group in food samples. Int. J. Food Microbiol. 2009, 135, 15–21. [Google Scholar] [CrossRef] [PubMed]
  43. Chen, B.; Wu, Q.; Xu, Y. Filamentous fungal diversity and community structure associated with the solid state fermentation of Chinese Maotai-flavor liquor. Int. J. Food Microbiol. 2014, 179, 80–84. [Google Scholar] [CrossRef]
  44. Li, H.; Huang, J.; Liu, X.P.; Zhou, R.Q.; Ding, X.F.; Xiang, Q.Y.; Zhang, L.Q.; Wu, C.D. Characterization of Interphase Microbial Community in Luzhou-Flavored Liquor Manufacturing Pits of Various Ages by Polyphasic Detection Methods. J. Microbiol. Biotechnol. 2017, 27, 130–140. [Google Scholar] [CrossRef] [PubMed]
  45. Li, X.R.; Ma, E.B.; Yan, L.Z.; Meng, H.; Du, X.W.; Zhang, S.W.; Quan, Z.X. Bacterial and fungal diversity in the traditional Chinese liquor fermentation process. Int. J. Food Microbiol. 2011, 146, 31–37. [Google Scholar] [CrossRef]
  46. Benito, A.; Jeffares, D.; Palomero, F.; Calderon, F.; Bai, F.Y.; Bahler, J.; Benito, S. Selected Schizosaccharomyces pombe Strains Have Characteristics That Are Beneficial for Winemaking. PLoS ONE 2016, 11, e0151102. [Google Scholar] [CrossRef]
  47. Yuangsaard, N.; Yongmanitchai, W.; Yamada, M.; Limtong, S. Selection and characterization of a newly isolated thermotolerant Pichia kudriavzevii strain for ethanol production at high temperature from cassava starch hydrolysate. Antonie Van Leeuwenhoek Int. J. Gen. Mol. Microbiol. 2013, 103, 577–588. [Google Scholar] [CrossRef]
  48. Su, C.; Zhang, K.Z.; Cao, X.Z.; Yang, J.G. Effects of Saccharomycopsis fibuligera and Saccharomyces cerevisiae inoculation on small fermentation starters in Sichuan-style Xiaoqu liquor. Food Res. Int. 2020, 137, 109425. [Google Scholar] [CrossRef]
  49. Yang, Y.R.; Zhong, H.Y.; Yang, T.; Lan, C.H.; Zhu, H. Characterization of the key aroma compounds of a sweet rice alcoholic beverage fermented withSaccharomycopsis fibuligera. J. Food Sci. Technol.-Mysore 2021, 58, 3752–3764. [Google Scholar] [CrossRef]
Figure 1. Length distribution and five ISFs. (A) Fungal ITS2 sequence length distribution. (B) The sequence lengths and GC contents of ISF I, II, III, IV, and V were 272 bp, 40% GC; 272 bp, 50% GC; 325 bp, 40% GC; 325 bp, 60% GC, and 387 bp, 40% GC, respectively. Spec indicates a specific fragment of 116 bp.
Fermentation 08 00345 g001
Figure 2. Selection of mixed ISP-added concentrations. (a) Standard curves of ISP II. (b) The extraction efficiency of ISP II in high-temperature mature Daqu. (c) Relative abundance of the high-temperature mature Daqu with different concentrations of ISP II added at the species level.
Fermentation 08 00345 g002
Figure 3. Verification of mixed ISP-added concentrations. (a) The regression equation of ISP II in high-temperature mature Daqu. (b) Melting curve of ISP II in high-temperature mature Daqu. (c) The extraction efficiency of ISP II in different mature Daqu.
Fermentation 08 00345 g003
Figure 4. Standard curves of 16 core fungi. (a) Based on ISP I, used for the absolute quantification of Hyphopichia burtonii and Wickerhamomyces anomalus. (b) Based on ISP II, used for the absolute quantification of Candida metapsilosis and Pichia kudriavzevii. (c) Based on ISP III, used for the absolute quantification of Saccharomycopsis fibuligera, Rhizopus microspores, and Rhodotorula mucilaginosa. (d) Based on ISP IV, used for the absolute quantification of Paecilomyces verrucosus, Thermomyces lanuginosus, Rasamsonia composticola, Monascus purpureus, and Aspergillus flavus. (e) Based on ISP V, used for the absolute quantification of Saccharomyces cerevisiae, Kazachstania bulderi, Lichtheimia ramose, and Schizosaccharomyces pombe.
Fermentation 08 00345 g004
Figure 5. Venn diagram of the fungal community in different mature Daqu. MQ: Medium-temperature Daqu, MHQ: Medium-high-temperature Daqu, and HQ: High-temperature Daqu.
Fermentation 08 00345 g005
Figure 6. Fungal community structure of different mature Daqu. (a) Principal coordinate analysis (PCoA) of the fungal communities based on Bray-Curtis distances. (b) Hierarchical clustering analysis (HCA) of fungal communities. Triplicate samples are shown as ‘#1’ to ‘#3’.
Fermentation 08 00345 g006
Figure 7. Comparison of the relative and absolute abundance of 16 core fungi. (a,c) Relative abundance of 16 core fungal communities in mature Daqu at the species level. (b,d) Absolute abundance of 16 core fungal communities in mature Daqu at the species level.
Fermentation 08 00345 g007
Figure 8. Veen diagram of the fungal community on Daqu surface and Daqu core during fermentation.
Fermentation 08 00345 g008
Figure 9. Principal coordinate analysis of fungi during Daqu fermentation. (A) Based on 1~6 stages during Daqu fermentation. (B) Based on 4~6 stages during Daqu fermentation.
Fermentation 08 00345 g009
Figure 10. The initial formation of the Daqu surface during fermentation. (A) The results of partial least squares regression between the Daqu surface and Daqu core in the fourth stage during fermentation. (B) Redundant analysis of the fungi and physical and chemical parameters in the fourth stage. *: p < 0.05 and **: p < 0.01.
Fermentation 08 00345 g010
Figure 11. The initial formation of the Daqu core during fermentation. (A) The results of partial least squares regression between the Daqu surface and Daqu core. *: p < 0.05. (B) The results of partial least squares regression between the Daqu core in the fourth stage and Daqu core in the fifth~sixth stages.
Fermentation 08 00345 g011
Figure 12. Network analysis of the key fungi in Daqu.
Fermentation 08 00345 g012
Table 1. Screened fungi and five ISFs a.
GroupITS2 LengthITS2 GC ContentISF LengthISF GC ContentCore Fungi
1231~300 bp39~42% GC272 bp40% GCKodamaea ohmeri, Hyphopichia burtonii, Wickerhamomyces anomalus
2231~300 bp45~52% GC272 bp50% GCCandida versatilis, Candida metapsilosis, Kazachstania humilis,
Pichia kudriavzevii.
3300~350 bp36~50% GC325 bp40% GCSaccharomyces sp., Rhizopus arrhizus, Saccharomycopsis fibuligera, Rhizopus microsporus, Rhodotorula mucilaginosa, Rhizomucor pusillus.
4300~350 bp56~63% GC325 bp60% GCCandida athensensis, Pichia sporocuriosa, Paecilomyces verrucosus, Aspergillus amstelodami, Aspergillus sp., Thermoascus crustaceus, Thermomyces lanuginosus, Rasamsonia composticola, Monascus purpureus, Thermoascus aurantiacus, Aspergillus flavus,
Leiotheciume llipsoideum, Aspergillus costiformis.
5350~413 bp31~44% GC387 bp40% GCSaccharomyces cerevisiae, Kazachstania bulderi,
Lichtheimiaceaeramosa, Schizosaccharomyces pombe.
a Based on 30 screened fungal ITS2 lengths and GC contents, which were divided into five groups as follows: sequence length < 300 bp, divided into 38–45% GC, 46–56% GC; sequence length 300–350 bp, divided into 36~50% GC, 56~63% GC; sequence length > 350 bp, divided into 31~49% GC. The average sequence length and GC content in each group were used as the sequence length and GC content of the corresponding ISF.
Table 2. Five ISPs and 16 core fungi.
ISP aCore FungiSource b
IHyphopichia burtoniiLBMAE
Wickerhamomyces anomalusLBMAE
IICandida metapsilosisLBMAE
Pichia kudriavzeviiLBMAE
IIISaccharomycopsis fibuligeraLBMAE
Rhizopus microsporusLBMAE
Rhodotorula mucilaginosaLBMAE
IVPaecilomyces verrucosusLBMAE
Thermomyces lanuginosusLBMAE
Rasamsonia composticolaLBMAE
Monascus purpureusLBMAE
Aspergillus flavusLBMAE
VSaccharomyces cerevisiaeLBMAE
Kazachstania bulderiLBMAE
Lichtheimia ramosaLBMAE
Schizosaccharomyces pombeLBMAE
a ISP with ISF I, ISF II, ISF III, ISF IV, and ISF V were named ISP I, ISP II, ISP III, ISP IV, and ISP V, respectively. b LBMAE, Lab of Brewing Microbiology and Applied Enzymology at Jiangnan University (the strains were isolated from fermented grains; all strains are available to the public for free).
Table 3. Comparison of the relative and absolute abundance of 16 core fungi.
Relative Abundance (%)Absolute Abundance (Cells/g)
FungiMedium-Temperature DaquMedium-High-Temperature DaquHigh-Temperature DaquMedium-Temperature DaquMedium-High-Temperature DaquHigh-Temperature Daqu
Hyphopichia burtonii2.02 ± 0.218.15 ± 0.1017.31 ± 0.524.30 × 105 ± 1.16 × 1052.66 × 105 ± 2.47 × 1043.62 × 104 ± 7.14 × 10³
Wickerhamomyces anomalus0.26 ± 0.023.33 ± 0.533.13 ± 0.282.57 × 105 ± 7.80 × 1041.05 × 106 ± 2.51 × 1052.65 × 104 ± 1.75 × 10³
Candida membranifaciens0.23 ± 0.020.12 ± 0.010.12 ± 0.012.23 × 104 ± 3.60 × 1031.12 × 104 ± 6.58 × 1033.86 × 102 ± 3.66 × 101
Pichia kudriavzevii6.13 ± 1.0916.07 ± 0.715.91 ± 0.538.11 × 104 ± 4.01 × 1057.28 × 104 ± 3.13 × 1041.94 × 103 ± 2.41 × 10²
Saccharomyces fibuligera82.33 ± 2.7541.79 ± 4.7433.41 ± 1.591.74 × 106 ± 2.25 × 1031.62 × 106 ± 2.57 × 1053.35 × 104 ± 1.38 × 10³
Rhizopus microsporus0.03 ± 0.010.10 ± 0.030.12 ± 0.061.97 × 104 ± 7.20 × 1039.68 × 104 ± 1.43 × 1041.12 × 103 ± 6.01 × 10²
Rhodotorula mucilaginosa0.06 ± 0.010.08 ± 0.000.09 ± 0.011.81 × 104 ± 4.15 × 1033.54 × 104 ± 4.19 × 1034.69 × 102 ± 7.16 × 101
Paecilomyces verrucosus0.03 ± 0.010.01 ± 0.011.90 ± 0.089.89 × 103 ± 2.87 × 1045.68 × 103 ± 1.14 × 1034.87 × 103 ± 1.01 × 10³
Thermomyces lanuginosus0.43 ± 0.068.61 ± 1.905.19 ± 0.934.56 × 105 ± 3.39 × 1045.13 × 106 ± 7.67 × 1036.72 × 104 ± 1.07 × 10⁴
Rasamsonia composticola0.03 ± 0.020.06 ± 0.031.3 ± 0.577.70 × 104 ± 5.51 × 1041.44 × 105 ± 4.80 × 1042.54 × 104 ± 1.93 × 10⁴
Monascus purpureus0.22 ± 0.030.19 ± 0.157.27 ± 0.672.48 × 105 ± 1.16 × 1052.60 × 104 ± 4.62 × 1047.04 × 104 ± 2.46 × 10⁴
Aspergillus flavus0.94 ± 0.610.52 ± 0.110.97 ± 0.037.96 × 104 ± 6.25 × 1046.23 × 104 ± 4.58 × 1042.43 × 103 ± 5.61 × 10²
Saccharomyces cerevisiae0.67 ± 0.091.05 ± 0.180.66 ± 0.102.18 × 105 ± 6.96 × 1045.16 × 105 ± 9.12 × 1047.14 × 103 ± 1.22 × 10³
Kazachstania bulderi0.11 ± 0.010.13 ± 0.010.17 ± 0.012.90 × 104 ± 8.87 × 1035.66 × 104 ± 7.90 × 1031.38 × 103 ± 6.60 × 101
Lichtheimia ramosa0.04 ± 0.020.80 ± 0.130.04 ± 0.012.46 × 105 ± 2.28 × 1057.37 × 106 ± 2.33 × 1053.48 × 103 ± 5.67 × 10²
Schizosaccharomyces pombe0.01 ± 0.000.01 ± 0.000.01 ± 0.004.26 × 105 ± 5.21 × 1048.72 × 105 ± 5.93 × 1052.02 × 103 ± 1.45 × 10³
Total abundance93.52 ± 2.4581.03 ± 1.8077.59 ± 1.084.36 × 106 ± 6.12 × 1051.76 × 107 ± 4.36 × 1052.86 × 105 ± 5.09 × 10⁴
Table 4. The relationship between the fungal community and physicochemicals in the fourth stage.
NameExplains %Contribution %Psedo-Fp
Moisture51.855.54.30.136
Reducing sugar33.535.96.80.042
pH8.18.72.40.218
Table 5. The relationship between fungal community and physicochemical in the Daqu core for 4~6 stages.
NameExplains %Contribution %Pseudo-Fp
Moisture19.143.91.70.194
Reducing sugar15.435.51.40.268
pH920.60.80.404
Publisher’s Note: MDPI stays neutral with regard to jurisdictional claims in published maps and institutional affiliations.

