Article

Recycling Food Waste and Saving Water: Optimization of the Fermentation Processes from Cheese Whey Permeate to Yeast Oil

1
Department of Food, Environmental and Nutritional Sciences (DeFENS), University of Milan, Via L. Mangiagalli 25, 20133 Milan, Italy
2
Department of Chemistry, University of Milan, Via Golgi 19, 20133 Milan, Italy
3
Department of Drug Sciences, University of Pavia, Viale Taramelli 12, 27100 Pavia, Italy
*
Author to whom correspondence should be addressed.
Fermentation 2022, 8(7), 341; https://doi.org/10.3390/fermentation8070341
Submission received: 28 June 2022 / Revised: 15 July 2022 / Accepted: 16 July 2022 / Published: 19 July 2022

Abstract

:
With the aim of developing bioprocesses for waste valorization and a reduced water footprint, we optimized a two-step fermentation process that employs the oleaginous yeast Cutaneotrichosporon oleaginosus for the production of oil from liquid cheese whey permeate. For the first step, the addition of urea as a cost-effective nitrogen source allowed an increase in yeast biomass production. In the second step, a syrup from candied fruit processing, another food waste supplied as carbon feeding, triggered lipid accumulation. Consequently, yeast lipids were produced at a final concentration and productivity of 38 g/L and 0.57 g/L/h respectively, which are among the highest reported values. Through this strategy, based on the valorization of liquid food wastes (WP and mango syrup) and by recovering not only nutritional compounds but also the water necessary for yeast growth and lipid production, we addressed one of the main goals of the circular economy. In addition, we set up an accurate and fast-flow cytometer method to quantify the lipid content, avoiding the extraction step and the use of solvents. This can represent an analytical improvement to screening lipids in different yeast strains and to monitoring the process at the single-cell level.

1. Introduction

The Green Deal promoted by the European Commission in 2020 represents an important framework for accelerating the transition to a circular economy as a social goal, promoting a new developmental model (EU 2020) [1]. In this context, the EU initiative for a zero-waste economy by 2025 has been pushing the development of new technologies for waste valorization as tools of sustainable management which can simultaneously increase profits for local economies [2,3]. In particular, exploitation of food wastes includes composting, the extraction of high-value compounds, the production of biomaterials, and the generation of biofuels. Among food wastes, cheese whey (CW) is one of the most available in the EU. Italian CW production could be estimated to be about 6 Mton per year. For 1 kg of cheese, approximately 10 L of CW is produced. CW is mainly composed of lactose (45–50 g/L), proteins (6–8 g/L), lipids (4–5 g/L), and minerals, mainly calcium, potassium, and phosphorus. Membrane filtration techniques allow for an efficient recovery of proteins from CW, generating whey permeate (WP) as a further stream. Nowadays, new applications in the food industry have been found for WP, such as an attractive source of non-sweetener sugars [4]. Nevertheless, due to a wide distribution of β-galactosidase among microbial species, CW and WP can also be used as nutrient sources for fermentation processes [5,6,7,8]. This includes the production of the so-called single-cell oil (SCO) accumulated by oleaginous yeasts [9,10,11]. Yeast SCO shows a fatty acid profile close to vegetable oils [12], making this microbial product attractive for biodiesel production. The increasing demand for biofuels raised the cost of vegetable oils, from which 90% of biodiesel is derived [13]. Therefore, microbial oil can represent a promising alternative to mitigate the ethical problems associated with the “food vs. fuel” issue. On the other hand, SCO could be a suitable supplement for animal and human nutrition due to its high content of unsaturated fatty acids [14]. Oleaginous yeasts show the ability to accumulate intracellular lipids up to 70% of their dry weight and are considered “easy” for industrial production, being fast-growing and not requiring land usage [15,16,17]. Lipid accumulation occurs on sugar-rich media in concomitance with the shortage of other nutrients, usually nitrogen, when the sugar concentration is still high. However, the cost of microbial oil manufacturing is still high, preventing implementation of the bioprocess on a large scale. Koutinas et al. [18] reported that the oil cost when using glucose as carbon source and the oleaginous yeast Rhodosporidium toruloides would be USD 5.5/kg at a glucose price of USD 0.4/kg. However, reduction of this cost could be achieved by the utilization of wastes as substrates and by the development of the biorefinery concept [19]. In addition, using liquid wastes such as WP can save fresh water, which is necessary for fermentations, decreasing the water footprint of the whole production process [20].
This study reports the valorization of food wastes by oleaginous yeasts as a promising means of implementation of biotechnological processes in a circular economy contest. By screening several oleaginous yeast species on liquid WP, we selected Cutaneotrichosporon oleaginosus as the best performing one and developed a two-step process for lipid production. In particular, for the first step, we tested the addition of nitrogen and nutrient sources in order to increase the amount of yeast biomass-producing lipids. In the second step, we tested the use of another food waste rich in sugar (i.e., a syrup from candied fruit processing) which was useful for triggering lipid accumulation. In addition, we set up a flow cytometry method as a fast approach (virtually in real time) which did not require lipid extraction to screen oleaginous species and monitor the progress of the process.

2. Materials and Methods

2.1. Strains and Growth Conditions

The yeast strains used in this work include Cutaneotrichosporon oleaginosus ATCC 20509 and ATCC 20508, Lipomyces lipofer DBVPG 6630, Lipomyces starkey DBVPG 6637, Cryptococcus albidus DBVPG 6110, Lipomyces lipofer ATCC 10742, Lipomyeces lipofer DBVPG 7048, and Lipomyces starkeyi NRRLY 1383 and CBS 1807.
For long-term storage, the yeast strains were maintained at −80 °C on 15% (v/v) glycerol.
The YPD medium contained 10 g/L yeast extract (Biolife, Milan, Italy), 20 g/L peptone (Biolife, Milan, Italy), and 20 g/L glucose (Sigma Aldrich, Milan, Italy).
The YNB medium contained yeast nitrogen base without amino acids and ammonium sulfate (0.17 g/L) (Difco BD, Milan, Italy), ammonium-sulfate (5 g/L), and 0.1 M MES hydrate (4-Morpholineethanesulfonic from Sigma Aldrich, Italy) to maintain a pH level of 6. The YNB –lactose contained lactose (Sigma Aldrich, Milan, Italy), added at 50 g/L, to simulate WP composition. For screening in the plates, 15 g/l of agar (Sigma Aldrich, Milan, Italy) was added to the same medium.
WP-based media were composed of liquid WP (provided by a local cheese factory, Latteria Soresina, stored at −20 °C until use) and supplemented with the following:
WPYE: 1 g/L of yeast extract (for shaken flask cultivation) or 2 g/L (for bioreactor cultivation);
WPYEU: 2 g/L of yeast extract and 2.28 g/L of urea (Sigma-Aldrich, Milan, Italy);
WPUC: 2.28 g/L of urea and 5 g/L of corn steep (Sigma-Aldrich, Milan, Italy);
WPYEU+M: 10 g/L of yeast extract and 2.28 g/L of urea.
All media were sterilized in an autoclave (Cavallo S.r.l., Milan, Italy) at 0.5 atm and at 112 °C for 30 min.
Precultures were performed by inoculating cells from the glycerol stocks and cultivation on YPD in bluffed flasks with an air-to-liquid ratio of 5:1 at 28 °C in a rotary shaker at 150 rpm overnight. After this time, the cells were harvested by centrifugation (5000 rpm/2300 rcf, 10 min in Eppendorf 5415D centrifuge) and inoculated at OD660 0.1 or 0.4 in bluffed flasks or in the bioreactor. Cell growth was monitored by measuring the increase in optical density at 660 nm (OD660) using a spectrophotometer (Eppendorf, Milan, Italy).

2.2. Fed-Batch Cultivation

Fed-batch cultures were performed in a 2-L bioreactor (ez2-Control from Applikon Biotechnology, Delft, The Netherlands) with a starting volume of 1 L. The temperature was set at 28 °C and the air inlet at 1 vvm, and foam formation was controlled by the addition of a silicone antifoaming agent (Sigma 204 from Sigma Aldrich, Milan, Italy). The dissolved oxygen concentration was measured by an AppliSens oxygen probe (Applikon Biotechnology, Delft, The Netherlands), starting from 100% saturation and controlled by a cascade system that allowed maintaining a constant level (>40%). The pH, measured by an AppliSens pH electrode (Applikon Biotechnology, Delft, The Netherlands), was automatically adjusted and maintained between 5.5 and 6.5 by adding 5 M KOH or a 10% (v/v) solution of H2SO4. At defined time points, aseptic sampling up to 15 mL was conducted using a peristaltic pump (Miniplus2 from Gilson, Milan, Italy).
For the feeding, a sterilized solution of 500 g/L of glucose (Sigma Aldrich, Milan, Italy) was supplied. In the case of WPYEU+M cultivation, sterilized and diluted (1:2) syrup from a candied fruits (mango) manufacture (SVZ, Industrial Fruit & Vegetable Ingredients, Breda, The Netherlands), containing 199 g/L glucose and 296 g/L fructose, was supplied. At the end of the process, cells were collected by centrifugation and freeze-dried for 24–48 h (Italian Vacuum Technology, Milan, Italy).

2.3. Sugars and Nitrogen Determination

The concentrations of the sugars during the fermentation processes were determined by employing commercial enzymatic kits (K-GLUHK, K-LACGAR and K-SUFRG from Megazyme, Wicklow, Ireland). All the assays were performed in triplicate, and the standard deviations varied between 1 and 5%. Inorganic nitrogen was determined by employing a commercial enzymatic kit (10542946035, R-Biopharm AG, Darmstadt, Germany).
The total nitrogen concentration in the culture supernatants was determined by the Kjeldahl method using a SpeedDigester K-376 and a KjelMaster K-375 (Buchi, Cornaredo, Italy).

2.4. Dry Weight Determination

Cells were collected from the medium (2 mL of cell culture) by centrifugation (10 min at 13,200 rpm/16,100 rcf in Eppendrof 5415D centrifuge). The pellets were dried overnight at 105 °C. The data were analyzed by one-way ANOVA with a post hoc Tukey HSD test using GraphPad Prism software. The biomass yield was calculated as the ratio between the total amount of biomass or products and the amount of consumed sugars.

2.5. β-Galactosidase Activity

To access the β-Galactosidase activity, 10 OD of cells were collected by centrifugation (5000 rpm for 3 min) after 22 h of growth on different media. Supernatants were separated in order to determine if β-galactosidase activity was secreted in the medium. To detect the intracellular enzyme, the pellets were resuspended in 500 µL of Z-buffer (10 g/L Na2HPO4, 5.5 g/L NaH2PO4, 0.75 g/L KCl, and 0.25 g/L MgSO4 plus 270 mL/L of β-mercaptoethanol), and approximately 500 µL of glass beads (425–600 µm, acid-washed, Sigma-Aldrich, St. Louis, MO, USA) was added. Cell lysis was performed using Tissue-lyzer LT (Qiagen, Hilden, Germany) for 10 cycles of 1 min at 50 oscillations per second and 1 min in ice. The total protein content was quantified by a Bradford protein assay in triplicate for each sample. The, 100 µL of supernatants or cell extracts were added to 1 mL of the Bradford reagent, and the absorbance was read at 595 nm after 5 min in the dark. The protein concentration was calculated by following the Bradford reagent stock’s calibration curve. The β-Galactosidase activity was assayed by a colorimetric assay. Absorbance variations at 420 nm were monitored every 10 s up to 5 min by a spectrophotometer (Eppendorf, Milan, Italy) in a Z-buffer (without β-mercaptoethanol) using 1.6 g/L ONPG. The β-Galactosidase activity was calculated in U/mL (1 U corresponds to the production of 1 nmol ONP/min), and the specific activity was obtained by dividing the β-galactosidase activity by the total protein concentration obtained by the Bradford assay.

2.6. Lipid Quantification

The lipid content was determined via the sulfo-phospho-vanilline colorimetric method (Spinreact, Girona, Spain) on the washed cell pellets, corresponding to approximately 30 OD, and suspended in 0.5 mL of cold redistilled water. The assays were performed in triplicate, and standard deviations varied between 1 and 5%. The data were analyzed by one-way ANOVA with a post hoc Tukey HSD test using GraphPad Prism software. The lipid yield was calculated as the ratio between the total amount of product and the amount of consumed carbon sources.

2.7. Lipid Profile Analysis

Lipids were extracted from the freeze-dried biomass (750 mg) by ultrasound-assisted treatment in n-heptane/i-PrOH (3:2) (30 mL) (0.25% w/v) and sonicated for 15 min. The obtained lipid fraction was resuspended in n-heptane and centrifuged (10,000 rpm for 4 min) to remove the non-soluble traces in the organic extract. The extraction yield (26%, 103 mg) was calculated by considering the amount of lipids in the yeast cells after lyophilization (60% w/w), determined by the colorimetric assay described above. In order to determine the lipid species in the microbial lipids (TAG, DAG, MAG, and FFA), the samples were analyzed by the GC/MS technique using an ISQ™ QD Single Quadrupole GC/MS (Thermo Fisher, Waltham, MA, USA). A Zebron-5MS plus (30 m; 0.32 mm; 1 micron, Phenomenex) was used as a chromatographic column. The injection volume was 1 µL, the oven program ranged from 150 °C (isothermal for 5 min) to 200 °C (isothermal for 5 min) at a rate of 10 °C/min and then to 300 °C (isothermal for 2 min) at a rate of 20 °C/min, and helium was used as the gas carrier. The SplitSplitless Inlet operated in Split Mode (10 mL/min). The inlet temperature was 280 °C, the flow rate was 1.0 mL/min, the MS transfer line was 300 °C, and the ion source was 270 °C. The ionization mode was set to electron ionization at 70 eV. The acquisition mode was a full scan (50–1000 Da). In order to compare the compositions of the samples, identification was carried out by comparing the acquired mass spectra with the NIST2014 library. Each component’s percentage content was directly computed from the peak areas in the GC/MS chromatogram. In order to determine the FA compositions of the microbial lipids, FAME were prepared by base-catalyzed transmethylation according to protocol FIL-IDF 182:1999 (FIL-IDF, 1999) [21]. Briefly, a sample of microbial lipids (100 mg) containing the internal standard C19Me (2.5 mL of standard stock solution, 10 mg/mL in n-heptane) was dissolved in 5 mL of n-heptane and submitted to direct transesterification with 0.2 mL of KOH/MeOH (10% w/v) at room temperature. The sample was vigorously mixed for 1 min, left to sit for 5 min, and neutralized by the addition of KHSO4 (500 mg). The mixture was centrifuged (3000 rpm for 5 min), and the supernatant containing the methyl esters was diluted at a 1:10 ratio and used for gas chromatography (GC) analysis.
GC/MS analyses were carried out on a Thermo Scientific DSQII single-quadrupole GC/MS system (TraceDSQII mass spectrometer, Trace GC Ultra gas chromatograph, TriPlus Autosampler; Thermo Scientific®, San Jose, CA, USA).
Chromatography was performed on an Rxi-5Sil MS capillary column (30 m length × 0.25 mm ID × 0.25 µm film thickness; Restek, Milan, Italy) with helium (>99.99%) as the carrier gas at a constant flow rate of 1.0 mL/min. An injection volume of 1 µL was employed. The injector temperature was set at 250 °C, and it was operated in split mode, with a split flow of 10 mL/min. The oven temperature was programmed to range from 45 °C (isothermal for 4 min) to 175 °C (isothermal for 27 min) at a rate of 13 °C/min and then to 215 °C (isothermal for 35 min) at a rate of 4 °C/min. The mass transfer line temperature was set at 250 °C. The total GC running time was 85 min.
All mass spectra were acquired with an electron ionization system (EI, Electron Impact mode) with an ionization energy of 70 eV and source temperature of 250 °C. Spectral acquisition was performed in Full Scan mode over a mass range of 35–650 Da. The chromatogram acquisition, detection of mass spectral peaks, and their waveform processing were performed using Xcalibur MS Software Version 2.1 (Thermo Scientific® Inc., Waltham, MA, USA). The assignment of chemical structures to chromatographic peaks was based on a comparison with the databases for the GC/MS NIST Mass Spectral Library (NIST 08) and Wiley Registry of Mass Spectral Data (8th Edition). The percentage content of each component was directly computed from the peak areas in the GC/MS chromatogram.

2.8. Confocal Laser Scanning Microscopy Evaluation

Cells of ATCC 20509 were collected after 18 and 90 h of cultivation in WPYEU, washed in PBS, and stained with Nile red (Sigma-Aldrich, St. Louis, MO, USA) and Hoechst 34580 (Thermo Fisher Scientific, Waltham, MA, USA) to evidence the LDs and yeast cells, respectively. The stock solutions were freshly prepared as previously described by D’Incecco et al. [22]. In brief, the stock solution of Nile red (1 mg/mL) was prepared in 80% dimethyl sulfoxide, while the stock solution of Hoechst 34580 (10 mg/mL) was prepared in MilliQ water. Staining was performed by incubating samples with 0.1 mg/mL Nile red and 12 µg/mL Hoechst 34580 in the dark at room temperature for 5 min. A drop of 8 µL of a stained sample was put onto a microscope slide and observed by using an inverted confocal laser scanning microscope A1+ (Nikon, Minato, Japan). The excitation/emission wavelengths were set at 488 nm/520–590 nm for Nile Red and at 405 nm/390–440 nm for Hoechst 34580. The images were processed using ImageJ software (Research Services Branch, National Institute of Health and Medicine, Bethesda, USA), and the analyze particles function was used to calculate the diameter of the LDs. The data were compared by a Student’s t-test (two-tailed distribution) using SPSS Win 12.0 software Version 28 (SPSS Inc. IBM Corp., Chicago, IL, USA).

2.9. Flow Cytometry for Lipid Quantification

One milliliter for each sample was centrifuged at 12,000 rpm for 5 min, washed twice in PBS (NaCl (137 mM), KCl (2.7 mM), Na2HPO4 (10 mM), and KH2PO4 (1.8 mM)), and diluted in PBS to have a final cell concentration of 0.5 OD. Then, 200 µL of the diluted solutions were stained with dyes. For the total cell count, the yeast cells were stained with 10 µL of SYBR Green I (Sigma-Aldrich, St. Louis, MO, USA) 1× for 15 min at 25 °C in the dark. The cells’ membrane integrity and vitality were assayed by staining them with 10 µL of propidium iodide (PI, (Sigma-Aldrich, St. Louis, MO, USA) at 5 µg/mL and incubating them in the dark for 15 min at 25 °C. The lipid droplets were stained by adding three different aliquots of BODIPY 493/503 (Thermo Fisher Scientific, Waltham, MA, USA): 0.75, 1.5, and 7.5 µM. Staining occurred for 15 min at 25 °C in the dark. The unstained samples were used to assay the background auto-fluorescence of cells, where the cells were diluted in PBS without any dye and used as blanks. After the staining, the solution was diluted again by adding 800 µL of PBS, bringing the cell concentration to 0.1 OD and having less than 2.000 events per second. Cell counting and fluorescence detection were performed using an Accuri C6 flow cytometer (BD Biosciences, Milan, Italy). The data were analyzed using BD AccuriTM C6 software version 1.0 (BD Biosciences, Milan, Italy). All the parameters were collected as logarithmic signals. A 488-nm laser was used to measure the FSC values.

3. Results

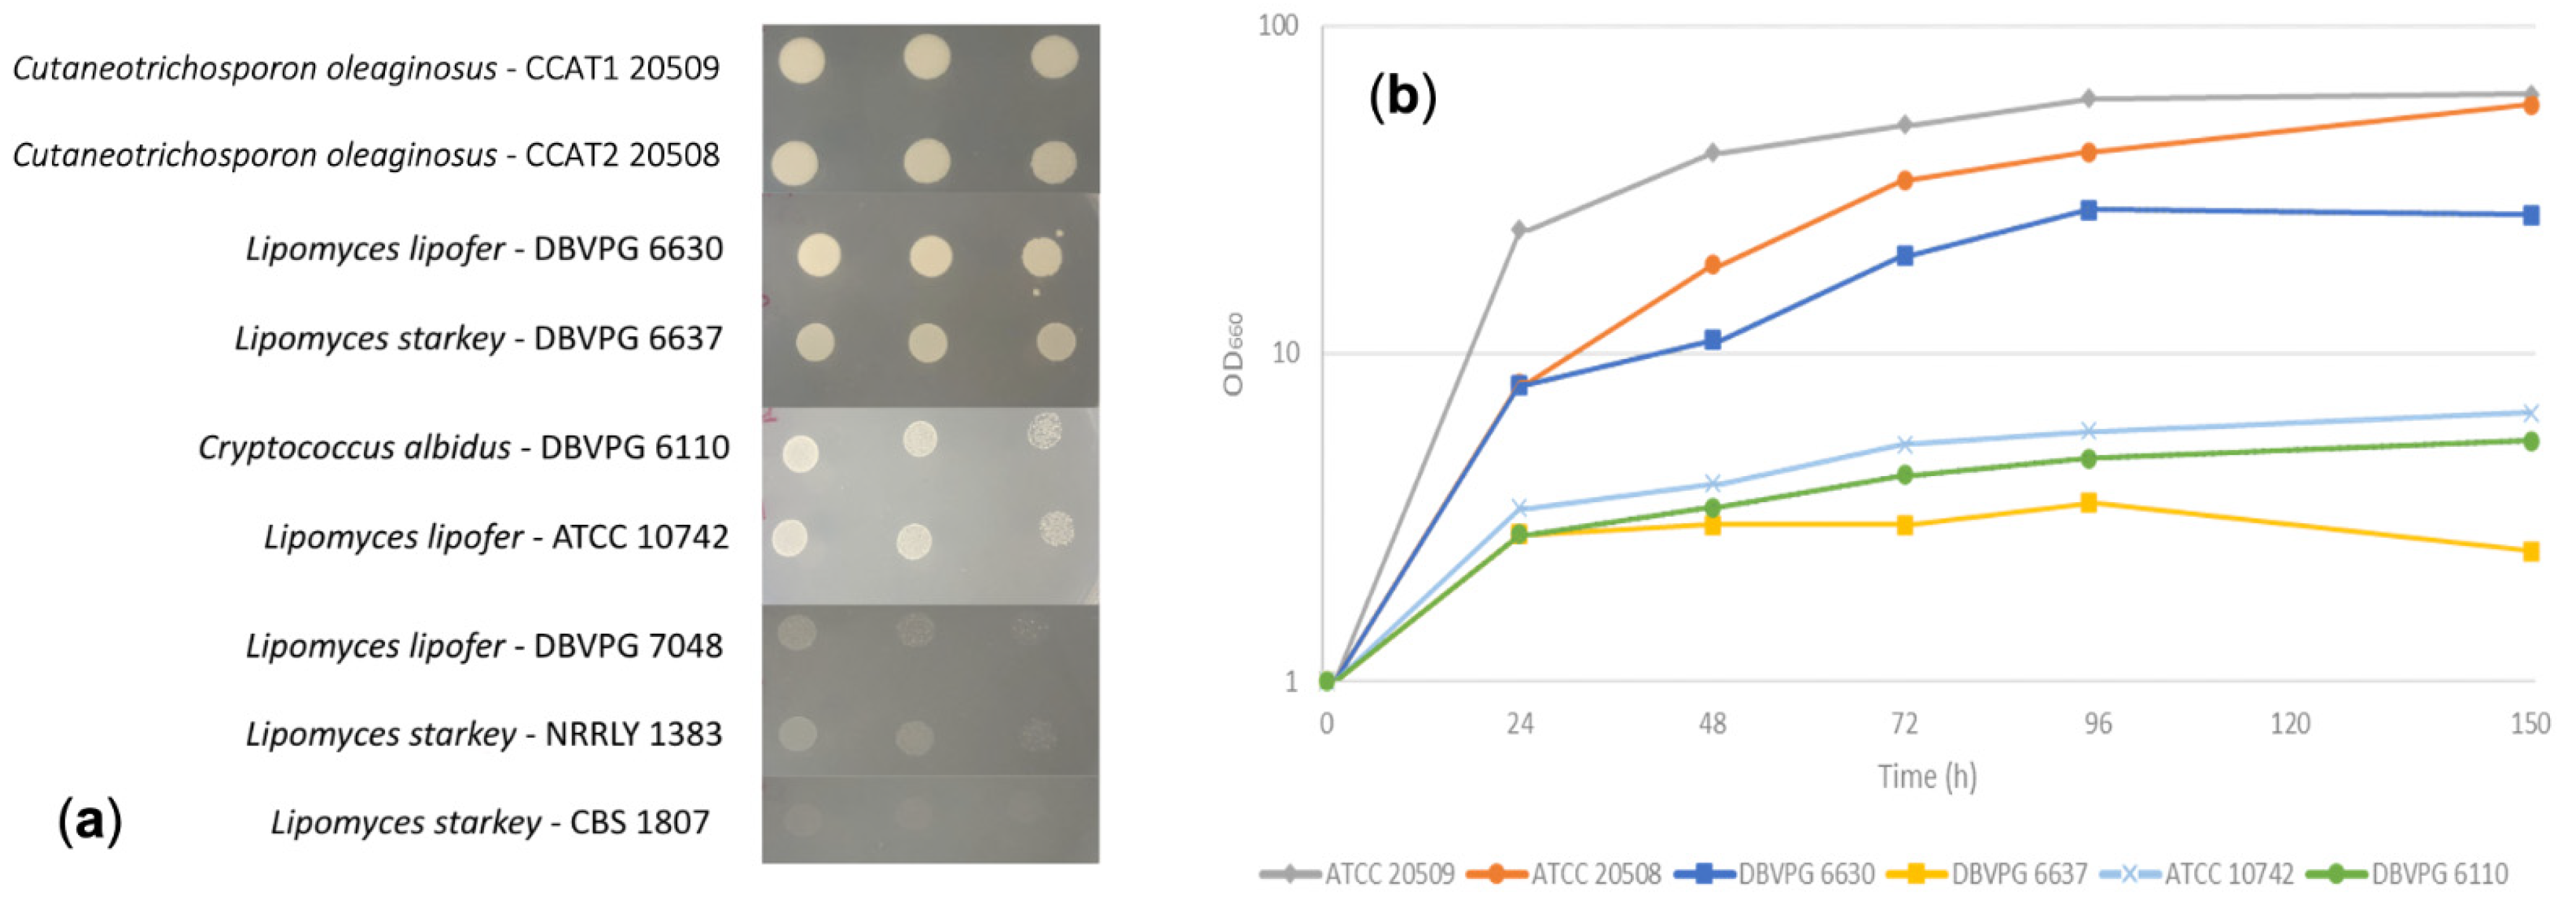
3.1. Screening of Oleaginous Species for Biomass and Lipid Biosynthesis on WP

Some species of oleaginous yeasts possess β-galactosidase activity and can use lactose, but this ability can be strain-specific. In order to verify the presence of this trait, 16 strains were cultivated on YNB-lactose plates. All the “red” strains (Rhodotorula/Rhodosporidium) were unable to grow, as well as Lipomyeces lipofer DBVPG 7048, and Lipomyces starkeyi NRRLY 1383 and CBS 1807. The strains able to grow were Cutaneotrichosporon oleaginosus ATCC 20509 and ATCC 20508, Lipomyces lipofer DBVPG 6630, Lipomyces starkey DBVPG 6637, and Lipomyces lipofer ATCC 10742 and Cryptococcus albidus DBVPG 6110 (Figure 1a).
These strains were then cultivated on WP to study how they used this waste as a growth medium. WP contains lactose and nitrogen at, on average, 50 ± 4.0 g/L and 0.28 ± 0.01 g/L, respectively. Each strain was grown in shaken flasks, and samples were collected for analysis. L. starkey DBVPG 6637, L. lipofer ATCC 10742, and C. albidus DBVPG 6110 were not able to efficiently grow on WP, producing less than 6 g/L of biomass dry weight (OD lower than 10, Figure 1b). The L. lipofer DBVPG 6630 and C. oleaginosus strains reached higher OD values, ranging from 26 to 57 (Figure 1b). However, lipid analyses revealed that only the two C. oleaginosus strains accumulated a high amount of lipids, corresponding to an intracellular content of 50–60% of their dry weight (DW).
Based on the consideration that WP contains low amounts of nitrogen and other essential nutrients, such as vitamins and trace elements, another set of flask cultivations was performed on WP supplemented with YE (WPYE) to supply these nutrients. For these experiments, the ATCC 20508 strain was not included due to its high similarity in terms of biomass and lipid production with ATCC 20509 and due to better knowledge of the latter strain arising from previous studies performed at our laboratory [23]. Under these conditions, the main positive effect caused by the presence of YE was in terms of the sugar consumption rate (Figure 2a). The cells consumed lactose faster, being almost exhausted after 72 h, in comparison to the sole WP, in which 25 g/L of disaccharide was still present at this time (Figure 2a). This resulted in faster biomass and lipid production, which reached the highest concentrations after 72 h (Figure 2b). The final biomass and lipid concentrations increased in the presence of YE, leaving the cellular lipid content substantially unaltered (Figure 2b).
The β-galactosidase activity was tested by cultivating ATCC 20509 on both YPD and YNB-lactose, with the aim of understanding whether the enzyme is constitutively expressed or rather induced by the presence of lactose. The absence of lactase activity in the supernatants (Table 1) proved that the enzyme was localized at the intracellular level, but since no activity was detected in the YPD-grown cells, the presence of lactose proved to be necessary for inducing β-galactosidase expression.

3.2. Confocal Laser Scanning Microscopy of C. oleaginosus ATCC 20509

The morphology of the cells and lipid droplets (LDs) of the selected C. oleaginosus ATCC 20509 strain was investigated by confocal laser scanning microscopy (CLSM) in samples collected after 18 and 90 h of cultivation in WP with no additions. The cells were simultaneously stained with two fluorescent dyes (i.e., Hoechst 34580 and Nile red) to evidence the cells and lipid domains, respectively. Images were acquired using either Hoechst 34580 or Nile red fluorescence channels as well as a bright field (Figure 3). By merging all channels (Figure 3a), the cells at 18 h of cultivation were shown to contain a single large vacuole or multiple smaller vacuoles as well as other organelles. By excluding the bright field channel, multiple small LDs were clearly visible (Figure 3b). After 90 h of cultivation, the LDs significantly (p < 0.001) expanded in size, with the average diameter increasing from 0.63 ± 0.3 µm to 2.72 ± 1.0 µm (Figure 3c,d), as found by the image analysis (Figure S1). In this case, cells containing a single LD prevailed, and the LDs occupied most of the intracellular space at the expense of vacuoles that were no longer distinguishable from other organelles. Interestingly, in most of the cells after 90 h, the LDs were localized in the middle of the cell and occasionally at its poles.

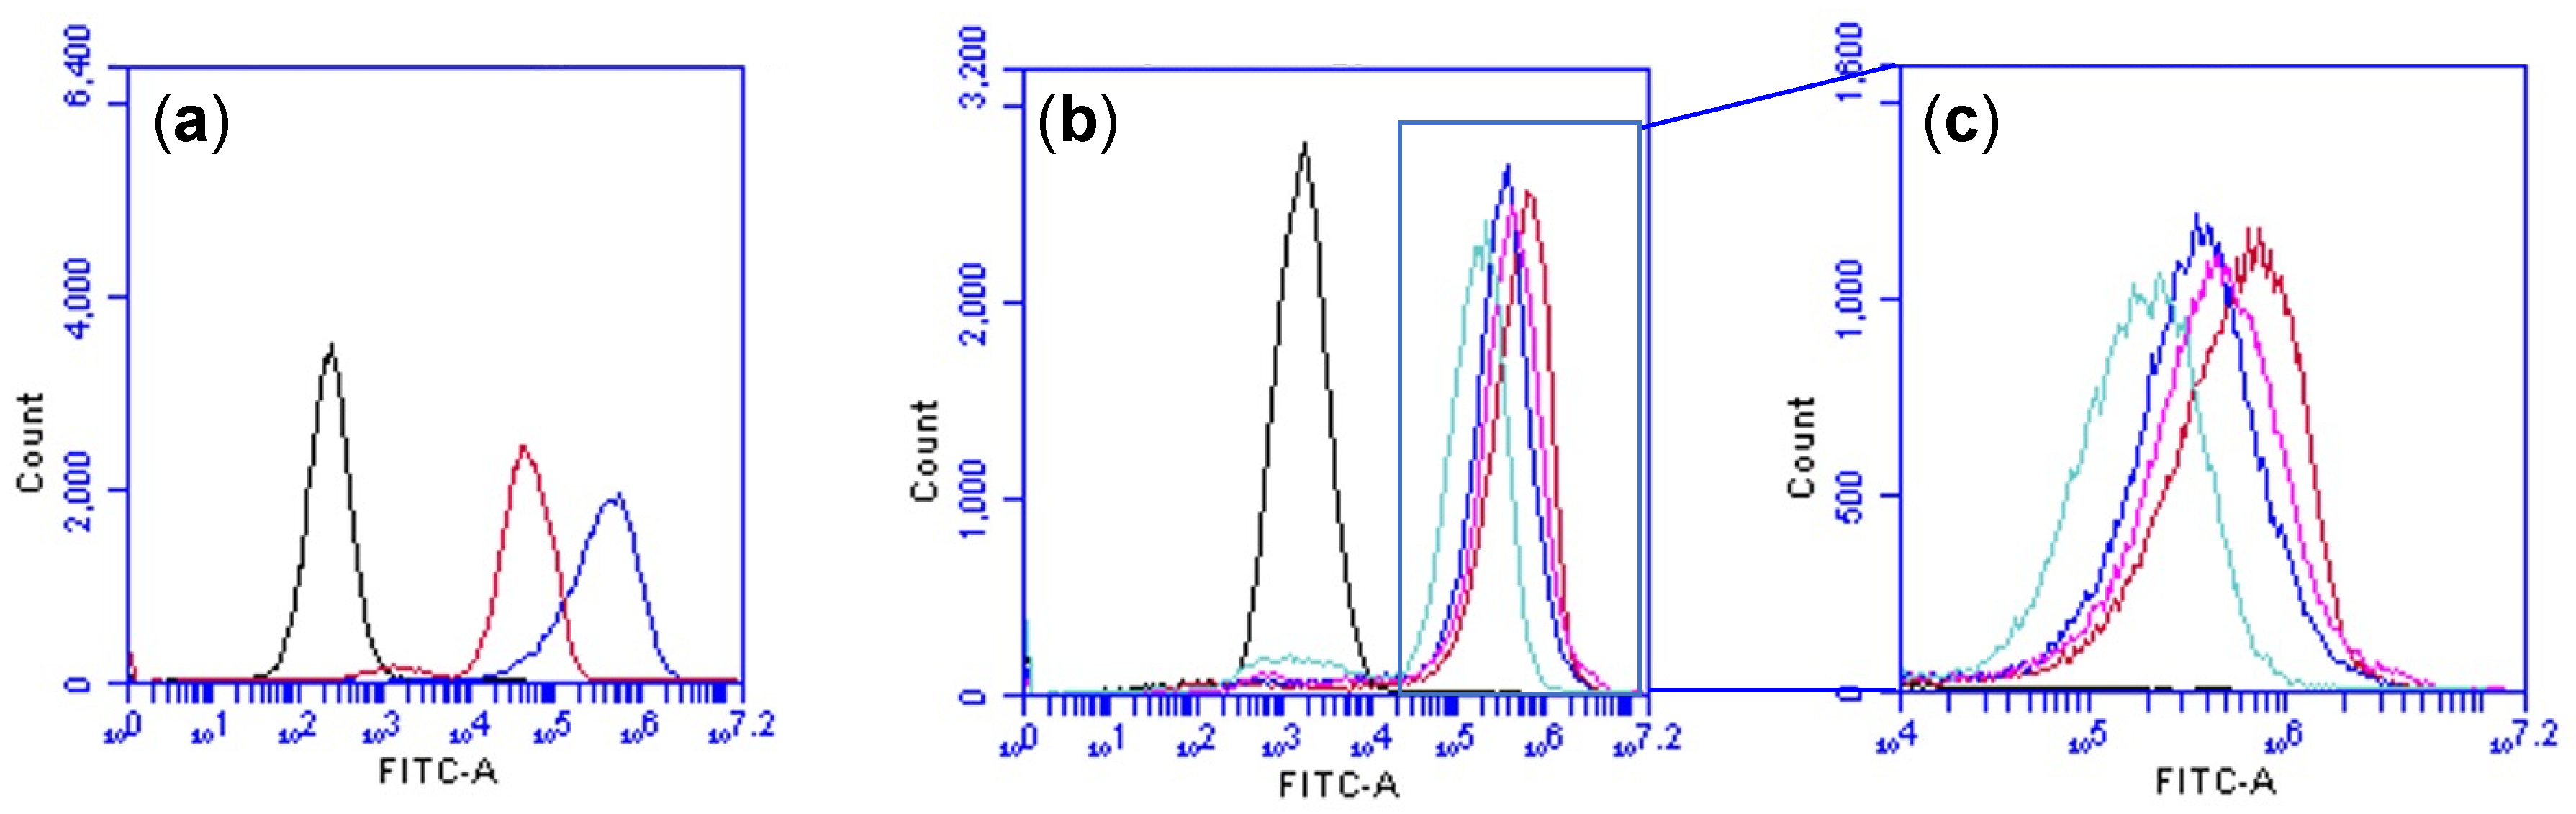
3.3. Set-up of a Lipid Quantification Protocol by Flow Cytometry

Flow cytometry can be employed to analyze the lipid content in a faster way that does not require lipid extraction. With this aim, we developed a quantitative method that could be applied not only to screening oleaginous strains but also to monitoring the lipid production process.
Three different dyes were utilized to stain the cells. First, SYBR green, a dye that permeates across the cell membrane and binds to DNA, was used to stain all the cells, and this allowed counting the total cell number (Figure S2). Propidium iodide was used to detect the presence of damaged or dead cells. In fact, this dye binds to DNA like SYBR green, but it cannot permeate across the cell membrane. Therefore, it was used to stain cells with damaged membranes (most likely dead) [24]. In all samples, the percentage of damaged or dead cells was found to be under 5%. (Figure S2).
Finally, the LDs were stained with BODIPY 493/503, a dye that emits a green light in hydrophobic environments. In order to standardize the lipid content evaluation, three concentrations of BODIPY 493/503 (0.75, 1.5, and 7.5 μM) were tested on samples collected from the flask cultures on WPYE. BODIPY 493/503 staining was performed in parallel with the lipid concentration assayed by the colorimetric method (see Materials and Methods).
The FACS histograms in Figure 4a–b show the BODIPY 493/503 fluorescence (in the FITC-H channel) detected in samples collected after 24 h (Figure 4a) and 90 h (Figure 4b) of the process and stained with different concentrations of the dye. All the concentrations provided complete histograms after 24 h of growth, as the values were into the instrument’s logarithmic scale range (100.9–107.2, not editable) due to the low lipid content of the cells. However, in the second graph (Figure 4a), the distribution of stained cells shifted to the right toward higher values. This was due to the fact that after 90 h of cultivation, the cells accumulated high amounts of lipids. In this case, the distribution obtained by using 7.5 μM of dye (blue line) was partially over the instrument readable scale. On the contrary, the histograms obtained with 0.75 and 1.5 μM of dye remained readable and were superimposable (Figure 4b). In light of these results, a BODIPY 493/503 concentration of 1.5 μM was used for subsequent analyses. In order to verify if there was a linear correlation between the cytometer and the colorimetric assay outputs, select samples collected at different times were analyzed for their lipid contents by the two methods. The line (Figure 4c) correlating the average fluorescence intensity values with the respective lipid amounts demonstrates that, using the chosen dye concentration, there was a strong linearity, with an R2 value of 0.99. Based on this evidence, flow cytometry was assumed to be a reliable analytical tool for rapid quantification of the cellular lipid content.
Once we confirmed this linearity, we used flow cytometry as a screening tool. A clear difference was observed in the histograms which correlated with the amount of lipids assayed by the colorimetric method (Figure 4d). For the ATCC 20509 and ATCC 20508 cells, which contained lipids at 40.0% and 47.1%, respectively (% of DW), the histograms were almost superimposed. For the DBVG 6630 cells, which produced lipids at 21.6%, the histogram corresponded to a lower amount of fluorescence (Figure 4d). In addition, since flow cytometry returns segregated data, meaning referring to single cells, it was possible to observe that the distributions of the fluorescence intensity of the ATCC 20509 sample were more homogeneous than in the 20508 strain (Figure 4d, red and green lines), an aspect that could not be detected trough the colorimetric method and which returned the average lipid content of the entire cell population. These results, confirming the previous screening results, demonstrate that flow cytometry can be a useful instrument for a time-saving and accurate screening of the lipid contents in cell populations.

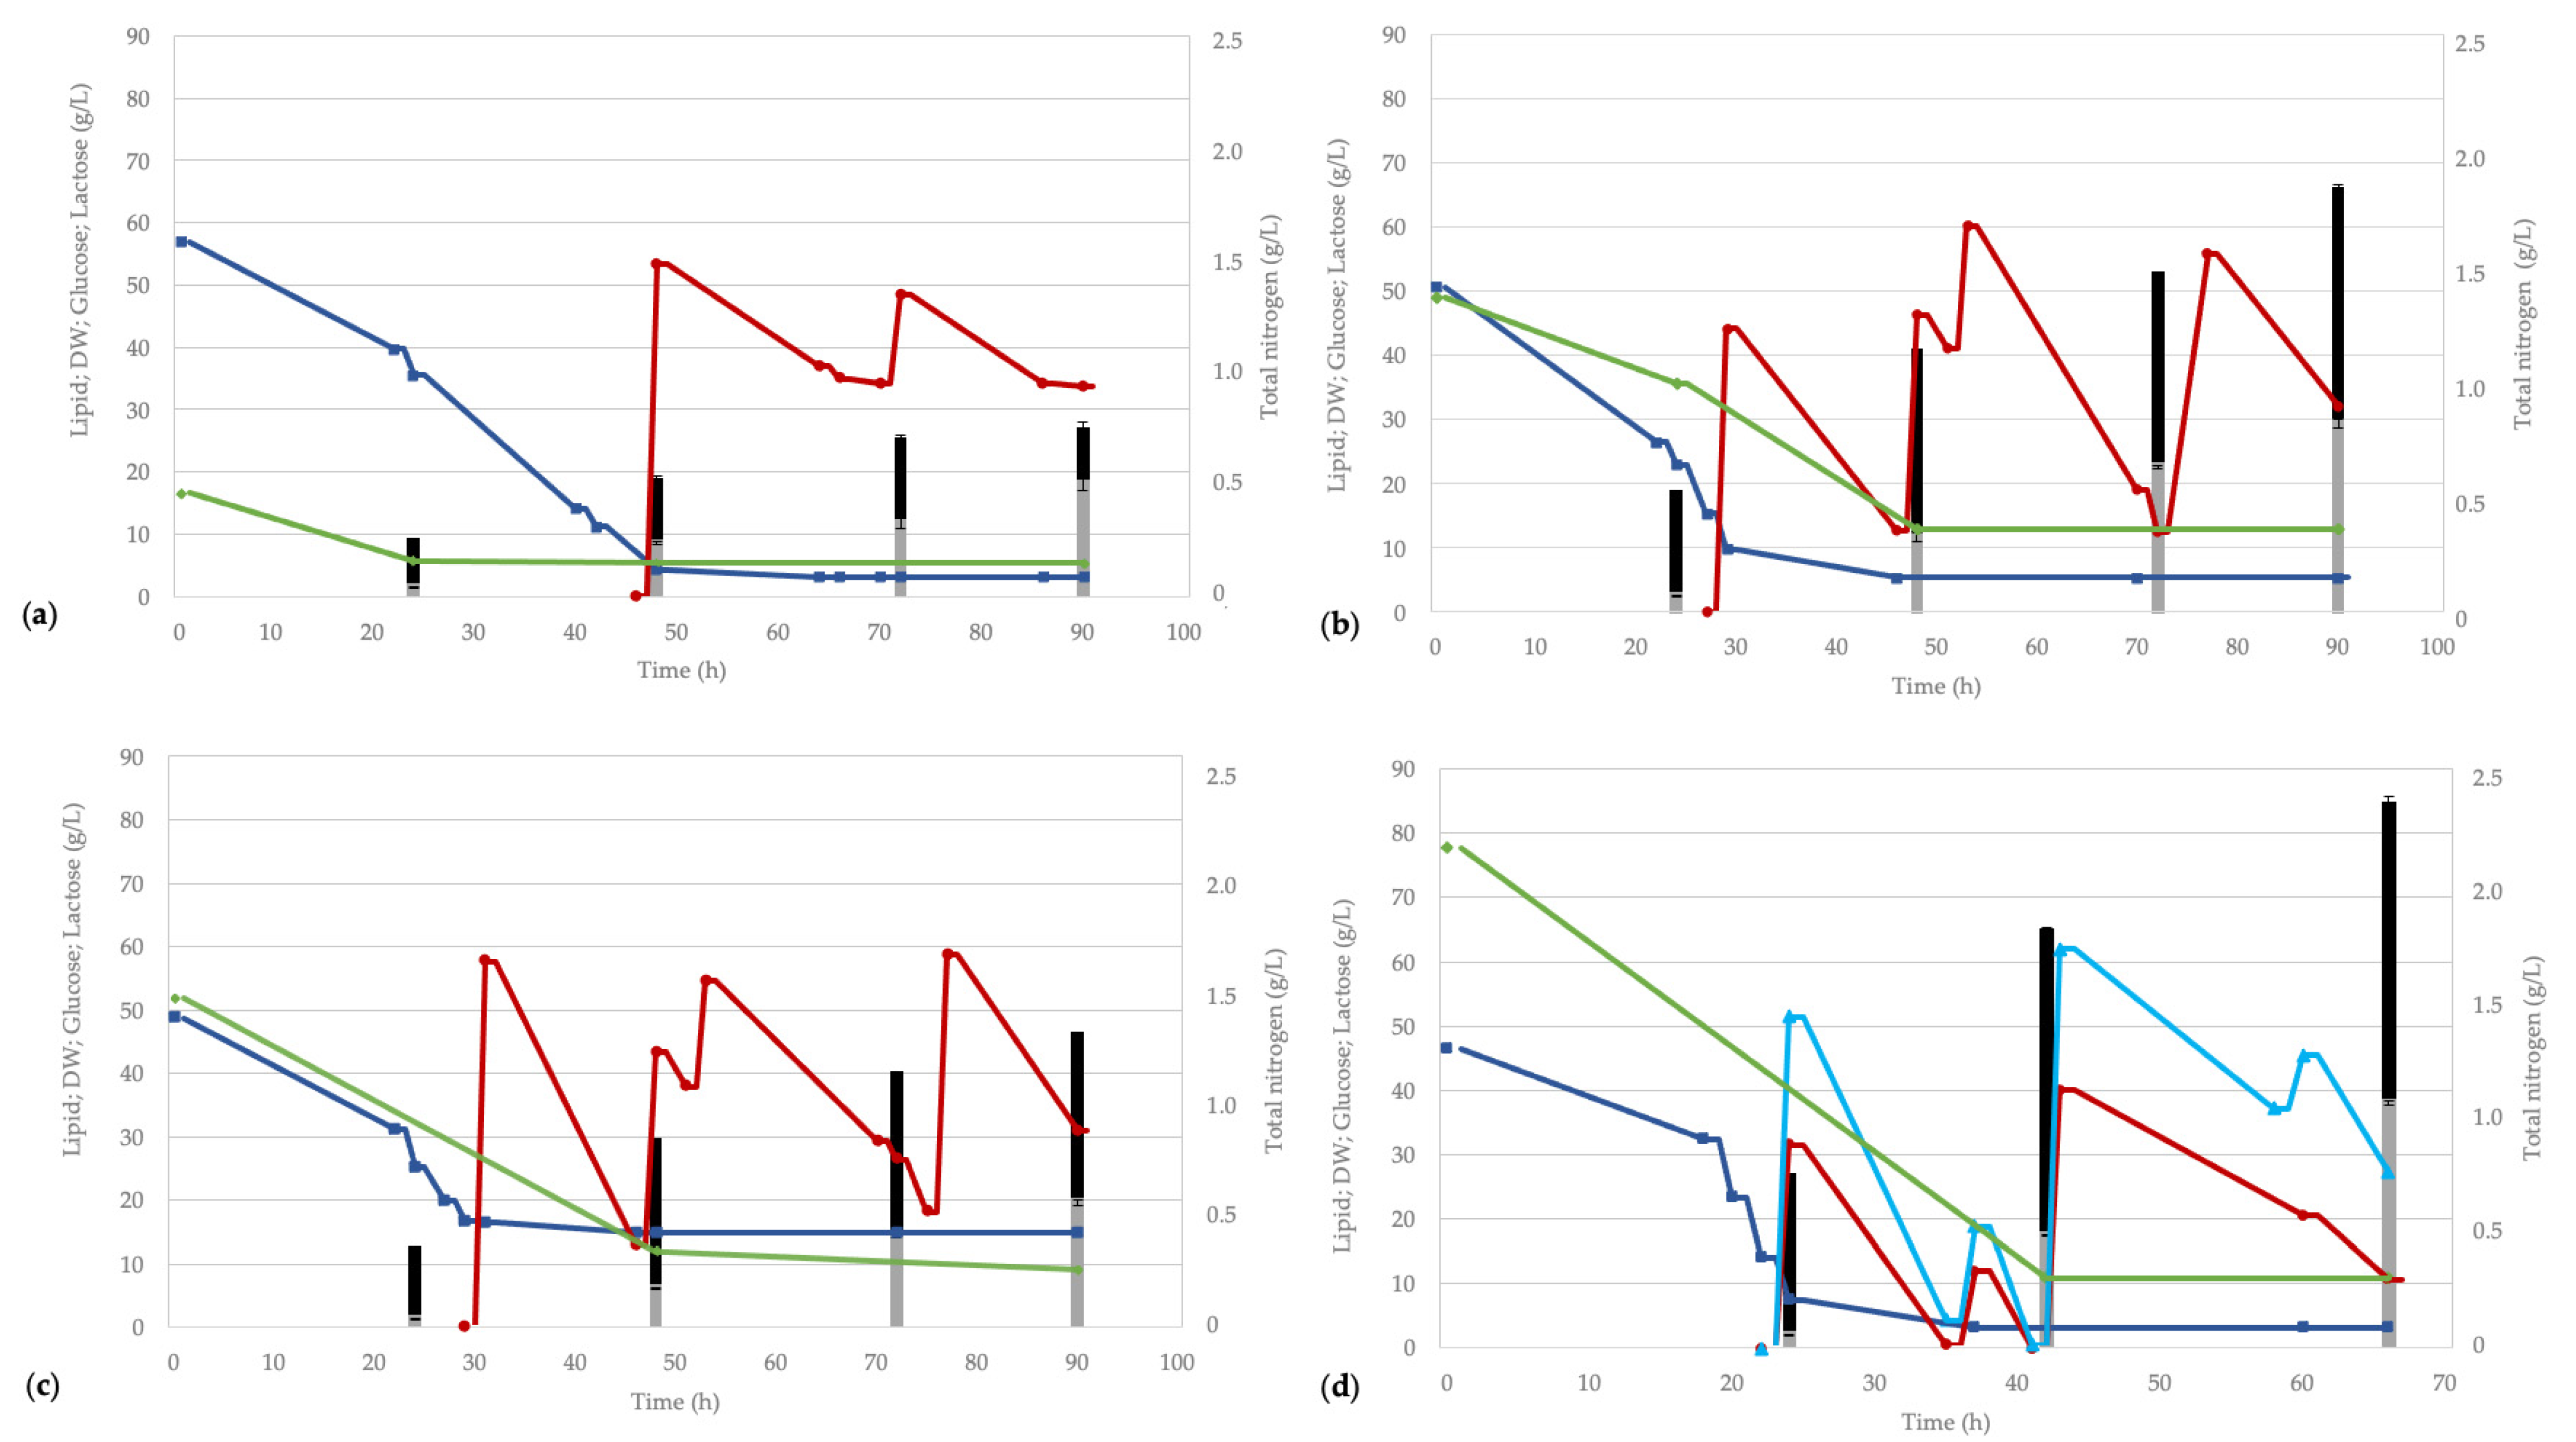
3.4. Processes in a Bioreactor on Whey Permeate-Based Media

In order to optimize the conditions for developing an industrial process, cultivations in a 2-L bioreactor were performed. From the screening results, C. oleaginosus ATCC 20509 was selected as the best performing yeast in terms of biomass and lipid production on WP. Different medium compositions were tested to study the effects of supplying nitrogen and other nutrients for improving the process. All the cultivations were carried out in two steps. The first step, corresponding to the cell growth phase, was designed to provide a defined amount of nitrogen and nutrients for biomass synthesis. The second step was designed to promote the accumulation of intracellular lipids, including carbon source additions, to increase the C/N ratio of the medium. Carbon feeding was applied before the lactose was exhausted to avoid carbon starvation, which would negatively affect lipid accumulation. Nevertheless, we noticed that the addition of glucose inhibited lactose utilization, and then glucose feeding needed to be started when a low lactose concentration was reached in order to efficiently exploit the WP sugar content.
The first process (Figure 5a) was run on WP supplemented with YE (WPYE) and likewise cultivation in flask at a C/N ratio of 60.50 (Table 2). Under these conditions, C. oleaginosus grew at a rate of 0.26 h−1 (Table 2). Due to the higher amount of YE and dissolved oxygen, and under controlled pH conditions, C. oleaginosus developed a higher biomass concentration of 26.5 ± 0.27 g/L in comparison with the flask cultivations. The high C/N ratio of this medium allowed the cells to rapidly reach the metabolic phase of lipid accumulation. After 48 h of the process, the lipid content in fact represented 46% of the DW (Figure 5a). At this point, with the lactose almost totally consumed, glucose feeding was started. This restored a high C/N ratio which boosted lipid accumulation, resulting in a final lipid content of 68%, being among the highest ever registered for this strain [25,26,27]. This corresponded to a final lipid production of 18.0 ± 1.3 g/L (Table 2). In conclusion, under these conditions, lipids were produced with a yield of 0.21 (calculated on the total sugar utilized) and a productivity of 0.2 g/L/h.
With the purpose of pushing the first phase for high biomass formation, the amount of available nitrogen was increased, and urea was chosen as the nitrogen source. Urea is an organic source and can be considered a waste [28] which is more suitable than ammonium salts for industrial uses, in particular to develop processes with a focus on circular economy. Urea can enter the cell through passive diffusion, facilitated diffusion, or via urea active transport. Inside the cell, urea is hydrolyzed by urease into two molecules of ammonia and one molecule of CO2 [29], avoiding intracellular acidification. In C. oleaginosus 20509, the presence of genes encoding for urea transport and urease has been reported [29], as well as urea utilization [30].
When urea was provided as a nitrogen source (WPYEU, Figure 5b), C. oleaginosus registered a higher growth rate in comparison with the process without nitrogen’s addition (Table 2), and as expected, a higher final biomass concentration was reached (65.5 ± 1.2 g/L). Nevertheless, due to the lower initial C/N ratio of this medium, the cells accumulated a lower lipid content in the first step, being 30% of DW (Figure 5b). The urea was depleted after 48 h, but other organic nitrogen was still available (Figure 5b). By applying glucose feeding, the C/N ratio increased, and after 94 h of the process, the lipid content represented 45% of DW. Due to the higher amount of cells produced, the final lipid concentration reached 29.4 ± 0.6 g/L with a lipid productivity of 0.31 g/L/h, which were higher values in comparison with the process on WPYE (Table 2). These results indicate that adding urea allows for a better exploitation of the provided carbon sources in terms of biomass and lipid production, improving the final lipid concentration and productivity. It is noteworthy that in this process, 15 mL of alkali solution is required to keep the pH at 6. When the process was performed by supplying ammonium sulfate, a salt widely used in the laboratory as well as in some industrial processes as nitrogen source, C. oleaginosus reached a non-significant different final lipid concentration (27.8 ± 1.8 g/L against 29.4 ± 0.6 g/L in WPYEU). However, we observed that to keep the pH value at 6, 26 mL of alkali solution was needed due to the strong acidification caused by ammonium sulfate utilization. Charged ammonium (NH4+) is imported by ammonium permeases. Inside the cell, it dissociates into ammonia and protons, which are exported from the cell by the H+-ATPase in order to maintain the pH homeostasis [31]. This results in medium acidification, which requires a further alkali addition to maintain a stable pH during the process. At the industrial level, this represents a further cost that can be then avoided by using urea, together with the consideration that urea is a cheaper source.
With the aim to obtain a process completely based on waste utilization, we attempted to substitute YE by corn steep liquor, a byproduct of the corn wet-milling industry. It contains nutrients essential for microbial growth such as amino acids, vitamins, and minerals, and thus it may represent a useful and cheap additive for microbial applications [32]. To perform this process (WPUC), urea was chosen as a nitrogen source. Under these conditions, C. oleaginosus produced a lower amount of total biomass (46 ± 0.51 g/L) with a lipid content of 43%, corresponding to a final lipid concentration of 19 ± 0.4 g/L (Table 2). In conclusion, despite the C/N ratio in this process being similar to the one with YE, corn steep liquor seems to represent a poorer substitute for YE in biomass production.
To further improve the use of wastes as feedstock for the whole process, feeding of pure glucose was replaced by another industrial food waste coming from the production of candied fruits (a syrup from mango processing). This waste contains a high concentration of glucose and fructose, making it a suitable supplement for maintaining a high C/N ratio [33]. In this process (WPYEU+M, Figure 5d), urea provided nitrogen, and the initial amount of YE was increased to enrich the medium with essential nutrients, boosting the growth phase. The goal was reached (Table 2), as the cells grew at the highest growth rate, and the highest final concentrations of biomass and lipids were obtained (84 ± 1.27 g/L and 38 ± 1.0 g/L, respectively) in the shortest time, corresponding to the highest lipid productivity (0.57 g/L/h).
In conclusion, these strategies allow one to optimize and reduce the cost of the process for yeast lipid production through the recycling of food wastes (i.e., WP and syrup from candied fruit processing) and using urea as a cheap nitrogen source and pH control. In addition, by this process, it is also possible to reduce the water footprint, exploiting the water content of WP.

3.5. Monitoring the Process with Flow Cytometry

Based on the described results, to screen lipid accumulation in different yeast strains using flow cytometry, this technique, which requires almost 30 min, was applied to monitor the production process. First, we compared the amount of lipid produced at an early point (after 18 h) and at the final point (90 h) of the process performed on WPYE. A clear difference resulted in the histograms representing the fluorescence of cells stained at the two different phases of lipid production. As shown (Figure 6a), the cell fluorescence increased after 90 h of the process (blue line) due to the lipid accumulation process. In particular, we could notice in the cell population stained after 18 h (Figure 6a, red line) a small subpopulation containing a low amount of lipids, which completely disappeared in the cell population stained after 90 h.
In order to obtain a more detailed view on the accumulation dynamic, the process on WPYEU was monitored at several times (after 26, 55, 75, and 95 h). A shift in the fluorescence intensity signal toward higher values in the samples collected over time was clearly visible, indicating that the progress of lipid accumulation occurred in all the cells (Figure 6b,c). In conclusion, we show that flow cytometry represents a fast and accurate method for monitoring lipid production processes.

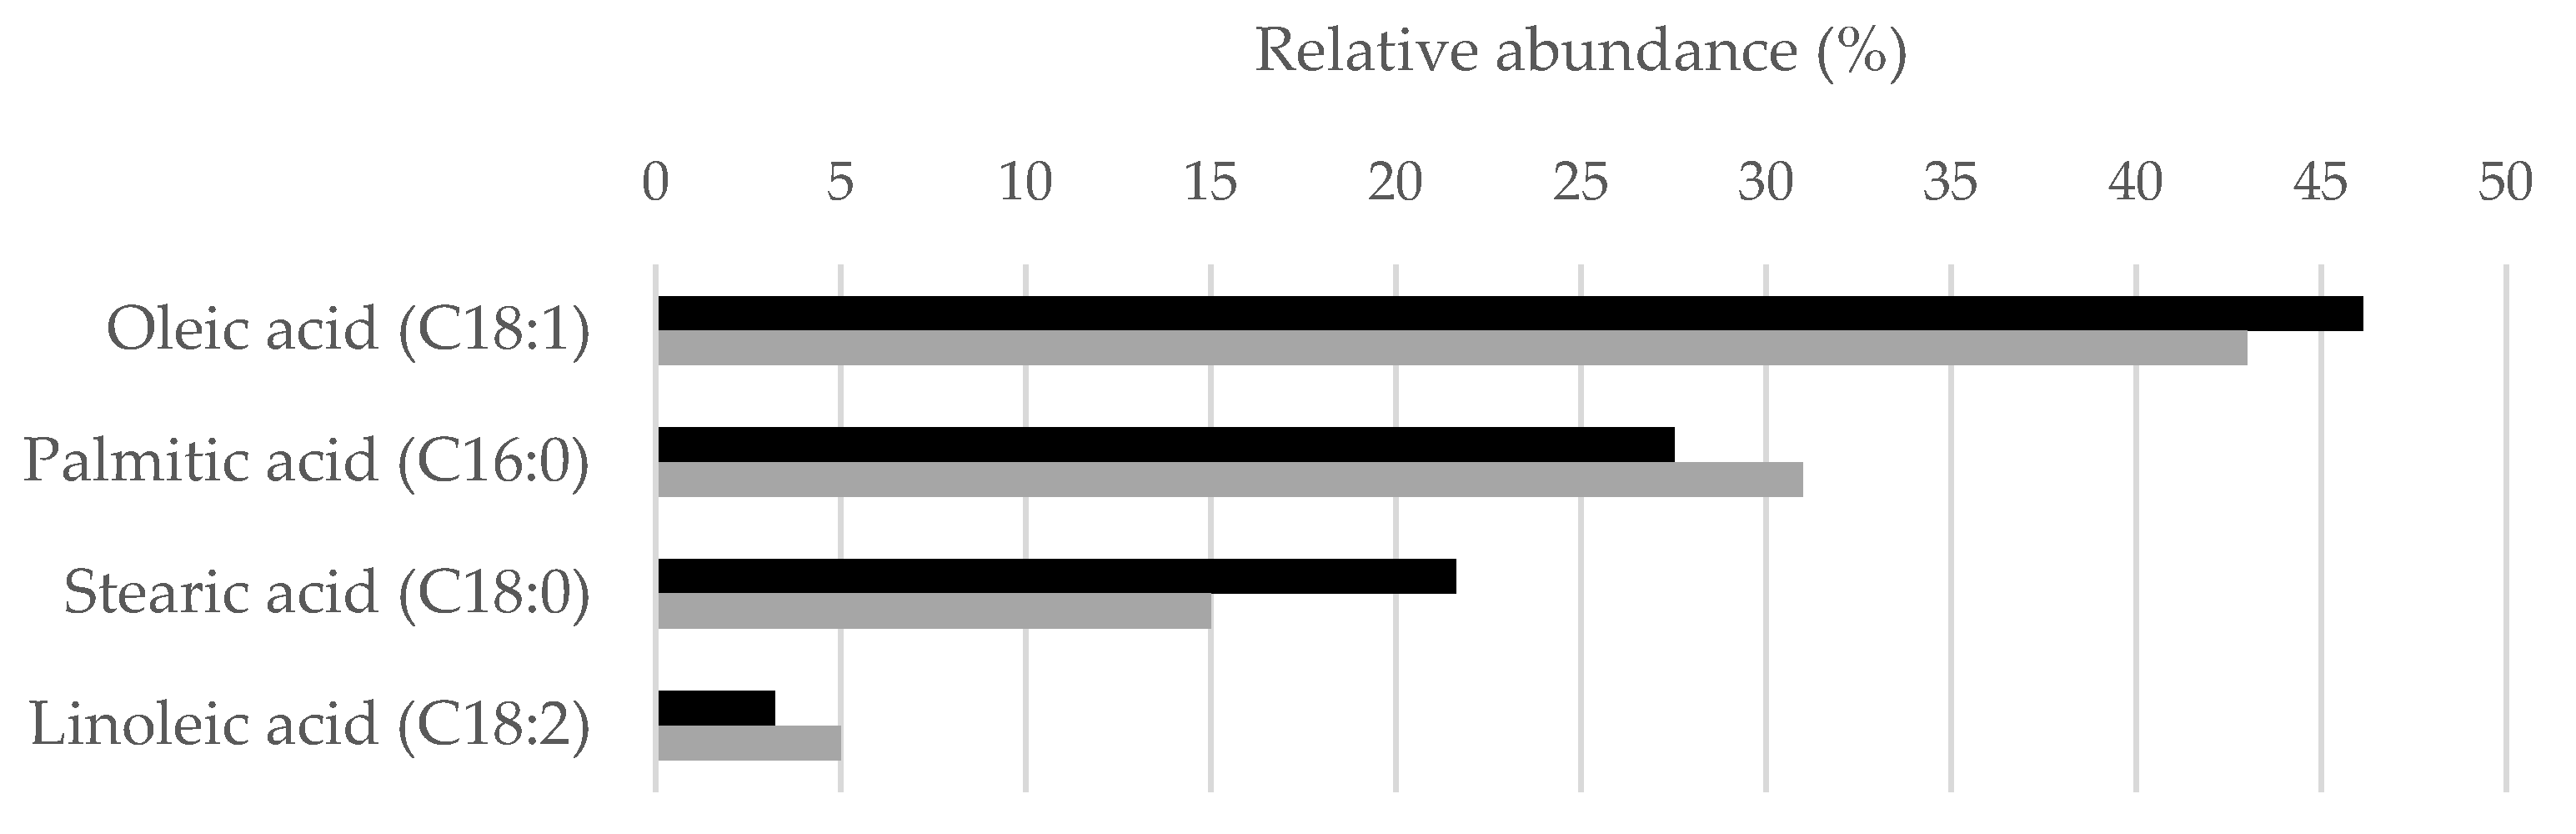
3.6. Lipid Composition

Lipids synthesized by the C. oleaginosus ATCC 20509 strain are known to be mainly composed of long-chain fatty acids with 16 and 18 carbon atoms, with a profile similar to vegetable fats [12,34]. At the end of the process carried out on the medium WPYEU, the lipid extract was found to contain 77.3% of TAGs, 16.4% of DAGs, and 6.3% of MAGs (Figure S3). The main fatty acids produced were 46.14 ± 0.65% oleic acid (C18:1), 27.53 ± 0.29% palmitic acid (C16:0), 21.63 ± 0.21% stearic acid (C18:0), and 3.22 ± 0.31% linoleic acid (C18:2) (Figure 7, Figure S4). On the whole, the lipid profile obtained by cultivation on a permeate-based medium containing urea as a nitrogen source appeared to be quite similar to those obtained on a glucose-based medium containing ammonium sulfate [23]. These results indicate that the composition of the permeate-based medium, and the presence of urea as a nitrogen source did not significantly affect the fatty acid profile of lipids produced by C. oleaginosus ATCC 20509.

4. Discussion

In this work, we studied the possibility of developing bioprocesses using food wastes as sources of both the nutrients and water needed for yeast growth and lipid production. Processes for lipid production by using CW or WP and oleaginous yeast species have been reported [35,36,37,38,39,40]. Among the oleaginous species we tested on WP, C. oleaginosus was the best performing one. This species has been described as one of the most suitable biorefineries for the sustainable conversion of a wide range of agro-industrial wastes to new-generation oils. This is due to its ability to grow on various carbon sources, accumulating a high content of lipids, and its good tolerance to the main growth inhibitors [36,41,42,43]. In particular, Daniel et al. [25] described a batch process by C. oleaginosus on solely WP that resulted in the production of lipids at 20 g/L with a productivity of 0.14 g/L/h. In our processes, the addition of nutrient and nitrogen sources like YE and urea to the WP led to a considerable increase from 8 ± 0.51 g/L to 46.1 ± 1.21 g/L in terms of the net biomass produced (Table 2). Consequently, lipid production paralleled the biomass increase, rising from 18 g/L to 38 g/L (Table 2). By supplementing the WP and by applying carbon feeding using another sugar-rich food waste in fed-batch mode, we improved the productivity to 0.57 g/L/h. A slightly lower final lipid concentration and productivity have been recently reported by Kopsaelis et. [27] on WP supplemented with a wine lees extract. In conclusion, we developed a fermentation process for lipid production by using a medium based on two food wastes (i.e., WP and a syrup from candied fruit processing) supplemented with urea as a nitrogen source and YE to provide additional nutrients. Urea is a cost-effective nitrogen source [28], but to the best of our knowledge, its use by this strain for the lipid production process has not been reported yet. It is noteworthy that in the presence of urea, we showed that lower volumes of alkali solution are needed in order to maintain the pH value, contributing to reducing the cost of microbial oil production. An additional reduction of cost and waste recycling can be achieved by replacing the commercial YE in the medium with other wastes such as corn steep, which is already used for fermentation processes [32]. However, we showed that this additive is less efficient in terms of biomass production in comparison with YE. Another important aspect related to the use of a liquid waste such as WP is that it also allows recycling the water, saving fresh water usually employed for the fermentation process and decreasing its water footprint.
Fatty acids constitute hydrophobic tails of sugar fatty acid esters (SFAEs). SFAEs, usually called sugar esters, are non-ionic surfactants that are characterized by excellent emulsifying, stabilizing, and detergency properties. SFAEs are widely used in many market sectors (e.g., the food, detergent, cosmetic, and pharmaceutical industries), having many advantages over petrochemical-derived surfactants as they are non-harmful to the environment, tasteless, odorless, and fully biodegradable. In addition, they exhibit low or no toxicity and antimicrobial activity, are skin-compatible, and are used in food products. (SFAEs are acknowledged by the US FDA as generally regarded as safe (GRAS) [44]. In the future, we will optimize the use of fatty acids derived from microbial lipids, obtained by the fermentation process on WP-based media, as precursors for SFAE production.
Flow cytometry is a fast and precise technique that allows obtaining information on different parameters through using different dyes cell by cell [45]. Unlike other kinds of analyses which give average results (aggregated results), by this technique, we can distinguish the behavior of every cell within a population (segregated results). Parameters such as the cell size and viability, as well as cell structures and molecules stained by fluorescent dyes, can be detected and quantified [46,47]. Using Nile red dye, qualitative methods for following lipid droplet formation have been developed in both microalgae and the oleaginous yeasts Waltomyces lipofer and Yarrowia Lipolytica [48,49,50]. In this work, using BODIPY 493/503, we developed a staining protocol that allows quantifying the lipid amount, avoiding the extraction step and the use of solvents (Figure 6). This can represent a fast (30 min) and accurate method not only to screen the lipid content in different yeast strains but also to monitor the process of lipid production at the single-cell level.

Supplementary Materials

The following supporting information can be downloaded at: https://www.mdpi.com/article/10.3390/fermentation8070341/s1, Figure S1: Lipid droplets (LDs) of C. oleoginosus ATCC 20509 sampled after 18 (a) and 90 (b) hours of cultivation. Outlines of counted LDs were used to calculate average diameters in image analysis reported in the table. Figure S2: Determination of the vitality of T. oleaginosus ATCC 20509 using a Syber/PI double staining. (a): unstained sample; (b): double stained sample. Figure S3: GC-MS chromatogram of microbial lipids. MAG: monoacylglycerols; DAG: diacylglycerols; TAG: triacylglycerols. Figure S4: GC-MS chromatogram of microbial lipids after base-catalyzed transesterification. PA: palmitic acid; LA: linoleic acid; OA: oleic acid; SA: stearic acid; STD: C19 standard.

Author Contributions

S.D., conceptualization, investigation, analysis, data curation, and writing the draft; A.F., investigation and analysis; S.A., flow cytometry analysis and supervision; M.S.R., analysis of lipid profile; P.D., microscopy analysis; L.P., F.M., G.S. and D.U., contribution to discussion of the results; C.C., conceptualization, supervision of investigation, and writing the manuscript. All authors have read and agreed to the published version of the manuscript.

Funding

This research was funded by the Cariplo Foundation (Italy) (call “Circular Economy for a sustainable future 2020”, project BioSurf, ID 2020-1094).

Institutional Review Board Statement

Not applicable.

Informed Consent Statement

Not applicable.

Acknowledgments

This work was financially supported by the Cariplo Foundation (Italy) (call “Circular Economy for a sustainable future 2020”, project BioSurf, ID 2020-1094). Microscopy observations were carried out at The Advanced Microscopy Facility. Platform: UNItech NOLIMITS, University of Milan. The authors wish to thank Latteria Soresina (Soresina, CR, Italy) for providing the cheese whey permeate. The sugar syrup was kindly supplied by SVZ (Industrial Fruit & Vegetable Ingredients, Breda, The Netherlands).

Conflicts of Interest

The authors declare no conflict of interest.

References

  1. European Commission: DG Environment. A New Circular Economy Action Plan for a Cleaner and More Competitive Europe; European Commission: DG Environment: Brussels, Belgium, 2020; Available online: https://eur-lex.europa.eu/legal-content/EN/TXT/?qid=1583933814386&uri=COM:2020:98:FIN (accessed on 27 June 2022).
  2. Girotto, F.; Alibardi, L.; Cossu, R. Food waste generation and industrial uses: A review. Waste Manag. 2015, 45, 32–41. [Google Scholar] [CrossRef] [PubMed]
  3. Homrich, A.; Galvão, G.; Gamboa Abadia, L.; Carvalho, M.M. The circular economy umbrella: Trends and gaps on integrating pathways. J. Clean. Prod. 2018, 175, 525–543. [Google Scholar] [CrossRef]
  4. Fernández-Gutiérrez, D.; Veillette, M.; Giroir-Fendler, A.; Ramirez, A.A.; Faucheux, N.; Heitz, M. Biovalorization of saccharides derived from industrial wastes such as whey: A review. Rev. Environ. Sci. Bio/Technol. 2017, 16, 147–174. [Google Scholar] [CrossRef]
  5. Koushki, M.; Jafari, M.; Azizi, M. Comparison of ethanol production from cheese whey permeate by two yeast strains. J. Food Sci. Technol. 2012, 49, 614–619. [Google Scholar] [CrossRef] [PubMed] [Green Version]
  6. Lappa, I.K.; Papadaki, A.; Kachrimanidou, V.; Terpou, A.; Koulougliotis, D.; Eriotou, E.; Kopsahelis, N. Cheese Whey Processing: Integrated Biorefinery Concepts and Emerging Food Applications. Foods 2019, 8, 347. [Google Scholar] [CrossRef] [Green Version]
  7. Musatti, A.; Cavicchioli, D.; Mapelli, C.; Bertoni, D.; Hogenboom, J.A.; Pellegrino, L.; Rollini, M. From Cheese Whey Permeate to Sakacin A: A circular economy approach for the food-grade biotechnological production of an anti-Listeria bacteriocin. Biomolecules 2020, 10, 597. [Google Scholar] [CrossRef] [Green Version]
  8. Zotta, T.; Solieri, L.; Iacumin, L.; Picozzi, C.; Gullo, M. Valorization of Cheese Whey Using Microbial Fermentations. Appl. Microbiol. Biotechnol. 2020, 104, 2749–2764. [Google Scholar] [CrossRef]
  9. Ratledge, C. Yeasts, molds, algae and bacteria as sources of lipids. In Technological Advances in Improved and Alternative Sources of Lipids; Springer: Boston, MA, USA, 1994; pp. 235–291. [Google Scholar] [CrossRef]
  10. Abeln, F.; Chuck, C.J. The history, state of the art and future prospects for oleaginous yeast research. Microb. Cell Fact. 2021, 20, 221. [Google Scholar] [CrossRef]
  11. Caporusso, A.; Capece, A.; De Bari, I. Oleaginous Yeasts as Cell Factories for the Sustainable Production of Microbial Lipids by the Valorization of Agri-Food wastes. Fermentation 2021, 7, 50. [Google Scholar] [CrossRef]
  12. Christophe, G.; Kumar, V.; Nouaille, R.; Gaudet, G.; Fontanille, P.; Pandey, A.; Soccol, C.R.; Larroche, C. Recent developments in microbial oils production: A possible alternative to vegetable oils for biodiesel without competition with human food? Brazilian Arch. Biol. Technol. 2012, 55, 29–46. [Google Scholar] [CrossRef] [Green Version]
  13. Atabani, A.E.; Silitonga, A.S.; Badruddin, I.A.; Mahlia, T.M.I.; Masjuki, H.H.; Mekhilef, S. A comprehensive review on biodiesel as an alternative energy resource and its characteristics. Renew. Sust. Energ. Rev. 2012, 16, 2070–2093. [Google Scholar] [CrossRef]
  14. Béligon, V.; Christophe, G.; Fontanille, P.; Larroche, C. Microbial lipids as potential source to food supplements. Curr. Opin. Food Sci. 2016, 7, 35–42. [Google Scholar] [CrossRef]
  15. Li, Q.; Du, W.; Liu, D. Perspectives of microbial oils for biodiesel production. Appl. Microbiol. Biotechnol. 2008, 80, 749–756. [Google Scholar] [CrossRef] [PubMed]
  16. Liu, Z.; Moradi, H.; Shi, S.; Darvishi, F. Yeasts as microbial cell factories for sustainable production of biofuels. Renew. Sustain. Energy Rev. 2021, 143, 110907. [Google Scholar] [CrossRef]
  17. Zhang, Y.; Nielsen, J.; Liu, Z. Yeast based biorefineries for oleochemical production. Curr. Opin. Biotechnol. 2021, 67, 26–34. [Google Scholar] [CrossRef]
  18. Koutinas, A.A.; Chatzifragkou, A.; Kopsahelis, N.; Papanikolaou, S.; Kookos, I.K. Design and techno-economic evaluation of microbial oil production as a renewable resource for biodiesel and oleochemical production. Fuel 2014, 116, 566–577. [Google Scholar] [CrossRef]
  19. Amoah, J.; Kahar, P.; Ogino, C.; Kondo, A. Bioenergy and Biorefinery: Feedstock, Biotechnological Conversion, and Products. Biotechnol. J. 2019, 14, 1800494. [Google Scholar] [CrossRef]
  20. Gerbens-Leenes, W.; Hoekstra, A.Y.; van der Meer, T.H. The water footprint of bioenergy. Proc. Natl. Acad. Sci. USA 2009, 106, 10219–10223. [Google Scholar] [CrossRef] [Green Version]
  21. Standard 182:1999; Milk Fat. Preparation of Fatty Acid Methyl Esters. FIL-IDF International Dairy Federation: Brussels, Belgium, 1999.
  22. D’Incecco, P.; Ong, L.; Gras, S.; Pellegrino, L. A fluorescence in situ staining method for investigating spores and vegetative cells of Clostridia by confocal laser scanning microscopy and structured illuminated microscopy. Micron 2018, 110, 1–9. [Google Scholar] [CrossRef] [Green Version]
  23. Capusoni, C.; Rodighiero, V.; Cucchetti, D.; Galafassi, S.; Bianchi, D.; Franzosi, G.; Compagno, C. Characterization of lipid accumulation and lipidome analysis in the oleaginous yeasts Rhodosporidium azoricum and Trichosporon oleaginosus. Bioresour. Technol. 2017, 238, 281–289. [Google Scholar] [CrossRef]
  24. Barbesti, S.; Citterio, S.; Labra, M.; Baroni, M.D.; Neri, M.G.; Sgorbati, S. Two and three-color fluorescence flow cytometric analysis of immunoidentified viable bacteria. Cytometry 2000, 40, 214–218. [Google Scholar] [CrossRef]
  25. Daniel, H.J.; Otto, R.T.; Binder, M.; Reuss, M.; Syldatk, C. Production of sophorolipids from whey: Development of a two-stage process with Cryptococcus curvatus ATCC 20509 and Candida bombicola ATCC 22214 using deproteinized whey concentrates as substrates. Appl. Microbiol. Biotechnol. 1999, 51, 40–45. [Google Scholar] [CrossRef]
  26. Meo, A.; Priebe, X.L.; Weuster-Botz, D. Lipid production with Trichosporon oleaginosus in a membrane bioreactor using microalgae hydrolysate. J. Biotechnol. 2017, 241, 1–10. [Google Scholar] [CrossRef] [PubMed]
  27. Kopsahelis, N.; Dimou, C.; Papadaki, A.; Xenopoulos, E.; Kyraleou, M.; Kallithraka, S.; Kotseridis, Y.; Papanikolaou, S.; Koutinas, A.A. Refining of wine lees and cheese whey for the production of microbial oil, polyphenol-rich extracts and value-added co-products. J. Chem. Technol. Biotechnol. 2018, 93, 257–268. [Google Scholar] [CrossRef]
  28. Brabender, M.; Hussain, M.S.; Rodriguez, G.; Blenner, M.A. Urea and urine are a viable and cost-effective nitrogen source for Yarrowia lipolytica biomass and lipid accumulation. Appl. Microbiol. Biotechnol. 2018, 102, 2313–2322. [Google Scholar] [CrossRef] [PubMed]
  29. Kourist, R.; Bracharz, F.; Lorenzen, J.; Kracht, O.N.; Chovatia, M.; Daum, C.; Deshpande, S.; Lipzen, A.; Nolan, M.; Ohm, R.A.; et al. Genomics and Transcriptomics Analyses of the Oil-Accumulating Basidiomycete Yeast Trichosporon oleaginosus: Insights into Substrate Utilization and Alternative Evolutionary Trajectories of Fungal Mating Systems. Mbio 2015, 6, e00918-15. [Google Scholar] [CrossRef] [PubMed] [Green Version]
  30. Awad, D.; Bohnen, F.; Mehlmer, N.; Brueck, T. Multi-Factorial-Guided Media Optimization for Enhanced Biomass and Lipid Formation by the Oleaginous Yeast Cutaneotrichosporon oleaginosus. Front. Bioeng. Biotechnol. 2019, 7, 54. [Google Scholar] [CrossRef] [Green Version]
  31. Milne, N.; Luttik, M.A.H.; Cueto Rojas, H.F.; Wahl, A.; van Maris, A.J.A.; Pronk, J.T.; Daran, J.M. Functional expression of a heterologous nickel-dependent, ATP-independent urease in Saccharomyces cerevisiae. Metab. Eng. 2015, 130, 140. [Google Scholar] [CrossRef]
  32. Taiwo, A.E.; Madzimbamuto, T.N.; Ojumu, T.V. Optimization of Corn Steep Liquor Dosage and Other Fermentation Parameters for Ethanol Production by Saccharomyces cerevisiae Type 1 and Anchor Instant Yeast. Energies 2018, 11, 1740. [Google Scholar] [CrossRef] [Green Version]
  33. Donzella, S.; Serra, I.; Fumagalli, A.; Pellegrino, L.; Mosconi, G.; Lo Scalzo, R.; Compagno, C. Recycling industrial food wastes for lipid production by oleaginous yeasts Rhodosporidiobolus azoricus and Cutaneotrichosporon oleaginosum. Biotechnol. Biofuels Bioprod. 2022, 15, 51. [Google Scholar] [CrossRef]
  34. Parsons, S.; Allen, M.J.; Chuck, C.J. Coproducts of algae and yeast-derived single cell oils: A critical review of their role in improving biorefinery sustainability. Bioresour. Technol. 2020, 303, 122862. [Google Scholar] [CrossRef] [PubMed]
  35. Moon, N.J.; Hammond, E.G.; Glatz, B.A. Conversion of Cheese Whey and Whey Permeate to Oil and Single-Cell Protein. J. Dairy Sci. 1978, 61, 1537–1547. [Google Scholar] [CrossRef]
  36. Ykema, A.; Verbree, E.C.; Kater, M.M.; Smit, H. Optimization of lipid production in the oleaginous yeast Apiotrichum curvatum in whey permeate. Appl. Microbiol. Biotechnol. 1988, 29, 211–218. [Google Scholar] [CrossRef]
  37. Vamvakaki, A.-N.; Kandarakis, I.; Kaminarides, S.; Komaitis, M.; Papanikolaou, S. Cheese whey as a renewable substrate for microbial lipid and biomass production by Zygomycetes. Eng. Life Sci. 2010, 10, 348–360. [Google Scholar] [CrossRef]
  38. Demir, M.; Turhan, I.; Kucukcetin, A.; Alpkent, Z. Oil production by Mortierella isabellina from whey treated with lactase. Bioresour. Technol. 2013, 128, 365–369. [Google Scholar] [CrossRef] [PubMed]
  39. Seo, Y.H.; Lee, I.; Jeon, S.H.; Han, J.I. Efficient Conversion from Cheese Whey to Lipid Using Cryptococcus curvatus. Biochem. Eng. J. 2014, 90, 149–153. [Google Scholar] [CrossRef]
  40. Carota, E.; Crognale, S.; D’Annibale, A.; Gallo, A.M.; Stazi, S.R.; Petruccioli, M. A sustainable use of Ricotta Cheese Whey for microbial biodiesel production. Sci. Total Environ. 2017, 584–585, 554–560. [Google Scholar] [CrossRef]
  41. Bracharz, F.; Beukhout, T.; Mehlmer, N.; Brück, T. Opportunities and challenges in the development of Cutaneotrichosporon oleaginosus ATCC 20509 as a new cell factory for custom tailored microbial oils. Microb. Cell Factor. 2017, 16, 178. [Google Scholar] [CrossRef] [Green Version]
  42. Di Fidio, N.; Minonne, F.; Antonetti, C.; Raspolli Galletti, A.M. Cutaneotrichosporon oleaginosus: A Versatile Whole-Cell Biocatalyst for the Production of Single-Cell Oil from Agro-Industrial Wastes. Catalysts 2021, 11, 1291. [Google Scholar] [CrossRef]
  43. Pham, N.; Reijnders, M.; Suarez-Diez, M.; Nijsse, B.; Springer, J.; Eggink, G.; Schaap, P.J. Genome-scale metabolic modeling underscores the potential of Cutaneotrichosporon oleaginosus ATCC 20509 as a cell factory for biofuel production. Biotechnol. Biofuels 2021, 14, 2. [Google Scholar] [CrossRef]
  44. Neta, N.S.; Teixeira, J.A.; Rodrigues, L.R. Sugar ester surfactants: Enzymatic synthesis and applications in food industry. Crit. Rev. Food Sc. Nutr. 2015, 55, 595–610. [Google Scholar] [CrossRef] [PubMed]
  45. Perfetto, S.; Chattopadhyay, P.; Roederer, M. Seventeen-colour flow cytometry: Unravelling the immune system. Nat. Rev. Immunol. 2004, 4, 648–655. [Google Scholar] [CrossRef] [PubMed]
  46. Capusoni, C.; Arioli, S.; Donzella, S.; Guidi, B.; Serra, I.; Compagno, C. Hyper-Osmotic Stress Elicits Membrane Depolarization and Decreased Permeability in Halotolerant Marine Debaryomyces hansenii Strains and in Saccharomyces cerevisiae. Front. Microbiol. 2019, 10, 64. [Google Scholar] [CrossRef] [PubMed] [Green Version]
  47. Martins, J.A.; Lopes da Silva, T.; Marques, S.; Carvalheiro, F.; Roseiro, L.B.; Duarte, L.C.; Gírio, F. The use of flow cytometry to assess Rhodosporidium toruloides NCYC 921 performance for lipid production using Miscanthus sp. hydrolysates. Biotechnol. Rep. 2021, 30, e00639. [Google Scholar] [CrossRef] [PubMed]
  48. Rumin, J.; Bonnefond, H.; Saint-Jean, B.; Rouxel, C.; Sciandra, A.; Bernard, O.; Cadoret, J.P.; Bougaran, G. The use of fluorescent Nile red and BODIPY for lipid measurement in microalgae. Biotechnol. Biofuels 2015, 8, 42. [Google Scholar] [CrossRef] [PubMed] [Green Version]
  49. Raschke, D.; Knorr, D. Rapid monitoring of cell size, vitality and lipid droplet development in the oleaginous yeast Waltomyces lipofer. J. Microbiol. Methods 2009, 79, 178–183. [Google Scholar] [CrossRef]
  50. Bouchedja, D.N.; Danthine, S.; Kar, T.; Fickers, P.; Boudjellal, A.; Delvigne, F. Online flow cytometry, an interesting investigation process for monitoring lipid accumulation, dimorphism, and cells’ growth in the oleaginous yeast Yarrowia lipolytica JMY 775. Bioresour. Bioprocess. 2017, 4, 3. [Google Scholar] [CrossRef] [Green Version]
Figure 1. (a) Different strains spotted on YNB-lactose plate at different concentrations (105, 104, and 103 cells) and incubated for 5 days at 30 °C. (b) Screening on whey permeate without any addition (WP).
Fermentation 08 00341 g001
Figure 2. (a) Lactose utilization on WP (gray line) and on WPYE (black line). (b) Comparison between ATCC 20509 growth on WP and WPYE.
Fermentation 08 00341 g002
Figure 3. Confocal laser scanning microscopy of C. oleaginosus ATCC 20509 observed after 18 h (a,b) and 90 h (c,d) of cultivation in WPYEU. Cells (in blue) are stained with Hoechst 34580 (HO), while lipid droplets (LDs) (in red) are stained with Nile red (NR). Vacuoles (V) were observed in bright field (BF).
Fermentation 08 00341 g003
Figure 4. (a,b) FACS histograms showing different BODIPY 493/503 concentrations on ATCC 20509 samples collected at 24 h (a) and at 90 h (b) of the production process. Black line = unstained sample; pink line = 0.75 µM BODIPY 493/503; red line = 1.5 µM BODIPY 493/503; blue line = 7.5 µM BODIPY 493/503. (c) Calibration curve correlating the BODIPY 493/503 fluorescence intensity with lipid content (expressed in % on dry weight) detected by colorimetric method. (d) FACS histogram showing BODIPY 493/503 fluorescence in different strains. Black line = unstained sample; blue line = DBVPG 6630; green line = ATCC 20508; red line = ATCC 20509.
Fermentation 08 00341 g004
Figure 5. Main parameters of ATCC 20509 processes in WPYE (a), WPYEU (b), WPUC (c), and WPYU+M (d). Black bar = dry weight (DW, g/L); gray bar = lipid concentration (g/L); green line = residual nitrogen (g/L); blue line = residual lactose (g/L); red line = residual glucose (g/L); light blue line = residual fructose (g/L).
Fermentation 08 00341 g005
Figure 6. (a) FACS histogram showing BODIPY 493/503 fluorescence in ATCC 20509 samples collected after 18 h (red line) and 90 h (blue line) of the process in WPYE. Black line = unstained. (b) FACS histogram showing BODIPY 493/503 fluorescence in sample collected at 26 h (light blue line), 55 h (blue line), 75 h (pink line), and 90 h (red line) of the process in WPYEU. Black line = unstained. (c) Zoomed-in view.
Fermentation 08 00341 g006
Figure 7. Comparison between the major fatty acids produced by C. oleaginosus ATCC 20509 on WPYEU (black bars) and on glucose [23] (gray bars).
Fermentation 08 00341 g007
Table 1. Localization and specific activity of ATCC 20509 β-galactosidase on different media.
MediumLocationU/mg
YPDIntracellular0
YNB-LactoseSupernatant0
YNB-LactoseIntracellular152
Table 2. ATCC 20509 growth and production parameters calculated at the final point of process in different WP-based media. Samples indicated with a different letter are significantly different (p < 0.05) according to one-way ANOVA with post hoc Tukey HSD test.
WPYEWPYEUWPUCWPYEU+M
Initial C/N60.5918.3316.5410.5
Growth rate (μ)0.260.280.260.32
Final biomass (g/L)26.5 ± 0.27 a65.5 ± 1.21 b46.0 ± 0.51 c84.0 ± 1.27 d
Lipids (g/L)18.0 ± 1.30 a29.4 ± 0.60 b19.0 ± 0.40 a38.1 ± 1.00 c
Lipid content (%)68%45%43%45%
Lipid yield0.210.160.120.10
Productivity (g/L/h)0.200.310.200.57
Publisher’s Note: MDPI stays neutral with regard to jurisdictional claims in published maps and institutional affiliations.

