
A Meta-Analysis of Essential Oils Use for Beef Cattle Feed: Rumen Fermentation, Blood Metabolites, Meat Quality, Performance and, Environmental and Economic Impact

 , , , and
Abstract
1. Introduction
2. Materials and Methods
2.1. Literature Search and Study Selection
2.2. Data Extraction
2.3. Calculations and Statistical Analysis
2.4. Heterogeneity
2.5. Publication Bias
2.6. Meta-Regression and Subgroup Analysis
2.7. Simulation Analysis
- (1)
- Cost of the basal diet = 0.25 USD/kg DM. A cost of 0.0021 USD/kg DM was added to the cost of the diet supplemented with EOs, considering the average dose of EOs used in the present study (Table 1) and the average cost of 7.45 USD/kg reported in the literature for some of the most commonly used EOs [49,50,51].
- (2)
- AEIAFU = 108 kg CO2-eq/kg of protein, based on data previously reported by Gerber et al. [52], which indicated that the global average emission intensity (GAEI) of beef is 300 kg CO2-eq/ kg of protein and that on average 36% of beef emissions (BEs) were attributed to animal feed use. In addition, data on beef GAEI were used because worldwide there is wide variation in the environmental footprint of beef production systems [48].
- (3)
- Moreover, considering the above assumption (2), the remaining component of BEs was allocated to non-food use [48]: AEINAFU = 192 kg CO2-eq/kg of protein.
3. Results
3.1. Study Attributes and Excluded Studies
3.2. Nutrient Intake and Digestibility
3.3. Growth Performance and Carcass Characteristics
3.4. Ruminal Parameters and Nitrogen Balance
3.5. Blood Metabolites
3.6. Meat Quality
3.7. Publication Bias and Meta-Regression
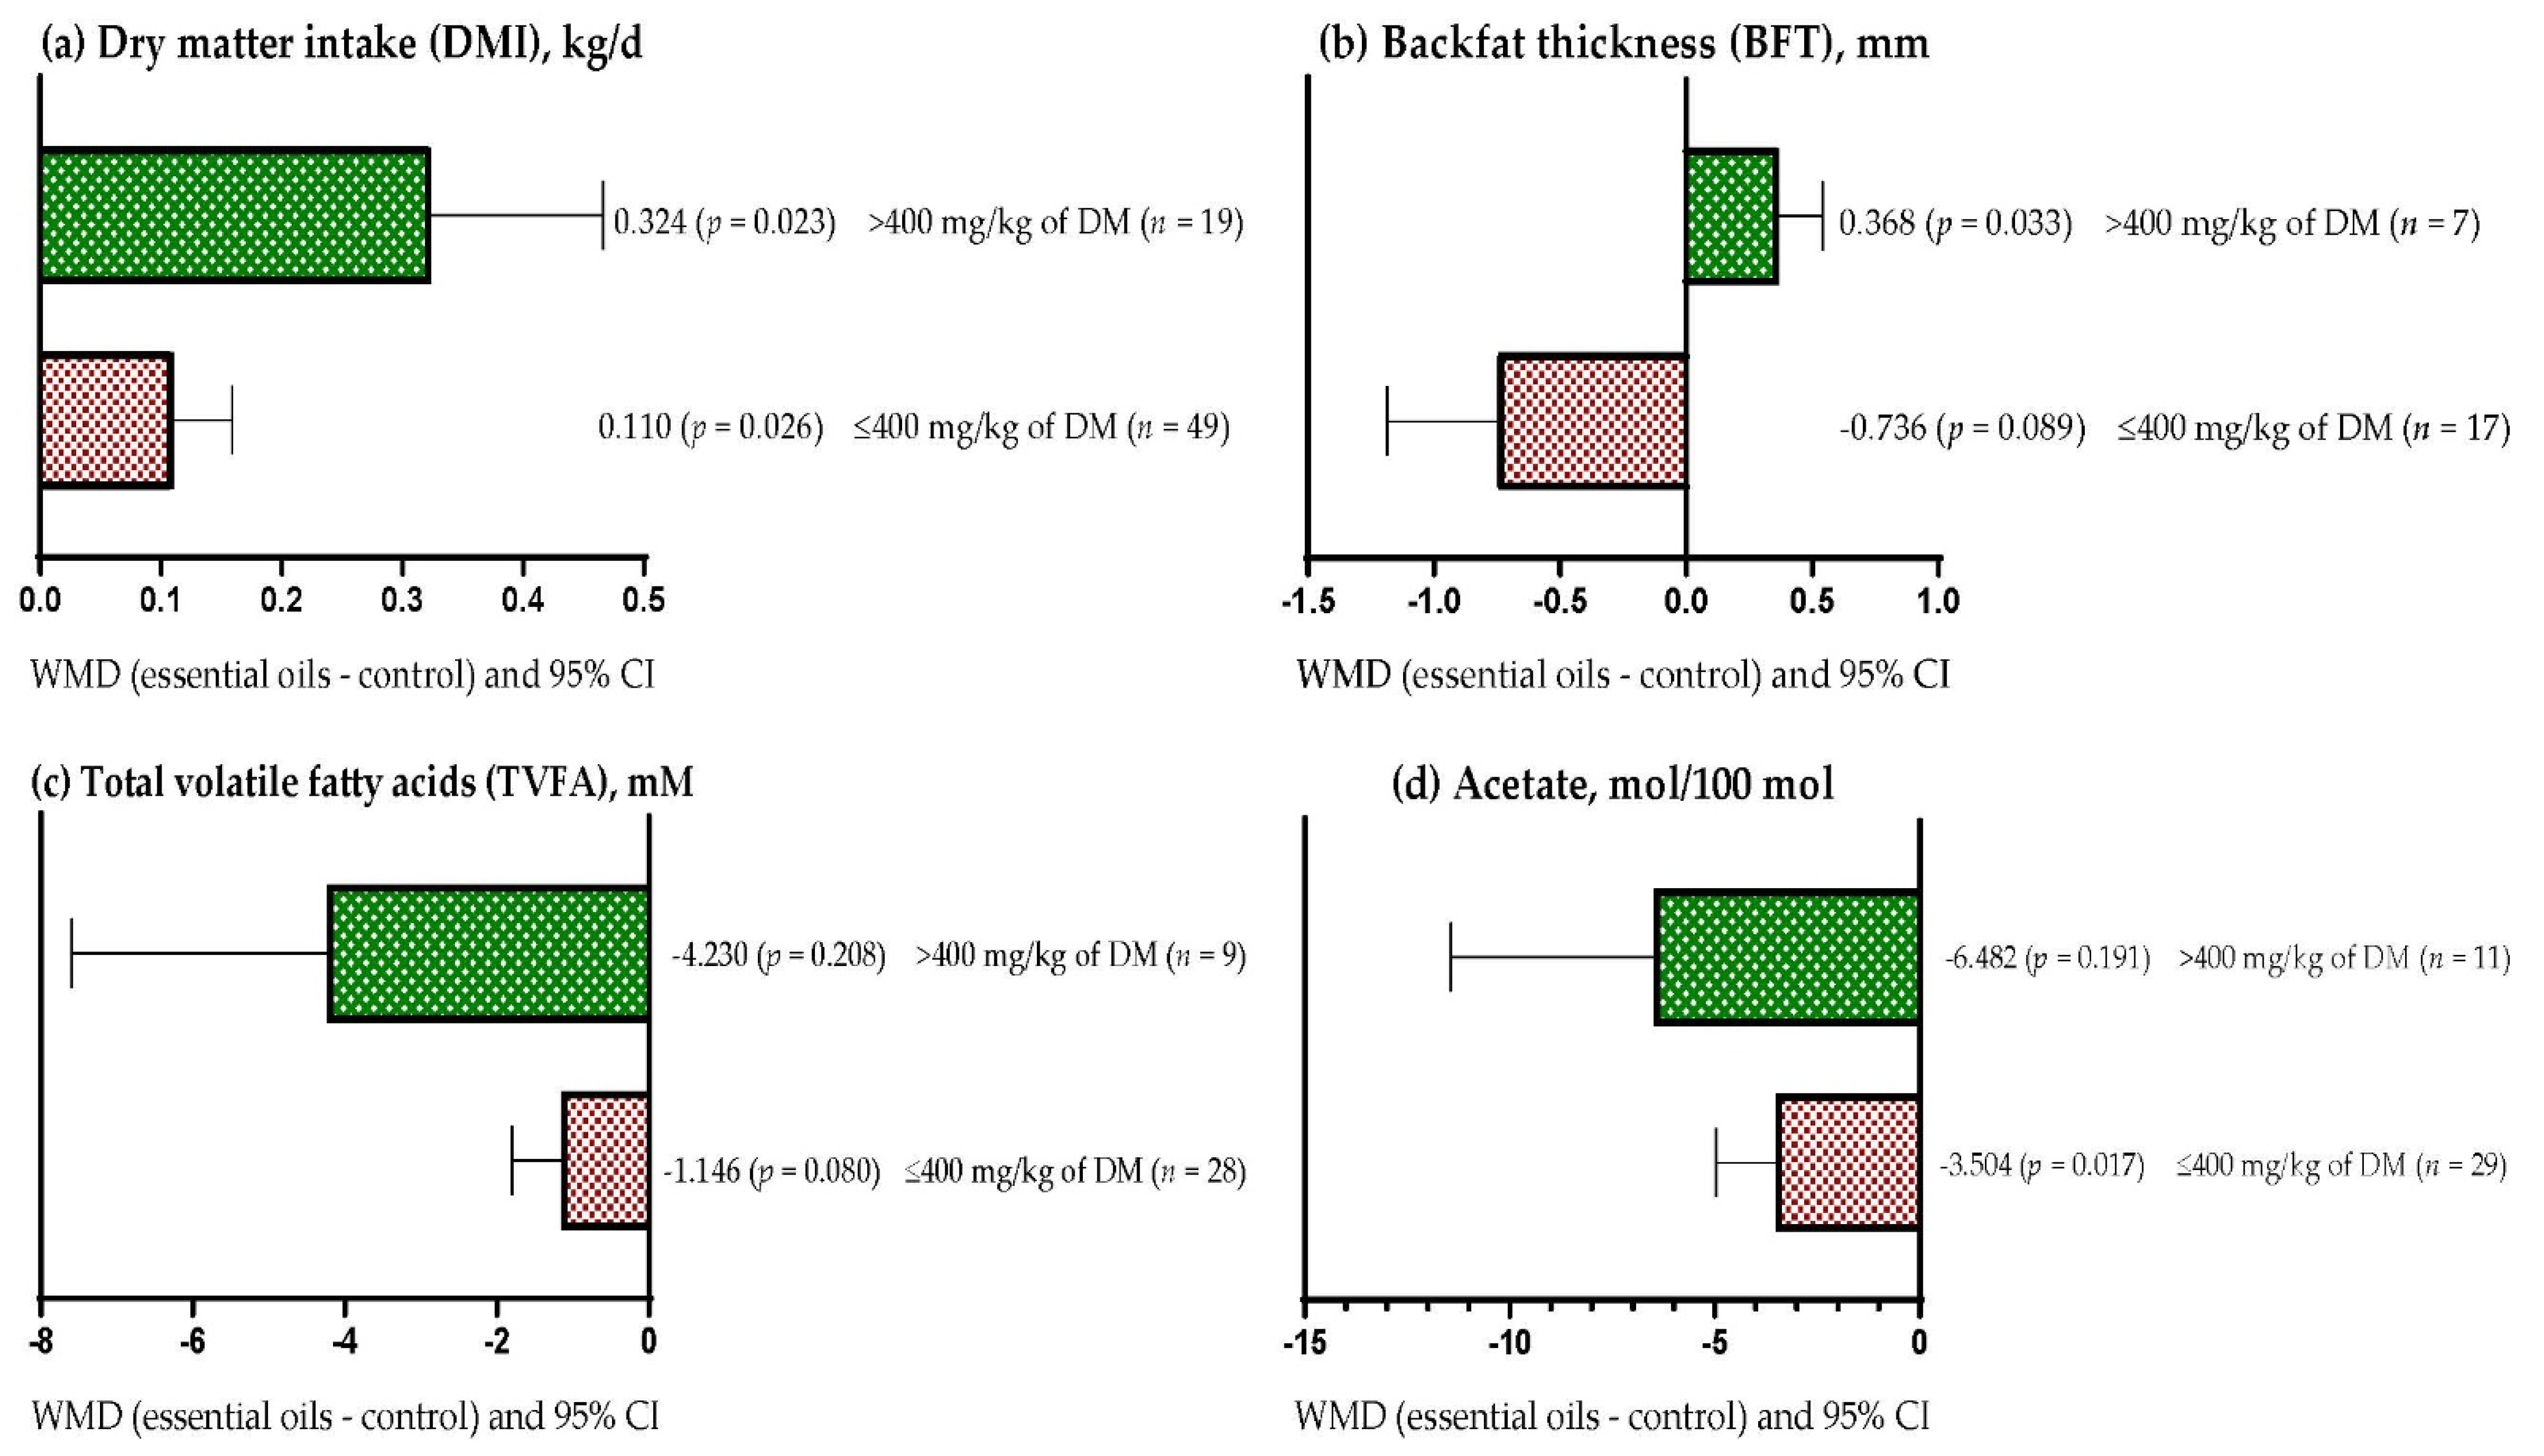
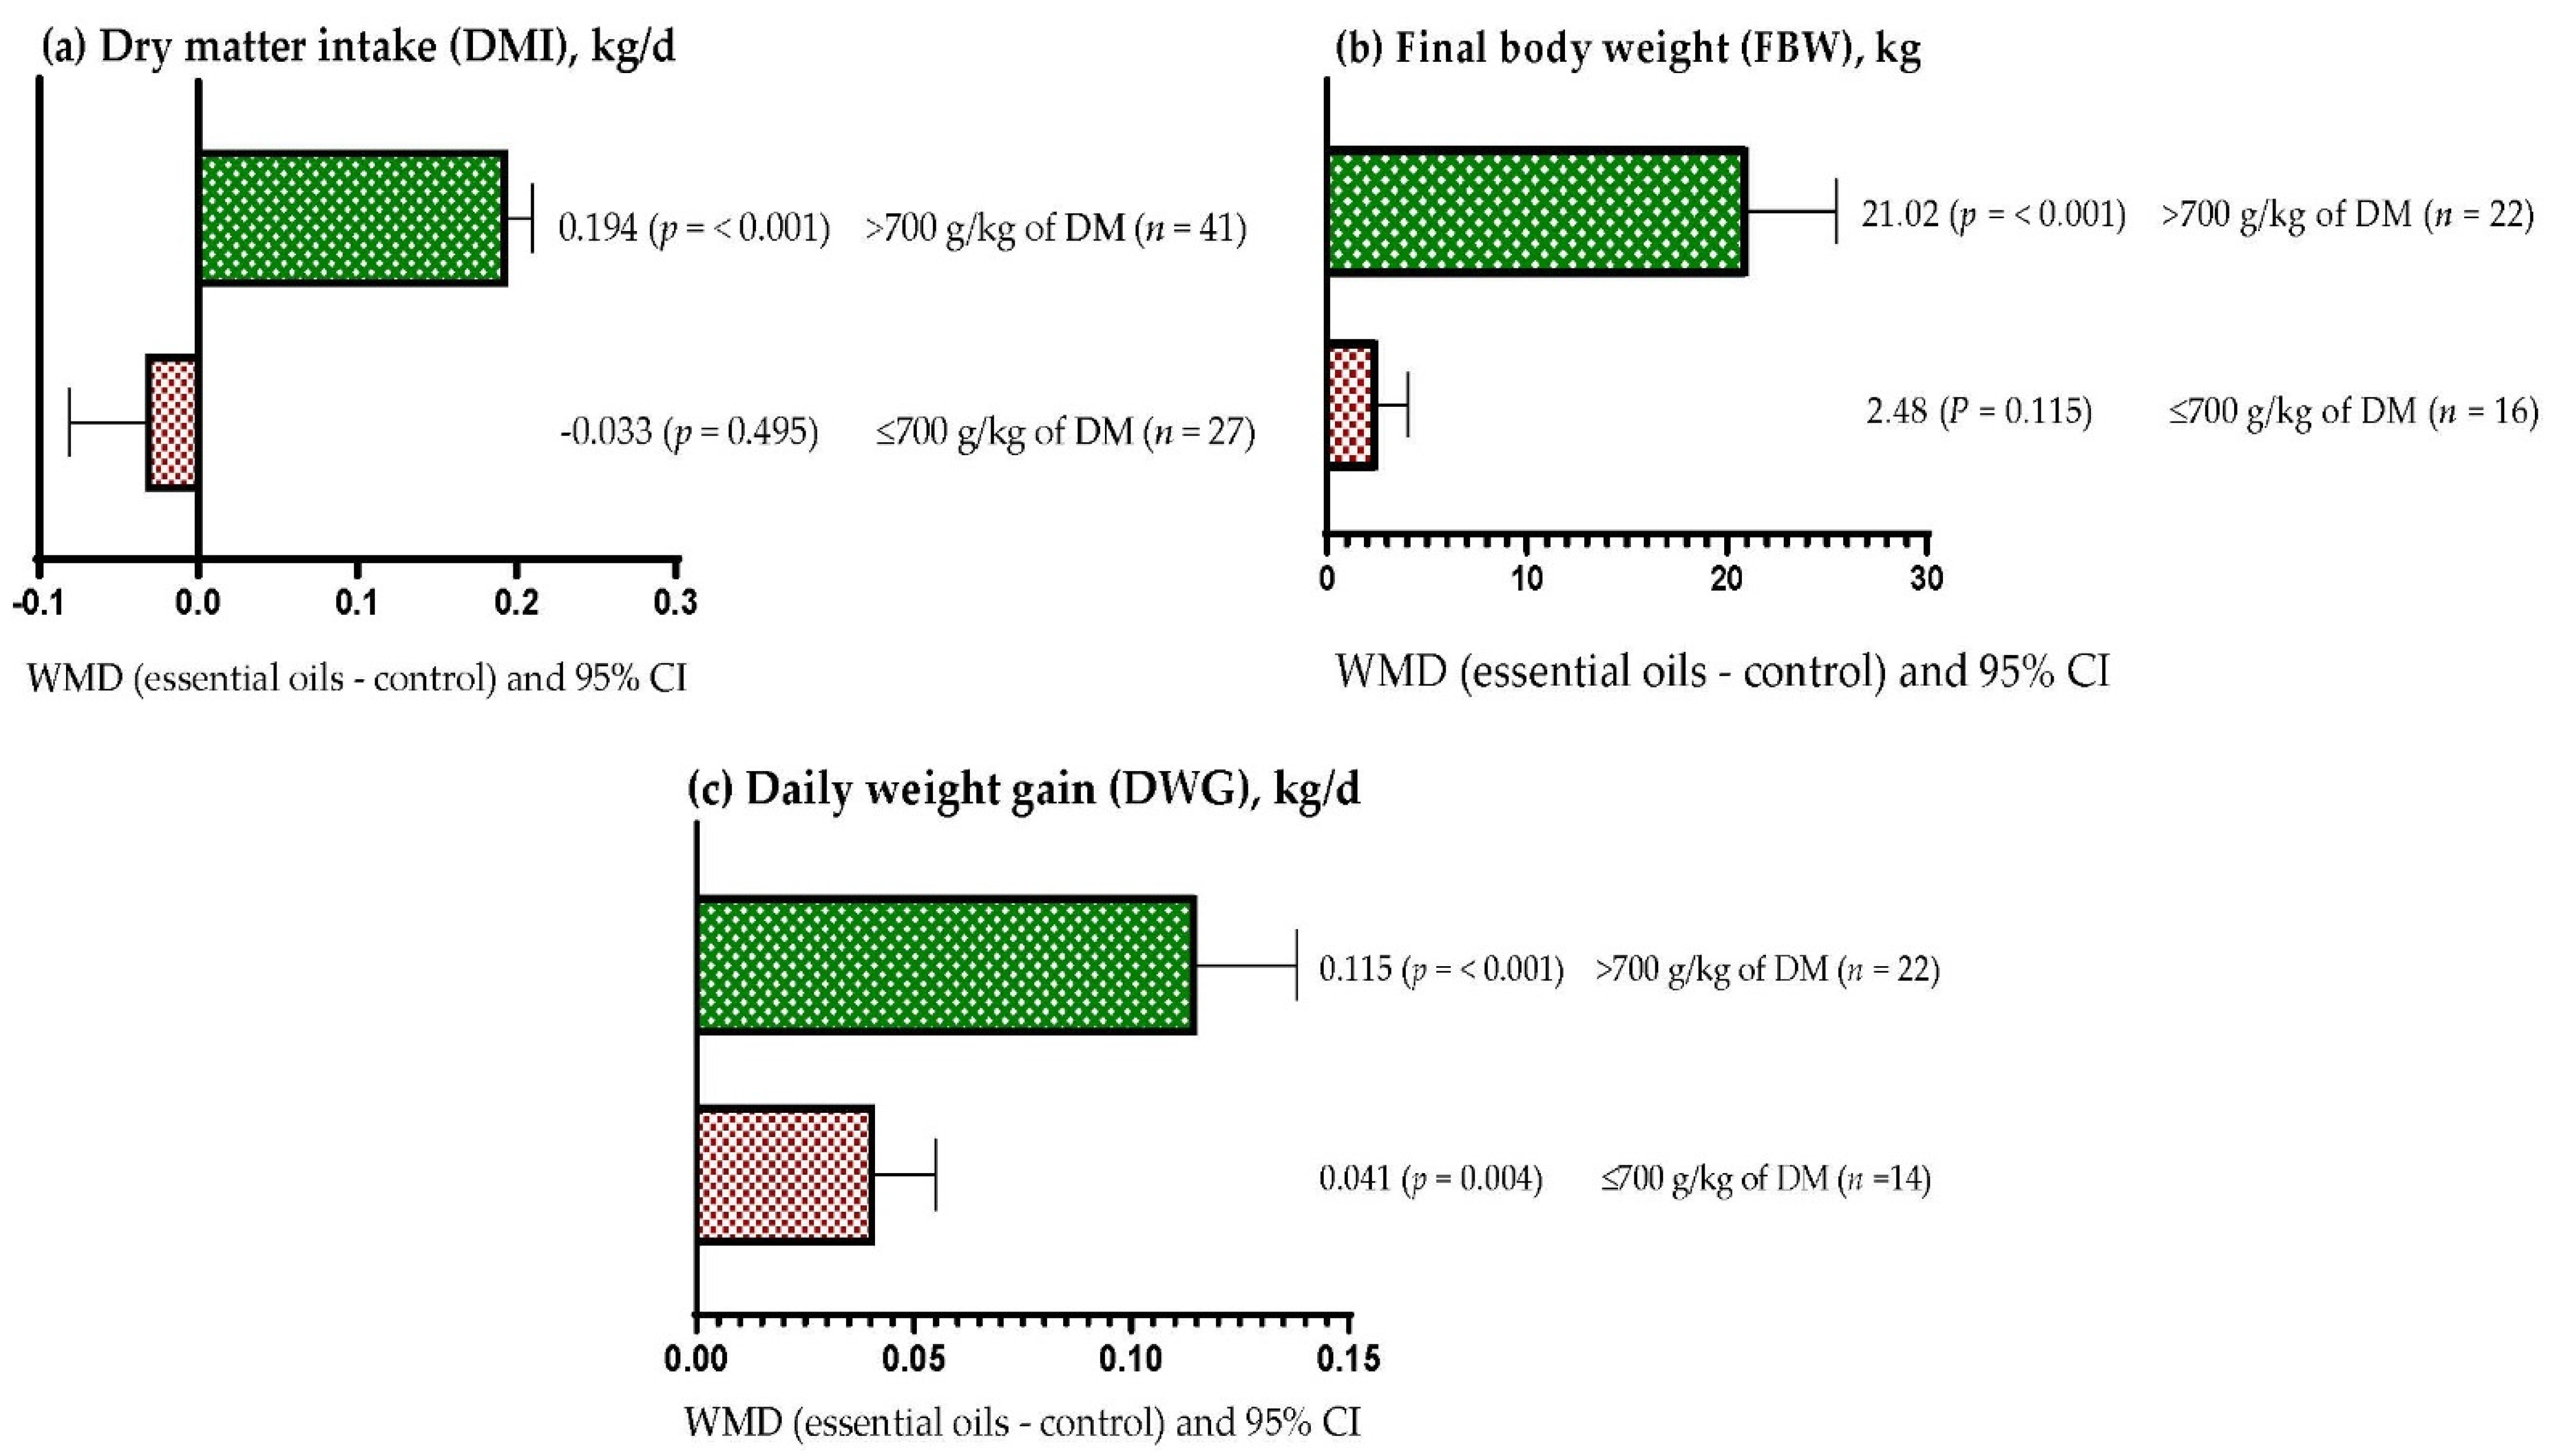
3.8. Subgroup Analysis
3.9. Environmental and Economic Impacts of Dietary Supplementation with Essential Oils in Beef Cattle Production
4. Discussion
4.1. Nutrient Intake and Digestibility
4.2. Growth Performance and Carcass Characteristics
4.3. Ruminal Parameters and Nitrogen Balance
4.4. Blood Metabolites
4.5. Meat Quality
4.6. Simulation Analysis
5. Conclusions
Author Contributions
Funding
Institutional Review Board Statement
Informed Consent Statement
Data Availability Statement
Acknowledgments
Conflicts of Interest
Appendix A


| Author | Country | Primary bioactive compound | Dose, mg/kg DM | C in Diet, g/kg DM | Duration, d |
|---|---|---|---|---|---|
| Afzalani et al. [104] | Indonesia | Blend (n = 4) | 200, 400, 800, 1200 | 400 (n = 4) | 90 (n = 4) |
| Alemu et al. [9] | Canada | Blend (n = 2) | 150 (n = 2) | 200 (n = 2) | 84 (n = 2) |
| Almeida et al. [105] | Brazil | Blend (n = 1) | 500 (n = 1) | 700 (n = 1) | 105 (n = 1) |
| Brand et al. [106] | Canada | Blend (n = 2) | 50, 100 | 900 (n = 4) | 112 (n = 4) |
| Carvalho et al. [107] | Brazil | Blend (n = 3) | 191, 398, 601 | 700 (n = 3) | 74 (n = 3) |
| Chapman et al. [108] | United States | Cinnamaldehyde (n = 2) | 37, 76 | 470 (n = 2) | 70 (n = 2) |
| Dorleku et al. [16] | Canada | Blend (n = 2) | 85, 337 | 850 (n = 2) | 100 (n = 2) |
| Fandiño et al. [11] | Spain | Capsaicin, blend, anethole (n = 3) | 12, 31, 62 (n = 3) | 900 (n = 9) | 96 (n = 9) |
| Filho et al. [109] | Brazil | Thymol (n = 3) | 232, 469, 965 | 500 (n = 3) | 84 (n = 3) |
| Gouvêa et al. [10] | United States | Blend (n = 1) | 120 (n = 1) | 930 (n = 1) | 154 (n = 1) |
| Guerrero et al. [110] | Brazil | Blend (n = 2) | 500, 1000 | 900 (n = 2) | 120 (n = 2) |
| Khorrami et al. [111] | Iran | Thymol, cinnamaldehyde | 500, 500 | 700 (n = 2) | 84 (n = 2) |
| Kim et al. [112] | Korea | Blend (n = 3) | 39, 79, 113 | 900 (n = 3) | 390 (n = 3) |
| Latack et al. [113] | United States | Blend (n = 2) | 110 (n = 2) | 880 (n = 2) | 216, 84 |
| Monteschio et al. [15] | Brazil | Blend (n = 4) | 500 (n = 4) | Not reported | 73 (n = 4) |
| Monteschio et al. [114] | Brazil | Blend (n = 4) | 500 (n = 4) | Not reported | 73 (n = 4) |
| Ornaghi et al. [115] | Brazil | Blend (n = 4) | 444, 865, 450, 890 | 900 (n = 4) | 187 (n = 4) |
| Ornaghi et al. [97] | Brazil | Blend (n = 4) | 153, 305, 444, 594 | 700 (n = 4) | 62 (n = 4) |
| Prado et al. [116] | Brazil | Blend (n = 1) | 442 (n = 1) | 500 (n = 1) | 115 (n = 1) |
| Pukrop et al. [117] | United States | Blend (n = 1) | 104 (n = 1) | 860 (n = 1) | 167 (n = 1) |
| Rivaroli et al. [118] | Brazil | Blend (n = 2) | 500, 1000 | 900 (n = 2) | 120 (n = 2) |
| Souza et al. [119] | Brazil | Blend (n = 4) | 789, 640, 678, 644 | 750 (n = 2) | 73 (n = 2) |
| Teobaldo et al. [12] | Brazil | Blend (n = 2) | 150, 300 | 280 (n = 2) | 76 (n = 2) |
| Tomkins et al. [120] | Australia | Blend (n = 2) | 185, 370 | 0 (n = 2) | 200 (n = 2) |
| Torrecilhas et al. [121] | Brazil | Eugenol (n = 2), cinnamaldehyde (n = 2) | 450, 880, 450, 880 | 900 (n = 4) | 187 (n = 4) |
| Vakili et al. [122] | Iran | Thymol, cinnamaldehyde | 617, 641 | 850 (n = 2) | 45 (n = 2) |
| Valero et al. [123] | Brazil | Blend (n = 1) | 550 (n = 1) | 550 (n = 1) | 55 (n = 1) |
| Wanapat et al. [124] | Thailand | Blend (n = 3) | 17, 25, 40 | 220 (n = 3) | 84 (n = 3) |
| Westphalen et al. [14] | United States | Capsaicin (n = 4) | 15, 5, 10, 15 | 900 (n = 4) | 84 (n = 3), 80 |
| Wu et al. [125] | China | Blend (n = 1) | 26 (n = 1) | 400 (n = 1) | 240 (n = 1) |
| Yang et al. [126] | Canada | Cinnamaldehyde (n = 3) | 37, 79, 184 | 850 (n = 3) | 84 (n = 3) |
| Yang et al. [85] | Canada | Eugenol (n = 3) | 42, 81, 166 | 850 (n = 3) | 84 (n = 3) |
| Yang et al. [13] | Canada | Cinnamaldehyde (n = 3) | 47, 98, 208 | 900 (n = 3) | 112 (n = 3) |
| Zotti et al. [12] | Brazil | Blend (n = 2) | 400 (n = 2) | 923 (n = 2) | 21 (n = 2) |
| Item | Control | EOs | Difference | % Change |
|---|---|---|---|---|
| Number of animals | 1000 | 1000 | ||
| DMI (kg DM/d/animal) | 8.40 | 8.40 | ||
| DWG (kg/d/animal) 1 | 1.213 | 1.300 | +0.087 | +7.2 |
| FE (kg DWG/kg DMI/animal) | 0.173 | 0.177 | +0.004 | +2.3 |
| TLWG (kg/animal) | 200 | 200 | ||
| LMY (kg/animal) 2 | 82 | 82 | ||
| BPO (kg/animal) 3 | 17.2 | 17.2 |
References
- Iskandar, K.; Molinier, L.; Hallit, S.; Sartelli, M.; Catena, F.; Coccolini, F.; Hardcastle, T.C.; Roques, C.; Salameh, P. Drivers of Antibiotic Resistance Transmission in Low- and Middle-Income Countries from a “One Health” Perspective—A Review. Antibiotics 2020, 9, 372. [Google Scholar] [CrossRef] [PubMed]
- Argudín, M.A.; Deplano, A.; Meghraoui, A.; Dodémont, M.; Heinrichs, A.; Denis, O.; Nonhoff, C.; Roisin, S. Bacteria from Animals as a Pool of Antimicrobial Resistance Genes. Antibiotics 2017, 6, 12. [Google Scholar] [CrossRef] [PubMed]
- Khan, R.U.; Khan, A.; Naz, S.; Ullah, Q.; Laudadio, V.; Tufarelli, V.; Ragni, M. Potential Applications of Moringa oleifera in Poultry Health and Production as Alternative to Antibiotics: A Review. Antibiotics 2021, 10, 1540. [Google Scholar] [CrossRef] [PubMed]
- Nehme, R.; Andrés, S.; Pereira, R.B.; Ben Jemaa, M.; Bouhallab, S.; Ceciliani, F.; López, S.; Rahali, F.Z.; Ksouri, R.; Pereira, D.M.; et al. Essential Oils in Livestock: From Health to Food Quality. Antioxidants 2021, 10, 330. [Google Scholar] [CrossRef]
- Irawan, A.; Hidayat, C.; Jayanegara, A.; Ratriyanto, A. Essential oils as growth-promoting additives on performance, nutrient digestibility, cecal microbes, and serum metabolites of broiler chickens: A meta-analysis. Anim. Biosci. 2021, 34, 1499–1513. [Google Scholar] [CrossRef]
- Zeng, Z.; Zhang, S.; Wang, H.; Piao, X. Essential oil and aromatic plants as feed additives in non-ruminant nutrition: A review. J. Anim. Sci. Biotechnol. 2015, 6, 7. [Google Scholar] [CrossRef]
- Khan, R.U.; Fatima, A.; Naz, S.; Ragni, M.; Tarricone, S.; Tufarelli, V. Perspective, Opportunities and Challenges in Using Fennel (Foeniculum vulgare) in Poultry Health and Production as an Eco-Friendly Alternative to Antibiotics: A Review. Antibiotics 2022, 11, 278. [Google Scholar] [CrossRef]
- Ma, J.; Long, S.; Wang, J.; Gao, J.; Piao, X. Microencapsulated essential oils combined with organic acids improves immune antioxidant capacity and intestinal barrier function as well as modulates the hindgut microbial community in piglets. J. Anim. Sci. Biotechnol. 2022, 13, 16. [Google Scholar] [CrossRef]
- Cardozo, P.W.; Calsamiglia, S.; Ferret, A.; Kamel, C. Screening for the effects of natural plant extracts at different pH on in vitro rumen microbial fermentation of a high-concentrate diet for beef cattle1. J. Anim. Sci. 2005, 83, 2572–2579. [Google Scholar] [CrossRef]
- Estrada-Angulo, A.; Arteaga-Wences, Y.J.; Castro-Pérez, B.I.; Urías-Estrada, J.D.; Gaxiola-Camacho, S.; Angulo-Montoya, C.; Ponce-Barraza, E.; Barreras, A.; Corona, L.; Zinn, R.A.; et al. Blend of Essential Oils Supplemented Alone or Combined with Exogenous Amylase Compared with Virginiamycin Supplementation on Finishing Lambs: Performance, Dietary Energetics, Carcass Traits, and Nutrient Digestion. Animals 2021, 11, 2390. [Google Scholar] [CrossRef]
- Lei, Z.; Zhang, K.; Li, C.; Wu, J.; Davis, D.; Casper, D.; Jiang, H.; Jiao, T.; Wang, X.; Wang, J. Dietary supplementation with Essential-oils-cobalt for improving growth performance, meat quality and skin cell capacity of goats. Sci. Rep. 2018, 8, 11634. [Google Scholar] [CrossRef]
- Teobaldo, R.W.; De Paula, N.F.; Zervoudakis, J.T.; Fonseca, M.A.; Cabral, L.S.; Martello, H.F.; Rocha, J.K.L.; Ribeiro, I.J.; Mundim, A.T. Inclusion of a blend of copaiba, cashew nut shell and castor oil in the protein-energy supplement for grazing beef cattle improves rumen fermentation, nutrient intake and fibre digestibility. Anim. Prod. Sci. 2020, 60, 1039–1050. [Google Scholar] [CrossRef]
- Arteaga-Wences, Y.J.; Estrada-Angulo, A.; Ríos-Rincón, F.G.G.; Castro-Pérez, B.; Mendoza-Cortéz, D.A.; Manriquez-Núñez, O.M.; Barreras, A.; Corona-Gochi, L.; Zinn, R.A.; Perea-Domínguez, X.P.; et al. The effects of feeding a standardized mixture of essential oils vs monensin on growth performance, dietary energy and carcass characteristics of lambs fed a high-energy finishing diet. Small Rumin. Res. 2021, 205, 106557. [Google Scholar] [CrossRef]
- Parvar, R.; Ghoorchi, T.; Kashfi, H.; Parvar, K. Effect of Ferulago angulata (Chavil) essential oil supplementation on lamb growth performance and meat quality characteristics. Small Rumin. Res. 2018, 167, 48–54. [Google Scholar] [CrossRef]
- Ortuño, J.; Serrano, R.; Bañón, S. Incorporating rosemary diterpenes in lamb diet to improve microbial quality of meat packed in different environments. Anim. Sci. J. 2017, 88, 1436–1445. [Google Scholar] [CrossRef]
- Moura, L.V.; Oliveira, E.R.; Fernandes, A.R.M.; Gabriel, A.M.A.; Silva, L.H.X.; Takiya, C.S.; Cônsolo, N.R.B.; Rodrigues, G.C.G.; Lemos, T.; Gandra, J.R. Feed efficiency and carcass traits of feedlot lambs supplemented either monensin or increasing doses of copaiba (Copaifera spp.) essential oil. Anim. Feed Sci. Technol. 2017, 232, 110–118. [Google Scholar] [CrossRef]
- Serrano, R.; Jordán, M.J.; Bañón, S. Use of dietary rosemary extract in ewe and lamb to extend the shelf life of raw and cooked meat. Small Rumin. Res. 2014, 116, 144–152. [Google Scholar] [CrossRef]
- Alemu, A.W.; Romero-Pérez, A.; Araujo, R.C.; Beauchemin, K.A. Effect of Encapsulated Nitrate and Microencapsulated Blend of Essential Oils on Growth Performance and Methane Emissions from Beef Steers Fed Backgrounding Diets. Animals 2019, 9, 21. [Google Scholar] [CrossRef]
- Gouvêa, V.N.; Duff, G.C.; Sowers, C.A.; Barnes, M.L. Effects of supplemental phytomolecules on growth performance, carcass characteristics and liver abnormalities of finishing beef steers. J. Appl. Anim. Res. 2021, 49, 324–329. [Google Scholar] [CrossRef]
- Fandiño, I.; Ferret, A.; Calsamiglia, S. Dose and combinations of anise oil and capsicum oleoresin as rumen fermentation modifiers in vitro and in vivo with high concentrate diets fed to Holstein beef heifers. Anim. Feed Sci. Technol. 2020, 260, 114363. [Google Scholar] [CrossRef]
- Zotti, C.A.; Silva, A.P.; Carvalho, R.; Marino, C.T.; Rodrigues, P.H.M.; Silva, L.F.P.; McAllister, T.A.; Leme, P.R. Monensin and a blend of castor oil and cashew nut shell liquid used in a high-concentrate diet abruptly fed to Nellore cattle1. J. Anim. Sci. 2017, 95, 4124–4138. [Google Scholar] [CrossRef]
- Yang, W.Z.; Ametaj, B.N.; Benchaar, C.; He, M.L.; Beauchemin, K.A. Cinnamaldehyde in feedlot cattle diets: Intake, growth performance, carcass characteristics, and blood metabolites1. J. Anim. Sci. 2010, 88, 1082–1092. [Google Scholar] [CrossRef]
- Westphalen, M.F.; Carvalho, P.H.V.; Oh, J.; Hristov, A.N.; Staniar, W.B.; Felix, T.L. Effects of feeding rumen-protected Capsicum oleoresin on growth performance, health status, and total tract digestibility of growing beef cattle. Anim. Feed Sci. Technol. 2021, 271, 114778. [Google Scholar] [CrossRef]
- de Oliveira Monteschio, J.; de Souza, K.A.; Vital, A.C.P.; Guerrero, A.; Valero, M.V.; Kempinski, E.M.B.C.; Barcelos, V.C.; Nascimento, K.F.; do Prado, I.N. Clove and rosemary essential oils and encapsuled active principles (eugenol, thymol and vanillin blend) on meat quality of feedlot-finished heifers. Meat Sci. 2017, 130, 50–57. [Google Scholar] [CrossRef]
- Dorleku, J.B.; Wang, L.M.; Zhou, Z.Y.; Mandell, I.; Bohrer, B.M. Effects of feeding two different blends of essential oils to finishing steers on growth performance, carcass characteristics, meat quality, meat composition, and shelf life. Can. J. Anim. Sci. 2021, 101, 507–526. [Google Scholar] [CrossRef]
- Benchaar, C.; Calsamiglia, S.; Chaves, A.V.; Fraser, G.R.; Colombatto, D.; McAllister, T.A.; Beauchemin, K.A. A review of plant-derived essential oils in ruminant nutrition and production. Anim. Feed Sci. Technol. 2008, 145, 209–228. [Google Scholar] [CrossRef]
- Simitzis, P.E. Enrichment of Animal Diets with Essential Oils—A Great Perspective on Improving Animal Performance and Quality Characteristics of the Derived Products. Medicines 2017, 4, 35. [Google Scholar] [CrossRef]
- Kholif, A.E.; Olafadehan, O.A. Essential oils and phytogenic feed additives in ruminant diet: Chemistry, ruminal microbiota and fermentation, feed utilization and productive performance. Phytochem. Rev. 2021, 20, 1087–1108. [Google Scholar] [CrossRef]
- Khiaosa-Ard, R.; Zebeli, Q. Meta-analysis of the effects of essential oils and their bioactive compounds on rumen fermentation characteristics and feed efficiency in ruminants1. J. Anim. Sci. 2013, 91, 1819–1830. [Google Scholar] [CrossRef]
- Borenstein, M.; Hedges, L.V.; Higgins, J.P.T.; Rothstein, H.R. Introduction to Meta-Analysis, 1st ed.; John Wiley & Sons: Chichester, UK, 2009; p. 413. [Google Scholar]
- Higgins, J.P.T.; Thompson, S.G.; Deeks, J.J.; Altman, D.G. Measuring inconsistency in meta-analyses. BMJ 2003, 327, 557–560. [Google Scholar] [CrossRef]
- Moher, D.; Liberati, A.; Tetzlaff, J.; Altman, D.G.; PRISMA Group. Preferred reporting items for systematic reviews and meta-analyses: The PRISMA statement. PLoS Med. 2009, 6, e1000097. [Google Scholar] [CrossRef] [PubMed]
- Orzuna-Orzuna, J.F.; Dorantes-Iturbide, G.; Lara-Bueno, A.; Mendoza-Martínez, G.D.; Miranda-Romero, L.A.; Hernández-García, P.A. Effects of Dietary Tannins’ Supplementation on Growth Performance, Rumen Fermentation, and Enteric Methane Emissions in Beef Cattle: A Meta-Analysis. Sustainability 2021, 13, 7410. [Google Scholar] [CrossRef]
- Orzuna-Orzuna, J.F.; Dorantes-Iturbide, G.; Lara-Bueno, A.; Mendoza-Martínez, G.D.; Miranda-Romero, L.A.; Lee-Rangel, H.A. Growth Performance, Meat Quality and Antioxidant Status of Sheep Supplemented with Tannins: A Meta-Analysis. Animals 2021, 11, 3184. [Google Scholar] [CrossRef] [PubMed]
- Lean, I.J.; Rabiee, A.R.; Duffield, T.F.; Dohoo, I.R. Invited review: Use of meta-analysis in animal health and reproduction: Methods and applications. J. Dairy Sci. 2009, 92, 3545–3565. [Google Scholar] [CrossRef]
- Belanche, A.; Newbold, C.J.; Morgavi, D.P.; Bach, A.; Zweifel, B.; Yáñez-Ruiz, D.R. A Meta-analysis Describing the Effects of the Essential oils Blend Agolin Ruminant on Performance, Rumen Fermentation and Methane Emissions in Dairy Cows. Animals 2020, 10, 620. [Google Scholar] [CrossRef]
- Higgins, J.; Thomas, J. Cochrane Handbook for Systematic Reviews of Interventions, 2nd ed.; John Wiley and Sons, Ltd.: Chichester, UK, 2019; pp. 143–176. [Google Scholar]
- Viechtbauer, W. Conducting Meta-Analyses in R with the metafor Package. J. Stat. Softw. 2010, 36, 1–48. [Google Scholar] [CrossRef]
- DerSimonian, R.; Laird, N. Meta-analysis in clinical trials. Control Clin. Trials 1986, 7, 177–188. [Google Scholar] [CrossRef]
- Appuhamy, J.R.N.; Strathe, A.B.; Jayasundara, S.; Wagner-Riddle, C.; Dijkstra, J.; France, J.; Kebreab, E. Anti-methanogenic effects of monensin in dairy and beef cattle: A meta-analysis. J. Dairy Sci. 2013, 96, 5161–5173. [Google Scholar] [CrossRef]
- SAS (Statistical Analysis System). SAS/STAT User’s Guide (Release 6.4); SAS Institute: Cary, NC, USA, 2017. [Google Scholar]
- Torres, R.N.S.; Moura, D.C.; Ghedini, C.P.; Ezequiel, J.M.B.; Almeida, M.T.C. Meta-analysis of the effects of essential oils on ruminal fermentation and performance of sheep. Small Rumin. Res. 2020, 189, 106148. [Google Scholar] [CrossRef]
- Egger, M.; Smith, G.D.; Altman, D.G. Systematic Reviews in Health Care, 2nd ed.; MBJ Publishing Group: London, UK, 2001; pp. 109–121. [Google Scholar]
- Lean, I.J.; Thompson, J.M.; Dunshea, F.R. A Meta-Analysis of Zilpaterol and Ractopamine Effects on Feedlot Performance, Carcass Traits and Shear Strength of Meat in Cattle. PLoS ONE 2014, 9, e115904. [Google Scholar] [CrossRef]
- Egger, M.; Smith, G.D.; Schneider, M.; Minder, C. Bias in meta-analysis detected by a simple, graphical test. BMJ 1997, 315, 629–634. [Google Scholar] [CrossRef]
- Duval, S.; Tweedie, R. A Nonparametric “Trim and Fill” Method of Accounting for Publication Bias in Meta-Analysis. J. Am. Stat. Assoc. 2000, 95, 89–98. [Google Scholar] [CrossRef]
- Littell, J.H.; Corcoran, J.; Pillai, V. Systematic Reviews and Meta-Analysis, 1st ed.; Oxford University Press: Oxford, UK, 2008; pp. 111–132. [Google Scholar]
- Salami, S.A.; Moran, C.A.; Warren, H.E.; Taylor-Pickard, J. A Meta-Analysis of the Effects of Slow-Release Urea Supplementation on the Performance of Beef Cattle. Animals 2020, 10, 657. [Google Scholar] [CrossRef]
- Moncada, J.; Tamayo, J.A.; Cardona, C.A. Techno-economic and environmental assessment of essential oil extraction from Citronella (Cymbopogon winteriana) and Lemongrass (Cymbopogon citrus): A Colombian case to evaluate different extraction technologies. Ind. Crop. Prod. 2014, 54, 175–184. [Google Scholar] [CrossRef]
- Moncada, J.; Tamayo, J.A.; Cardona, C.A. Techno-economic and environmental assessment of essential oil extraction from Oregano (Origanum vulgare) and Rosemary (Rosmarinus officinalis) in Colombia. J. Clean. Prod. 2016, 112, 172–181. [Google Scholar] [CrossRef]
- Ortiz-Sanchez, M.; Solarte-Toro, J.C.; Orrego-Alzate, C.E.; Acosta-Medina, C.D.; Cardona-Alzate, C.A. Integral use of orange peel waste through the biorefinery concept: An experimental, technical, energy, and economic assessment. Biomass- Convers. Biorefinery 2021, 11, 645–659. [Google Scholar] [CrossRef]
- Gerber, P.J.; Steinfeld, H.; Henderson, B.; Mottet, A.; Opio, C.; Dijkman, J.; Falcucci, A.; Tempio, G. Tackling Climate Change through Livestock: A Global Assessment of Emissions and Mitigation Opportunities; FAO: Rome, Italy, 2013. [Google Scholar]
- Zhou, R.; Wu, J.; Zhang, L.; Liu, L.; Casper, D.P.; Jiao, T.; Liu, T.; Wang, J.; Lang, X.; Song, S.; et al. Effects of oregano essential oil on the ruminal pH and microbial population of sheep. PLoS ONE 2019, 14, e0217054. [Google Scholar] [CrossRef]
- Mucha, W.; Witkowska, D. The Applicability of Essential Oils in Different Stages of Production of Animal-Based Foods. Molecules 2021, 26, 3798. [Google Scholar] [CrossRef]
- Masyita, A.; Sari, R.M.; Astuti, A.D.; Yasir, B.; Rumata, N.R.; Emran, T.B.; Nainu, F.; Simal-Gandara, J. Terpenes and terpenoids as main bioactive compounds of essential oils, their roles in human health and potential application as natural food preservatives. Food Chem. X 2022, 13, 100217. [Google Scholar] [CrossRef]
- Patra, A.K.; Yu, Z. Essential oils affect populations of some rumen bacteria in vitro as revealed by microarray (RumenBactArray) analysis. Front. Microbiol. 2015, 6, 297. [Google Scholar] [CrossRef]
- Naseri, V.; Kafilzadeh, F.; Jahani-Azizabadi, H. Effects of Pistacia atlantica gum essential oil on ruminal methanogen, protozoa, selected bacteria species and fermentation characteristics in sheep. Small Rumin. Res. 2022, 209, 106650. [Google Scholar] [CrossRef]
- Xu, L.; Wen, L.; Ge, Y.; Wan, G.; Qu, M.; Xue, F. Metagenomic Insights Into the Effects of Rare-Earth Elements Supplementation on Rumen Digestibility and Meat Quality of Beef Cattle. Front. Microbiol. 2020, 11, 1933. [Google Scholar] [CrossRef]
- Zhang, R.; Wu, J.; Lei, Y.; Bai, Y.; Jia, L.; Li, Z.; Liu, T.; Xu, Y.; Sun, J.; Wang, Y.; et al. Oregano Essential Oils Promote Rumen Digestive Ability by Modulating Epithelial Development and Microbiota Composition in Beef Cattle. Front. Nutr. 2021, 8, 871. [Google Scholar] [CrossRef]
- Williams, A.G.; Coleman, G.S. The Rumen Protozoa, 1st ed.; Springer: New York, NY, USA, 1992; pp. 1–425. [Google Scholar]
- Min, B.R.; Gurung, N.; Shange, R.; Solaiman, S.; Shange, R. Potential role of rumen microbiota in altering average daily gain and feed efficiency in meat goats fed simple and mixed pastures using bacterial tag-encoded FLX amplicon pyrosequencing1. J. Anim. Sci. 2019, 97, 3523–3534. [Google Scholar] [CrossRef]
- Newbold, C.J.; De La Fuente, G.; Belanche, A.; Ramos-Morales, E.; McEwan, N.R. The Role of Ciliate Protozoa in the Rumen. Front. Microbiol. 2015, 6, 1313. [Google Scholar] [CrossRef]
- Kwon, K.-M.; Nogoy, K.M.C.; Jeon, H.-E.; Han, S.-J.; Woo, H.-C.; Heo, S.-M.; Hong, H.K.; Lee, J.-I.; Lee, D.H.; Choi, S.H. Market weight, slaughter age, and yield grade to determine economic carcass traits and primal cuts yield of Hanwoo beef. J. Anim. Sci. Technol. 2022, 64, 143–154. [Google Scholar] [CrossRef]
- Seo, H.-W.; Van Ba, H.; Seong, P.-N.; Kim, Y.-S.; Kang, S.-M.; Seol, K.-H.; Kim, J.-H.; Moon, S.-S.; Choi, Y.-M.; Cho, S.-H. Relationship between body size traits and carcass traits with primal cuts yields in Hanwoo steers. Anim. Biosci. 2021, 34, 127–133. [Google Scholar] [CrossRef]
- Ryu, Y.; Lee, D.; Jung, S.H.; Lee, K.-J.; Jin, H.; Kim, S.J.; Lee, H.M.; Kim, B.; Won, K.-J. Sabinene Prevents Skeletal Muscle Atrophy by Inhibiting the MAPK–MuRF-1 Pathway in Rats. Int. J. Mol. Sci. 2019, 20, 4955. [Google Scholar] [CrossRef]
- Schiaffino, S.; Dyar, K.A.; Ciciliot, S.; Blaauw, B.; Sandri, M. Mechanisms regulating skeletal muscle growth and atrophy. FEBS J. 2013, 280, 4294–4314. [Google Scholar] [CrossRef]
- Jin, Q.; Liu, G.; Tan, X.; Zhang, X.; Liu, X.; Wei, C. Gallic acid as a key substance to inhibit proliferation and adipogenesis in bovine subcutaneous adipocyte. Anim. Biotechnol. 2020, 1–7. [Google Scholar] [CrossRef]
- Ngamdokmai, N.; Paracha, T.U.; Waranuch, N.; Chootip, K.; Wisuitiprot, W.; Suphrom, N.; Insumrong, K.; Ingkaninan, K. Effects of Essential Oils and Some Constituents from Ingredients of Anti-Cellulite Herbal Compress on 3T3-L1 Adipocytes and Rat Aortae. Pharmaceuticals 2021, 14, 253. [Google Scholar] [CrossRef] [PubMed]
- Zambell, K.L.; Fitch, M.D.; Fleming, S.E. Acetate and Butyrate Are the Major Substrates for De Novo Lipogenesis in Rat Colonic Epithelial Cells. J. Nutr. 2003, 133, 3509–3515. [Google Scholar] [CrossRef] [PubMed]
- Suriyapha, C.; Cherdthong, A.; Suntara, C.; Polyorach, S. Utilization of Yeast Waste Fermented Citric Waste as a Protein Source to Replace Soybean Meal and Various Roughage to Concentrate Ratios on In Vitro Rumen Fermentation, Gas Kinetic, and Feed Digestion. Fermentation 2021, 7, 120. [Google Scholar] [CrossRef]
- Supapong, C.; Cherdthong, A. Effect of Sulfur and Urea Fortification of Fresh Cassava Root in Fermented Total Mixed Ration on the Improvement Milk Quality of Tropical Lactating Cows. Vet. Sci. 2020, 7, 98. [Google Scholar] [CrossRef]
- Chanjula, P.; Suntara, C.; Cherdthong, A. The Effects of Oil Palm Fronds Silage Supplemented with Urea-Calcium Hydroxide on Rumen Fermentation and Nutrient Digestibility of Thai Native-Anglo Nubian Goats. Fermentation 2021, 7, 218. [Google Scholar] [CrossRef]
- Guyader, J.; Eugène, M.; Nozière, P.; Morgavi, D.P.; Doreau, M.; Martin, C. Influence of rumen protozoa on methane emission in ruminants: A meta-analysis approach. Animal 2014, 8, 1816–1825. [Google Scholar] [CrossRef]
- Hristov, A.; Bannink, A.; Crompton, L.; Huhtanen, P.; Kreuzer, M.; McGee, M.; Nozière, P.; Reynolds, C.; Bayat, A.-R.; Yáñez-Ruiz, D.; et al. Invited review: Nitrogen in ruminant nutrition: A review of measurement techniques. J. Dairy Sci. 2019, 102, 5811–5852. [Google Scholar] [CrossRef]
- Singh, B.P.; Cowie, A.L.; Chan, K.Y. Soil Health and Climate Change, 1st ed.; Springer: Berlin, Germany, 2011; p. 403. [Google Scholar]
- Wecking, A.R.; Wall, A.M.; Liáng, L.L.; Lindsey, S.B.; Luo, J.; Campbell, D.I.; Schipper, L.A. Reconciling annual nitrous oxide emissions of an intensively grazed dairy pasture determined by eddy covariance and emission factors. Agric. Ecosyst. Environ. 2020, 287, 106646. [Google Scholar] [CrossRef]
- Abdoun, K.A.; Stumpff, F.; Martens, H. Ammonia and urea transport across the rumen epithelium: A review. Anim. Health Res. Rev. 2006, 7, 43–59. [Google Scholar] [CrossRef]
- Paengkoum, P.; Chen, S.; Paengkoum, S. Effects of crude protein and undegradable intake protein on growth performance, nutrient utilization, and rumen fermentation in growing Thai-indigenous beef cattle. Trop. Anim. Health Prod. 2019, 51, 1151–1159. [Google Scholar] [CrossRef]
- Ran, T.; Shen, Y.Z.; Saleem, A.M.; AlZahal, O.; Beauchemin, K.A.; Yang, W.Z. Using ruminally protected and nonprotected active dried yeast as alternatives to antibiotics in finishing beef steers: Growth performance, carcass traits, blood metabolites, and fecal Escherichia coli. J. Anim. Sci. 2018, 96, 4385–4397. [Google Scholar] [CrossRef]
- Roland, L.; Drillich, M.; Iwersen, M. Hematology as a diagnostic tool in bovine medicine. J. Vet. Diagn. Investig. 2014, 26, 592–598. [Google Scholar] [CrossRef]
- Honda, T.; Uehara, T.; Matsumoto, G.; Arai, S.; Sugano, M. Neutrophil left shift and white blood cell count as markers of bacterial infection. Clin. Chim. Acta 2016, 457, 46–53. [Google Scholar] [CrossRef]
- Chauhan, J.; Stavraka, C.; Grandits, M.; Palhares, L.C.G.F.; Josephs, D.H.; Lacy, K.E.; Spicer, J.; Bax, H.J.; Karagiannis, S.N. Clinical and Translational Significance of Basophils in Patients with Cancer. Cells 2022, 11, 438. [Google Scholar] [CrossRef]
- Ceciliani, F.; Ceron, J.J.; Eckersall, P.D.; Sauerwein, H. Acute phase proteins in ruminants. J. Proteom. 2012, 75, 4207–4231. [Google Scholar] [CrossRef]
- Plaizier, J.C.; Krause, D.O.; Gozho, G.N.; McBride, B.W. Subacute ruminal acidosis in dairy cows: The physiological causes, incidence and consequences. Vet. J. 2008, 176, 21–31. [Google Scholar] [CrossRef]
- Yang, W.Z.; Benchaar, C.; Ametaj, B.N.; Beauchemin, K.A. Dose response to eugenol supplementation in growing beef cattle: Ruminal fermentation and intestinal digestion. Anim. Feed Sci. Technol. 2010, 158, 57–64. [Google Scholar] [CrossRef]
- Jankowiak, H.; Cebulska, A.; Bocian, M. The relationship between acidification (pH) and meat quality traits of polish white breed pigs. Eur. Food. Res. Technol. 2021, 247, 2813–2820. [Google Scholar] [CrossRef]
- Węglarz, A. Meat quality defined based on pH and colour depending on cattle category and slaughter season. colour and pH as determinants of meat quality dependent on cattle category and slaughter season. Czech J. Anim. Sci. 2010, 55, 548–556. [Google Scholar] [CrossRef]
- Ablikim, B.; Liu, Y.; Kerim, A.; Shen, P.; Abdurerim, P.; Zhou, G.H. Effects of breed, muscle type, and frozen storage on physico-chemical characteristics of lamb meat and its relationship with tenderness. CyTA—J. Food 2016, 14, 109–116. [Google Scholar] [CrossRef]
- Li, X.; Ha, M.; Warner, R.D.; Dunshea, F.R. Meta-analysis of the relationship between collagen characteristics and meat tenderness. Meat Sci. 2022, 185, 108717. [Google Scholar] [CrossRef] [PubMed]
- Rowe, L.J.; Maddock, K.R.; Lonergan, S.M.; Huff-Lonergan, E. Oxidative environments decrease tenderization of beef steaks through inactivation of μ-calpain1. J. Anim. Sci. 2004, 82, 3254–3266. [Google Scholar] [CrossRef]
- Font-I-Furnols, M.; Guerrero, L. Consumer preference, behavior and perception about meat and meat products: An overview. Meat Sci. 2014, 98, 361–371. [Google Scholar] [CrossRef]
- Realini, C.E.; i Furnols, M.F.I.; Sañudo, C.; Montossi, F.; Oliver, M.A.; Guerrero, L. Spanish, French and British consumers’ acceptability of Uruguayan beef, and consumers’ beef choice associated with country of origin, finishing diet and meat price. Meat Sci. 2013, 95, 14–21. [Google Scholar] [CrossRef]
- Falowo, A.B.; Fayemi, P.O.; Muchenje, V. Natural antioxidants against lipid–protein oxidative deterioration in meat and meat products: A review. Food Res. Int. 2014, 64, 171–181. [Google Scholar] [CrossRef]
- Amaral, A.B.; da Silva, M.V.; Lannes, S.C.D.S. Lipid oxidation in meat: Mechanisms and protective factors—A review. Food Sci. Technol. 2018, 38, 1–15. [Google Scholar] [CrossRef]
- Akbarian, A.; Michiels, J.; Golian, A.; Buyse, J.; Wang, Y.; De Smet, S. Gene expression of heat shock protein 70 and antioxidant enzymes, oxidative status, and meat oxidative stability of cyclically heat-challenged finishing broilers fedOriganum compactum andCurcuma xanthorrhiza essential oils. Poult. Sci. 2014, 93, 1930–1941. [Google Scholar] [CrossRef]
- Tian, Q.; Piao, X. Essential Oil Blend Could Decrease Diarrhea Prevalence by Improving Antioxidative Capability for Weaned Pigs. Animals 2019, 9, 847. [Google Scholar] [CrossRef]
- Ornaghi, M.G.; Guerrero, A.; Vital, A.C.P.; de Souza, K.A.; Passetti, R.A.C.; Mottin, C.; Castilho, R.D.A.; Sañudo, C.; Prado, I.N.D. Improvements in the quality of meat from beef cattle fed natural additives. Meat Sci. 2020, 163, 108059. [Google Scholar] [CrossRef]
- Fruet, A.P.B.; Giotto, F.M.; Fonseca, M.A.; Nörnberg, J.L.; De Mello, A.S. Effects of the Incorporation of Tannin Extract from Quebracho Colorado Wood on Color Parameters, Lipid Oxidation, and Sensory Attributes of Beef Patties. Foods 2020, 9, 667. [Google Scholar] [CrossRef]
- Calnan, H.; Jacob, R.; Pethick, D.; Gardner, G. Factors affecting the colour of lamb meat from the longissimus muscle during display: The influence of muscle weight and muscle oxidative capacity. Meat Sci. 2014, 96, 1049–1057. [Google Scholar] [CrossRef] [PubMed]
- Teixeira, A.; Jimenez-Badillo, M.R.; Rodrigues, S.S.Q. Effect of sex and carcass weight on carcass traits and meat quality in goat kids of Cabrito Transmontano. Span. J. Agric. Res. 2011, 9, 753–760. [Google Scholar] [CrossRef]
- Toldrá, F. Lawrie’s Meat Science, 8th ed.; Woodhead Publishing Limited: Cambridge, UK, 2017; p. 713. [Google Scholar]
- Rotz, C.A.; Asem-Hiablie, S.; Place, S.; Thoma, G. Environmental footprints of beef cattle production in the United States. Agric. Syst. 2019, 169, 1–13. [Google Scholar] [CrossRef]
- Capper, J.L.; Hayes, D.J. The environmental and economic impact of removing growth-enhancing technologies from U.S. beef production. J. Anim. Sci. 2012, 90, 3527–3537. [Google Scholar] [CrossRef]
- Zein, M.; Jamarun, N.; Musnandar, E. Effect of Increasing Doses of Essential Oil Extracted from Berastagi Orange (Citrus sinensis L.) Peels on Performance, Rumen Fermentation and Blood Metabolites in Fattening Bali Cattle. Pak. J. Nutr. 2015, 14, 480–486. [Google Scholar] [CrossRef]
- Almeida, M.T.C.; Paschoaloto, J.R.; Perez, H.L.; Carvalho, V.B.; Junior, A.C.H.; Favaro, V.R.; Blair, H.T.; Ezequiel, J.M.B. Effect of adding crude glycerine to diets with feed additives on the feed intake, ruminal degradability, volatile fatty acid concentrations and in vitro gas production of feedlot Nellore cattle. J. Anim. Physiol. Anim. Nutr. 2019, 103, 988–996. [Google Scholar] [CrossRef]
- Brand, T.; Hünerberg, M.; McAllister, T.A.; He, M.; Saleem, A.M.; Shen, Y.; Miller, B.; Yang, W. Impact of a phytogenic feed additive on growth performance, feed intake, and carcass traits of finishing steers. Transl. Anim. Sci. 2019, 3, 1162–1172. [Google Scholar] [CrossRef]
- Carvalho, V.M.; Ávila, V.A.D.; Bonin, E.; Matos, A.M.; Prado, R.M.D.; Castilho, R.A.; Silva, R.R.; Filho, B.A.D.A.; Prado, I.N.D. Effect of extracts from baccharis, tamarind, cashew nut shell liquid and clove on animal performance, feed efficiency, digestibility, rumen fermentation and feeding behavior of bulls finished in feedlot. Livest. Sci. 2020, 244, 104361. [Google Scholar] [CrossRef]
- Chapman, C.E.; Chester-Jones, H.; Ziegler, D.; Clapper, J.A.; Erickson, P.S. Effects of cinnamaldehyde or monensin on performance of weaned Holstein dairy heifers. J. Dairy Sci. 2017, 100, 1712–1719. [Google Scholar] [CrossRef]
- Filho, E.S.C.; Júnior, L.C.R.; Ezequiel, J.M.B.; Salles, M.S.V.; Almeida, M.T.C.; Perez, H.L.; Suguino, E.; van Cleef, E.H.C.B. Effect of thyme essential oil supplementation on feed intake, apparent digestibility, rumen fermentation, blood parameters and in vitro methane yield of Nellore cattle. Livest. Sci. 2020, 244, 104349. [Google Scholar] [CrossRef]
- Guerrero, A.; Rivaroli, D.C.; Sañudo, C.; Campo, M.M.; Valero, M.V.; Jorge, A.M.; Prado, I.N. Consumer acceptability of beef from two sexes supplemented with essential oil mix. Anim. Prod. Sci. 2018, 58, 1700–1707. [Google Scholar] [CrossRef]
- Khorrami, B.; Vakili, A.R.; Mesgaran, M.D.; Klevenhusen, F. Thyme and cinnamon essential oils: Potential alternatives for monensin as a rumen modifier in beef production systems. Anim. Feed Sci. Technol. 2015, 200, 8–16. [Google Scholar] [CrossRef]
- Kim, S.C.; Adesogan, A.T.; Shin, J.H. Effects of dietary addition of wormwood (Artemisia montana Pampan) silage on growth performance, carcass characteristics, and muscle fatty acid profiles of beef cattle. Anim. Feed Sci. Technol. 2012, 177, 15–22. [Google Scholar] [CrossRef]
- Latack, B.C.; Montano, M.F.; Zinn, R.A.; Salinas-Chavira, J. Effects of a blend of cinnamaldehyde-eugenol and capsicum (Xtract® Ruminant 7065) and ionophore on performance of finishing Holstein steers and on characteristics of ruminal and total tract digestion. J. Appl. Anim. Res. 2021, 49, 185–193. [Google Scholar] [CrossRef]
- Monteschio, J.O.; Vargas-Junior, F.M.; Almeida, F.L.; Pinto, L.A.D.M.; Kaneko, I.N.; Almeida, A.A.; Freitas, L.W.; Alves, S.P.; Bessa, R.J.; Prado, I.N. The effect of encapsulated active principles (eugenol, thymol and vanillin) and clove and rosemary essential oils on the structure, collagen content, chemical composition and fatty acid profile of Nellore heifers muscle. Meat Sci. 2019, 155, 27–35. [Google Scholar] [CrossRef]
- Ornaghi, M.G.; Passetti, R.A.C.; Torrecilhas, J.A.; Mottin, C.; Vital, A.C.P.; Guerrero, A.; Sañudo, C.; Campo, M.d.M.; Prado, I.N. Essential oils in the diet of young bulls: Effect on animal performance, digestibility, temperament, feeding behaviour and carcass characteristics. Anim. Feed Sci. Technol. 2017, 234, 274–283. [Google Scholar] [CrossRef]
- Prado, I.N.; Cruz, O.T.B.; Valero, M.V.; Zawadzki, F.; Eiras, C.E.; Rivaroli, D.C.; Prado, R.M.; Visentainer, J.V. Effects of glycerin and essential oils (Anacardium occidentale and Ricinus communis) on the meat quality of crossbred bulls finished in a feedlot. Anim. Prod. Sci. 2016, 56, 2105–2114. [Google Scholar] [CrossRef]
- Pukrop, J.; Campbell, B.; Schoonmaker, J. Effect of essential oils on performance, liver abscesses, carcass characteristics and meat quality in feedlot steers. Anim. Feed Sci. Technol. 2019, 257, 114296. [Google Scholar] [CrossRef]
- Rivaroli, D.C.; Guerrero, A.; Valero, M.V.; Zawadzki, F.; Eiras, C.E.; del Mar Campo, M.D.M.; Sañudo, C.; Jorge, A.; do Prado, I.N. Effect of essential oils on meat and fat qualities of crossbred young bulls finished in feedlots. Meat Sci. 2016, 121, 278–284. [Google Scholar] [CrossRef]
- de Souza, K.A.; Monteschio, J.D.O.; Mottin, C.; Ramos, T.R.; Pinto, L.A.d.M.; Eiras, C.E.; Guerrero, A.; do Prado, I.N. Effects of diet supplementation with clove and rosemary essential oils and protected oils (eugenol, thymol and vanillin) on animal performance, carcass characteristics, digestibility, and ingestive behavior activities for Nellore heifers finished in feedlot. Livest. Sci. 2019, 220, 190–195. [Google Scholar] [CrossRef]
- Tomkins, N.W.; Denman, S.E.; Pilajun, R.; Wanapat, M.; McSweeney, C.S.; Elliott, R. Manipulating rumen fermentation and methanogenesis using an essential oil and monensin in beef cattle fed a tropical grass hay. Anim. Feed Sci. Technol. 2015, 200, 25–34. [Google Scholar] [CrossRef]
- Torrecilhas, J.A.; Ornaghi, M.G.; Passetti, R.A.C.; Mottin, C.; Guerrero, A.; Ramos, T.R.; Vital, A.C.P.; Sañudo, C.; Malheiros, E.B.; Prado, I.N.D. Meat quality of young bulls finished in a feedlot and supplemented with clove or cinnamon essential oils. Meat Sci. 2021, 174, 108412. [Google Scholar] [CrossRef]
- Vakili, A.R.; Khorrami, B.; Mesgaran, M.D.; Parand, E. The Effects of Thyme and Cinnamon Essential Oils on Performance, Rumen Fermentation and Blood Metabolites in Holstein Calves Consuming High Concentrate Diet. Asian-Australasian J. Anim. Sci. 2013, 26, 935–944. [Google Scholar] [CrossRef]
- Valero, M.V.; Torrecilhas, J.A.; Zawadzki, F.; Bonafé, E.G.; Madrona, G.S.; Prado, R.M.D.; Passetti, R.A.C.; Rivaroli, D.C.; Visentainer, J.V.; Prado, I.N.D. Propolis or cashew and castor oils effects on composition of Longissimus muscle of crossbred bulls finished in feedlot. Chil. J. Agric. Res. 2014, 74, 445–451. [Google Scholar] [CrossRef][Green Version]
- Wanapat, M.; Kang, S.; Khejornsart, P.; Wanapat, S. Effects of Plant Herb Combination Supplementation on Rumen Fermentation and Nutrient Digestibility in Beef Cattle. Asian-Australas. J. Anim. Sci. 2013, 26, 1127–1136. [Google Scholar] [CrossRef]
- Wu, J.; Bai, Y.; Lang, X.; Wang, C.; Shi, X.; Casper, D.P.; Zhang, L.; Liu, H.; Liu, T.; Gong, X.; et al. Dietary supplementation with oregano essential oil and monensin in combination is antagonistic to growth performance of yearling Holstein Bulls. J. Dairy Sci. 2020, 103, 8119–8129. [Google Scholar] [CrossRef]
- Yang, W.Z.; Ametaj, B.N.; Benchaar, C.; Beauchemin, K.A. Dose response to cinnamaldehyde supplementation in growing beef heifers: Ruminal and intestinal digestion1. J. Anim. Sci. 2010, 88, 680–688. [Google Scholar] [CrossRef]
- Holland, R.; Loveday, D.; Ferguson, K. How Much Meat to Expect from a Beef Carcass; University of Tennessee Institute of Agriculture: Tennessee, TN, USA, 2014. [Google Scholar]
- Pereira, P.M.d.C.C.; Vicente, A.F.d.R. B Meat nutritional composition and nutritive role in the human diet. Meat Sci. 2013, 93, 586–592. [Google Scholar] [CrossRef]
- Williams, P. Nutritional composition of red meat. Nutr. Diet. 2007, 64, S113–S119. [Google Scholar] [CrossRef]


| Parameter | Mean | Median | Minimum | Maximum | SD | ||||||
|---|---|---|---|---|---|---|---|---|---|---|---|
| Dietary Features | NC | Control | EOs | Control | EOs | Control | EOs | Control | EOs | Control | EOs |
| Concentrate, g/kg DM | 84 | 704.1 | 704.1 | 850.0 | 850.0 | 0.0 | 0.0 | 930.0 | 930.0 | 261.6 | 261.6 |
| DM, g/kg DM | 74 | 752.4 | 753.8 | 719.0 | 724.0 | 403.4 | 403.4 | 931 | 931 | 141.7 | 140.3 |
| OM, g/kg DM | 50 | 944.6 | 944.5 | 971.0 | 968.0 | 807 | 807 | 977 | 977 | 38.2 | 38.0 |
| CP, g/kg DM | 84 | 134.3 | 134.3 | 131.0 | 131.0 | 88.7 | 88.7 | 191.5 | 191.5 | 17.9 | 18.13 |
| EE, g/kg DM | 59 | 33.01 | 33.11 | 35.0 | 35.0 | 8.1 | 8.1 | 80.3 | 80.3 | 12.9 | 12.9 |
| NDF, g/kg DM | 87 | 299.8 | 299.3 | 237.0 | 241.0 | 143.0 | 151.0 | 688.0 | 688.0 | 135.8 | 134.8 |
| ADF, g/kg DM | 75 | 158.8 | 158.7 | 123.0 | 123.0 | 39.0 | 44.0 | 428.8 | 428.0 | 94.6 | 94.5 |
| Starch, g/kg DM | 20 | 416.7 | 415.9 | 440.0 | 440.0 | 199.6 | 199.6 | 545.0 | 545.0 | 106.9 | 107.8 |
| Ca, g/kg DM | 33 | 6.8 | 6.8 | 6.2 | 6.2 | 3.9 | 4.0 | 14.8 | 14.8 | 2.47 | 2.46 |
| P, g/kg DM | 33 | 3.7 | 3.7 | 3.6 | 3.6 | 2.7 | 2.6 | 4.7 | 4.7 | 0.45 | 0.46 |
| EOs, mg/kg DM | 89 | - | 295.0 | - | 175.0 | - | 5.0 | - | 1200 | - | 288 |
| Duration, days | 89 | 111.0 | 84.0 | 21.0 | 390.0 | 67.1 | |||||
| Item | N (NC) | Control Means (SD) | WMD (95 % CI) | p-Value | Heterogeneity | Egger Test 1 | |
|---|---|---|---|---|---|---|---|
| p-Value | I2 (%) | p-Value | |||||
| Intake, kg/d | |||||||
| DMI | 26 (68) | 8.40 (1.79) | 0.209 (0.129; 0.288) | <0.001 | <0.001 | 98.93 | 0.645 |
| OMI | 5 (13) | 8.5 (1.95) | −0.078 (−0.274; 0.119) | 0.437 | 0.436 | 0.98 | 0.136 |
| CPI | 5 (13) | 1.10 (0.16) | 0.067 (0.019; 0.115) | 0.006 | <0.001 | 77.21 | 0.806 |
| NDFI | 8 (21) | 2.71 (0.86) | 0.129 (0.036; 0.222) | 0.007 | <0.001 | 86.40 | 0.497 |
| ADFI | 3 (9) | 1.21 (0.57) | 0.122 (0.094; 0.149) | <0.001 | 0.835 | 0.00 | NA |
| Digestibility, g/kg of DM | |||||||
| DMD | 8 (21) | 675.5 (73.4) | 1.121 (−17.557; 19.799) | 0.906 | <0.001 | 99.64 | 0.207 |
| OMD | 6 (15) | 721.4 (77.0) | −11.260 (−38.157; 15.638) | 0.412 | <0.001 | 99.79 | 0.116 |
| CPD | 7 (20) | 700.1 (67.9) | −8.954 (−24.050; 6.143) | 0.245 | <0.001 | 99.35 | 0.126 |
| NDFD | 10 (27) | 547.3 (97.3) | −2.752 (−26.906; 21.402) | 0.823 | <0.001 | 99.74 | 0.489 |
| ADFD | 3 (8) | 536.2 (18.9) | −22.771 (−37.735; −7.807) | 0.003 | <0.001 | 99.39 | NA |
| Item | N (NC) | Control Means (SD) | WMD (95 % CI) | p-Value | Heterogeneity | Egger Test 1 | |
|---|---|---|---|---|---|---|---|
| p-Value | I2 (%) | p-Value | |||||
| FBW, kg | 17 (38) | 440.6 (160.6) | 12.843 (7.352; 18.321) | <0.001 | <0.001 | 77.67 | 0.084 |
| DWG, kg/d | 16 (36) | 1.213 (0.463) | 0.087 (0.053; 0.120) | <0.001 | <0.001 | 75.15 | 0.062 |
| FE, kg/kg | 13 (29) | 0.173 (0.034) | 0.004 (0.000; 0.008) | 0.039 | 0.902 | 0.00 | 0.235 |
| Carcass traits | |||||||
| HCW, kg | 9 (22) | 295.1 (81.30) | 5.455 (1.860; 9.050) | 0.003 | <0.001 | 57.24 | 0.360 |
| HCY, % | 8 (19) | 56.31 (3.54) | −0.159 (−0.416; 0.099) | 0.227 | 0.014 | 46.38 | 0.287 |
| CCW, kg | 4 (13) | 229.7 (43.70) | 9.975 (3.757; 16.194) | 0.002 | <0.001 | 82.34 | 0.369 |
| CCY, % | 4 (13) | 53.80 (1.07) | −0.016 (−0.741; 0.710) | 0.966 | <0.001 | 99.32 | 0.847 |
| BFT, mm | 11 (24) | 8.64 (6.55) | 0.074 (−0.245; 0.393) | 0.648 | <0.001 | 78.92 | 0.903 |
| LMA, cm2 | 10 (22) | 74.66 (15.52) | 3.480 (1.597; 5.364) | <0.001 | <0.001 | 73.54 | 0.435 |
| Item | N (NC) | Control Means (SD) | WMD (95 % CI) | p-Value | Heterogeneity | Egger Test 1 | |
|---|---|---|---|---|---|---|---|
| p-Value | I2 (%) | p-Value | |||||
| pH | 12 (36) | 6.21 (0.45) | 0.001 (−0.01; 0.02) | 0.943 | 0.275 | 11.45 | 0.475 |
| NH3-N, mg/dL | 10 (30) | 13.71 (6.64) | −1.18 (−1.63; −0.74) | <0.001 | 0.121 | 37.73 | 0.190 |
| TVFA, mM | 13 (37) | 103.3 (26.07) | −2.44 (−4.76; −0.13) | 0.039 | <0.001 | 84.71 | 0.799 |
| SCFA, mol/100 mol | |||||||
| Acetate | 14 (40) | 61.74 (15.65) | −4.37 (−7.72; −1.02) | 0.011 | <0.001 | 98.84 | 0.554 |
| Propionate | 14 (40) | 23.44 (7.36) | 0.878 (0.48; 1.27) | <0.001 | 0.152 | 35.29 | 0.120 |
| Butyrate | 14 (40) | 11.31 (3.96) | −0.01 (−0.27; 0.25) | 0.922 | <0.001 | 56.81 | 0.337 |
| Protozoa, ×105/mL | |||||||
| Total | 5 (12) | 12.47 (4.68) | −2.17 (−4.26; −0.09) | 0.041 | <0.001 | 78.63 | 0.610 |
| Entodinium | 3 (7) | 9.55 (1.88) | 0.08 (−0.36; 0.52) | 0.726 | <0.001 | 83.97 | NA |
| Isotricha | 3 (7) | 1.49 (0.47) | −0.65 (−1.09; −0.21) | 0.004 | 0.350 | 45.63 | NA |
| Dasytricha | 3 (7) | 5.37 (1.54) | −1.26 (−1.61; −0.91) | <0.001 | 0.617 | 0.00 | NA |
| CH4, g/kg DM | 3 (7) | 22.11 (7.02) | −0.08 (−1.29; 1.13) | 0.893 | <0.001 | 78.79 | NA |
| Nitrogen balance, g/d | |||||||
| N intake | 3 (8) | 182.1 (52.7) | 2.89 (−3.41; 9.19) | 0.368 | 0.642 | 0.00 | NA |
| N urine | 3 (8) | 55.2 (34.3) | −6.4 (−10.93; −1.96) | 0.005 | <0.001 | 90.48 | NA |
| N fecal | 3 (8) | 57.1 (12.2) | 0.23 (−3.56; 4.03) | 0.904 | 0.857 | 0.00 | NA |
| N retained | 3 (8) | 69.7 (10.6) | 7.44 (1.73; 13.14) | 0.011 | 0.167 | 46.95 | NA |
| RNM | 4 (9) | 96.28 (26.73) | −1.00 (−6.61; 4.61) | 0.726 | 0.056 | 47.21 | NA |
| EMPS | 3 (7) | 31.57 (14.31) | 0.87 (−1.94; 3.67) | 0.544 | 0.936 | 0.00 | NA |
| Item | N (NC) | Control Means (SD) | WMD (95 % CI) | p-Value | Heterogeneity | Egger Test 1 | |
|---|---|---|---|---|---|---|---|
| p-Value | I2 (%) | p-Value | |||||
| Blood metabolites, mg/dL | |||||||
| Urea | 7 (18) | 18.42 (5.78) | −1.35 (−2.553; −0.162) | 0.026 | 0.128 | 30.22 | 0.071 |
| Glucose | 7 (18) | 77.49 (26.51) | 1.44 (−0.107; 2.998) | 0.068 | 0.945 | 0.00 | 0.895 |
| Triglycerides | 4 (12) | 12.12 (3.29) | 0.53 (−0.295; 1.356) | 0.208 | 0.980 | 0.00 | 0.693 |
| NEFA, μM | 3 (9) | 102.2 (44.1) | −9.05 (−15.20; −2.89) | 0.004 | 0.509 | 0.00 | NA |
| Hb, g/dL | 3 (6) | 14.537 (1.45) | −1.78 (−6.059; 2.505) | 0.416 | <0.001 | 99.35 | NA |
| WBC, 103/μL | 3 (7) | 9.907 (0.96) | −0.19 (−0.943; 0.564) | 0.622 | 0.904 | 0.00 | NA |
| White blood cells (WBC), % of total | |||||||
| Lymphocytes | 3 (7) | 58.56 (4.01) | 2.67 (−0.299; 5.642) | 0.078 | 0.564 | 0.00 | NA |
| Neutrophils | 3 (7) | 28.17 (3.35) | −2.89 (−5.551; −0.230) | 0.033 | 0.716 | 0.00 | NA |
| Monocytes | 3 (7) | 8.823 (1.66) | −0.32 (−1.885; 1.241) | 0.686 | 0.995 | 0.00 | NA |
| Eosinophils | 3 (7) | 4.37 (1.78) | 0.24 (−1.016; 1.495) | 0.709 | 0.707 | 0.00 | NA |
| Basophils | 3 (7) | 1.89 (1.15) | −1.02 (−1.790; −0.249) | 0.010 | <0.001 | 79.56 | NA |
| Acute phase proteins μg/mL | |||||||
| Haptoglobin | 4 (10) | 265.3 (107.2) | −39.67 (−75.74; −3.59) | 0.031 | 0.791 | 0.00 | 0.123 |
| SAA | 3 (9) | 0.317 (0.054) | 0.02 (−0.053; 0.036) | 0.603 | 0.820 | 0.00 | NA |
| LBP | 3 (9) | 1.405 (0.268) | 0.06 (−0.135; 0.251) | 0.556 | 0.404 | 3.72 | NA |
| Item | N (NC) | Control Means (SD) | WMD (95 % CI) | p-Value | Heterogeneity | Egger Test 1 | |
|---|---|---|---|---|---|---|---|
| p-Value | I2 (%) | p-Value | |||||
| Meat pH 24 h | 7 (21) | 5.637 (0.11) | −0.002 (−0.025; 0.021) | 0.865 | <0.001 | 66.13 | 0.099 |
| Cook loss, g/kg | 6 (17) | 270.80 (45.90) | −61.765 (−107.9; −15.59) | 0.009 | <0.001 | 99.09 | 0.062 |
| ShF, kgf/cm2 | 8 (19) | 5.53 (1.98) | −0.211 (−0.400; −0.022) | 0.029 | <0.001 | 62.36 | 0.124 |
| MDA, mg/kg | 7 (18) | 0.346 (0.19) | −0.040 (−0.070; −0.010) | 0.008 | <0.001 | 88.38 | 0.942 |
| Meat color | |||||||
| Lightness (L*) | 8 (21) | 38.76 (1.92) | −0.382 (−0.817; 0.053) | 0.085 | 0.001 | 55.22 | 0.808 |
| Redness (a*) | 8 (21) | 15.58 (3.43) | 0.018 (−0.160; 0.196) | 0.841 | 0.445 | 1.02 | 0.078 |
| Yellowness (b*) | 8 (21) | 10.62 (2.46) | −0.042 (−0.210; 0.127) | 0.627 | 0.067 | 36.86 | 0.243 |
| Chemical composition, g/kg of DM | |||||||
| Moisture | 6 (14) | 728.49 (16.10) | 1.307 (−2.923; 5.537) | 0.545 | <0.001 | 62.53 | 0.301 |
| Protein | 5 (12) | 227.48 (5.19) | 0.935 (−0.600; 2.574) | 0.233 | 0.507 | 0.00 | 0.682 |
| Fat | 5 (12) | 19.54 (7.50) | −0.736 (−2.275; 0.804) | 0.349 | 0.942 | 0.00 | 0.206 |
| Ash | 5 (12) | 12.66 (1.65) | −0.033 (−0.256; 0.191) | 0.773 | 0.475 | 0.00 | 0.725 |
| Collagen | 3 (10) | 18.32 (6.71) | 0.271 (−0.083; 0.626) | 0.133 | 0.534 | 0.00 | 0.061 |
| Parameter | Covariates | QM | df | p-Value | R2 (%) |
|---|---|---|---|---|---|
| Dry matter intake (DMI) | Essential oils dose | 9.84 | 1 | 0.002 | 33.59 |
| Supplementation period | 8.96 | 1 | 0.003 | 26.21 | |
| Primary bioactive compound | 2.09 | 5 | 0.835 | 0.00 | |
| Concentrate level | 44.07 | 1 | <0.001 | 40.07 | |
| Neutral detergent fiber digestibility (NDFD) | Essential oils dose | 0.01 | 1 | 0.999 | 0.00 |
| Supplementation period | 2.12 | 1 | 0.145 | 23.69 | |
| Primary bioactive compound | 1.26 | 4 | 0.868 | 0.00 | |
| Concentrate level | 0.94 | 1 | 0.332 | 18.90 | |
| Final body weight (FBW) | Essential oils dose | 0.30 | 1 | 0.584 | 0.00 |
| Supplementation period | 45.12 | 1 | <0.001 | 65.50 | |
| Primary bioactive compound | 3.13 | 3 | 0.372 | 0.00 | |
| Concentrate level | 14.88 | 1 | <0.001 | 33.61 | |
| Daily weight gain (DWG) | Essential oils dose | 0.57 | 1 | 0.451 | 0.00 |
| Supplementation period | 3.74 | 1 | 0.053 | 14.45 | |
| Primary bioactive compound | 1.97 | 3 | 0.578 | 0.00 | |
| Concentrate level | 7.91 | 1 | 0.005 | 27.56 | |
| Backfat thickness (BFT) | Essential oils dose | 8.96 | 1 | 0.003 | 20.17 |
| Supplementation period | 3.81 | 1 | 0.051 | 3.08 | |
| Primary bioactive compound | 2.67 | 3 | 0.445 | 0.00 | |
| Concentrate level | 0.74 | 1 | 0.388 | 0.00 | |
| Longissimus dorsi muscle area (LMA) | Essential oils dose | 0.05 | 1 | 0.823 | 0.00 |
| Supplementation period | 0.79 | 1 | 0.372 | 0.00 | |
| Primary bioactive compound | 1.43 | 3 | 0.699 | 0.00 | |
| Concentrate level | 1.21 | 1 | 0.271 | 2.32 | |
| Total volatile fatty acids (TVFA) | Essential oils dose | 8.88 | 1 | 0.003 | 55.43 |
| Supplementation period | 0.15 | 1 | 0.698 | 0.00 | |
| Primary bioactive compound | 1.21 | 5 | 0.944 | 0.00 | |
| Concentrate level | 2.70 | 1 | 0.100 | 5.08 | |
| Acetate | Essential oils dose | 5.89 | 1 | 0.015 | 12.50 |
| Supplementation period | 0.01 | 1 | 0.935 | 0.00 | |
| Primary bioactive compound | 1.76 | 5 | 0.881 | 6.14 | |
| Concentrate level | 2.24 | 1 | 0.134 | 3.56 | |
| Butyrate | Essential oils dose | 0.70 | 1 | 0.402 | 0.00 |
| Supplementation period | 2.97 | 1 | 0.184 | 9.12 | |
| Primary bioactive compound | 5.38 | 5 | 0.372 | 0.00 | |
| Concentrate level | 0.40 | 1 | 0.526 | 0.00 |
| Item | Control | EOs | Difference | % Change |
|---|---|---|---|---|
| Economic impact analysis 1 | ||||
| FR to gain 200 kg BW, kg DM/animal | 1156.07 | 1129.94 | −26.13 | −2.26 |
| DFS, days | 165 | 154 | −11 | −6.66 |
| FC, USD/animal | 289.02 | 284.85 | −4.17 | −1.44 |
| Total FC, USD/1000 animals | 289,020 | 284,850 | −4.170 | −1.44 |
| Environmental impact analysis | ||||
| EI attributed to FU, kg CO2-eq per BPO/animal 2 | 1857 | 1815 | −42 | −2.26 |
| EI, kg CO2-eq per BPO/animal | 5160 | 5117 | −43 | −0.83 |
| Total EI, tonnes CO2-eq per BPO/1000 animals | 5160 | 5117 | −43 | −0.83 |
Publisher’s Note: MDPI stays neutral with regard to jurisdictional claims in published maps and institutional affiliations. |
© 2022 by the authors. Licensee MDPI, Basel, Switzerland. This article is an open access article distributed under the terms and conditions of the Creative Commons Attribution (CC BY) license (https://creativecommons.org/licenses/by/4.0/).
Share and Cite
Orzuna-Orzuna, J.F.; Dorantes-Iturbide, G.; Lara-Bueno, A.; Miranda-Romero, L.A.; Mendoza-Martínez, G.D.; Santiago-Figueroa, I. A Meta-Analysis of Essential Oils Use for Beef Cattle Feed: Rumen Fermentation, Blood Metabolites, Meat Quality, Performance and, Environmental and Economic Impact. Fermentation 2022, 8, 254. https://doi.org/10.3390/fermentation8060254
Orzuna-Orzuna JF, Dorantes-Iturbide G, Lara-Bueno A, Miranda-Romero LA, Mendoza-Martínez GD, Santiago-Figueroa I. A Meta-Analysis of Essential Oils Use for Beef Cattle Feed: Rumen Fermentation, Blood Metabolites, Meat Quality, Performance and, Environmental and Economic Impact. Fermentation. 2022; 8(6):254. https://doi.org/10.3390/fermentation8060254
Chicago/Turabian StyleOrzuna-Orzuna, José Felipe, Griselda Dorantes-Iturbide, Alejandro Lara-Bueno, Luis Alberto Miranda-Romero, Germán David Mendoza-Martínez, and Itzel Santiago-Figueroa. 2022. "A Meta-Analysis of Essential Oils Use for Beef Cattle Feed: Rumen Fermentation, Blood Metabolites, Meat Quality, Performance and, Environmental and Economic Impact" Fermentation 8, no. 6: 254. https://doi.org/10.3390/fermentation8060254
APA StyleOrzuna-Orzuna, J. F., Dorantes-Iturbide, G., Lara-Bueno, A., Miranda-Romero, L. A., Mendoza-Martínez, G. D., & Santiago-Figueroa, I. (2022). A Meta-Analysis of Essential Oils Use for Beef Cattle Feed: Rumen Fermentation, Blood Metabolites, Meat Quality, Performance and, Environmental and Economic Impact. Fermentation, 8(6), 254. https://doi.org/10.3390/fermentation8060254