Abstract
Oxygen is considered detrimental to anaerobic fermentation processes by many practitioners. However, deliberate oxygen sparging has been used successfully for decades to remove H2S in anaerobic digestion (AD) systems. Moreover, microaeration techniques during AD have shown that small doses of oxygen may enhance process performance and promote the in situ degradation of recalcitrant compounds. However, existing oxygen dosing techniques are imprecise, which has led to inconsistent results between studies. At the same time, real-time oxygen fluxes cannot be reliably quantified due to the complexity of most bioreactor systems. Thus, there is a pressing need for robust monitoring and process control in applications where oxygen serves as an operating parameter or an experimental variable. This review summarizes and evaluates the available methodologies for oxygen measurement and dosing as they pertain to anaerobic microbiomes. The historical use of (micro-)aeration in anaerobic digestion and its potential role in other anaerobic fermentation processes are critiqued in detail. This critique also provides insights into the effects of oxygen on these microbiomes. Our assessment suggests that oxygen dosing, when implemented in a controlled and quantifiable manner, could serve as an effective tool for bioprocess engineers to further manipulate anaerobic microbiomes for either bioenergy or biochemical production.
1. Introduction
Bio-based energy and chemicals, which have a lower environmental impact than their fossil-based counterparts, will play a critical role in the transition to a circular model of production. The European Commission made evident the increasing demand for industrial decarbonization technologies, proposing a renewable energy penetration target of at least 27% by 2030 []. In this context, the industrial paradigm as we know it must change, and biorefineries will serve a key role in this transformation. The feedstock materials used by biorefineries should originate from renewable resources or existing waste streams rather than conventional petrochemical-based compounds. In addition, to be cost-competitive, the feedstocks should be inexpensive and readily available. Not many feedstock materials satisfy these criteria, but residual organic waste is a notable exception. Residual organic waste is generated by many sectors of society, imposing a disposal cost on the producer and consumer while causing environmental degradation along its treatment life cycle. Thus, it is of universal interest to develop technologies to better exploit these residual organic wastes as feedstock for bioenergy and bio-based chemicals. By doing so, we can help foster a zero-waste society. Nevertheless, this change presents a great challenge in a world whose global annual waste generation is projected to increase by 70% before 2050 [].
One of the leading technologies paving the way for organic waste conversion is anaerobic digestion (AD), which is part of the carboxylate platform. This platform encompasses processes that involve the biological degradation of polymers into a mixture of carboxylates such as acetate, propionate, and butyrate. In the context of AD, carboxylates serve as intermediate compounds prior to methane and CO2 formation. AD has been applied extensively as a strategy to remove organic compounds from waste while producing methane as an end-product [,]. AD can be applied at any scale while producing minimal amounts of stabilized sludge []. During the AD process, organic matter (proteins, carbohydrates, lipids) is decomposed in four stages (hydrolysis, acidogenesis, acetogenesis, and methanogenesis). A great variety of microbes, including bacteria and archaea, come into play at the different stages to degrade the organic matter under anaerobic conditions (absence of oxygen). One of the strengths of AD is the variety of feedstocks it can handle (e.g., municipal solid waste, livestock manure, sewage sludge, wastewater), which is crucial to valorize the various residues generated by biorefineries.
However, the market value of methane is low and viable applications outside of energy production are limited. This has compelled biorefineries to go beyond methane production and seek higher value products from these residues. Indeed, considerable research effort is being directed towards the production of biohydrogen [] or platform chemicals derived from fermentation intermediates (e.g., short- and medium-chain carboxylic acids (SCCAs and MCCAs) [,]). SCCA and MCCA compounds are obtained during the fermentative stages prior to and at the expense of methane formation, and are part of the broader carboxylate platform, which also includes intermediates such as lactate and succinate. These fermentation intermediates are important building blocks in the chemical industry, whose production by means of reactor microbiomes align with the circular economy model [,,].
Methane, SCCAs, and MCCAs are obtained in environments mostly devoid of oxygen. Oxygen is toxic to the obligate anaerobes present in these systems, such as certain acetogenic bacteria and methanogenic archaea [,]. Most methanogenic archaea, along with some species of anaerobic bacteria, lack the predominant oxygen defense systems present in obligate aerobic species: the enzymes superoxide dismutase and catalase []. Research investigations generally attempt to establish an anaerobic environment in the bioreactor by sparging the headspace or broth with inert gases and hermetically sealing the system. However, despite these efforts, some degree of oxygen penetration is inevitable, especially during the operation of continuous-flow systems. For example, oxygen can penetrate the system via material diffusion, connection leaks, or enter as dissolved oxygen in the feed stream, creating pockets of (micro-)aerobic environments. Moreover, in some AD applications, which will be reviewed in the following sections, operators deliberately introduce air or oxygen to promote specific reactions. Thus, the term ‘anaerobic’ is perhaps a misnomer, as most applications involving anaerobic systems are not completely devoid of oxygen. Instead, these systems will exhibit varying degrees of oxygen exposure and tolerance depending on multiple factors specific to each system, including reactor configuration, operating conditions, and the unique characteristics of the microbiome.
Moreover, it has been suggested that supplying small doses of oxygen (also known as microaeration), ranging from 0.005 to 5 L O2·Lreactor−1·d−1, may positively affect process yields (e.g., methane), by, for example, exploiting the hydrolyzing enzymes of facultative microbes to better degrade complex organic compounds [,,]. Moreover, other review studies have addressed the influence of oxygen in AD to remove hydrogen sulfide [,,,]. During microaeration, sulfide is oxidized to elemental sulfur by the action of sulfide-oxidizing bacteria, thereby removing sulfide toxicity. Oxygen dosing has also been effective in the anaerobic degradation of recalcitrant or problematic wastewater contaminants, including, but not limited to, aromatic amines [], aromatic hydrocarbons [], anionic surfactants [], antibiotics [], and polymeric siloxanes [].
Yet, despite the wide and varied applications of microaeration in wastewater treatment, scarce attention has been directed towards oxygen measurement, dosing, and its biological role in fermentation systems. Therefore, the objectives of the review are to: (1) describe the relevant metabolic pathways; (2) evaluate the existing techniques used for oxygen measurement and dosing; (3) compare the outcomes of previous microaeration applications; (4) investigate the biological role of oxygen in these anaerobic microbiomes in terms of performance and microbial community composition (Figure 1).
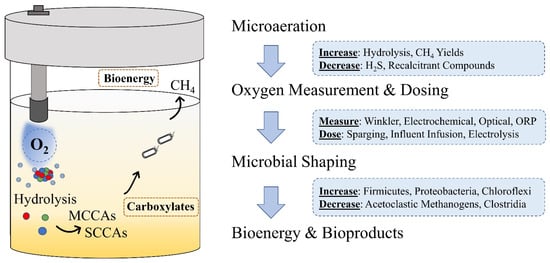
Figure 1.
Summary of the tools, techniques, applications, and effects of microaeration during microbial fermentation.
2. Anaerobic vs. Aerobic Metabolism
Under anaerobic conditions, methanogenic microbiomes will tend to progressively degrade organic matter through a set of stages until the ultimate product methane is produced. Here, methane represents the most reduced form of carbon. In the first degradation stage, referred to as ‘hydrolysis’, the complex substrate (composed of carbohydrates, proteins, and lipids) is hydrolyzed by extracellular enzymes into soluble monomers (sugars, amino acids, and long-chain fatty acids). These molecules can diffuse through the cell membrane of acidogenic bacteria where they are transformed into pyruvate, rendering two ATP molecules by substrate level phosphorylation (Figure 2, left). Afterwards, pyruvate is converted to acetyl CoA, which underlies various transformations, including the production of hydrogen, carbon dioxide, formate, acetate, ethanol, lactate, propionate, and butyrate. From this point, the SCCAs are converted into acetate during acetogenesis. The hydrogen produced at this stage needs to be maintained at sufficiently low levels (i.e., H2 partial pressure less than ~10−4 atm) to ensure the process remains thermodynamically favorable. This is partly achieved through the help of H2 scavenging hydrogenotrophic methanogens and, to a lesser extent, homoacetogens, which use H2 and CO2 to produce methane and acetate, respectively. Thus, in the final degradation stage, methane is produced via the hydrogenotrophic pathway (from CO2 and H2) or the acetoclastic pathway (from acetate).
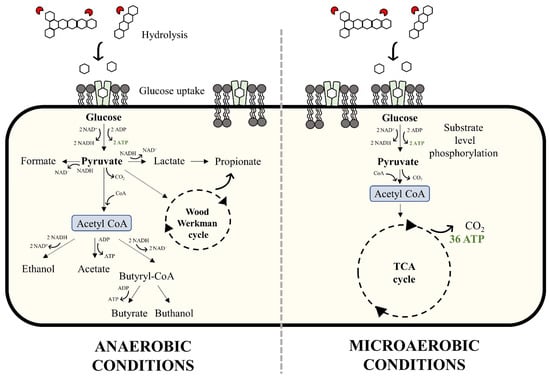
Figure 2.
Bacterial metabolism of glucose under anaerobic (left) and microaerobic (right) conditions. TCA: tricarboxylic acid cycle.
On the other hand, degradation of organic matter under microaerobic conditions entails the use of different metabolic pathways. In the presence of oxygen, acetyl CoA enters the tricarboxylic acid cycle where it is completely oxidized to carbon dioxide (Figure 2, right). The important difference between anaerobic and aerobic respiration is the energy yield. Using glucose as an example, anaerobic respiration yields two ATP (alongside the production of electron-rich fermentation by-products), while aerobic respiration yields thirty-six ATP (with CO2 as the carbon outlet). Thus, aerobic microbes are characterized by higher growth rates compared to anaerobic microbes. Moreover, the biomass carbon yield for aerobic growth (0.45 mg C·mg C−1) is substantially higher than that exhibited by fermentation/acidogenesis (0.10 mg C·mg C−1) and methanogenesis (0.05 mg C·mg C−1) []. Note, however, that substrate uptake rates, growth rates, and biomass yield are not necessarily proportional.
3. Oxygen Measurement Techniques
Oxygen concentration is used to monitor process performance in many fields of research and industry. For instance, oxygen levels are being monitored in marine ecosystems to determine the impacts of climate change []. Oxygen is also important when studying the organoleptic characteristics of wine in the food industry [], the packaging quality of olive oil [], or the activated sludge process in wastewater treatment []. The main techniques used for direct oxygen measurements are: (i) iodometric titration; (ii) electrochemical inference; (iii) optical sensing (Table 1).

Table 1.
Summary of the advantages and disadvantages of oxygen measurement techniques derived from Wei et al. [].
3.1. Direct Measurement Techniques
The Winkler method, which is widely employed in laboratory experiments, uses titration to determine oxygen in aqueous systems. The method is based on the principle that Mn (II) oxidizes to Mn (III) and Mn (IV) in the presence of oxygen, which, after acidification, allows Mn (III) and Mn (IV) to oxidize iodide (I−1) into iodine (I). The iodine can then be titrated with thiosulfate, for example, where the point of color change (endpoint) coincides with the oxygen concentration in the sample. This method is performed on-site, because time between sample collection and testing might alter the oxygen content. For this reason, it is normally employed in bench-scale experiments. In the case of electrochemical sensors, which can be applied internally or externally, oxygen diffuses from the sample across an oxygen-permeable membrane and into the sensor where a chemical reduction reaction occurs, thereby producing an electrical signal. This signal is then read by a device that infers the oxygen concentration according to its magnitude. These sensors fall into three categories based on the type of output signal: current, conductance, and electrical potential []. Optical oxygen sensors were developed in recent years. These devices determine oxygen concentration by means of quenching a fluorescence substance with oxygen molecules []. The sensor emits an optical signal, which, instead of fluorescing with the fluorescent substance, is absorbed by an oxygen molecule. The degree of quenching correlates with the oxygen partial pressure in the sample. Thus, optical measurements can be performed in both the liquid phase and gas phase. The small size of the optical sensors, along with their low detection limits, make them a promising tool for measuring oxygen in fermentation systems. Noninvasive optical sensors also exist where the optical signal is transmitted across a transparent medium (e.g., glass) to the fluorescent material. The noninvasive approach reduces the risk of contamination that may otherwise occur with insertable probes.
Within the field of fermentation, which includes AD, oxygen measurement devices are often used for substrate characterization [] and experimental monitoring []. In the latter case, ex situ measurements or inserting submersible dissolved oxygen probes in the media are the most common techniques. These techniques measure the concentration of oxygen at a given point in time. They cannot, however, account for the flux of oxygen into and out of the system nor the oxygen reacting within the system. It is challenging to quantify these fluxes and reactions due to the dynamic processes involved and the myriad exogenous exposure routes throughout the reactor system.
Despite the sources of oxygen intrusion, most anaerobic microbiomes maintain low concentrations of oxygen (i.e., <1 mg O2·L−1) within the reactor. This is possible thanks to the relatively low solubility of oxygen (Henry’s constant at STP = 1.2×10⁻⁵ mol‧m−3‧Pa) and the presence of facultative anaerobes/aerobes within the microbiome, whose affinity for this strong electron acceptor ensure its rapid depletion. However, because oxygen concentrations are low, the sensitivity range and detection limit of the measurement technique represents a crucial parameter for process monitoring. The Winkler method is accurate to ±2.0×10⁻² mg‧L−1 with a detection limit of 9.6×10⁻² mg‧L−1 []. Electrochemical sensors have detection limits far below those attained in the Winkler method (i.e., 9.9×10⁻⁴ mg‧L−1 []), but they consume oxygen during the measurement (Table 1). Therefore, these methods are not optimal for experiments or applications that involve oxygen at trace levels. On the contrary, optical sensors do not consume oxygen and can detect minute oxygen variations (±1×10⁻³ mg‧L−1), which makes them an excellent choice for these applications. Moreover, the detection limit of optical devices extends as low as 3.2×10⁻³ mg‧L−1 [].
3.2. Indirect Measurement Techniques
An alternative, albeit indirect, method to estimate trace oxygen concentrations is to measure the oxidation-reduction potential (ORP) of the solution. The ORP of an oxidation-reduction pair describes the tendency of a compound to acquire electrons, where a higher value represents a higher affinity for electrons. The ORP for O2/H2O is the highest among all redox pairs at +820 mV. The main advantage of using this method is that ORP electrodes are highly sensitive to changes in oxygen concentration even at trace ranges []. Moreover, ORP electrodes can be used to monitor redox information []. Some authors have developed linear correlations between the ORP and oxygen concentration, highlighting the sensitivity of the ORP at low oxygen levels [,]. Nevertheless, these correlations are often process-specific, relying on multiple environmental factors. For example, ORP sensor values are affected by the pH, temperature, ionic strength, and total dissolved solids (TDS) of the liquid because these parameters alter the electrical potential of oxidants and reductants present in solution. Thus, while ORP probes may be reliable to indirectly infer the concentration of an analyte in a stable aqueous system (e.g., abiotic chemical reactor), they are less suitable for systems containing microbiomes, such as anaerobic digesters, where dynamic changes frequently occur. Specifically, these systems are subject to changes in influent composition, environmental parameters (temperature, pH), and the microbiome itself [,].
Still, many practitioners use ORP measurement as a convenient monitoring tool in these complex systems. AD systems often show ORP values as low as −300 mV, indicating a strong reducing environment []. Sparging oxygen into the system causes an increase in the ORP values. For instance, ORP values ranging from −215 to −150 mV are normal for reactors subjected to microaeration []. Some authors have pointed out the importance of ORP intervals on gene expression, protein biosynthesis, and control strategies for more efficient production of byproducts [].
4. Oxygen Dosing Techniques
When sparging is used for aeration, the oxygen transfer rate is defined as the amount of oxygen transferred from the gas into the liquid phase, where it is taken up by the microbes (oxygen uptake rate) []. This oxygen transport can be described by several mass transfer resistances, which decrease the final oxygen attained relative to the amount of oxygen supplied. The change in oxygen concentration within the reactor through time can be described according to Equation (1) [].
where: dC·dt−1 is the accumulation of oxygen in the liquid phase, is the oxygen transfer rate (mol O2·m−3·s−1), and is the oxygen uptake rate (mol O2·m−3·s−1). For the oxygen transfer rate parameters: KLa is the volumetric oxygen mass transfer coefficient (s−1), C* is the saturation oxygen concentration (mol O2·m−3), and C is the oxygen concentration in the liquid phase (mol O2·m−3). With respect to the oxygen uptake rate: is the oxygen consumption rate (mol O2·kg−1·s−1) and Cx is the cell concentration (kg·m−3). It is important to mention that the KLa coefficient is an empirical value that must be estimated or experimentally assayed (typically in an abiotic setting). KLa attribution can introduce considerable error when estimating mass transfer rates in biological systems because biological activity directly affects the properties of the aqueous system through, for example, the release of biosurfactants and other metabolites [].
4.1. Gas-Phase Sparging (Headspace Injection)
A relatively straightforward dosing technique is the direct injection of air or pure oxygen into the reactor headspace (Figure 3A). However, for dynamic open-flow systems, accurate quantification of oxygen flux into the liquid phase is not possible because neither the mass transfer rate, nor the biological uptake rate can be measured/modeled reliably. Gas/liquid mass transfer at the liquid surface is affected by multiple confounding factors, including, for example: temperature, turbulence, bulk liquid composition (e.g., surfactants, TDS), viscosity, and chemical/biological reactions (e.g., reactions with H2S) [,,]. Each of these parameters will change during reactor operation. Estimates are complicated even further by variations in biogas production that alter the partial pressure of oxygen in the headspace. In addition, while it is technically feasible to determine the oxygen flux via mass balance calculations after measuring all the inputs and outputs within a reactor system, this approach.
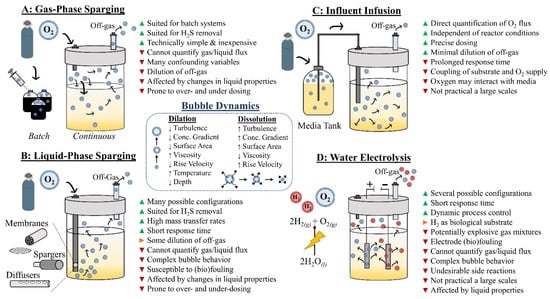
Figure 3.
The use of oxygen to enhance overall product yields for carboxylate and methane production. Schematic summary of the most widely employed strategies to introduce air or pure oxygen into a reactor system: (A) gas-phase sparging; (B) liquid-phase sparging; (C) influent infusion; (D) water electrolysis. Beside each strategy, a bulleted list of the major advantages (green triangle), disadvantages (red triangle), and application-dependent advantages/disadvantages (orange triangle) are provided.
Because the flux of oxygen cannot be reliably quantified using the headspace injection technique, it is difficult to ascribe an appropriate and consistent dosing regimen (i.e., volumetric flow rate). Instead, many operators rely on post hoc dosing interventions prescribed after making indirect parameter measurements (e.g., ORP) or after observing performance changes (e.g., the percentage of H2S removal, methane yield) []. For example, AD operators would increase the volumetric oxygen/air flow rate in response to rising H2S concentrations and decrease the flow rate following a reduction in methane production. These approaches, despite their imprecision, are permittable because most AD microbiomes tolerate variable levels of oxygen exposure. Moreover, residual oxygen resulting from overdoses with pure oxygen happens to be favorable to biogas combustion in, for example, combined heat and power production. On the other hand, when air is used, overdosing has the negative effect of reducing the energy density of the biogas via dilution with N2.
In the context of laboratory experiments, headspace injection is frequently employed in batch systems where the oxygen partial pressure is set and reset by periodic injections of oxygen into the headspace []. Since these are closed systems, the flux of oxygen can be quantified by measuring the change in headspace concentration. Optical sensors are ideal in these applications because they allow noninvasive continuous oxygen monitoring in the gas and liquid phase. Batch systems offer the additional advantage of experimental flexibility. The dose of oxygen can be easily manipulated by adjusting various parameters in the batch vessel, including the oxygen partial pressure, mixing intensity, or liquid surface area-to-volume ratio. The major disadvantage of batch systems is their dynamic behavior—that is, the conditions in the gas phase and liquid phase change during the incubation period. These cofounding effects often preclude controlled hypothesis testing that depend on steady-state conditions or constant oxygen exposures during the experiment. Open-flow approaches can be used to establish pseudo-steady-state conditions, but dosing techniques other than headspace injection ought to be used.
4.2. Liquid-Phase Sparging (Bubble Injection)
An alternative approach to headspace sparging is to bubble air or pure oxygen directly into the liquid phase using diffusers, nozzles, or membranes (Figure 3B). These bubble injection elements are typically positioned at the base of the reactor vessel to maximize the contact time between the bubble and the bulk liquid before the bubble breaks at the liquid surface. Bubble injection affords greater dynamic control in oxygen dosing compared to headspace sparging because the configuration of the diffusers, nozzles, and membranes can be modified to adjust bubble size and quantity. Moreover, oxygen mass transfer in gas bubbles operates in three dimensions while headspace sparging operates in two dimensions, thereby increasing the overall mass transfer rate for bubble injection. These higher mass transfer rates grant greater process control to the operator (or automated system) because it increases the responsivity of the system to dosing adjustments. Bubble injection also reduces costs compared to headspace sparging because more oxygen is dissolved per oxygen supplied and generally less oxygen escapes with the off-gas stream. Indeed, bubbling injection systems are designed to avoid bubble breakthrough at the liquid surface by ensuring the complete dissolution of the gas bubble within the liquid column. However, there are many factors that affect the mass transfer rate and the transport behavior of bubbles within reactor vessels.
Taking the bubble as a discreet system, oxygen mass transfer calculations assume a perfectly mixed gas phase (inside the bubble) surrounded by a stagnant liquid film (at the interface of the bulk liquid). Therefore, physical parameters such as fluid viscosity, turbulence, and transport velocity each affect the liquid film thickness and bubble size, and ultimately the oxygen flux [,,]. This also means that the hydrodynamic properties of specific reactor configurations (e.g., mechanically stirred reactors vs. upflow baffled reactors) are a critical determinant of mass transfer. Generally, all else being equal, the smaller the bubble size, the greater the mass transfer rate due to the square–cubed law. However, in a dynamic system, bubble size is subject to counteracting forces as it reacts and migrates along the liquid column. On one hand, the bubble size decreases at an increasing rate as more gas is dissolved into the bulk liquid phase. On the other hand, the bubble size increases as it rises in the liquid column due to decreasing hydrostatic pressure. The rise in velocity will also increase with the bubble size due to greater buoyancy, but, at the same time, the increased turbulence induced by the faster rise velocity reduces the liquid film thickness, leading to faster gas dissolution []. Considering all these factors, and with the support of empirical measurements, it is possible to estimate an ideal bubble size and flow rate. For example, over the decades, wastewater engineers have been able to estimate an ideal bubble diameter of 0.3–1.0 mm for the somewhat standardized waste-activated sludge process []. These bubble diameters result in bubble residence times ranging from seconds to minutes, depending on the configuration of the aeration tank [].
However, not all researchers or industrial enterprises have the benefit of extensive historical data or the resources to determine the ideal bubble size and dosing rate for their specific application. Instead, a more common approach is to perform abiotic assays with water or synthetic fermentation broth to determine a global volumetric oxygen transfer coefficient (i.e., KLa) for a variety of dosing regimens prior to live operation. These KLa values, however, are only approximations because mass transfer rates will be affected by changes in liquid properties caused by biological activity. For example, bubble behavior is particularly affected by the production of (bio)surfactants, which change the surface tension at the gas/liquid and gas/solid interfaces [].
These interferences manifest immediately at the point of oxygen entry at the injection element. Gas diffusers and membranes are also susceptible to fouling due to biofilm growth and mineral deposition, which requires their routine maintenance and periodic replacement []. Fouling also causes the KLa value to change throughout the operating period, which precludes precisely controlled experiments. For this reason, many researchers do not bother to estimate the KLa or the oxygen flux. Instead, they report their dosing regimen in terms of volumetric gas flow per reactor volume (i.e., mLair·L−1·d−1). However, these dosing values are only loosely translatable between studies on account of the many differences between reactor systems and operating conditions. This inability to accurately quantify and report the oxygen dosage partly explains the high variability in outcomes observed between microaeration studies and underscores the need for more robust dosing techniques.
4.3. Influent Infusion and Water Electrolysis
Bubble injection is the most widely applied technique for dosing oxygen to reactor systems. However, other techniques have been used specifically for experimental purposes. The first technique is influent oxygen infusion, where the liquid media tank is sparged with oxygen gas to establish a certain dissolved oxygen concentration in the media before it is pumped into the reactor [] (Figure 3C). This approach physically separates the reactor from the dosing mechanism, which helps the operator protect against overdosing and makes the issue of fouling and changing reactor conditions irrelevant. Moreover, with this technique, the oxygen flux into the reactor can be directly calculated because both the dissolved oxygen concentration and liquid flow rate of the influent are known. A disadvantage of the influent infusion approach is the coupling of oxygen dosing with substrate feeding. For experiments requiring a constant substrate supply or dilution rate, oxygen dosing adjustments can only be made after gassing or degassing the media tank, and hence there would be a considerable delay in response. Responsivity would be further undercut in applications requiring low dilution rates. Finally, oxygen sparging may not be feasible for all media types. For instance, the media may contain components that readily volatilize (e.g., short-chain carboxylic acids) or components that directly react with oxygen (e.g., reducing agents). Given these constraints, it seems influent infusion is practical only for niche experimental applications.
Another experimental dosing technique is water electrolysis (Figure 3D). This technique involves applying low voltages (e.g., 2.5–3.5 V) to electrodes submerged in the reactor broth, thereby splitting water (overall reaction: 2H2O (l) → 2H2 (g) + O2 (g)) [,]. (Note: this technique is not the same as microbial electrolysis cell technology (MEC). MECs apply lower voltages (i.e., ~0.3–0.8 V) to avoid water splitting [,].) Like diffusers and membranes, water electrolysis confers a high degree of operational flexibility via electrode selection and sizing, while also providing rapid response times for dosing adjustments. However, water electrolysis suffers similar disadvantages as bubble injection techniques, including mass transfer interferences and variable bubble behavior due to electrode fouling and compositional changes in the aqueous system. In addition, the simultaneous production of H2 and O2 gas poses both experimental and practical problems. In experimental systems involving anaerobic microbiomes, hydrogen is a substrate for multiple species, which makes it a confounding variable. Moreover, because the solubility of H2 is much lower compared to oxygen, H2 more readily escapes the liquid phase and concentrates in the headspace creating potentially explosive gas mixtures. Lastly, unwanted side reactions often occur with components in the media or reactor broth. For example, the formation of chlorine gas is a common occurrence due to reactions that occur with chloride compounds that exist in most media formulations (e.g., NaCl, NH4Cl) [].
4.4. Summary Remarks about Oxygen Measurement and Dosing
Since most investigations target methane or carboxylate production, oxygen concentrations are generally not controlled unless it plays a central role in the study. Yet, the role of oxygen in these fermentation systems might be crucial. The identification of facultative heterotrophs growing alongside obligate anaerobes within a single reactor has been reported in multiple studies via 16S RNA sequencing, which suggests oxygen may be shaping these microbiomes. For example, in a study by Baleeiro et al. (2021) involving chain-elongation microbiomes, the researchers observed an increased relative abundance of Actinobacteria and Coriobacteria (i.e., aerotolerant classes of bacteria) following exposure to oxygen with a concomitant decrease of Methanobacteria and Clostridia classes (i.e., strict anaerobes responsible for product formation) []. These results suggest oxygen confers a competitive advantage to certain species within the microbiome at the expense of others.
However, due to the limitations of current measurement and dosing techniques, it is difficult to investigate the role of oxygen in these complex systems much further. This problem has been attested to by many researchers, including the group just mentioned []. Thus, there is a pressing need to develop a well-characterized experimental system that can precisely control and accurately quantify oxygen concentrations and fluxes. Moreover, the low oxygen concentrations associated with these systems require sensitive methods to monitor the influence of this parameter. Optical sensors and ORP probes stand out as the optimal methods to measure oxygen at trace concentrations due to their noninterfering character, low detection limit, and high sensitivity.
The highly variable gas flow rates employed across microaerobic studies underscores the need for a precise and quantifiable dosing technique. Judicially applied oxygen fluxes are required for microaerobic studies to establish trace oxygen concentrations and to avoid harmful effects to the microbiome. It is evident that gas-phase sparging and bubble injection fall short in this regard; therefore, research oriented towards novel methods will be of outmost importance in the years to come. The use of gas-exchange membranes as a rate-controlling barrier between the gas and liquid phase seems to be a promising approach, at least in experimental settings. Here, the supply gas would be administered below the bubble-point pressure of the membrane, restricting the flux to diffusional flow through the membrane or the resistance at the gas–liquid interface. This limited flux would suit microaeration applications because low rather than high gas transfer rates are desired. Moreover, by establishing a diffusion-controlled system restricted to the membrane matrix, confounding effects caused by changing fluid properties in the bulk liquid would be minimized. Similarly, flat-sheet membranes could be used in place of the more common hollow-fiber membranes because, again, large surface areas and high flux rates are not necessary for microaeration at small scales. Flat-sheet membranes are advantageous because the flux can be quantified more accurately and antifouling measures can be implemented more effectively. The membrane industry is also mature and diversified and serves many technically demanding applications that require material uniformity and narrow engineering tolerances; therefore, membranes would be consistent and reliable. Finally, membranes could also be engineered to match specific applications by changing, for example, the membrane material, thickness, or pore size/distribution.
5. Applications of Microaeration for Methane and Carboxylate Production
5.1. Microaeration for Methane Production
The use of microaeration as a pretreatment technique for feedstock might be more sustainable than conventional methods (e.g., thermal or chemical treatment) because it requires minimal energy and no hazardous chemicals []. However, oxygen affects each stage of the AD process differently and these effects should be considered carefully before implementing a microaeration dosing strategy.
5.1.1. Hydrolysis
The use of microaeration has had positive effects on substrate solubilization. The positive influence is attributed to the high growth rates of facultative microbes within the microbiome. As a result, extracellular enzymes are produced at a higher rate or in greater variety. For example, protease and α-glucosidase activity increased by 64% and 47%, respectively, when waste-activated sludge was subjected to microaeration (4 Lair·min−1 Lreactor−1) in batch experiments []. Besides these enzymes, there are several others, including cellulases, proteases, lipases, amylases, and phosphatases. Consequently, the overall hydrolytic efficiency of proteins and carbohydrates may be promoted, which may result in increased process efficiencies. For instance, an upflow anaerobic sludge blanket reactor (UASB) treating food waste at 35 °C was microaerated at a rate of 0.217 Lair·min−1 Lreactor−1 for 12 min every 3 h (258 Lair·kg total solids (TS)−1·d−1), which increased the hydrolysis rate by 21–27% for carbohydrates and 38–64% for proteins []. Following this trend, many other studies have demonstrated a positive effect on hydrolytic activity following microaeration. The effect normally manifests as an increased proportion of soluble COD (sCOD) (Table 2). The most common method used to monitor oxygen concentrations in these studies was via ORP probes, whereby they observed ORP values ranging from −400 to −150 mV.
Table 2.
Research involving the effect of microaeration on the hydrolytic stage of fermentation.
The main challenge of microaeration alluded to in these studies is to identify and administer the proper oxygen dosage. Indeed, both a deficient and excessive dose of oxygen can be counterproductive, rendering zero or negative effects in terms of hydrolytic efficiency. For instance, when the previously mentioned study administered 0.217 Lair·min−1 Lreactor−1 for 12 min every 2 h (387 Lair·kg TS−1·d−1), they observed a decrease in the hydrolytic yields. The authors attributed this result to increased biomass generation and CO2 respiration []. These results suggest that the proper oxygen dose will be process-specific and rely on multiple factors, such as the oxygen transfer rate, oxygen uptake rate, and the microbiome composition and history.
5.1.2. Acidogenesis and Methanogenesis
SCCAs are produced during the acidogenic and acetogenic stage of the fermentation process. These compounds are precursors to methane production via acetoclastic methanogenesis. However, there should be a balance of SCCA production because their accumulation is detrimental for methane production due to their toxicity []. An accumulation of SCCAs exceeding the buffering capacity of the system causes a drop in pH and may either directly or indirectly inhibit methanogens, potentially leading to process failure []. Protonated SCCAs at low pH values can enter the cell membrane, disrupting the pH gradient and membrane potential which is necessary for ATP synthesis and transport functions []. It has been proposed that microaeration can be used to mitigate SCCA inhibition and prevent process failure. When oxygen is provided, SCCAs are oxidized to CO2, thereby reducing their concentration in the reactor (Equations (2)–(5), []).
Acetate: CH3COO− + H+ + 2O2 → 2CO2 + 2H2O
Propionate: CH3CH2COO− + H++ 3.5O2 → 3CO2 + 3H2O
Lactate: CH3CH(OH)COO− + H+ + 3O2 → 3CO2 + 3H2O
Butyrate: CH3CH2CH2COO− + H+ + 5O2 → 4CO2 + 4H2O
Finally, although the increased hydrolytic rates obtained during microaeration might positively affect the final methane yields, attention must be paid to balance the oxygen dose to avoid harmful effects in the hydrolytic and methanogenic stages; therefore, a good result at the hydrolysis stage does not necessarily translate into a good result at the methanogenic stage. If hydrolysis had been the rate-limiting process, a sudden increase in sCOD following microaeration would result in SCCA accumulation because insufficient methanogenic biomass would be present to remove the newly formed acetate. Another issue arises when the oxygen dosage exceeds the oxygen-scavenging capacity of the facultative bacteria, which would directly expose methanogens to detrimentally high levels of oxygen. As will be discussed in the biology section, methanogens are strict anaerobes, and thus very sensitive to oxygen. For instance, a recent study detected a 50% reduction in the methane production rate when operating a batch reactor with intermittent microaeration using wastewater as feedstock []. Other studies evaluating the effect of aeration on methane yield are summarized in Table 3. Only a few of the studies report oxygen concentrations (i.e., 0.19−1.39 mg O2·L−1 [,]) or the redox value (i.e., from −300 mV to −220 mV). Note: many of the studies presented in Table 2 and Table 3 lack precise control or quantitative data for their aeration experiments. The effect of oxygen and the identification of the effective dose is being inferred based on post hoc observation. This inexact approach may explain the variability seen between studies.
Table 3.
Research involving the effect of microaeration on the methanogenic stage of fermentation.
5.2. Microaeration for SCCAs and Chain Elongation
Organic feedstocks are converted to SCCAs by means of hydrolysis and acidogenesis under anaerobic conditions [,]. To prevent further catabolism of SCCAs into methane and CO2, methanogenic activity must be suppressed. Different methods have been employed for this, including the use of chemical inhibitors (i.e., iodoform or 2-bromoethanosulfonate) or the manipulation of operating conditions (low HRTs, low pH, and high organic loading rates) [,,]. The use of microaeration for SCCA production could represent an alternative to these methods. Moreover, microaeration would offer the twofold benefit of increasing organic matter solubility during hydrolysis whilst contributing to methanogenic inhibition due to the toxicity that oxygen exerts over archaea. This technique could be more effective for certain raw materials such as protein-rich substrates, whereby an increase in hydrolysis from microaeration would release free ammonia to the medium, and, alongside oxygen, further inhibit methanogenic archaea [].
As previously pointed out for methane production, only a few microaeration experiments that target SCCAs production also monitor ORP values (Table 4), while the remaining studies inferred an aeration effect by comparing the results with a negative control (anaerobic assay). Recently, the feasibility of engineering spatial and metabolic niches for the lactate platform as a pivotal compound for SCCAs production from lignocellulose was demonstrated [,]. These authors achieved 0.35 g of butyric acid per gram of carbohydrate using a fungal/microbial consortium of Trichoderma reesei, Lactobacillus pentosus, and Clostridium tyrobutyricum. In their study, a membrane-aerated biofilm reactor allowed for the creation of aerobic niches (air was introduced at 0.14 Lair min−1‧Lreactor−1) according to the metabolism of the species involved in the consortium, thus highlighting the role of oxygen in controlled process upgrading. The ORP measurements varied during the operating period from higher values from 0 to −100 mV, when T. reesei (aerobe) was dominant, to much lower values, when butyrate was produced by C. tyrobutyricum (obligate anaerobe) (from −300 to −400 mV).
Table 4.
Research conducted involving the effect of microaeration on carboxylate (SCCAs) production.
The carboxylate platform includes the chain-elongation (CE) process that exploits reverse β–oxidation to elongate SCCAs, forming more valuable medium-chain variants (MCCAs, e.g., n-caproic acid, C6). CE from SCCAs to MCCAs is a serial process which adds two carbons to the initial molecule (e.g., C2 → C4 → C6) under elevated hydrogen partial pressure and in the presence of a strong electron donor (e.g., ethanol, lactic acid, glucose) [,]. Some of the model microbes that utilize the reverse β–oxidation pathway include: Megasphaera elsdenii and Clostridium kluyveri [,,]. In CE systems, one would presume that oxygen would foster the oxidation of MCCAs and hydrogen, and thereby decrease overall process yields. This was indeed the result found in a recent CE study by Baleeiro et al. 2021, where oxygen dosing led to a 72% reduction in C6 production and an increase in H2 consumption compared to the control system without oxygen [].
No other CE studies have deliberately investigated oxygen as an experimental parameter in their CE bioprocess. This does not mean, however, that oxygen is not present. To the contrary, it seems oxygen did play a role in several previous CE studies, albeit unintentionally, via oxygen contamination. For example, one study detected Acinetobacter an oxygen utilizing bacteria at a high relative abundance (~62%) in their CE reactors elongating L-lactate into C6 []. Similarly, another CE study highlighted that the daily feeding of oxic substrates (i.e., maize silage) led to measurable levels of oxygen in the reactor headspace, which in turn likely permitted the growth of Phyllobacterium and other aerobic species [,]. Incidentally, these aerobic species may have benefited the CE process by functioning as oxygen scavengers, thereby facilitating the growth of oxygen-tolerant lactate producers. In fact, Bifidobacterium reached a relative abundance of 34.3% at a 3.3% oxygen concentration in the headspace. In this CE microbiome, low oxygen levels may have supported MCCA production by favoring lactate formation pathways (electron donor in CE) over other metabolic routes that are more sensitive to oxygen. These contrasting outcomes between CE studies highlight the need to further investigate the effects and underlying mechanisms of oxygen in CE processes. The outcome of these future efforts could be the development of a new technique for shaping CE microbiomes for the carboxylate platform. Alternatively, it could mean implementing tighter operating measures to prevent oxygen contamination to ensure optimal MCCA production performance.
6. The Biological Effects of Oxygen in Anaerobic Microbiomes
The microbial community structure depends greatly on the operating conditions imposed on the reactor, such as the substrate, pH, OLR, and HRT [,,]. In addition, microaeration can alter the microbial community by promoting oxygen-tolerant species at the expense of strict anaerobes. Anaerobes have developed different strategies to protect themselves from oxygen. Apart from their coexistence with facultative microbes, which quickly scavenge oxygen, they can also produce antioxidative enzymes to avoid the toxicity inflicted by this compound []. It seems the effect of microaeration is process- and microbiome-specific, relying on the oxygen dose, the hydrodynamic properties, and the microbes present in the system. In any case, high oxygen concentrations can disrupt the microbial balance in the system leading to process failure. In one study, species diversity (both bacteria and archaea) exhibited a decreasing trend with a concomitant increase in oxygen concentration. The result was attributed to the toxic effects of oxygen [].
Conversely, insufficient microaeration doses can result in negligible effects in the microbiome. For instance, the phylogenetic diversity remained unaltered when air was continuously introduced at approximately 7.5% (v/v) the biogas-generation rate []. Nevertheless, when strict anaerobes are subjected to an aerobic environment, autoxidation occurs, resulting in the production of reactive oxygen species (ROS). Some ROS species include hydrogen peroxide (H2O2), the superoxide anion (O2−), and the hydroxide radical (OH). These molecules can cause considerable damage to the cell. As an example, amino acids containing sulfur, such as cysteine, are very sensitive to oxidation by ROS []. To relieve the toxic effect of oxygen and scavenge superoxide, aerobic species possess superoxide dismutase and catalase. Superoxide dismutase catalyzes the dismutation reaction of the superoxide radical (Equation (6)) whereas catalase is an antioxidant enzyme that degrades H2O2, producing O2 and H2O (Equation (7)) [].
2O2− + 2H+ → O2 + H2O2 + H2O
2H2O2 → O2 + 2H2O
Generally, the higher the superoxide dismutase activity, the higher the oxygen tolerance []. However, these mechanisms are less common in strict anaerobes. Rather, anaerobes possess enzymes with antioxidative properties, namely F420H2 oxidase [], superoxide reductase, peroxidase, and rubrerythrin. Unlike superoxide dismutase and catalase, these enzymes do not produce O2− during the degradation reaction []. Within the microbial community structure, bacteria and archaea domains react differently towards oxygen concentrations.
6.1. Bacteria
For bacterial communities treating complex substrates, microaeration is frequently correlated with an increase in relative abundance in several phyla, as well as an increase in hydrolysis rates. The technique widely employed to analyze microbial communities within a reactor is the sequencing of the 16S rRNA gene. Although relative abundance alone cannot be used to infer the functional roles of specific organisms within the microbiome, it can be used to track the dynamic response of the microbiome following a disturbance (in the present context, microaeration). If possible, relative abundance data obtained from the 16S rRNA technique should be cross-examined with proteomic and metabolomic data to qualify the activity and functional role of specific microbes within the microbial community. However, in most studies thus far, 16S rRNA gene sequencing has been employed as the sole technique.
In one study, Firmicutes was enriched (from 82.3% to 86.2%) in samples subjected to a microaerobic environment (12.5 mLair·L−1·d−1) compared to those maintained in anaerobic conditions []. Within this phylum, the class Clostridia and the order Clostridiales were dominant (85.0% and 78.0% (aerobic) vs. 81.0% and 67.4% (anaerobic), respectively). Clostridia species are responsible for macromolecule hydrolysis [] and syntrophic acetate oxidation coupled with hydrogenotrophic methanogenesis []. The prevalence of these species in the previous study may explain the simultaneously high hydrolysis rate and methane production observed under microaerobic conditions (227.7 vs. 194.3 mL CH4·g VS−1) []. Additionally, the genera of Clostridia were identified among the most abundant genera involved in waste activated sludge digestion under microaerobic conditions, confirming the high adaptability of these species to low oxygen concentrations [].
Many Clostridia species will also sporulate in response to various environmental stressors, including exposure to oxygen []. These spores are metabolically inactive, which is necessary to protect the oxygen-sensitive enzymes required during energy metabolism. Such oxygen-sensitive enzymes in Clostridia include pyruvate formate lyase and NrdD ribonucleotide reductase, as well as [FeFe]-hydrogenases [,,]. This oxygen defense mechanism, via sporulation, may confer a competitive advantage to Clostridia species compared to nonsporulating species, thereby explaining their relative enrichment in microaerated systems over time. The spores could persist during periods of elevated oxygen levels and then allow Clostridia to proliferate more quickly once oxygen levels subside. Moreover, many anaerobes, including Clostridia species, harbor special oxygen-directed respiration pathways involving membrane-bound terminal oxidases and cytoplasm-based rubredoxin:oxygen oxidoreductase enzymes [], which may further protect their metabolism or enhance it by favoring ATP production instead of redox balancing pathways []. Furthermore, recent reports suggest Clostridium beijerinckii possesses an oxygen-protecting mechanism against cofactor degradation within enzyme [FeFe]-hydrogenase CbA5H []. This mechanism prevents oxygen binding at the open coordination site of Fed via a safety cap created by a localized cysteine residue []. Other members of Firmicutes have also been identified as key players in substrate degradation under microaerobic conditions. For instance, the genus Megasphaera (33.0%) and Lactobacillus (10.0%) belonging to Firmicutes (72.0%) were identified when codigesting brown water and food waste at microaerobic conditions (37.5 mL O2·L−1 d−1) []. These authors pointed out the capacity of these genera to overcome the oxidative stress whilst maintaining their metabolic activity.
Species belonging to Proteobacteria phylum are also thought to be involved in the hydrolytic and acidogenic steps of AD []. A recent study observed an increase in Proteobacteria relative abundance from 22.0% to 25.4% following aeration treatment []. The same authors also noted an increase in the phylum Chloroflexi (from 12.7% to 17.5%), whose species are known to degrade soluble microbial products (e.g., polysaccharides or proteins) with extracellular enzymes []. Following this trend, other authors assessed the hydrolysis of petrochemical wastewater with microaeration (0.2–0.3 mg O2·L−1), and identified Proteobacteria as the most abundant phylum (40%), followed by Chloroflexi (20%) and Firmicutes (10%) []. The authors went on to highlight the similarity of the microbial profile both with and without aeration, which indicated some tolerance of these species to oxygen exposure. The use of transcriptomics in future studies might reveal crucial information regarding gene expression and activity in the microbiome.
6.2. Archaea
The archaeal species belonging to the phylum Euryarchaeota are considered strict anaerobes. These microbes represent a minor percentage (normally below 10%) relative to the total bacteria present in anaerobic sludge []. Methanogens require low redox potentials and anaerobic conditions to enable the function of specific enzymes and coenzymes, many of which contain metal cofactors []. Yet, several studies show some methanogens tolerate limited oxygen exposure for extended periods of time (Table 5).
Table 5.
Methanogenic species and their apparent oxygen tolerance.
Increasing oxygen exposure in AD can lead to a decrease in methanogenic activity, even though some investigations suggest methanogen inhibition might be reversible in continuous operation [,]. These authors pointed out that strict anaerobes were initially outcompeted by aerobic species following oxygen exposure, and methane was finally produced, although at lower yields than seen prior to oxygen exposure. Moreover, the lag phase was rather protracted compared to the anaerobic assays (i.e., 0 vs. 24 h). When microaerobic conditions are applied to anaerobic microbiomes, these conditions can promote a shift from acetoclastic to hydrogenotrophic methanogenesis. That was the case for Methanosarcina species, whose relative abundance decreased likely as a result of increased competition by hydrogenotrophic Methanoculleus []. Still other researchers registered a ~100-fold increase in the relative abundance for hydrogenotrophic species during aeration []. The cause of these results may be explained by the greater resilience of hydrogenotrophic methanogens compared to acetoclastic methanogens. In like manner, the hydrogenotrophic pathway will prevail over the acetoclastic pathway in other, less favorable conditions, including low pH (<5.5) and high ammonium (>3.5 g NH4-N·L−1, []), due to the greater sensitivity of acetoclastic methanogens []. However, tolerance against ammonium concentrations relies on the specific methanogen involved. For example, species such as Methanobacterium (strain G2R) were able to thrive under high ammonium concentrations at 35 °C (4.2–5.6 g NH4-N·L−1) [].
Most likely, this diversity in resilience between species also applies to oxygen, and thus oxygen tolerance should be evaluated at a single species level. Furthermore, hydrogenotrophic methanogens might promote organic matter removal by coupling their activity with syntrophic acetate-oxidizing bacteria (SAOB), which sustains the oxidation of acetate into H2 and CO2. SAOB are often affiliated with the Firmicutes phylum, which, as previously mentioned, is one of the phyla enriched by microaeration. Species such as Thermacetogenium phaeum, Tepidanaerobacter acetatoxydans, or Syntrophaceticus schinkii belonging to the Clostridia class are a few examples of SAOB affiliated with Firmicutes [,]. Another important factor is the presence of anaerobic niches in the media. The formation of these niches may result from mere fluid dynamic effects (e.g., spatial heterogeneities, quiescent zones), biological effects (e.g., oxygen-scavenging facultative bacteria, granule formations, or biofilms), or abiotic effects (e.g., temperature, pH, light intensity, concentrations of carbon dioxide, ammonium, or other various metabolites). For instance, initial studies performed with archaea suggest that biofilms provide cells with protection against toxic chemicals (e.g., oxygen), facilitating horizontal gene transfer and enabling syntrophic relationships with other microbes []. Due to the complexity and many confounding factors associated with open-culture microbiomes, it is difficult to reliably prescribe an oxygenation regime based on the specific oxygen sensitivities determined via pure-culture studies with obligate anaerobes (i.e., as indicated in Table 5).
7. Conclusions
Future research should focus on developing robust technologies to quantify oxygen mass transfer and measure trace concentrations more accurately in situ. This review suggests the effective range of microaeration is narrow and cannot be reliably targeted using coarse techniques or indirect measurements. Oxygen may promote the growth of microbes conducive to the bioprocess, but the converse is also possible. Thus, the ‘apply…observe…adjust’ approach may be detrimental to the long-term stability of the bioprocess. Ideally, oxygen doses should be prescribed after considering the sensitivity of the microbiome and then tuned in conjunction with other operational parameters to better control the bioprocess. The use of flat-sheet membrane technology for precise oxygen flux control, together with noninvasive optical sensors for O2 monitoring, may be the best approach for future experimental applications.
Author Contributions
Conceptualization, J.A.M. and J.G.U.; validation, J.G.U. and L.T.A.; investigation, J.A.M. and J.G.U.; writing—original draft preparation, J.A.M.; writing—review and editing, L.T.A. and J.G.U.; supervision, J.G.U.; project administration, L.T.A. and J.G.U.; funding acquisition, J.G.U. All authors have read and agreed to the published version of the manuscript.
Funding
The authors would like to acknowledge the financial support provided by: (1) the Ministry for Science, Research and Art of Baden-Württemberg through the Research Seed Capital Program (RiSC) (grant number: not applicable); (2) the University of Tübingen through the Project Funding for Young Scientists Program (grant number: not applicable); (3) the Alexander von Humboldt Foundation in the framework of the Alexander von Humboldt Professorship endowed by the Federal Ministry of Education and Research in Germany (grant number: not applicable); (4) the Open Access Publishing Fund of University of Tübingen.
Institutional Review Board Statement
Not applicable.
Informed Consent Statement
Not applicable.
Data Availability Statement
Not applicable.
Acknowledgments
The authors would like to thank our funding sources and the members of the environmental biotechnology group at the University of Tübingen for their advice and feedback during the manuscript drafting process.
Conflicts of Interest
The authors declare no conflict of interest.
References
- EU. Directive (EU) 2018/2001 of the European Parliament and of the Council on the Promotion of the Use of Energy from Renewable Sources. Off. J. Eur. Union 2018, 2018, 82–209. [Google Scholar]
- Kaza, S.; Yao, L.C.; Bhada-Tata, P.; Van Woerden, F. What a Waste 2.0: A Global Snapshot of Solid Waste Management to 2050; World Bank: Washington, DC, USA, 2018. [Google Scholar] [CrossRef]
- Obileke, K.; Nwokolo, N.; Makaka, G.; Mukumba, P.; Onyeaka, H. Anaerobic digestion: Technology for biogas production as a source of renewable energy—A review. Energy Environ. 2020, 32, 191–225. [Google Scholar] [CrossRef]
- Kumar, A.; Samadder, S.R. Performance evaluation of anaerobic digestion technology for energy recovery from organic fraction of municipal solid waste: A review. Energy 2020, 197, 117253. [Google Scholar] [CrossRef]
- van Lier, J.B.; Mahmoud, N.; Zeeman, G. Anaerobic wastewater treatment. In Biological Wastewater Treatment, Principles, Modelling and Design; IWA Publishing: London, UK, 2008; pp. 415–456. [Google Scholar] [CrossRef]
- Lytras, G.; Lytras, C.; Mathioudakis, D.; Papadopoulou, K.; Lyberatos, G. Food Waste Valorization Based on Anaerobic Digestion. Waste Biomass-Valoriz. 2020, 12, 1677–1697. [Google Scholar] [CrossRef]
- Agler, M.; Wrenn, B.A.; Zinder, S.H.; Angenent, L.T. Waste to bioproduct conversion with undefined mixed cultures: The carboxylate platform. Trends Biotechnol. 2011, 29, 70–78. [Google Scholar] [CrossRef]
- Angenent, L.T.; Richter, H.; Buckel, W.; Spirito, C.M.; Steinbusch, K.J.J.; Plugge, C.M.; Strik, D.P.B.T.B.; Grootscholten, T.I.M.; Buisman, C.J.N.; Hamelers, H.V.M. Chain Elongation with Reactor Microbiomes: Open-Culture Biotechnology to Produce Biochemicals. Environ. Sci. Technol. 2016, 50, 2796–2810. [Google Scholar] [CrossRef]
- Strazzera, G.; Battista, F.; Garcia, N.H.; Frison, N.; Bolzonella, D. Volatile fatty acids production from food wastes for biorefinery platforms: A review. J. Environ. Manag. 2018, 226, 278–288. [Google Scholar] [CrossRef]
- Holtzapple, M.T.; Granda, C.B. Carboxylate Platform: The MixAlco Process Part 1: Comparison of Three Biomass Conversion Platforms. Appl. Biochem. Biotechnol. 2009, 156, 95–106. [Google Scholar] [CrossRef]
- Imkamp, F.; Müller, V. Acetogenic Bacteria. eLS 2007. [Google Scholar] [CrossRef]
- Garcia, J.-L.; Patel, B.; Ollivier, B. Taxonomic, Phylogenetic, and Ecological Diversity of Methanogenic Archaea. Anaerobe 2000, 6, 205–226. [Google Scholar] [CrossRef]
- Brioukhanov, A.L.; Thauer, R.K.; Netrusov, A.I. Catalase and Superoxide Dismutase in the Cells of Strictly Anaerobic Microorganisms. Microbiology 2002, 71, 281–285. [Google Scholar] [CrossRef]
- Nguyen, D.; Khanal, S.K. A little breath of fresh air into an anaerobic system: How microaeration facilitates anaerobic digestion process. Biotechnol. Adv. 2018, 36, 1971–1983. [Google Scholar] [CrossRef] [PubMed]
- Chen, Q.; Wu, W.; Qi, D.; Ding, Y.; Zhao, Z. Review on microaeration-based anaerobic digestion: State of the art, challenges, and prospectives. Sci. Total Environ. 2020, 710, 136388. [Google Scholar] [CrossRef] [PubMed]
- Girotto, F.; Peng, W.; Rafieenia, R.; Cossu, R. Effect of Aeration Applied During Different Phases of Anaerobic Digestion. Waste Biomass-Valoriz. 2018, 9, 161–174. [Google Scholar] [CrossRef]
- Mahdy, A.; Song, Y.; Salama, A.; Qiao, W.; Dong, R. Simultaneous H2S mitigation and methanization enhancement of chicken manure through the introduction of the micro-aeration approach. Chemosphere 2020, 253, 126687. [Google Scholar] [CrossRef]
- Giordano, A.; Di Capua, F.; Esposito, G.; Pirozzi, F. Long-term biogas desulfurization under different microaerobic conditions in full-scale thermophilic digesters co-digesting high-solid sewage sludge. Int. Biodeterior. Biodegrad. 2019, 142, 131–136. [Google Scholar] [CrossRef]
- Zhou, Y.; Feng, L.; Kou, W.; Shao, L.; Liu, P.; Zhai, J.; Dong, X.; Yu, M.; Zhang, D. Microaerobic Desulfurization in the Semi-Dry Fermentation of Cow Manure. J. Biobased Mater. Bioenergy 2019, 13, 62–68. [Google Scholar] [CrossRef]
- Khanal, S.K.; Huang, J.-C. ORP-based oxygenation for sulfide control in anaerobic treatment of high-sulfate wastewater. Water Res. 2003, 37, 2053–2062. [Google Scholar] [CrossRef]
- Gavazza, S.; Guzman, J.J.L.; Angenent, L.T. Electrolysis within anaerobic bioreactors stimulates breakdown of toxic products from azo dye treatment. Biogeochemistry 2015, 26, 151–160. [Google Scholar] [CrossRef]
- Siqueira, J.P.S.; Pereira, A.M.; Dutra, A.M.M.; Firmino, P.I.M.; dos Santos, A.B. Process bioengineering applied to BTEX degradation in microaerobic treatment systems. J. Environ. Manag. 2018, 223, 426–432. [Google Scholar] [CrossRef]
- Cheng, Z.; Wei, Y.; Zhang, Q.; Zhang, J.; Lu, T.; Pei, Y. Enhancement of surfactant biodegradation with an anaerobic membrane bioreactor by introducing microaeration. Chemosphere 2018, 208, 343–351. [Google Scholar] [CrossRef] [PubMed]
- do Nascimento, J.G.D.S.; de Araújo, M.H.P.; dos Santos, A.B.; da Silva, M.E.R.; Firmino, P.I.M. Redox mediator, microaeration, and nitrate addition as engineering approaches to enhance the biotransformation of antibiotics in anaerobic reactors. J. Hazard. Mater. 2021, 403, 123932. [Google Scholar] [CrossRef] [PubMed]
- Ortiz-Ardila, A.E.; Díez, B.; Celis, C.; Jenicek, P.; Labatut, R. Microaerobic conditions in anaerobic sludge promote changes in bacterial composition favouring biodegradation of polymeric siloxanes. Environ. Sci. Process. Impacts 2021, 23, 1182–1197. [Google Scholar] [CrossRef] [PubMed]
- Johansen, J.-E.; Bakke, R. Enhancing hydrolysis with microaeration. Water Sci. Technol. 2006, 53, 43–50. [Google Scholar] [CrossRef]
- Mahaffey, C.; Palmer, M.; Greenwood, N.; Sharples, J. Impacts of climate change on dissolved oxygen concentration relevant to the coastal and marine environment around the UK. MCCIP Sci. Rev. 2020, 2002, 31–53. [Google Scholar] [CrossRef]
- Trivellin, N.; Barbisan, D.; Badocco, D.; Pastore, P.; Meneghesso, G.; Meneghini, M.; Zanoni, E.; Belgioioso, G.; Cenedese, A. Study and Development of a Fluorescence Based Sensor System for Monitoring Oxygen in Wine Production: The WOW Project. Sensors 2018, 18, 1130. [Google Scholar] [CrossRef]
- Pristouri, G.; Badeka, A.; Kontominas, M.G. Effect of packaging material headspace, oxygen and light transmission, temperature and storage time on quality characteristics of extra virgin olive oil. Food Control 2010, 21, 412–418. [Google Scholar] [CrossRef]
- Zhang, X.; Li, S.; Zheng, S.; Duan, S. Impact of dissolved oxygen and loading rate on NH3 oxidation and N2 production mechanisms in activated sludge treatment of sewage. Microb. Biotechnol. 2021, 14, 419–429. [Google Scholar] [CrossRef]
- Wei, Y.; Jiao, Y.; An, D.; Li, D.; Li, W.; Wei, Q. Review of Dissolved Oxygen Detection Technology: From Laboratory Analysis to Online Intelligent Detection. Sensors 2019, 19, 3995. [Google Scholar] [CrossRef]
- Jiang, Z.; Yu, X.; Hao, Y. Design and Fabrication of a Ratiometric Planar Optode for Simultaneous Imaging of pH and Oxygen. Sensors 2017, 17, 1316. [Google Scholar] [CrossRef]
- Beyene, A.; Yemane, D.; Addis, T.; Assayie, A.A.; Triest, L. Experimental evaluation of anaerobic digestion for coffee wastewater treatment and its biomethane recovery potential. Int. J. Environ. Sci. Technol. 2014, 11, 1881–1886. [Google Scholar] [CrossRef]
- Charles, W.; Walker, L.; Cord-Ruwisch, R. Effect of pre-aeration and inoculum on the start-up of batch thermophilic anaerobic digestion of municipal solid waste. Bioresour. Technol. 2009, 100, 2329–2335. [Google Scholar] [CrossRef] [PubMed]
- Yakushev, E.V.; Vinogradova, E.L.; Dubinin, A.V.; Kostyleva, A.V.; Men’Shikova, N.M.; Pakhomova, S.V. On determination of low oxygen concentrations with Winkler technique. Oceanology 2012, 52, 122–129. [Google Scholar] [CrossRef]
- Fu, L.; Zheng, Y.; Fu, Z.; Wang, A.; Cai, W. Dissolved oxygen detection by galvanic displacement-induced graphene/silver nanocomposite. Bull. Mater. Sci. 2015, 38, 611–616. [Google Scholar] [CrossRef]
- Lehner, P.; Staudinger, C.; Borisov, S.M.; Klimant, I. Ultra-sensitive optical oxygen sensors for characterisation of nearly anoxic systems. Nat. Commun. 2014, 5, 4460. [Google Scholar] [CrossRef] [PubMed]
- Yu, N.; Guo, B.; Zhang, Y.; Zhang, L.; Zhou, Y.; Liu, Y. Different micro-aeration rates facilitate production of different end-products from source-diverted blackwater. Water Res. 2020, 177, 115783. [Google Scholar] [CrossRef] [PubMed]
- Liu, C.-G.; Xue, C.; Lin, Y.-H.; Bai, F.-W. Redox potential control and applications in microaerobic and anaerobic fermentations. Biotechnol. Adv. 2013, 31, 257–265. [Google Scholar] [CrossRef]
- Ndegwa, P.M.; Wang, L.; Vaddella, V.K. Potential strategies for process control and monitoring of stabilization of dairy wastewaters in batch aerobic treatment systems. Process Biochem. 2007, 42, 1272–1278. [Google Scholar] [CrossRef]
- Peddie, C.C.; Mavinic, D.S.; Jenkins, C.J. Use of ORP for Monitoring and Control of Aerobic Sludge Digestion. J. Environ. Eng. 1990, 116, 461–471. [Google Scholar] [CrossRef]
- Usack, J.; Angenent, L. Comparing the inhibitory thresholds of dairy manure co-digesters after prolonged acclimation periods: Part 1—Performance and operating limits. Water Res. 2015, 87, 446–457. [Google Scholar] [CrossRef]
- Regueiro, L.; Spirito, C.M.; Usack, J.G.; Hospodsky, D.; Werner, J.J.; Angenent, L.T. Comparing the inhibitory thresholds of dairy manure co-digesters after prolonged acclimation periods: Part 2—Correlations between microbiomes and environment. Water Res. 2015, 87, 458–466. [Google Scholar] [CrossRef] [PubMed]
- Vongvichiankul, C.; Deebao, J.; Khongnakorn, W. Relationship between pH, Oxidation Reduction Potential (ORP) and Biogas Production in Mesophilic Screw Anaerobic Digester. Energy Procedia 2017, 138, 877–882. [Google Scholar] [CrossRef]
- Bacab, F.C.; Gamboa, E.E.; Espinoza, J.E.R.; Leal-Bautista, R.M.; Tussell, R.T.; Maldonado, J.D.; Canché, B.C.; Alzate-Gaviria, L. Two Phase Anaerobic Digestion System of Municipal Solid Waste by Utilizing Microaeration and Granular Activated Carbon. Energies 2020, 13, 933. [Google Scholar] [CrossRef]
- Garcia-Ochoa, F.; Gomez, E. Oxygen Transfer Rate Determination: Chemical, Physical and Biological Methods. In Encyclopedia of Industrial Biotechnology; John Wiley & Sons, Inc.: Hoboken, NJ, USA, 2010; pp. 1–21. [Google Scholar] [CrossRef]
- Garcia-Ochoa, F.; Gomez, E.; Santos, V.E.; Merchuk, J.C. Oxygen uptake rate in microbial processes: An overview. Biochem. Eng. J. 2010, 49, 289–307. [Google Scholar] [CrossRef]
- Vasconcelos, J.M.T.; Orvalho, S.P.; Alves, S.S. Gas–liquid mass transfer to single bubbles: Effect of surface contamination. AIChE J. 2002, 48, 1145–1154. [Google Scholar] [CrossRef]
- Dong, X.; Liu, Z.; Liu, F.; Li, Z.; Wei, W.; Wang, X.; Xu, X. Effect of liquid phase rheology and gas–liquid interface property on mass transfer characteristics in bubble columns. Chem. Eng. Res. Des. 2019, 142, 25–33. [Google Scholar] [CrossRef]
- Pauss, A.; Andre, G.; Perrier, M.; Guiot, S.R. Liquid-to-Gas Mass Transfer in Anaerobic Processes: Inevitable Transfer Limitations of Methane and Hydrogen in the Biomethanation Process. Appl. Environ. Microbiol. 1990, 56, 1636–1644. [Google Scholar] [CrossRef]
- Epstein, P.S.; Plesset, M.S. On the Stability of Gas Bubbles in Liquid-Gas Solutions. J. Chem. Phys. 1950, 18, 1505–1509. [Google Scholar] [CrossRef]
- Motarjemi, M.; Jameson, G. Mass transfer from very small bubbles—The optimum bubble size for aeration. Chem. Eng. Sci. 1978, 33, 1415–1423. [Google Scholar] [CrossRef]
- Rieger, L.; Alex, J.; Gujer, W.; Siegrist, H. Modelling of aeration systems at wastewater treatment plants. Water Sci. Technol. 2006, 53, 439–447. [Google Scholar] [CrossRef]
- Liu, Y.; Zhang, X.; Ngo, H.H.; Guo, W.; Wen, H.; Deng, L.; Li, Y.; Guo, J. Specific approach for membrane fouling control and better treatment performance of an anaerobic submerged membrane bioreactor. Bioresour. Technol. 2018, 268, 658–664. [Google Scholar] [CrossRef] [PubMed]
- Kim, B.J.; Chu, I.; Jusuf, S.; Kuo, T.; TerAvest, M.A.; Angenent, L.; Wu, M. Oxygen Tension and Riboflavin Gradients Cooperatively Regulate the Migration of Shewanella oneidensis MR-1 Revealed by a Hydrogel-Based Microfluidic Device. Front. Microbiol. 2016, 7, 1438. [Google Scholar] [CrossRef] [PubMed]
- Tartakovsky, B.; Mehta, P.; Bourque, J.-S.; Guiot, S. Electrolysis-enhanced anaerobic digestion of wastewater. Bioresour. Technol. 2011, 102, 5685–5691. [Google Scholar] [CrossRef]
- Guzman, J.J.L.; Sousa, D.Z.; Angenent, L.T. Development of a Bioelectrochemical System as a Tool to Enrich H2-Producing Syntrophic Bacteria. Front. Microbiol. 2019, 10, 110. [Google Scholar] [CrossRef]
- Call, D.; Logan, B.E. Hydrogen Production in a Single Chamber Microbial Electrolysis Cell Lacking a Membrane. Environ. Sci. Technol. 2008, 42, 3401–3406. [Google Scholar] [CrossRef] [PubMed]
- Batlle-Vilanova, P.; Rovira-Alsina, L.; Puig, S.; Balaguer, M.D.; Icaran, P.; Monsalvo, V.M.; Rogalla, F.; Colprim, J. Biogas upgrading, CO2 valorisation and economic revaluation of bioelectrochemical systems through anodic chlorine production in the framework of wastewater treatment plants. Sci. Total Environ. 2019, 690, 352–360. [Google Scholar] [CrossRef] [PubMed]
- Baleeiro, F.C.F.; Ardila, M.S.; Kleinsteuber, S.; Sträuber, H. Effect of Oxygen Contamination on Propionate and Caproate Formation in Anaerobic Fermentation. Front. Bioeng. Biotechnol. 2021, 9, 725443. [Google Scholar] [CrossRef]
- Mishra, S.; Singh, P.K.; Dash, S.; Pattnaik, R. Microbial pretreatment of lignocellulosic biomass for enhanced biomethanation and waste management. 3 Biotech 2018, 8, 458. [Google Scholar] [CrossRef]
- Ruan, D.; Zhou, Z.; Pang, H.; Yao, J.; Chen, G.; Qiu, Z. Enhancing methane production of anaerobic sludge digestion by microaeration: Enzyme activity stimulation, semi-continuous reactor validation and microbial community analysis. Bioresour. Technol. 2019, 289, 121643. [Google Scholar] [CrossRef]
- Xu, S.; Selvam, A.; Wong, J.W. Optimization of micro-aeration intensity in acidogenic reactor of a two-phase anaerobic digester treating food waste. Waste Manag. 2014, 34, 363–369. [Google Scholar] [CrossRef]
- Wu, C.; Zhou, Y.; Wang, P.; Guo, S. Improving hydrolysis acidification by limited aeration in the pretreatment of petrochemical wastewater. Bioresour. Technol. 2015, 194, 256–262. [Google Scholar] [CrossRef] [PubMed]
- Zhu, M.; Lü, F.; Hao, L.-P.; He, P.-J.; Shao, L.-M. Regulating the hydrolysis of organic wastes by micro-aeration and effluent recirculation. Waste Manag. 2009, 29, 2042–2050. [Google Scholar] [CrossRef] [PubMed]
- Montalvo, S.; Ojeda, F.; Huiliñir, C.; Guerrero, L.; Borja, R.; Castillo, A. Performance evaluation of micro-aerobic hydrolysis of mixed sludge: Optimum aeration and effect on its biochemical methane potential. J. Environ. Sci. Health Part A Toxic/Hazard. Subst. Environ. Eng. 2016, 51, 1269–1277. [Google Scholar] [CrossRef] [PubMed][Green Version]
- Nguyen, P.H.L.; Kuruparan, P.; Visvanathan, C. Anaerobic digestion of municipal solid waste as a treatment prior to landfill. Bioresour. Technol. 2007, 98, 380–387. [Google Scholar] [CrossRef] [PubMed]
- Wang, Y.; Zhang, Y.; Meng, L.; Wang, J.; Zhang, W. Hydrogen–methane production from swine manure: Effect of pretreatment and VFAs accumulation on gas yield. Biomass-Bioenergy 2009, 33, 1131–1138. [Google Scholar] [CrossRef]
- Bengtsson, S.; Hallquist, J.; Werker, A.; Welander, T. Acidogenic fermentation of industrial wastewaters: Effects of chemostat retention time and pH on volatile fatty acids production. Biochem. Eng. J. 2008, 40, 492–499. [Google Scholar] [CrossRef]
- Teske, A.; Reysenbach, A.-L. Editorial: Hydrothermal microbial ecosystems. Front. Microbiol. 2015, 6, 884. [Google Scholar] [CrossRef]
- Nguyen, D.; Wu, Z.; Shrestha, S.; Lee, P.-H.; Raskin, L.; Khanal, S.K. Intermittent micro-aeration: New strategy to control volatile fatty acid accumulation in high organic loading anaerobic digestion. Water Res. 2019, 166, 115080. [Google Scholar] [CrossRef]
- Menezes, O.; Brito, R.; Hallwass, F.; Florêncio, L.; Kato, M.T.; Gavazza, S. Coupling intermittent micro-aeration to anaerobic digestion improves tetra-azo dye Direct Black 22 treatment in sequencing batch reactors. Chem. Eng. Res. Des. 2019, 146, 369–378. [Google Scholar] [CrossRef]
- Mshandete, A.; Björnsson, L.; Kivaisi, A.K.; Rubindamayugi, S.T.; Mattiasson, B. Enhancement of anaerobic batch digestion of sisal pulp waste by mesophilic aerobic pre-treatment. Water Res. 2005, 39, 1569–1575. [Google Scholar] [CrossRef]
- Meng, Y.; Jost, C.; Mumme, J.; Wang, K.; Linke, B. Oxygen tolerance capacity of upflow anaerobic solid-state (UASS) with anaerobic filter (AF) system. J. Environ. Sci. 2016, 45, 200–206. [Google Scholar] [CrossRef] [PubMed]
- Fu, S.-F.; Wang, F.; Yuan, X.-Z.; Yang, Z.-M.; Luo, S.-J.; Wang, C.-S.; Guo, R.-B. The thermophilic (55 °C) microaerobic pretreatment of corn straw for anaerobic digestion. Bioresour. Technol. 2015, 175, 203–208. [Google Scholar] [CrossRef] [PubMed]
- Peces, M.; Astals, S.; Clarke, W.; Jensen, P. Semi-aerobic fermentation as a novel pre-treatment to obtain VFA and increase methane yield from primary sludge. Bioresour. Technol. 2016, 200, 631–638. [Google Scholar] [CrossRef] [PubMed]
- Lim, J.W.; Wang, J.-Y. Enhanced hydrolysis and methane yield by applying microaeration pretreatment to the anaerobic co-digestion of brown water and food waste. Waste Manag. 2013, 33, 813–819. [Google Scholar] [CrossRef] [PubMed]
- Fu, S.-F.; Wang, F.; Shi, X.-S.; Guo, R.-B.; Fu, S.-F.; Wang, F.; Shi, X.-S.; Guo, R.-B. Impacts of microaeration on the anaerobic digestion of corn straw and the microbial community structure. Chem. Eng. J. 2016, 287, 523–528. [Google Scholar] [CrossRef]
- Fu, S.-F.; Shi, X.-S.; Xu, X.-H.; Wang, C.-S.; Wang, L.; Dai, M.; Guo, R.-B. Secondary thermophilic microaerobic treatment in the anaerobic digestion of corn straw. Bioresour. Technol. 2015, 186, 321–324. [Google Scholar] [CrossRef]
- Ramos, I.; Fdz-Polanco, M. The potential of oxygen to improve the stability of anaerobic reactors during unbalanced conditions: Results from a pilot-scale digester treating sewage sludge. Bioresour. Technol. 2013, 140, 80–85. [Google Scholar] [CrossRef]
- González, A.; Cuadros, F. Effect of aerobic pretreatment on anaerobic digestion of olive mill wastewater (OMWW): An ecoefficient treatment. Food Bioprod. Process. 2015, 95, 339–345. [Google Scholar] [CrossRef]
- Loughrin, J.; Lovanh, N. Aeration to Improve Biogas Production by Recalcitrant Feedstock. Environments 2019, 6, 44. [Google Scholar] [CrossRef]
- Khan, M.A.; Ngo, H.H.; Guo, W.S.; Liu, Y.; Nghiem, L.; Hai, F.; Deng, L.J.; Wang, J.; Wu, Y. Optimization of process parameters for production of volatile fatty acid, biohydrogen and methane from anaerobic digestion. Bioresour. Technol. 2016, 219, 738–748. [Google Scholar] [CrossRef]
- Agler, M.T.; Spirito, C.M.; Usack, J.G.; Werner, J.J.; Angenent, L.T. Chain elongation with reactor microbiomes: Upgrading dilute ethanol to medium-chain carboxylates. Energy Environ. Sci. 2012, 5, 8189–8192. [Google Scholar] [CrossRef]
- Webster, T.M.; Smith, A.L.; Reddy, R.R.; Pinto, A.J.; Hayes, K.F.; Raskin, L. Anaerobic microbial community response to methanogenic inhibitors 2-bromoethanesulfonate and propynoic acid. MicrobiologyOpen 2016, 5, 537–550. [Google Scholar] [CrossRef] [PubMed]
- Arslan, D.; Steinbusch, K.J.J.; Diels, L.; Hamelers, H.; Strik, D.P.B.T.B.; Buisman, C.J.N.; De Wever, H. Selective short-chain carboxylates production: A review of control mechanisms to direct mixed culture fermentations. Crit. Rev. Environ. Sci. Technol. 2016, 46, 592–634. [Google Scholar] [CrossRef]
- Jiang, Y.; McAdam, E.; Zhang, Y.; Heaven, S.; Banks, C.; Longhurst, P. Ammonia inhibition and toxicity in anaerobic digestion: A critical review. J. Water Process Eng. 2019, 32, 100899. [Google Scholar] [CrossRef]
- Shahab, R.L.; Brethauer, S.; Davey, M.P.; Smith, A.G.; Vignolini, S.; Luterbacher, J.S.; Studer, M.H. A heterogeneous microbial consortium producing short-chain fatty acids from lignocellulose. Science 2020, 369, eabb1214. [Google Scholar] [CrossRef] [PubMed]
- Angenent, L.T.; Magdalena, J.A.; Jeon, B.S.; Usack, J.G. Eco-Mimicry Opens New Doors for Bioprocess Engineers. Joule 2020, 4, 2074–2077. [Google Scholar] [CrossRef]
- Jagadabhi, P.S.; Kaparaju, P.; Rintala, J. Effect of micro-aeration and leachate replacement on COD solubilization and VFA production during mono-digestion of grass-silage in one-stage leach-bed reactors. Bioresour. Technol. 2010, 101, 2818–2824. [Google Scholar] [CrossRef]
- Wang, C.; Zhang, J.; Hu, F.; Zhang, S.; Lu, J.; Liu, S. Bio-pretreatment promote hydrolysis and acidification of oilseed rape straw: Roles of fermentation broth and micro-oxygen. Bioresour. Technol. 2020, 308, 123272. [Google Scholar] [CrossRef]
- Hou, Y.-N.; Yang, C.; Zhou, A.; Liu, W.; Liu, C.; Cai, W.-W.; Zhou, J.; Wang, A.-J. Microbial community response and SDS-PAGE reveal possible mechanism of waste activated sludge acidification enhanced by microaeration coupled thermophilic pretreatment. Process Biochem. 2018, 64, 1–8. [Google Scholar] [CrossRef]
- Sawatdeenarunat, C.; Sung, S.; Khanal, S.K. Enhanced volatile fatty acids production during anaerobic digestion of lignocellulosic biomass via micro-oxygenation. Bioresour. Technol. 2017, 237, 139–145. [Google Scholar] [CrossRef]
- Cavalcante, W.; Leitão, R.; Gehring, T.; Angenent, L.; Santaella, S.T. Anaerobic fermentation for n-caproic acid production: A review. Process Biochem. 2017, 54, 106–119. [Google Scholar] [CrossRef]
- De Groof, V.; Coma, M.; Arnot, T.; Leak, D.J.; Lanham, A.B. Medium Chain Carboxylic Acids from Complex Organic Feedstocks by Mixed Culture Fermentation. Molecules 2019, 24, 398. [Google Scholar] [CrossRef] [PubMed]
- Weimer, P.J.; Moen, G.N. Quantitative analysis of growth and volatile fatty acid production by the anaerobic ruminal bacterium Megasphaera elsdenii T81. Appl. Microbiol. Biotechnol. 2013, 97, 4075–4081. [Google Scholar] [CrossRef]
- Han, W.; He, P.; Shao, L.; Lü, F. Metabolic Interactions of a Chain Elongation Microbiome. Appl. Environ. Microbiol. 2018, 84, e01614–e01618. [Google Scholar] [CrossRef] [PubMed]
- Gildemyn, S.; Molitor, B.; Usack, J.G.; Nguyen, M.; Rabaey, K.; Angenent, L.T. Upgrading syngas fermentation effluent using Clostridium kluyveri in a continuous fermentation. Biotechnol. Biofuels 2017, 10, 83. [Google Scholar] [CrossRef] [PubMed]
- Kucek, L.A.; Nguyen, M.; Angenent, L.T. Conversion of l-lactate into n-caproate by a continuously fed reactor microbiome. Water Res. 2016, 93, 163–171. [Google Scholar] [CrossRef]
- Lambrecht, J.; Cichocki, N.; Schattenberg, F.; Kleinsteuber, S.; Harms, H.; Müller, S.; Sträuber, H. Key sub-community dynamics of medium-chain carboxylate production. Microb. Cell Factories 2019, 18, 92. [Google Scholar] [CrossRef]
- Zhang, W.; Werner, J.J.; Agler, M.T.; Angenent, L.T. Substrate type drives variation in reactor microbiomes of anaerobic digesters. Bioresour. Technol. 2014, 151, 397–401. [Google Scholar] [CrossRef]
- Botheju, D.; Lie, B.; Bakke, R. Oxygen effects in anaerobic digestion—II. Model. Identif. Control 2010, 31, 55–65. [Google Scholar] [CrossRef]
- Tang, Y.; Shigematsu, T.; Ikbal; Morimura, S.; Kida, K. The effects of micro-aeration on the phylogenetic diversity of microorganisms in a thermophilic anaerobic municipal solid-waste digester. Water Res. 2004, 38, 2537–2550. [Google Scholar] [CrossRef]
- Alcock, L.J.; Perkins, M.V.; Chalker, J.M. Chemical methods for mapping cysteine oxidation. Chem. Soc. Rev. 2018, 47, 231–268. [Google Scholar] [CrossRef] [PubMed]
- Gregory, E.M.; Dapper, C.H. Chemical and physical differentiation of superoxide dismutases in anaerobes. J. Bacteriol. 1980, 144, 967–974. [Google Scholar] [CrossRef] [PubMed]
- Seedorf, H.; Dreisbach, A.; Hedderich, R.; Shima, S.; Thauer, R.K. F420H2 oxidase (FprA) from Methanobrevibacter arboriphilus, a coenzyme F420-dependent enzyme involved in O2 detoxification. Arch Microbiol. 2004, 182, 126–137. [Google Scholar] [CrossRef] [PubMed]
- Jennings, M.E.; Schaff, C.W.; Horne, A.J.; Lessner, F.H.; Lessner, D.J. Expression of a bacterial catalase in a strictly anaerobic methanogen significantly increases tolerance to hydrogen peroxide but not oxygen. Microbiology 2014, 160, 270–278. [Google Scholar] [CrossRef]
- Tracy, B.P.; Jones, S.W.; Fast, A.G.; Indurthi, D.C.; Papoutsakis, E.T. Clostridia: The importance of their exceptional substrate and metabolite diversity for biofuel and biorefinery applications. Curr. Opin. Biotechnol. 2012, 23, 364–381. [Google Scholar] [CrossRef]
- Mosbæk, F.; Kjeldal, H.; Mulat, D.G.; Albertsen, M.; Ward, A.J.; Feilberg, A.; Nielsen, J.L. Identification of syntrophic acetate-oxidizing bacteria in anaerobic digesters by combined protein-based stable isotope probing and metagenomics. ISME J. 2016, 10, 2405–2418. [Google Scholar] [CrossRef]
- Jang, H.M.; Cho, H.U.; Park, S.K.; Ha, J.H.; Park, J.M. Influence of thermophilic aerobic digestion as a sludge pre-treatment and solids retention time of mesophilic anaerobic digestion on the methane production, sludge digestion and microbial communities in a sequential digestion process. Water Res. 2014, 48, 1–14. [Google Scholar] [CrossRef]
- Diallo, M.; Kengen, S.W.M.; López-Contreras, A.M. Sporulation in solventogenic and acetogenic clostridia. Appl. Microbiol. Biotechnol. 2021, 105, 3533–3557. [Google Scholar] [CrossRef]
- Lu, Z.; Imlay, J.A. When anaerobes encounter oxygen: Mechanisms of oxygen toxicity, tolerance and defence. Nat. Rev. Microbiol. 2021, 19, 774–785. [Google Scholar] [CrossRef]
- Morra, S.; Arizzi, M.; Valetti, F.; Gilardi, G. Oxygen Stability in the New [FeFe]-Hydrogenase from Clostridium beijerinckii SM10 (CbA5H). Biochemistry 2016, 55, 5897–5900. [Google Scholar] [CrossRef]
- Winkler, M.; Duan, J.; Rutz, A.; Felbek, C.; Scholtysek, L.; Lampret, O.; Jaenecke, J.; Apfel, U.-P.; Gilardi, G.; Valetti, F.; et al. A safety cap protects hydrogenase from oxygen attack. Nat. Commun. 2021, 12, 756. [Google Scholar] [CrossRef]
- Das, A.; Silaghi-Dumitrescu, R.; Ljungdahl, L.G.; Kurtz, D.M. Cytochrome bd Oxidase, Oxidative Stress, and Dioxygen Tolerance of the Strictly Anaerobic Bacterium Moorella thermoacetica. J. Bacteriol. 2005, 187, 2020–2029. [Google Scholar] [CrossRef] [PubMed]
- Cheng, C.; Zhou, Z.; Qiu, Z.; Yang, J.; Wu, W.; Pang, H. Enhancement of sludge reduction by ultrasonic pretreatment and packing carriers in the anaerobic side-stream reactor: Performance, sludge characteristics and microbial community structure. Bioresour. Technol. 2018, 249, 298–306. [Google Scholar] [CrossRef] [PubMed]
- Campanaro, S.; Treu, L.; Rodriguez-R, L.M.; Kovalovszki, A.; Ziels, R.M.; Maus, I.; Zhu, X.; Kougias, P.G.; Basile, A.; Luo, G.; et al. The anaerobic digestion microbiome: A collection of 1600 metagenome-assembled genomes shows high species diversity related to methane production. bioRxiv 2019, 680553. [Google Scholar] [CrossRef]
- Thauer, R.K.; Kaster, A.-K.; Seedorf, H.; Buckel, W.; Hedderich, R. Methanogenic archaea: Ecologically relevant differences in energy conservation. Nat. Rev. Microbiol. 2008, 6, 579–591. [Google Scholar] [CrossRef]
- Brioukhanov, A.L.; Netrusov, A.I.; Eggen, R.I.L. The catalase and superoxide dismutase genes are transcriptionally up-regulated upon oxidative stress in the strictly anaerobic archaeon Methanosarcina barkeri. Microbiology 2006, 152, 1671–1677. [Google Scholar] [CrossRef]
- Whitman, W.B. The methanogenic bacteria. In The Prokaryotes. A Handbook on the Biology of Bacteria: Ecophysiology, Isolation, Identification, Applications; Springer: New York, NY, USA, 1992; pp. 719–767. [Google Scholar]
- Kiener, A.; Leisinger, T. Oxygen Sensitivity of Methanogenic Bacteria. Syst. Appl. Microbiol. 1983, 4, 305–312. [Google Scholar] [CrossRef]
- Tholen, A.; Pester, M.; Brune, A. Simultaneous methanogenesis and oxygen reduction by Methanobrevibacter cuticularis at low oxygen fluxes. FEMS Microbiol. Ecol. 2007, 62, 303–312. [Google Scholar] [CrossRef]
- Botheju, D.; Bakke, R. Oxygen Effects in Anaerobic Digestion—A Review. Open Waste Manag. J. 2011, 4, 1–19. [Google Scholar] [CrossRef]
- Pedizzi, C.; Regueiro, L.; Rodriguez-Verde, I.; Lema, J.; Carballa, M. Effect of oxygen on the microbial activities of thermophilic anaerobic biomass. Bioresour. Technol. 2016, 211, 765–768. [Google Scholar] [CrossRef]
- Wang, H.; Fotidis, I.; Angelidaki, I. Ammonia effect on hydrogenotrophic methanogens and syntrophic acetate-oxidizing bacteria. FEMS Microbiol. Ecol. 2015, 91, fiv130. [Google Scholar] [CrossRef] [PubMed]
- Xu, K.; Liu, H.; Chen, J. Effect of classic methanogenic inhibitors on the quantity and diversity of archaeal community and the reductive homoacetogenic activity during the process of anaerobic sludge digestion. Bioresour. Technol. 2010, 101, 2600–2607. [Google Scholar] [CrossRef]
- Sprott, G.D.; Patel, G.B. Ammonia toxicity in pure cultures of methanogenic bacteria. Syst. Appl. Microbiol. 1986, 7, 358–363. [Google Scholar] [CrossRef]
- Karakashev, D.; Batstone, D.J.; Trably, E.; Angelidaki, I. Acetate Oxidation Is the Dominant Methanogenic Pathway from Acetate in the Absence of Methanosaetaceae. Appl. Environ. Microbiol. 2006, 72, 5138–5141. [Google Scholar] [CrossRef] [PubMed]
- Ariesyady, H.D.; Ito, T.; Okabe, S. Functional bacterial and archaeal community structures of major trophic groups in a full-scale anaerobic sludge digester. Water Res. 2007, 41, 1554–1568. [Google Scholar] [CrossRef]
- Van Wolferen, M.; Orell, A.; Albers, S.-V. Archaeal biofilm formation. Nat. Rev. Microbiol. 2018, 16, 699–713. [Google Scholar] [CrossRef]
Publisher’s Note: MDPI stays neutral with regard to jurisdictional claims in published maps and institutional affiliations. |
© 2022 by the authors. Licensee MDPI, Basel, Switzerland. This article is an open access article distributed under the terms and conditions of the Creative Commons Attribution (CC BY) license (https://creativecommons.org/licenses/by/4.0/).