Abstract
The emerging elicitor protein PeBA1, extracted from Bacillus amyloliquefaciens NC6, was tested against the cabbage aphid (Brevicoryne brassicae) for its biocontrol potential. Its effects on the survival, lifespan, immature development, adult reproductive performance, and pest–pathogen interaction were assessed using electrical penetration graphs (EPGs) against B. brassicae. Furthermore, the direct effects of PeBA1 with temperature and climate change in Brassica rapa ssp. Pekinensis plants were investigated by the characterization of active compounds in B. amyloliquefaciens with multi-acting entomopathogenic effects. Compared with controls, PeBA1 treatments decreased (second- and third-generation) B. brassicae population growth rates. In a host selection test, control plants were colonized faster by B. brassicae than PeBA1-treated B. rapa plants. The B. brassicae nymphal development was extended by PeBA1 concentrations. Likewise, fecundity was reduced in PeBA1-treated seedlings compared with control, with fewer offspring produced. The trichomes and wax production on PeBA1-treated leaves resulted in a hostile environment for B. brassicae. PeBA1 altered the surface structure of the leaves, reducing B. brassicae reproduction and preventing colonization. Systemic defensive processes also included the activation of pathways (JA, SA, and ET). Based on these findings against B. brassicae, integrated pest management and bio control with PeBA1 in the agroecosystem appears to be suitable.
1. Introduction
In nature, plants are threatened by a diverse spectrum of pathogens, including viruses, bacteria, fungi, oomycetes, nematodes, and insects, each of which has a unique life cycle and infection strategy. Only a few of these potential disease agents, however, are capable of effectively establishing contact with a plant by successfully detecting and defeating the host plant’s defense system. Plants utilize two distinct forms of basal defenses to ward off pathogens [1]. One is used as a recognition system to identify molecular patterns associated with microbes or pathogens (MAMPs or PAMPs) such as flagellin, which helps ward off pathogen infection. PAMP-induced immunity (PTI) refers to the innate immunity of plants which is triggered by PAMP via numerous plant transmembrane pattern recognition receptors (PRRs) [2]. The other sort of defense, dubbed gene-for-gene resistance, operates mostly within the plant cell, utilizing recognition between resistance (R) proteins and effectors, such as pathogen-secreted elicitors [3]. Hypersensitive responses (HRs), oxidative bursts, nitric oxide (NO) generation, extracellular pH increase, cell wall strengthening, and expression of pathogenesis-related proteins are all part of this R-protein-mediated defense known as effector-triggered immunity (ETI). This only occurs in living host tissues and not in necrotrophs [4,5]. Furthermore, these resistance responses begin at the site of infection in the cells and then spread to nearby and non-infected cells, finally resulting in systemic acquired resistance (SAR) in whole plants, enabling them to combat pathogens efficiently [6].
Aphids are phloem-feeding insects that spread plant viruses by ingesting plant sap, leading to substantial crop losses [7]. In several aphid–plant interactions, aphid defense responses have been studied. Arabidopsis thaliana was shown to be less viable in M. euphorbiae infested leaves [8,9]. Resistance to the B. brassicae in B. napus lowered the survival rate and population growth characteristics of Plutella xylostella [10]. Jasmonic acid (JA), salicylic acid (SA), and ethylene (ET) all stimulate defensive responses in plants [11]. SA has been associated with resistance to sucking/piercing insects, whereas JA has been associated with resistance to chewing insects [12]. ET is involved in the regulation of a variety of defensive mechanisms in plants [13]. Several previous studies have established the involvement of JA and SA in the induction of an aphid response through the increased expression of genes such as PR-1 (pathogenesis-related protein 1), PR-2 (pathogenesis-related protein 2), CHIT1 (chitinase 1), LOX1 (lipoxygenase), and PAL (phenylalanine ammonia-lyase) that have been identified as responses induced by JA–SA after aphid feeding [14].
Due to its feeding behavior, B. brassicae, a major detrimental pest of cabbage in China, has a direct impact on crop productivity and quality. Elicitors, both biotic and abiotic, stimulate plant defense mechanisms [15,16]. Many elicitors have been identified from bacteria, viruses, oomycetes, and fungus, among other organisms. Proteins, peptides, glycoproteins, lipids, and oligosaccharides have all been used as elicitor molecules [17]; some of these elicitors have even been employed to help plants resist pathogens [18]. These defense responses are frequently linked to HR and even localized programmed cell death via ion influx, NO generation, and reactive oxygen species (ROS), such as H2O2 and O2−, which subsequently act as signaling molecules to transmit the elicitor signal to downstream defense responses [18,19]. Elicitors are classified into two types: race-specific groups that induce a defense response exclusively in host plants and general defense groups that induce a defense response in both host and non-host plants [20]. Due to the increased need for food safety and quality, protein elicitors have been investigated as possible substitutes for certain chemical pesticides [21,22,23,24,25,26,27].
Numerous Gram-negative bacteria, particularly those belonging to the genus Pseudomonas, have been identified as ISR-inducing microbes. However, the number of Bacillus species recognized as ISR inducers has increased significantly over the last decade and now includes B. amyloliquefaciens, Bacillus subtilis, Bacillus pasteurii, Bacillus cereus, Bacillus pumilus, Bacillus mycoides, and Bacillus sphaericus [28,29,30,31]. These species have the potential to significantly reduce the severity of disease caused by a wide variety of pathogens in diverse hosts. Dimethyl disulfide (DMDS), generated by a B. cereus strain, induces ISRs and confers resistance to fungal infections in plants [28]. Volatile compounds generated by the PGPR strains B. subtilis GB03 and B. amyloliquefaciens IN937a have been shown to induce plant defense responses [31,32]. PeBA1 is a broad-spectrum, highly specific elicitor that has been examined in the NC6 strain of B. amyloliquefaciens a well-characterized PGPR strain for use in agricultural crop cultivation as a biocontrol agent. It has been shown to trigger resistance in plants via the JA and ET pathways. Its activity results in the activation of defense enzymes, cell wall strengthening, and the increased expression of other defense-related genes [33]. This 285 amino acid elicitor protein is capable of generating systemic resistance traits in tobacco plants, including the transcription of JA- and SA-related defense genes, cell death, HR necrosis, and ROS production [33].
The current investigation examined the function, mechanism, and biological activity of PeBA1 and its effects on B. brassicae management. The contents of JA and SA, as well as ET gene expression were determined following the discovery of trichomes on the leaf surface structure. The purpose of this article is to provide information about PeBA1′s function, method of action, and its impacts on the management of B. brassicae.
2. Materials and Methods
2.1. Brevicoryne brassicae, Colony Establishment, and the Cultivation of Plants
The goal of the present study was to effectively establish B. brassicae and B. rapa colonies prior to the experiments under controlled greenhouse conditions. Brevicoryne brassicae was collected from a Brassica oleracea field and shifted to B. rapa seedlings. A colony of B. brassicae was kept for six months with a 16 h/8 h light/dark photoperiod, 65% relative humidity (RH), and a temperature of 25 ± 2 °C prior to the experiment. Prior to usage, B. rapa seeds were cleaned in 75% ethanol for 35–45 s, then washed in distilled water and pre-soaked in distilled water for 2–3 d.
2.2. Preparation of PeBA1 Elicitor Protein
The study aimed to perform the expression, purification, and evaluation of PeBA1 from B. amyloliquefaciens NC6. PeBA1 was produced in Escherichia coli BL21-DE3 (TransGen Biotech, Beijing, China) using the E1 plasmid (TransGen Biotech, Beijing, China). In this study, the elicitor protein PeBA1 was isolated from a colony of the bacterial strain B. amyloliquefaciens NC6 that had been grown in 1 L of LB medium for 12 h at 16 °C at 200 rpm over the previous 12 h. Subsequently, the pellets were collected, shattered, and re-suspended via sonication. After that, the solution was centrifuged for 15 min at 12,000 rpm, after which the supernatant was collected and filtered through a 0.22 m filter paper. The final purification of the elicitor protein was accomplished through affinity chromatography, which was performed with a His-trap HP column and loading buffers A, B, C, and D. In order to wash the column, we utilized buffer A (50 mM Tris-HCl, pH 8.0), whereas buffer B (50 mM Tris-HCl, 200 mM NaCl, pH 8.0) was used to stabilize the column. A combination of buffers C (50 mM Tris-HCl, 20 mM imidazole, and pH 8.0) and D (50 M Tris-HCl, 200 mM NaCl, and 500 M imidazole, pH 8.0) was employed to elute the elicitor protein from the cell culture medium and to extract it. Then, the elicitor protein was desalted using (GE Healthcare, Waukesha, WI, USA) desalting tubes and centrifuged at 4 °C at 5000 rpm. A 12% SDS-PAGE system(Thermo Scientific, Rockford, IL, USA) was used to assess the molecular mass of the purified elicitor protein, and a protein marker (Thermo Scientific, Rockford, IL, USA) was employed to estimate the molecular masses of the purified elicitor protein, as per the author’s protocol [33,34].
2.3. Brevicoryne brassicae Infestation on the Plant
The study aimed to calculate the average size of the settled B. brassicae population. Brassica rapa seeds and young seedlings were immersed in 85.23 μg mL−1 of PeBA1 solution for 24 h. Five seeds/pot were cultivated separately in organic soil (Flora Guard substrate). After seven days, the B. rapa seedlings were sprayed with the 82.64 μg mL−1 PeBA1 solution then inoculated with 15–20 adults of B. brassicae 24 h later. Seedlings were sprayed every 7 days. Following inoculation, the number of settled aphids was counted every 5 d [25]. The data fractions were used for data analysis and the conclusion of results. Controls and negative controls were treated with water and 85.23 μg mL−1 of a buffer (50 mM Tris-HCl, pH 8.0), respectively. Transparent air-permeable cages were used to isolate seedlings. The experiment was performed twice with four replications.
2.4. Brevicoryne brassicae Preference Assay
The goal of this experiment was to assess the host selection of B. brassicae. Seeds and seedlings were treated as described in Section 2.3 then seedlings were arranged in a ventilated breathable cage (60 × 60 × 60 cm), with cross-touch leaves and a white cardboard bridge (12 × 4 cm) connecting the base parts of the stems. Forty wingless B. brassicae adults were released into the center of the bridge. The experiment was carried out 15 times. After 24 h, the B. brassicae on each seedling were examined and the number of B. brassicae on each seedling was recorded.
2.5. Brevicoryne brassicae Intrinsic Rate of Growth
The goal of this experiment was to determine the increase in the intrinsic growth rate of B. brassicae when feeding on PeBA1-treated and control seedlings. Seeds were treated as described in Section 2.3. Each seedling was implanted with a newly emerged B. brassicae nymph. All seedlings were separated by a cotton-gauze-lined glass tube, and aphid movement was restricted on the leaf in a plastic ecological cage (Cangzhou Hengyun Plastic Industry, Cangzhou, Hebei Province China) (2.7 × 2.7 × 2.7 cm). Every 12 h, the B. brassicae instar was tested to determine when it produced its first nymphs. Then, the number of newborn nymphs was counted twice daily to determine the overall amount of time and number of offspring produced, which were removed daily following each count to avoid crowding. The same test was repeated five days later on seeds and seedlings. The experiment was conducted twice with 30 duplicates for each treatment. The rise in the intrinsic rate of each aphid was calculated using the following formula:
where Md is the number of newborn nymphs within a development period of Td, which is the time interval between an aphid’s birth and its first reproduction.
rm = 0.738 × (ln Md)/Td
2.6. Identification of B. brassicae Feeding Activities Using EPG
This study used EPG to gain access to B. brassicae feeding activities. Brassica rapa seeds were soaked and germinated in distilled water for 3–4 d. Similarly, until day 7, seedlings of the same sizes were individually planted in organic soil; 24 h after seedlings were sprayed, an EPG (GIGA-8d) was employed on healthy wingless, 12–15-day-old-adult B. brassicae. Before the test, all aphids were starved for one hour. The determination and manual study of the B. brassicae feeding waves was carried out using an A B stylet. A wave identifier has been described elsewhere [35].
2.7. Bioassay of the B. brassicae
This study examined the development time of nymphs as well as the fecundity of B. brassicae. A bioassay of the PeBA1 against B. brassicae was performed on B. rapa plants using various concentrations of PeBA1: 85.23, 51.13, 25.56, and 12.78 μg mL−1. The Bradford assay was used to determine various protein concentrations. At the three-leaf stage of the B. rapa plants, approximately 4 mL of PeBA1 was sprayed into the plants using a separate spray bottle until the solution drained off. Brassica rapa plants were allowed to dry overnight before being fed by 3–6 freshly molted (0–6 h old) B. brassicae. The period of nymph development was determined through repeated observations every 4 h until the bioassays were completed for each instar as the total number of offspring generated by all aphid instars, whereas the lifespan of aphids was determined by the number of days they lived. Bioassays were repeated independently using 10 replicates per treatment at three non-identical temperature regimes (22, 24 and 26 °C).
2.8. Impact of PeBA1 on the Structure and Growth of the B. rapa
This study aimed to determine the effect of PeBA1 on the physical structure of B. rapa. Seeds and seedlings were treated as discussed in Section 2.3. The initial leaves’ core sections were removed and analyzed, and samples were taken for up to 2 days using 3.5% glutaraldehyde mixed in a 0.1 M phosphate solution (pH 7.2). All samples were washed for about 15 min in a 0.1 M phosphate buffer (pH 7.2) before being submerged in 1% osmic acid five times for roughly 2 h each. An ethanol gradient of 100%, 95%, 90%, 80%, 70%, 60%, 50%, and 30% was used for 15 min. A Leica EM critical point dryer (CPD030; Leica Biosystems, Wetzlar, Germany) was used to dry all critical points. A Hitachi H-7650 transmission electron microscope (Hitachi, Ltd. Kabushiki Kaisha Hitachi Seisakusho, Tokyo, Japan) was used to examine all materials. To assess the effect of PeBA1-treated settlements, total plant height (cm), total chlorophyll amount (SPAD), total fresh and dry weight, and the number of plant leaves were evaluated in 10 replicates.
2.9. Determination of Plant Hormone Using HPLC/MS
The purpose of this experiment was to measure the quantities of SA, JA, and ET accumulated. Seeds and seven-day-old seedlings were treated as discussed above. Approximately 0.5 g of the aerial part of the seedlings was harvested to extract SA, JA, and ET [36]. A high-performance liquid chromatography spectrometer (HPLC/MS; Shimazu Research Instruments, ODS-C18, 3 μm, 2.1 per 150 mm, Kyoto, Japan) was used to inject the extraction. HPLC was performed at a flow rate of 0.2 mL/min with a 60% methanol mobile phase, a column temperature of 40 °C, and a sample temperature of 4 °C. MS was configured in the negative ion mode at the selected ion monitoring system (SIM) with a solvent temperature of 250 °C, a heat block temperature of 200 °C, a drying gas flow rate of 10 L/min, a nebulizing gas flow rate of 1.5 L/min, a detector voltage of 1.30 kV, and an interface voltage of −3.5 kV (SA m/z: 137.00; JA: 209.05).
2.10. RT-qPCR
The goal of this experiment was to determine the relative expression levels of genes. To extract RNA, synthesize cDNA, and perform a real-time quantitative polymerase chain reaction (RT-qPCR) (ABI 7500 Real-Time PCR System), kits from TransGen Biotech (Beijing, China) were utilized. An NP80 nano-photometer was used to assess the purity and excellence of the RNA. The internal reference gene was identified as the ribosomal gene 18S [37]. AOC, LOX2, AOS, ACS, AIMI, ACS6, KAT2, and 4CL were chosen as key genes. The key genes involved, and their respective primers are listed in Table 1 and Table 2. The 2−ΔΔCT methodology was used to determine the relative expression levels of the genes [38].

Table 1.
Key genes associated with the JA, SA, and ET pathways of B. rapa.
Table 2.
Primers of all test genes JA, SA, ET.
2.11. Analysis of Data
Data from two treatments were compared using an independent Leven’s test and a two-tailed t-test, whereas data from three or more treatments were compared using the LSD and an ANOVA with Statistix software version 8.1 (Tallahassee, FL, USA). Prior to analysis, aphid fecundity data were square-root transformed. A one-way factorial analysis of variance was performed among treatment factors such as the PeBA1′s concentrations and varied temperature regimes to eliminate differences, followed by a 95% probability LSD test. The gene expressions (RT-qPCR) were obtained by the comparative CT (2−∆∆CT) method: student’s t-tests (α = 0.05) were used to compare the fold changes in plant samples treated with PeBA1 and buffer.
3. Results
3.1. Brevicoryne brassicae Performance Indoors
Resistance to B. brassicae was induced by PeBA1 in two separate ways. Primarily, PeBA1-treated B. rapa seedlings exhibited a substantial aphid population loss; Figure 1 shows the percentage declines in population in the PeBA1-treatment compared with control. In the host selection test, B. brassicae preferred to feed on the control compared with PeBA1-treated plants (Figure 2). Aphid development was extended more in the PeBA1 treatment than control; however, the everyday reproductive capacity of B. brassicae was reduced when they were fed on PeBA1-treated seedlings (second and third nymphal instars). Both the second and third generations showed lower growth rates (Figure 3).
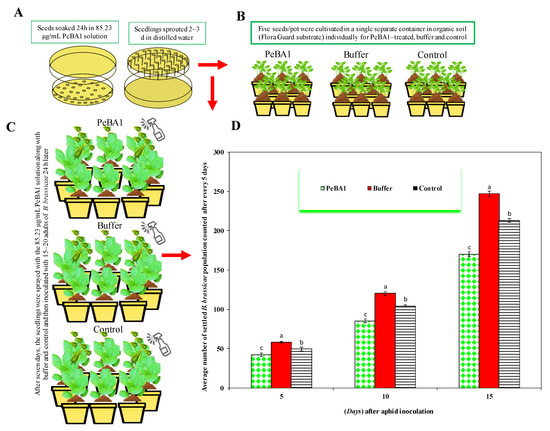
Figure 1.
Plants treated with PeBA1, control, and buffer showed B. brassicae population variations. (A,B) Seeds and seedling treatment, (C) after 7 d, seedlings were inoculated with 15–20 adults of B. brassicae, (D) seedlings treated with PeBA1 saw a substantial aphid population loss (mean ± SD), (a–c) the significant differences among PeBA1, buffer and control. The study used a CRD randomized statistical design, LSD and one-way ANOVA were used to compare data (p = 0.05).
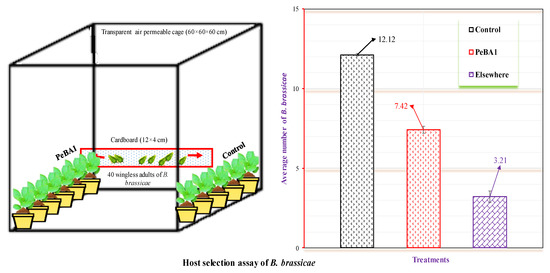
Figure 2.
Brevicoryne brassicae colonization on seedlings treated with PeBA1-treated and control (mean ± SD). The study used a (CRD) randomized statistical design. Data were compared using one-way ANOVA and the least significant difference (LSD) (p = 0.05) with SPSS 18.0.
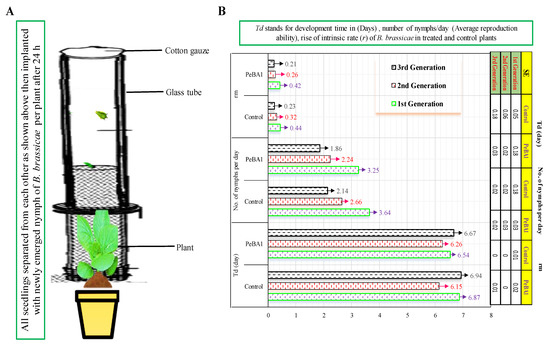
Figure 3.
Development time, reproductive capacity, and rate of growth of B. brassicae (A,B) in seedlings treated with PeBA1 and control (mean ± SD). The study used a randomized (CRD) statistical design, SPSS 18.0 was used to compare data by LSD and one-way ANOVA, (p = 0.05).
3.2. EPG Feeding Performance of B. brassicae
An EPG illustrated that resistance characteristics of the B. rapa. Brevicoryne brassicae feeding patterns in PeBA1-treated seedlings were considerably affected (Figure 4). The probing period, the length of C, and the total value of B. brassicae Pd considerably lowered in the PeBA1-treated seedlings, meanwhile, the period of non-probing before the first E and the total duration of F dramatically increased. During the non-probing period, no electrical contact was detected between the aphid stylet and the plant [39]. The non-probing period before the first E was significantly increased in the PeBA1 treatment, indicating a repellent or deterrent surface factor in the PeBA1-treated B. rapa seedlings. C waves describing style motion may serve as a mechanical barrier in plants [40]. The shorter the C waves (3 min), the greater the mechanical difficulty in PeBA1-treated seedlings. Wave E1 indicated aphid saliva injection into sieve elements. The E2 wave revealed phloem sap injection. The expanded E1 in the sieve element showed additional plugging or defensive chemicals. In the E2 period, however, there were no significant differences between the control and PeBA1 treatments, indicating no or low variability in phloem chemicals to impart resistance to B. brassicae. The F wave time in the PeBA1-treated seedlings, on the other hand, was longer, showing that PeBA1 improved the mechanistic defense. The EPG results revealed that the resistance caused by PeBA1 was mostly related to a change in physical defense.
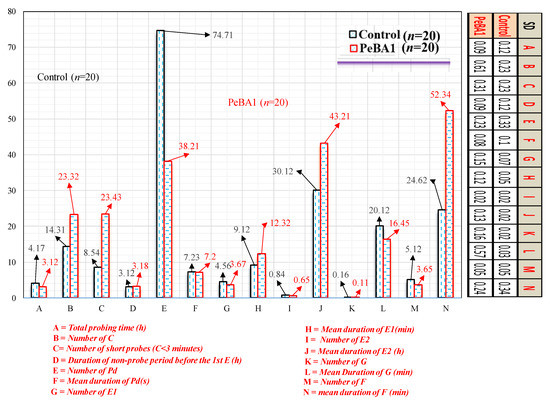
Figure 4.
EPG data of B. brassicae on PeBA1-treated and control seedlings (mean ± SD). C indicates pathway activities, Pd represents potential drop, E2 represents phloem-feeding activities, F represents penetration difficulty, G represents xylem-feeding activities, and E1 represents saliva injection. Independent t-test with two tails was used to compare data (p = 0.05).
3.3. Brevicoryne brassicae Nymphal Development Period and Fecundity Were Influenced by PeBA1
A differential trend in the developing time of nymphs was discovered for the elicitor effect at various temperatures. As PeBA1 concentrations prolonged, the development time of each nymphal instar is shown in Figure 5. At 85.23 µg mL−1 with 22 °C, the utmost development time for the fourth nymphal instar was 3.5 d. At 12.78 µg mL−1 with 26 °C, the minimal nymph growth of 1.5 days was recorded for the first instar. Brevicoryne brassicae fecundity had a substantial effect on PeBA1 concentrations and temperature regimes (Figure 6). Fecundity was found to be minimal at a maximum temperature of 26 °C and greatest at a minimum temperature of 22 °C.
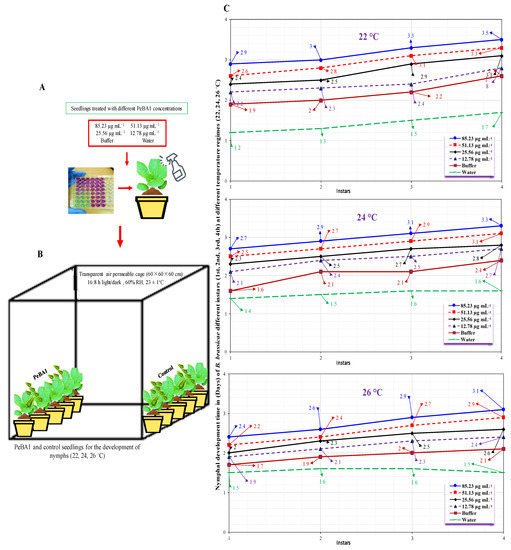
Figure 5.
Mean developmental time (± SE) of B. brassicae nymphal instars on B. rapa plants in varying concentrations at 22, 24, 26 °C (n = 10). Seeds and seedlings treatment and preparation for inoculation B. brassicae (A,B). Nymph development time prolonged in treated seedlings compared to control, (C). Data were compared statistically using a factorial ANOVA and the least significant difference (LSD) at α = 0.05.
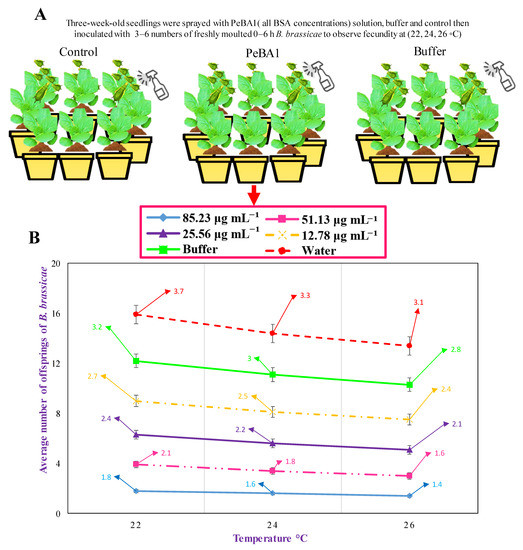
Figure 6.
Brevicoryne brassicae fecundity reduced in B. rapa seedlings treated with PeBA1 Seedlings treatment with PeBA1, buffer, and control (A). Average fecundity of B. rapa (n = 10) (B). Data shown as mean (±SE) (factorial analysis one-way ANOVA; LSD at α = 0.05).
3.4. The Influence of PeBA1 on B. rapa Development and Structure
PeBA1 affected the surface structure of B. rapa substantially more than in control seedlings (Figure 7). Seedlings treated with PeBA1 (56.12 ± 0.52 mm−2) had significantly more trichomes than control (26 ± 0.10 mm−2). A more complex wax structure was created, resulting in a much better surface environment that is anticipated to be detrimental for aphid colonization.
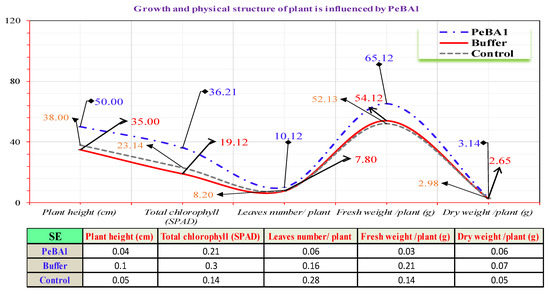
Figure 7.
Effect of PeBA1 on growth of PeBA1-treated and control seedlings. Data shown in mean (±SD) of PeBA1, buffer, and control seedlings (n = 10). The data were compared using LSD, one-way ANOVA, and Levene’s test in SPSS 18.0. (p = 0.05).
3.5. Quantities of SA, JA, and ET Accumulated
JA, SA, and ET were used to investigate the relationship between the deposition of cuticular wax and the number of trichomes on PeBA1. The JA, SA, and ET levels in PeBA1 seedlings were significantly higher than expected (Figure 8). It has been discovered that all three signaling pathways are important in the development of aphid resistance in B. rapa. PeBA1-treated plants also accumulated high levels of JA, SA, and ET, indicating that PeBA1 partially induced a defensive response in B. rapa plants.
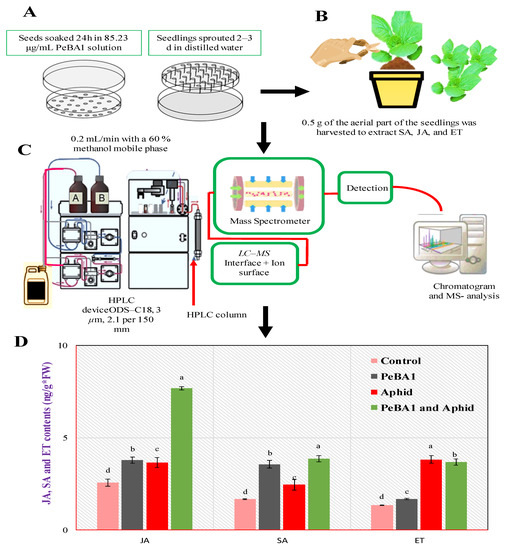
Figure 8.
Seed and seedling treatment (A), aerial part of seedling was harvested to extract JA, SA, and ET (B). JA, SA and ET contents in B. rapa seedlings (mean ± SD) (C,D). PeBA1-treated tests were gathered 1 d after the spraying. Aphids were inoculated on seedlings 1 d after they were sprayed with treatment, and samples were collected 1 d after they were inoculated, (a–d) are significant differences among treatments and control, Data were compared statistically; the LSD, ANOVA, and Leven’s test were employed by Statistix version 8.1. (p = 0.05).
3.6. Relative Expression Levels of Genes
The defense mechanisms in seedlings of B. rapa were enhanced by PeBA1. The genes AOC, LOX2, AOS, ACS8, AIMI, ACS6, KAT2, and 4CL were chosen as test genes [23,25,26]. All the genes were slightly upregulated by treatment with PeBA1 and aphid infestation (Figure 9). The highest expressed gene was LOX2, followed by AOC, AIMI, ACS8, KAT2, AOS, ACS6, and 4CL. The Log2 of all JA, SA, and ET test genes was computed with fold change expression values Table 3.
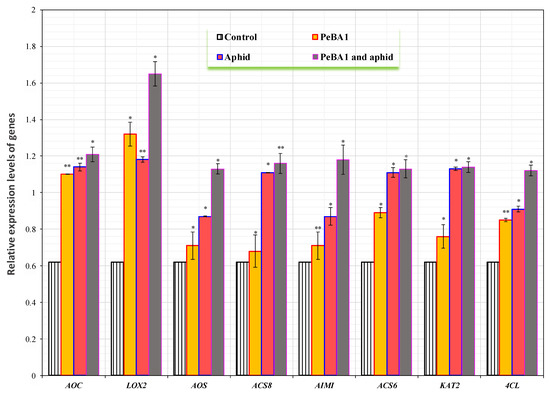
Figure 9.
The relative expressions of plant defense from JA, SA, and ET pathway genes found after treatment with PeBA1-elicitor, PeBA1 and aphid, and aphid infestation. For each gene, an asterisk on the bar shows a significant difference from the buffer control as found by students t-test (* p < 0.05 and ** p < 0.01).
Table 3.
Log2 of fold change expressions all test genes involved in the JA, SA, and ET pathways after PeBA1 elicitor application, PeBA1 and aphid, and aphid infestation alone.
4. Discussion
Elicitors, which are microbial proteins that play a dynamic role in the defense and signaling systems of plants under attack by sap-feeding insects, are a new biological tool for the management of insect pests [22,23,24,25,26,27]. Brassica rapa management was proven in this investigation using PeBA1, an emerging protein elicitor evaluated from B. amyloliquefaciens NC6, which was shown to have biocontrol potential and antimicrobial activity. Several plant defenses, including chemical elicitors such as methyl-jasmonate and benzothiadiazole, and other plant defenses such as proteinase inhibitors, have been demonstrated to considerably reduce the activity of herbivorous pests in B. rapa crops in prior research [41,42]. This study’s findings are consistent with existing findings indicating that the use of a methyl salicylate elicitor reduced the population of Aphis glycines by up to 40% as compared with when no elicitor was used [41,42]. Brassica rapa plants treated with PeBA1 exhibited a much slower population expansion as compared with the controls, according to the bioassays. Exogenous applications of elicitors, such as MJ, JA, and BTH, have been shown to negatively impact the population growth and fitness of different aphid species [41,42] which was corroborated by the findings of the current investigation. In the present experimental study, it was discovered that PeBA1 could inhibit herbivores by changing the physical characteristics of plants. The formation of trichomes is the first step in developing physical resistance to pathogenic microorganisms and herbivores [43]. In soybeans with thick trichomes, Leptinotarsa decemlineata settlement was reduced when compared with soybeans with thin trichomes, which attracted more insects [44]. PeBA1 alleviated disease severity by commencing a photosynthetic process resembling plant development characteristics [45], and it also enhanced the induced resistance in PeBA1-treated B. rapa seedlings.
The trichomes on the seedlings and leaves of the PeBA1-treated plants were more numerous than in the controls. Another important component of the physical barrier is lignin in the cell wall, which is responsible for plant resilience and serves as a measure of progress in cell wall development [46,47]. In reaction to biotic and abiotic stress, plants’ physical defenses include the establishment of trichomes and the production of wax [48,49,50]. The accumulation of SA and JA in PeBA1-treated B. rapa plants can be hypothesized to be related to increased trichome density and the deposition of cuticular wax. The PeBA1-treated plants produced considerably fewer aphids than the control. The findings were similar to previous research, which found that exogenous SA and MJ reduced aphids’ mean lifetime fecundity by about 50% [41,50]. As a result, optimum temperatures, 22 °C, indicated the highest aphid fecundity, with the lowest fecundity observed at higher temperatures (26 °C), which was attributed to a lower metabolic rate [51]. Likewise, PeBA1-treated plants had a longer nymphal development time than the controls; even at a lower temperature (22 °C), the maximum nymphal development time was observed, indicating that a one-degree temperature increase affected the insects’ life cycle [52].
Jasmonates, i.e., JA, isoleucine conjugate JA (JA-Ile), and methyl ester JA (MeJA), transiently accumulate in the wound site and act as signaling molecules for the systemic defense response. AOC, coding an allene oxide cyclase, reduced the feeding activity and survival rate by enhanced crop resistance. ACS2, ACS8, and AC6 are the rate-limiting enzymes that control ET production in response to pathogen assault. 4CL, coding for a 4-coumarate–CoA ligase family protein, is involved in the construction of the cell wall, as shown in Arabidopsis. KAT2 codes a 3-ketoacyl-CoA thiolase, carrying out wound-activated responses, as shown in the biosynthesis of JA in wounded Arabidopsis plants. Brassica rapa developed resistance to B. brassicae after exposure to PeBA1. The relative expression levels of test genes between controls and experimental samples less than 2-fold differences address the non-significant differences to elicit any physiological response. These relative expression levels address the systematic defense responses through variation in experimental conditions or other intrinsic factors which are the potential factors in performing qRT-PCR and yielding non-significant differences between relative expression levels. The potential factors can depend on experimental conditions, such as independent experimental procedures, corresponding differences in protein levels, variation in sample sizes, laboratory’s environmental factors, etc. Hence, both genetic and intercellular intrinsic factors such as plant growth regulators, etc., can play the role of potential factors in yielding non-significant differences. Beneficial microorganisms elicit systemic defense responses that are regulated by a signaling network which includes the plant hormones SA, JA, and ET [53]. Some evidence has demonstrated SA, JA, and ET pathways crosstalk, which adjusts the plant systematic defense response depending on different pathogens [53]. These plant defense pathways are involved in signal transduction and gene regulation, resulting in a more effective plant systematic defensive response against insect pests [54]. In this study, we have demonstrated that PeBA1 slightly increases the relative expression levels of several JA-, SA- and ET-responsive genes [55]. These findings suggest that slight increases in relative expression levels of all test genes, i.e., LOX2, followed by AOC, AIMI, ACS8, KAT2, AOS, ACS6, and 4CL act, as potential factors engaged only in the systemic defense responses generated by PeBA1 in B. rapa. Additionally, the findings of this study corroborate prior work by Chaerle [56]; the elicitor can stimulate phenolic metabolism and lignin synthesis which can strengthen the cell wall and thus protect it from pathogenic bacteria or fungi [57]. Aphids feeding on plants triggers systemic defense responses [58]. These findings suggest that our work furthers the understanding of the mechanisms behind PeBA1 evaluated from B. amyloliquefaciens NC6-induced systemic resistance in B. rapa [59].
5. Conclusions
PeBA1 enhanced aphid resistance in B. rapa, reducing second- and third-generation B. brassicae fecundity and aphid colonization. The resistance characteristics were largely discovered in mechanical defenses confirmed by EPG. PeBA1 affected the surface structures of B. rapa leaves. SA, JA, and ET exhibited slight increases in relative expression levels, acting potential factors engaged in systemic defense responses generated by PeBA1 in B. rapa.
Furthermore, PeBA1 exhibited a significant suppression of B. brassicae life characteristics in the laboratory; however, more research is required to maximize its effects in the field. Future research should explore whether the wax composition affects aphid behavior, how SA and JA work in induced resistance, and whether other plant hormones are involved. We are convinced that PeBA1 could be used as a “vaccine” for B. rapa seeds and seedlings to protect them from B. brassicae.
Author Contributions
K.J. designed and carried out the experiments, wrote and drafted the paper, and analyzed the results. H.J., T.H., A.H., M.I. and Y.W. assisted with data curation management. Y.W. supervised the entire experiment and helped in the revision of the paper. All authors have read and agreed to the published version of the manuscript.
Funding
Guizhou science: technology department of international cooperation-based project ((2018) 5806), program of introducing the talent of discipline to the universities of China (111 programs, D20023), and the project of Guizhou provincial department of education (202100).
Institutional Review Board Statement
Not applicable.
Informed Consent Statement
Not applicable.
Data Availability Statement
The required data set is already available in manuscript file; other data sets generated during the study are available upon request from corresponding author.
Conflicts of Interest
The authors declare no conflict of interest.
References
- Cui, H.; Xiang, T.; Zhou, J.M. Plant immunity: A lesson from pathogenic bacterial effector proteins. Cell. Microbiol. 2009, 11, 1453–1461. [Google Scholar] [CrossRef] [PubMed]
- Nürnberger, T.; Brunner, F. Innate immunity in plants and animals: Emerging parallels between the recognition of general elicitors and pathogen-associated molecular patterns. Curr. Opin. Plant Biol. 2002, 5, 318–324. [Google Scholar] [CrossRef]
- Thomma, B.P.H.J.; Nu, T.; Joosten, M.H.A.J. Of PAMPs and Effectors: The Blurred PTI-ETI Dichotomy. Plant Cell 2011, 23, 4–15. [Google Scholar] [CrossRef] [PubMed] [Green Version]
- Jones, J.D.G.; Dang, J.L. HEPL a NT Imm UNESYST. Nature 2006, 444, 323–329. [Google Scholar] [CrossRef] [PubMed] [Green Version]
- Garcia-Brugger, A.; Lamotte, O.; Vandelle, E.; Bourque, S.; Lecourieux, D.; Poinssot, B.; Wendehenne, D.; Pugin, A. Early signaling events induced by elicitors of plant defenses. Mol. Plant-Microbe Interact. 2006, 19, 711–724. [Google Scholar] [CrossRef] [PubMed] [Green Version]
- Yano, A.; Suzuki, K.; Uchimiya, H.; Shinshi, H. Induction of hypersensitive cell death by a fungal protein in cultures of tobacco cells. Mol. Plant-Microbe Interact. 1998, 11, 115–123. [Google Scholar] [CrossRef] [Green Version]
- Jakobs, R.; Schweiger, R.; Müller, C. Aphid infestation leads to plant part-specific changes in phloem sap chemistry, which may indicate niche construction. New Phytol. 2019, 221, 503–514. [Google Scholar] [CrossRef] [PubMed] [Green Version]
- De Vos, M.; Jander, G. Myzus persicae (green peach aphid) salivary components induce defence responses in Arabidopsis thaliana. Plant Cell Environ. 2009, 32, 1548–1560. [Google Scholar] [CrossRef]
- Saad, K.A.; Mohamad Roff, M.N.; Hallett, R.H.; Idris, A.B. Aphid-induced Defences in Chilli Affect Preferences of the Whitefly, Bemisia tabaci (Hemiptera: Aleyrodidae). Sci. Rep. 2015, 5, 13697. [Google Scholar] [CrossRef] [Green Version]
- Nouri-Ganbalani, G.; Borzoui, E.; Shahnavazi, M.; Nouri, A. Induction of resistance against Plutella xylostella (L.) (Lep.: Plutellidae) by jasmonic acid and mealy cabbage aphid feeding in Brassica napus L. Front. Physiol. 2018, 9, 859. [Google Scholar] [CrossRef]
- Salzman, R.A.; Brady, J.A.; Finlayson, S.A.; Buchanan, C.D.; Summer, E.J.; Sun, F.; Klein, P.E.; Klein, R.R.; Pratt, L.H.; Cordonnier-Pratt, M.M.; et al. Transcriptional profiling of sorghum induced by methyl jasmonate, salicylic acid, and aminocyclopropane carboxylic acid reveals cooperative regulation and novel gene responses. Plant Physiol. 2005, 138, 352–368. [Google Scholar] [CrossRef] [PubMed] [Green Version]
- Lazebnik, J.; Frago, E.; Dicke, M.; van Loon, J.J.A. Phytohormone Mediation of Interactions Between Herbivores and Plant Pathogens. J. Chem. Ecol. 2014, 40, 730–741. [Google Scholar] [CrossRef] [PubMed]
- Ali, J.G.; Agrawal, A.A. Asymmetry of plant-mediated interactions between specialist aphids and caterpillars on two milkweeds. Funct. Ecol. 2014, 28, 1404–1412. [Google Scholar] [CrossRef]
- Sandoya, G.V.; de Oliveira Buanafina, M.M. Differential responses of Brachypodium distachyon genotypes to insect and fungal pathogens. Physiol. Mol. Plant Pathol. 2014, 85, 53–64. [Google Scholar] [CrossRef]
- Zhao, J.; Davis, L.C.; Verpoorte, R. Elicitor signal transduction leading to production of plant secondary metabolites. Biotechnol. Adv. 2005, 23, 283–333. [Google Scholar] [CrossRef] [PubMed]
- Zhao, L.Y.; Chen, J.L.; Cheng, D.F.; Sun, J.R.; Liu, Y.; Tian, Z. Biochemical and molecular characterizations of Sitobion avenae-induced wheat defense responses. Crop Prot. 2009, 28, 435–442. [Google Scholar] [CrossRef]
- Ellis, J.G.; Rafiqi, M.; Gan, P.; Chakrabarti, A.; Dodds, P.N. Recent progress in discovery and functional analysis of effector proteins of fungal and oomycete plant pathogens. Curr. Opin. Plant Biol. 2009, 12, 399–405. [Google Scholar] [CrossRef]
- Bent, A.F.; Mackey, D. Elicitors, effectors, and R genes: The new paradigm and a lifetime supply of questions. Annu. Rev. Phytopathol. 2008, 45, 399–436. [Google Scholar] [CrossRef] [Green Version]
- Foyer, C.H.; Noctor, G. Oxidant and antioxidant signalling in plants: A re-evaluation of the concept of oxidative stress in a physiological context. Plant Cell Environ. 2005, 28, 1056–1071. [Google Scholar] [CrossRef]
- Montesano, M.; Brader, G.; Palva, E.T. Pathogen derived elicitors: Searching for receptors in plants. Mol. Plant Pathol. 2003, 4, 73–79. [Google Scholar] [CrossRef]
- Hael-Conrad, V.; Perato, S.M.; Arias, M.E.; Martínez-Zamora, M.G.; Di Peto, P.D.L.Á.; Martos, G.G.; Castagnaro, A.P.; Díaz-Ricci, J.C.; Chalfoun, N.R. The elicitor protein AsES induces a systemic acquired resistance response accompanied by systemic microbursts and micro-hypersensitive responses in Fragaria ananassa. Mol. Plant-Microbe Interact. 2018, 31, 46–60. [Google Scholar] [CrossRef] [PubMed] [Green Version]
- Javed, K.; Javed, H.; Mukhtar, T.; Qiu, D. Pathogenicity of some entomopathogenic fungal strains to green peach aphid, Myzus persicae Sulzer (Homoptera: Aphididae). Egypt. J. Biol. Pest Control. 2019, 29, 92. [Google Scholar] [CrossRef]
- Javed, K.; Qiu, D. Protein Elicitor PeBL1 of Brevibacillus laterosporus Enhances Resistance Against Myzus persicae in Tomato. Pathogens 2020, 9, 57. [Google Scholar] [CrossRef] [Green Version]
- Javed, K.; Javed, H.; Mukhtar, T.; Qiu, D. Efficacy of Beauveria bassiana and Verticillium lecanii for the management of whitefly and aphid. Pak. J. Agric. Sci. 2019, 56, 669–674. [Google Scholar] [CrossRef]
- Javed, K.; Javed, H.; Qiu, D. Biocontrol Potential of Purified Elicitor Protein PeBL1 Extracted from Brevibacillus laterosporus Strain A60 and Its Capacity in the Induction of Defense Process against Cucumber Aphid (Myzus persicae) in Cucumber (Cucumis sativus). Biology 2020, 9, 179. [Google Scholar] [CrossRef] [PubMed]
- Javed, K.; Javed, H.; Qiu, D. PeBL1 of Brevibacillus laterosporus a new biocontrol tool for wheat aphid management (Sitobion avenae) in triticum aestivum. Int. J. Trop. Insect Sci. 2021, 42, 535–544. [Google Scholar] [CrossRef]
- Javed, K.; Talha, H.; Ayesha, H.; Wang, Y.; Javed, H. PeaT1 and PeBC1 Microbial Protein Elicitors Enhanced Resistance against Myzus persicae Sulzer in Chili (Capsicum annum) L. Microorganisms 2021, 9, 2197. [Google Scholar] [CrossRef]
- Huang, C.J.; Tsay, J.F.; Chang, S.Y.; Yang, H.P.; Wu, W.S.; Chen, C.Y. Dimethyl disulfide is an induced systemic resistance elicitor produced by Bacillus cereus C1L. Pest Manag. Sci. 2012, 68, 1306–1310. [Google Scholar] [CrossRef] [PubMed]
- Niu, D.; Liu, H.; Jiang, C.; Wang, Y.; Wang, Q.; Jin, H.; Guo, J. The Plant Growth—Promoting Rhizobacterium Bacillus cereus AR156 Induces Systemic Resistance in Arabidopsis thaliana by Simultaneously Activating Salicylate- and Jasmonate / Ethylene-Dependent Signaling Pathways. Mol. Plant Microbe Interact. 2011, 24, 533–542. [Google Scholar] [CrossRef] [Green Version]
- Kloepper, J.W.; Ryu, C.; Zhang, S. Induced Systemic Resistance and Promotion of Plant Growth by Bacillus spp. Phytopathology 2004, 94, 1259–1266. [Google Scholar] [CrossRef] [Green Version]
- Ryu, C.M.; Farag, M.A.; Hu, C.H.; Reddy, M.S.; Kloepper, J.W.; Paré, P.W. Bacterial volatiles induce systemic resistance in Arabidopsis. Plant Physiol. 2004, 134, 1017–1026. [Google Scholar] [CrossRef] [PubMed] [Green Version]
- Ongena, M.; Jourdan, E.; Adam, A.; Paquot, M.; Brans, A.; Joris, B.; Arpigny, J.L.; Thonart, P. Surfactin and fengycin lipopeptides of Bacillus subtilis as elicitors of induced systemic resistance in plants. Environ. Microbiol. 2007, 9, 1084–1090. [Google Scholar] [CrossRef] [PubMed]
- Wang, N.; Liu, M.; Guo, L.; Yang, X.; Qiu, D. A Novel Protein Elicitor (PeBA1) from Bacillus amyloliquefaciens NC6 Induces Systemic Resistance in Tobacco. Int. J. Biol. Sci. 2016, 12, 757–767. [Google Scholar] [CrossRef] [Green Version]
- Wang, H.; Yang, X.; Guo, L.; Zeng, H.; Qiu, D. PeBL1, a novel protein elicitor from Brevibacillus laterosporus strain A60, activates defense responses and systemic resistance in Nicotiana benthamiana. Appl. Environ. Microbiol. 2015, 81, 2706–2716. [Google Scholar] [CrossRef] [Green Version]
- Sarria, E.; Cid, M.; Garzo, E.; Fereres, A. Excel Workbook for automatic parameter calculation of EPG data. Comput. Electron. Agric. 2009, 67, 35–42. [Google Scholar] [CrossRef]
- Li, Y.H.; Wei, F.; Dong, X.Y.; Peng, J.H.; Liu, S.Y.; Chen, H. Simultaneous analysis of multiple endogenous plant hormones in leaf tissue of oilseed rape by solid-phase extraction coupled with high-performance liquid chromatography-electrospray ionisation tandem mass spectrometry. Phytochem. Anal. 2011, 22, 442–449. [Google Scholar] [CrossRef]
- Jarošová, J.; Kundu, J.K. Validation of reference genes as internal control for studying viral infections in cereals by quantitative real-time RT-PCR. BMC Plant Biol. 2010, 10, 146. [Google Scholar] [CrossRef] [PubMed] [Green Version]
- Livak, K.J.; Schmittgen, T.D. Analysis of relative gene expression data using real-time quantitative PCR and the 2−ΔΔCT method. Methods 2001, 25, 402–408. [Google Scholar] [CrossRef]
- Alvarez, A.E.; Tjallingii, W.F.; Garzo, E.; Vleeshouwers, V.; Dicke, M.; Vosman, B. Location of resistance factors in the leaves of potato and wild tuber-bearing Solanum species to the aphid Myzus persicae. Entomol. Exp. Appl. 2006, 121, 145–157. [Google Scholar] [CrossRef]
- Garzo, E.; Soria, C.; Gomez-Guillamon, M.L.; Fereres, A. Feeding behavior of Aphis gossypii on resistant accessions of different melon genotypes (Cucumis melo). Phytoparasitica 2002, 30, 129–140. [Google Scholar] [CrossRef]
- Boughton, A.J.; Hoover, K.; Felton, G.W. Impact of chemical elicitor applications on greenhouse tomato plants and population growth of the green peach aphid, Myzus persicae. Entomol. Exp. Appl. 2006, 120, 175–188. [Google Scholar] [CrossRef]
- Mallinger, R.E.; Hogg, D.B.; Gratton, C. Methyl Salicylate Attracts Natural Enemies and Reduces Populations of Soybean Aphids (Hemiptera: Aphididae) in Soybean Agroecosystems. J. Econ. Entomol. 2011, 104, 115–124. [Google Scholar] [CrossRef] [PubMed]
- Schaller, F.; Schaller, A.; Stintzi, A. Biosynthesis and metabolism of jasmonates. J. Plant Growth Regul. 2004, 23, 179–199. [Google Scholar] [CrossRef]
- Glas, J.J.; Schimmel, B.C.J.; Alba, J.M.; Escobar-Bravo, R.; Schuurink, R.C.; Kant, M.R. Plant glandular trichomes as targets for breeding or engineering of resistance to herbivores. Int. J. Mol. Sci. 2012, 13, 17077–17103. [Google Scholar] [CrossRef] [Green Version]
- Shenashen, M.; Derbalah, A.; Hamza, A.; Mohamed, A.; El Safty, S. Antifungal activity of fabricated mesoporous alumina nanoparticles against root rot disease of tomato caused by Fusarium oxysporium. Pest Manag. Sci. 2017, 73, 1121–1126. [Google Scholar] [CrossRef]
- Tian, D.; Tooker, J.; Peiffer, M.; Chung, S.H.; Felton, G.W. Role of trichomes in defense against herbivores: Comparison of herbivore response to woolly and hairless trichome mutants in tomato (Solanum lycopersicum). Planta 2012, 236, 1053–1066. [Google Scholar] [CrossRef]
- Wang, Y.; Sheng, L.; Zhang, H.; Du, X.; An, C.; Xia, X.; Chen, F.; Jiang, J.; Chen, S. CmMYB19 over-expression improves aphid tolerance in chrysanthemum by promoting lignin synthesis. Int. J. Mol. Sci. 2017, 18, 619. [Google Scholar] [CrossRef] [Green Version]
- Tozin, L.R.D.S.; Marques, M.O.M.; Rodrigues, T.M. Herbivory by leaf-cutter ants changes the glandular trichomes density and the volatile components in an aromatic plant model. AoB Plants 2017, 9, plx057. [Google Scholar] [CrossRef] [Green Version]
- Boughton, A.J.; Hoover, K.; Felton, G.W. Methyl jasmonate application induces increased densities of glandular trichomes on tomato, Lycopersicon esculentum. J. Chem. Ecol. 2005, 31, 2211–2216. [Google Scholar] [CrossRef]
- Ni, Y.; Wang, J.; Song, C.; Xia, R.-E.; Sun, Z.-Y.; Guo, Y.-J.; Li, J.-N. Effects of SA Induction on Leaf Cuticular Wax and Resistance to Sclerotinia sclerotiorurn in Brassica napus. Acta Agron. Sin. 2013, 39, 110. [Google Scholar] [CrossRef]
- Farmer, E.E.; Johnson, R.R.; Ryan, C.A. Regulation of expression of proteinase inhibitor genes by methyl jasmonate and jasmonic acid. Plant Physiol. 1992, 98, 995–1002. [Google Scholar] [CrossRef] [PubMed] [Green Version]
- Mahmoud, F.; Mahfouz, H. Effects of salicylic acid elicitor against aphids on wheat and detection of infestation using infrared thermal imaging technique in Ismailia, Egypt. Pestic. Fitomed. 2015, 30, 91–97. [Google Scholar] [CrossRef]
- Hammond-Kosack, K.E.; Parker, J.E. Deciphering plant-pathogen communication: Fresh perspectives for molecular resistance breeding. Curr. Opin. Biotechnol. 2003, 14, 177–193. [Google Scholar] [CrossRef]
- Thaler, J.S.; Humphrey, P.T.; Whiteman, N.K. Evolution of jasmonate and salicylate signal crosstalk. Trends Plant Sci. 2012, 17, 260–270. [Google Scholar] [CrossRef]
- Kim, H.S.; Delaney, T.P. Over-expression of TGA5, which encodes a bZIP transcription factor that interacts with NIM1/NPR1, confers SAR-independent resistance in Arabidopsis thaliana to Peronospora parasitica. Plant J. 2002, 32, 151–163. [Google Scholar] [CrossRef] [Green Version]
- Chaerle, L.; Lenk, S.; Hagenbeek, D.; Buschmann, C.; Van Der Straeten, D. Multicolor fluorescence imaging for early detection of the hypersensitive reaction to tobacco mosaic virus. J. Plant Physiol. 2007, 164, 253–262. [Google Scholar] [CrossRef] [PubMed]
- Nicholson, R.L.; Hammerschmidt, R. Phenolic compounds and their role in disease resistance. Annu. Rev. Phytopathol. 1992, 30, 369–389. [Google Scholar] [CrossRef]
- De Vos, M.; Van Oosten, V.R.; Van Poecke, R.M.P.; Van Pelt, J.A.; Pozo, M.J.; Mueller, M.J.; Buchala, A.J.; Métraux, J.P.; Van Loon, L.C.; Dicke, M.; et al. Signal signature and transcriptome changes of Arabidopsis during pathogen and insect attack. Mol. Plant-Microbe Interact. 2005, 18, 923–937. [Google Scholar] [CrossRef] [Green Version]
- Ali, J.G.; Agrawal, A.A. Specialist versus generalist insect herbivores and plant defense. Trends Plant Sci. 2012, 17, 293–302. [Google Scholar] [CrossRef]
Publisher’s Note: MDPI stays neutral with regard to jurisdictional claims in published maps and institutional affiliations. |
© 2022 by the authors. Licensee MDPI, Basel, Switzerland. This article is an open access article distributed under the terms and conditions of the Creative Commons Attribution (CC BY) license (https://creativecommons.org/licenses/by/4.0/).