Abstract
The ever-growing number of biogas plants also leads to an increasing demand for suitable, alternative plant substrates. A currently dominant plant substrate is maize silage. However, intensive cultivation of maize (Zea mays L.) as an energy crop in monocultures poses risk to the environment (soil erosion, depletion of soil nutrient supplies, increased concentration of pests—Ostrinia nubilalis). In this study, results of experimental methane production from silages of alternative substrates, such as fodder mallow (Malva verticillata var. crispa L.; FM), white sweet clover (Melilotus albus Medik.; WSC) and their mixture, are presented. Based on the dry matter yield of a mixed culture of mallow and sweet clover, the value of the land equivalent ratio parameter (LER) was set as 1.05. The obtained LER (>1) value shows that the cultivation of the two tested crops in the mixed culture is more beneficial than their monocultures. Methane production from all three silage variants was fully comparable with results of methane production from the maize silage. Anaerobic fermentation of the mixture of FM and WSC did not result in higher methane yield than the average result of monosubstrates.
1. Introduction
There is a growing global awareness of the need for renewable energy and energy efficiency to create new economic opportunities and curb pollution. Anaerobic digestion technology is a biochemical process of biogas production that can convert complex organic matter into a clean and renewable energy source in the form of biogas [1].
The increasing number of biogas plants (BP) creates pressure on the production of suitable input raw materials. Fermenters, where the process of anaerobic digestion takes place, can be compared to the digestive tract of ruminants, where input substrates are gradually processed by microorganisms into the resulting product—biogas—the main energy component of which is methane. This biological process is sensitive to the conditions under which it takes place, namely, temperature and pH [2]. Therefore, inappropriate input raw materials and unsuitable fermentation conditions can lead to the reduced production of biogas or even terminate the fermentation processes [3].
An analysis of the input feedstock composition from fifty biogas plants in the Czech Republic showed that the dominant plant material, at present, is maize silage [4]. The situation is similar in other countries, where silage represents more than three quarters of the biogas plant feedstock [5]. Silage from maize is considered the most suitable for biogas production. Intensive cultivation of maize as an energy crop in monocultures poses environmental risks such as erosion of arable land and increasing applications of mineral fertilizers and pesticides. Therefore, it is necessary to look for new crops to be used in biogas plants, which would potentially have a less adverse environmental impact [6,7]. If proper agricultural practices are not followed, intensive maize cultivation may lead to a number of negative environmental impacts, such as loss of biodiversity [8], soil erosion and leaching of reactive nitrogen into water sources [9,10,11].
According to Stinner et al. [12], biogas production offers new opportunities for the use of legumes (Fabaceae). This could be an impetus to include legumes more frequently in crop rotation [12]. The quality requirements of legumes for biogas production are not as high as for their other uses. The positive effect of legumes on soil and on subsequent crops is well known [13]. Therefore, they should be included in crop rotations to improve soil fertility and sustainability of agricultural systems [14,15]. Higher N content in the biomass of legumes may pose some limitation as it could cause inhibition of the anaerobic process [16]. According to Hutňan et al. [17], the process of anaerobic digestion is unstable at low N content in maize silage, and they recommend the addition of a substrate with higher nitrogen content for stabilization. This is exactly the requirement that can be met by adding legumes. Ofori and Stern [18] state that mixed cropping of maize and legumes is one of the most common and effective combinations to use natural resources. The system of combining maize and legumes is considered to be an alternative to systems without legumes, saving nitrogen, increasing the production of maize biomass and achieving higher productivity per unit of time and space [19].
One of the alternative legumes for biogas production is white sweet clover (WSC), which is mainly used as a fodder crop, a soil-improving crop on less fertile soils and a green manure crop [20]. Although the plant was originally biennial, some annual varieties have also been bred. It also grows in soils poor in organic matter, is tolerant to drought and prefers sunny sites. The plant contains a large amount of coumarin, of which its crushed stems, leaves and, especially, flowers smell [21]. Coumarin content in white sweet clover can be an important factor [22] when WSC is used to produce biogas; coumarin negatively affects the microbial activity in the fermenter of the biogas plant. Inhibition of anaerobic process was reported with feedstock rich in coumarin [23]. It was reported, that coumarin concentrations between 0.25 and 1 g/L caused inhibition of methanogens, as well as syntrophic propionate- and butyrate-degrading cultures. An appropriate dosage of silage made from white sweet clover can support the biogas production [24].
Another energy crop is fodder mallow The plant originates from East Asia; it was formerly cultivated in China and Egypt but is also grown in Germany and Russia. It is a tall, strongly branched, squat plant that is used as an energy crop thanks to its tall build. The cultivation of fodder mallow for energy production does not require any special technology or mechanization.
Research into the process of anaerobic co-digestion (AcoD) is receiving a lot of attention in the field of biogas production and is widely used. AcoD is a reliable alternative that overcomes the disadvantages of monosubstrate digestion, which are related to the characteristics of the substrate and system optimization [1]. The technology of mixed cropping and substrates is an environmental alternative to the monoculture substrates that are predominantly used. It can also help increase the diversity of crop rotation and develop alternative technologies for maize cultivation, for example, in mixed culture [20,21,22,23,24].
The goal of this study was to test a hypothesis of the use of silage of alternative crops and their mixed culture for the production of biogas. The study also focused on confirming the hypothesis that a synergistic reaction occurs in the anaerobic digestion of silage from the mixed culture of legumes (white sweet clover and fodder mallow) and that the biogas/methane yield increases compared to the monoculture substrates of these crops. The reason for this was that the most frequently tested of mixed cultures is that of legumes and maize, while the use of non-legumes is tested only exceptionally (alone or in combination with other crops). For this reason, (i) representatives from the Malvaceae and Fabaceae families were tested separately, as well as (ii) their combinations in the mixed culture, with regard to biogas production.
2. Materials and Methods
2.1. Field Experiment Localization
The experimental plot (Figure A1) is located not far from the Agricultural Research Institute research station in Troubsko (49.1709261° N, 16.4916056° E). In 2018, winter wheat was grown as a preceding crop on the plot. The trial was established in 2019. According to the agro-ecological classification, the plot is located in the region typical for the cultivation of root crops (e.g., sugar beet) in the mildly warm and mildly dry climatic zone at an altitude of 290 m a.s.l. with a mean annual temperature of 8.95 °C and a long-term total annual precipitation of 525.6 mm (the values correspond to the climatic normal of 1981–2010). The geological bedrock is loess and loess loam of the Bohemian Massif. The soil type is Haplic Luvisol. Basic information about the characteristics of arable land on the experimental plot can be found in Table 1. The meteorological and climatological parameters are shown in Figure A2.

Table 1.
Characteristics of arable soil from the experimental plot, average contents of available plant nutrients.
2.2. Production of Plant Biomass for Silage Preparation
Two crops (Malva verticillata L. and Melilotus albus Medik.) were cultivated either as a monoculture or as a mixed culture to produce shreddings for preparing silage for the biogas plant. Individual variants were grown in a randomized complete block design (8 × 1.5 m), each in triplicate. The arrangement of experimental variants is shown in Figure 1. Before sowing, mixed NPK (10:26:26) fertilizer was applied (HOKR, spol. s r.o., Czech Republic) at 300 kg/ha. The sowing was carried out by Oyord non-residual seeder. The experimental growths were treated with TARGA SUPER 5 EC post-emergence graminicide (NISSAN Chemical Industries Ltd., Tokyo, Japan) at 0.7 l/ha.
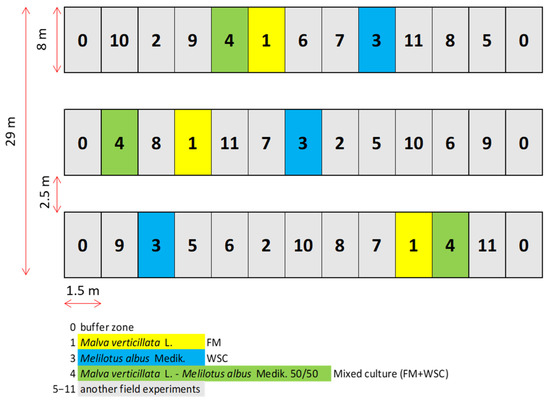
Figure 1.
Organization of the field experiment. Field trial with 9 plots of FM (No. 1), WSC (No. 3) and FM + WSC (No. 4) of a size 8 × 1.5 m each.
The stands of respective crops were established as follows:
- (1)
- Sole crop—fodder mallow (FM). The crop was sown in rows of 0.125 m at a depth of 0.02 m at a rate of 23.0 kg/ha, i.e., 9.20 million individuals/ha. The sowing rate was based on Zielewicz and Wróbel [25].
- (2)
- Sole crop—white sweet clover (WSC). The crop was sown at a rate of 12.0 kg/ha, i.e., 5.85 million individuals/ha. The sowing rate was based on Rigal et al. [26].
- (3)
- Mixed culture—fodder mallow + white sweet clover (FM + WSC). The FM and WSC combination at a sowing ratio of 50:50 was sown on the same date at the following rates: FM 11.5 kg/ha, i.e., 4.60 million individuals/ha; WSC 6.0 kg/ha, i.e., 2.93 million individuals/ha.
2.3. Production of Mixed Culture Silage—Preparation of Model Silage
The plant biomass was harvested in the growth stage of butonization before the beginning of flowering (BBCH 51–61) and then shredded (size 15–20 mm) using the Deutz-Fahr MH 650 S (Deutz-Fahr, Lauingen, Germany) cutter. The chopped material was used to prepare model microsilages [24,26]. There were 3 variants of experimental silage, each in triplicate. Two variants were prepared from the sole FM and WSC crops. The third variant was prepared directly from the harvested biomass of the mixed FM and WSC culture, which was sown in a 50:50 ratio (Table 2).

Table 2.
Prepared model silages.
The method of microsilage production was identical for all three variants: 8 kg of chopped material was placed in a mini silo (container with a diameter of 150 mm and a height of 1000 mm), together with the inoculant for each silo (Silo Solve EF, Chr. Hansen Holding Ltd., Starovice, Czech Republic), dosed at 5 g + 3.5 l H2O/t. This inoculant contained the following bacteria: Lactococcus lactis, Lactobacillus plantarum, Lactococcus lactis, Lactobacillus plantarum and Enterococcus faecium. The final concentration of these microorganisms was 250 CFU × 103/g in fresh chop at the above dose (5 g + 3.5 l H2O/t). The mixed culture, i.e., the above-mentioned ratio of FM + WSC (50:50), was grown directly in the field trial. The shreddings were not just a mixture of individually grown crops. The prepared plant material was compacted in the mini silos using a pneumatic press (6000 N/m2). Then, the mini silos were hermetically sealed and stored in the dark at 28 °C for 90 days to avoid exposure to light. The compaction of the chopped material in the mini silos ranged from 112.2 to 164.7 kgTS/m3 (Table 2).
The mini silos were equipped with safety valves to exhaust gases produced during fermentation. After incubation, the silage was frozen and transported to the laboratory for analyses and fermentation tests.
2.4. Silage Characteristics
Individual silage samples were frozen (−20 °C) immediately after opening the mini silos. Prior to fermentation tests, the silage samples were defrosted at a laboratory temperature (T = 19 °C). The contents of total solids (TS), volatile solids (VS) and residues after annealing (ASH) in the samples were determined gravimetrically—by drying in the LMH 07/12 electric oven (LAC, Czech Republic) at 105 °C ± 3.5 °C to constant weight and by annealing the dried samples at 550 °C ± 10 °C to constant weight according to ČSN EN 15,934 [27] and ČSN EN 15,169 [28]. The composition of silage water leachate was determined, and the corrected TS content was calculated as described in [29]. The corrected TS was used to determine the biogas/methane yield. N substances were determined using the Kjeldahl method. The protein content was determined using the KjeltecTM 2300 Analyzer (FOSS Analytical, Hillerød, Denmark) and then multiplied by empirical factor 6.25.
The fat content was determined gravimetrically using the water-cooled Soxhlet extractor by direct sample extraction with diethyl ether. The crude fiber (CF) content was determined by hydrolysis in two steps with sulfuric acid and potassium hydroxide, followed by ash content determination. Acid detergent fiber (ADF) content was determined using a solution of concentrated sulfuric acid and cetyltrimethylammonium bromide. Neutral detergent fiber (NDF) was determined using a solution of sodium sulfate lauryl and ethylenediaminetetraacetic acid. Analyses were performed using the ANKOM 200 fiber analyzer (ANKOM Technology, Macedon, NY, USA). Acid detergent lignin (ADL) was determined according to ISO 13,906 [30]. Water leachate analysis was performed as described above in [29]. Silage quality and the effect of coumarin content on the fermentation process were evaluated by determining the following parameters: DM, pH, lactic acid (LA), acetic acid (AA), LA/AA ratio, butyric acid (BA), ethanol (EE) and ammonia. The determination of coumarin concentration in silages was performed using a TraceTM 1310 gas chromatograph with split/splitless injector (Thermo Fisher Scientific Inc., Waltham, MA, USA). In addition, a ISQTM LT Single Quadrupole Mass Detector (Thermo Fisher Scientific Inc., USA) SPME fiber DVB/CAR/PDMS 50/30 μm (Supelco, Centre County, PA, USA) with standard Tr = 38.14 min was used. The determination was performed according to the methodology of Divišová et al. [31].
2.5. Biochemical Methane Potential Assay
BMP testing was performed in an automated system made specifically for this purpose. The system consisted of batch fermenters (working volume 5 l) placed in a heated water bath. The temperature of the water bath was controlled and kept constant by means of a thermostat. Each fermenter was equipped with its own connection for measuring biogas production and its composition (Figure 2). On the first day of the experiment, all fermenters were filled with 3 L of filtered inoculum. The inoculum came from the agricultural biogas plant in Cejc, Czech Republic. This agricultural biogas plant, which processes corn silage and pig manure (80/20, w/w%), is operated under mesophilic temperature conditions with a hydraulic retention time (HRT) of 80–90 days. Inoculum parameters were TS = 3.8 ± 0.03% and vs. = 72.58 ± 0.09%. Three fermenters in the system were used as blanks to determine the endogenous biogas yield of the inoculum. Each of the three silage samples shown in Table 2 was added to the fermenters in triplicate. The organic matter load was 2.5 g vs. of added substrate/liter of inoculum volume. The temperature during the test was 42 °C ± 0.1 °C. Biogas yield was measured daily using the liquid displacement method (according to VDI 4630); acidified, saturated NaCl solution was used as barrier solution. The volume of biogas produced was brought to standard temperature and pressure (273.15 K and 100 kPa). The biogas composition was analyzed using the Dräger X-am 5600 gas analyzer (Dräger, Lübeck, Germany). All tests were continued until the daily biogas production was less than 1% of the total biogas production for three consecutive days (VDI 4630) or a retention time 35 days was reached.
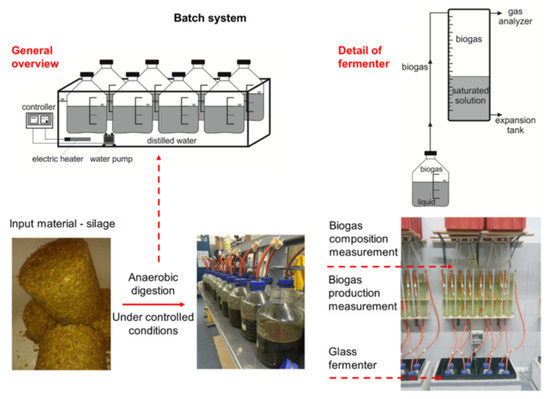
Figure 2.
Biochemical methane potential assay design [24].
2.6. Attainable Energy Yield Calculation and Evaluation of Plant Biomass Yield—Land Equivalent Ratio
Based on fresh biomass yields and methane yields in the fermentation tests, the energy yield from the digestion was calculated for each of the three silage samples. The energy yield is expressed in m3 per hectare.
The efficiency of growing biomass of some crops using the mixed cropping technique was measured using the method of land equivalent ratio (LER). LER is defined as the relative (land) area of single crops (SC) needed to produce yields (Y) obtained when growing a mixed culture (MC). It is a ratio between the yield of selected crops grown as a MC and the yield of those crops grown alone (SC). LER values were calculated according to Dariush et al. [32]:
- LER = LA + LB
- LA = YA,MC/YA,SC
- LB = YB,MC/YB,SC
where YA,MC and YA,SC are the yields of intercropped (MC) and sole fodder mallow plants (SC). Furthermore, YB,MC and YB,SC are the yields of intercropped (MC) and sole white sweet clover plants (SC).
2.7. Statistical Analysis—Data Treatment
All parameters of the experiment were measured in triplicate. Data were processed using the program Statistica 12 (Dell Software, Round Rock, TX, USA). Other procedures used to analyze the data were exploratory data analysis (EDA), one-way analysis of variance (ANOVA) and post hoc Tukey’s HSD test. The relations between the values of the measured parameters were analyzed using factor analysis (FA) and principal component analysis (PCA). All analyses were performed at a significance level of p < 0.05.
3. Results and Discussion
3.1. Fresh and Dry Matter Yields
The achieved yield parameters are presented in Table 3. The highest average yield of green matter was recorded in the monoculture of FM (37.1 t/ha). The lowest average yield of green matter was recorded in the monoculture of WSC (29.9 t/ha), which is a similar value as mentioned by Bozhanska et al. [33]. The yields of dry matter were exactly the opposite: the highest average yield of dry matter was recorded in the WSC monoculture (9.5 t/ha), which is 30% more than the yield reported by Bozhanska et al. [33] in their two-year experiment. The lowest yield of dry matter was recorded in the FM monoculture (8.1 t/ha). No statistically significant differences were found between the DM yields of all three variants. The percentage of dry matter ranged, on average, from 20.75% (FM) to 32.35% (WSC)—Table A1.

Table 3.
Yield parameters of two monocultures and one mixed culture of FM and WSC. Troubsko, 2019.
For the yield of dry matter in the FM + WSC mixed culture, the LER (land equivalent ratio) was defined as a parameter evaluating the advantages/disadvantages of growing the tested plants in a mixed culture compared with their cultivation as sole crops [34].
The average value was LER = 1.05. Based on this value, it is possible to state [35] that growing FM and WSC in a mixed culture was, in terms of DM yield, more advantageous than their cultivation in monocultures. Within the compared stands, the mixed culture exhibited a higher biomass production and LER > 1. It is generally acknowledged that the growing of two or more crops on the same plot at the same time often brings higher yields than the growing of sole crops [36]. According to Knudsen et al. [37], the detected LER value indicates a more efficient use of site conditions [35,36,37]. There is also a certain risk of competition between the individual crops, particularly if legumes are intercropped with maize [24]. Mixed cultures were demonstrated to have many potential advantages—the direct transfer of nitrogen from legumes to cereals or other components in the mixed culture increases productivity [38,39]. They are used to control weeds, insect pests and diseases [40], as well as to control soil erosion [41,42]. Growing crops in the system of mixed culture offers possibilities for improving the condition of soil environment. However, the total yield of crops can be problematic compared with monocultures [38,39,40,41,42]. In terms of the performed experiment, the system of mixed culture did not reach yields as high as the WSC variant in which the monoculture of white sweet clover was grown.
3.2. Qualitative Parameters of Silage
The quality of silage prepared in the respective variants was assessed based on the following parameters: content of total solids (TS), proteins, starch, lipids, neutral detergent fiber (NDF), acid detergent fiber (ADF), crude fiber (CF), acid detergent lignin (ADL) and ash (Figure 3).
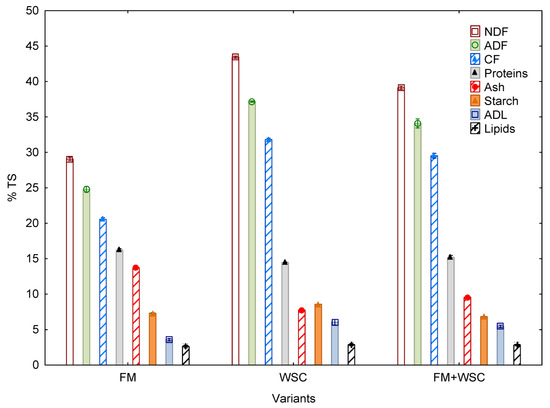
Figure 3.
Qualitative parameters of silage (% TS) (average values of all parameters (n = 3) for one parameter, ± SD). FM—fodder mallow, WSC—white sweet clover.
The above parameters were determined at the end of the ensiling process, i.e., when the silage containers were opened. The content of ash ranged, on average, from 7.76% (WSC) to 13.71% (FM). Statistically significant differences were also found between the ash contents of all three variants. It was relatively interesting that the content of ash in the FM + WSC variant significantly decreased compared with the variant in which FM was grown as a sole crop. Thus, growing this crop in a mixed culture may potentially lead to reduced contents of substances, negatively affecting the process of anaerobic digestion (AD). It was a relatively interesting finding that the mixed culture contained less starch and ash in the biomass. Contents of these substances in plants fluctuate in dependence on the plant species, age and organ of the plant [43]. Their concentration mostly ranges from 4% to 8% in the case of ash, while the content of starch is more variable. In fodder crops, for example, it reaches only a few percent in biomass while, in the case of pea, it is >40% and, in cereals, >60% and even more in the grain of the given commodities [44,45]. The effect of ash content on biogas yield is considerable because its presence in plant biomass (silage) intended for processing by anaerobic digestion reduces the methane production due to its low biodegradability [44]. In contrast, the content of starch in plant biomass positively correlates with the yield of biogas as it is a readily degradable substance [44,45] which is broken down by microorganisms in the fermenter most quickly, together with sugars [45].
A similar situation was recorded in parameters NDF and ADF too. In WSC, the concentration of these substances was significantly higher when WSC was grown as a sole crop. In the mixed culture, the substances were diluted. NDF content ranged, on average, from 29.06% (FM) to 43.43% (WSC). This value is within the range of results claimed for WSC dry matter by Bozhanska et al. [33]—33.6%—and for dry matter of experimental silage claimed by Kintl et al. [24]—48.7%. Statistically significant differences were recorded between all three variants in all three parameters related to the content of fiber in silage. Their values are comparable with the values recorded in maize.
Statistically significant differences were recorded between the content of ADL in the variants with WSC and WSC + FM, on the one hand, and FM on the other. The content of proteins as a percentage of dry matter ranged, on average, from 14.48% (WSC) to 16.23% (FM). Statistically significant differences were found between the content of proteins in the variants with WSC and WSC + FM, on the one hand, and FM on the other. In maize, the content of proteins is usually 50% lower than in these variants.
Compared with maize (23.73% and 33.30%), the content of starch was, relatively, very low in all three variants and ranged from 6.85% (FM + WSC) to 8.57% (WSC).
The lowest content of lipids was recorded in the FM silage (2.62%), and the highest content was in WSC (2.88%). There was no statistically significant difference between the variants.
Based on the measured values and their statistical evaluation, it can be stated that differences existed between the tested variants of silages in the following, monitored qualitative parameters: TS (%), ash, NDF, ADF, CF, ADL, proteins and starch.
The FM variant of silage contained the most ash and proteins and the least fiber and lignin. In contrast, the WSC variant of silage exhibited the highest contents of fiber (NDF, ADF, CF), starch and ADL. In the FM + WSC variant of silage, the values of other monitored parameters ranged (with one exception) between the values of the FM and WSC variants. Only the value of starch was the lowest of all three variants. Differences in the content of starch were statistically significant between all variants.
Although WSC belongs in the Fabaceae family, for which the higher content of proteins and nitrogen in the plants is typical thanks to the biological fixation capability of nitrogen [40], the highest content of proteins (16.2% TS) was recorded in the silage variant of FM, the species belonging to the Malvaceae family. The difference between these two variants was greater than 10% (1.75 percentage points) and was statistically significant. The content of proteins in the WSC silage variant was lower than that recorded in the FM + WSC silage variant (15.2% TS).
Similar differences between the FM and WSC silage variants were also found in the ash content. The difference was greater than 43% (5.95 percentage points) and was statistically significant.
These differences apparently also related to the group of parameters expressing the contents of various fiber and lignin types (NDF, ADF, CF, ADL), the content of which was the highest in the WSC variant. Compared with this variant, the content of NDF in the FM variant was 33% (14.37 percentage points) lower, similar to ADF (33% lower) and CF (35% lower). In the ADL parameter, the difference was almost 41% (2.46 percentage points). Kintl et al. [24] stated that the content of ADL in the WSC silage was around 14% TS, which is more than double the amount recorded in this experiment (6.05% TS).
The WSC variant exhibited the highest contents of starch and lipids. The starch content in this variant was 14.5% higher than in the FM variant and 20% higher than in the FM + WSC variant. Compared with results claimed by Kintl et al. [24] for WSC (4.51% TS), the content of starch in WSC in this experiment (8.57% TS) was 90% (4.06 percentage points) higher. The content of lipids in the WSC variant was almost 9% (0.62 percentage points) higher than in the FM variant. Graphical illustration of results from the qualitative analyses of the silage variants’ composition is presented in Figure 3, Table 4 shows significant differences between the individual variants.

Table 4.
Significant differences between the individual variants.
3.3. Leachate Analysis
The increase of coumarin concentration in silage was associated with a significant increase in dry matter (DM), ranging from 20.75 (FM-100 variant) to 32.35% (WSC-100). The pH value ranged from 4.15 to 4.20, and its increase was also associated with an increase of WSC content in the silage (Table 5).

Table 5.
Parameters of silage variants FM, WSC and their mixture.
These differences were statistically significant. Kara [46] reported a similar pH of 3.88 for biomass silage from a monoculture of the related species, yellow sweet clover (Melilotus officinalis L.), harvested during the early flowering stage, but the pH at the full flowering stage (4.25) already exceeded the declared optimal fermentation acidity. Kung et al. [47] reported a pH value generally in the range of 4.3–4.5 (DM < 30–35%) for legumes, which is slightly higher than the value measured in this experiment for the WSC-100 monosubstrate. The usual pH value for maize silage with DM 30–40% is 3.7–4.0.
In general, microorganisms that cause silage deterioration are expected to be inhibited more effectively at lower pH values than at the higher pH values closer to the optimal pH range for harmful microorganisms. However, no such correlation was observed between the silage pH and its aerobic stability [48]. In the past, silage with a pH greater than 4.2 was defined as poor-quality silage [49], but this was especially true before the widespread production of silages with high DM, which are stable even at relatively high pH values. Although the pH value remains one of the useful indicators of satisfactory fermentation for low DM silages, it is not a good indicator for high DM silages [50].
The increasing pH with the increasing WSC content in silage was also accompanied by an increase in the lactic acid content (LA), which ranged from 5.44 (FM-100) to 8.20 (WSC-100). Differences between the silage variants were statistically significant. According to Kung and Shaver [51], concentration values in the range of 7–8% DM are common in legume silages with a DM of 30–40% LA, while these values are lower in corn silages, ranging from 4 to 7% DM. This is consistent with the LA content values of the silage variants in this experiment; the non-leguminous variant of FM-100 silage had a lower LA concentration (5.44) than the leguminous variant of WSC-100 (8.20). Kara [46] found a lower value for the yellow sweet clover silage: 5.76% DM for biomass silage harvested during the early flowering stage. He also reported that LA content decreased to 3.68 for biomass silage harvested during the full flowering stage. Kung and Shaver [51] noted that LA is stronger than the other acids in silages (acetic, propionic and butyric acids) and, therefore, it is usually the main cause of the decline in the silage pH.
A similar trend as for LA was observed for acetic acid (AA): AA increased with the increasing WSC content of the silage. However, there were no statistically significant differences between the variants. According to Kung and Shaver [51], the usual values of the concentration of AA in legume silages with a DM of 30–40% range from 2 to 3% DM, while, in corn silages, these values vary from 1 to 3% DM. Moderate concentrations of AA in silage can be beneficial because AA has the ability to inhibit the development of yeasts and fungi that cause the development of aerobic decay [48]. Silage with very low concentrations of AA may be unstable when exposed to air.
The LA:AA ratio is commonly used as a qualitative indicator of fermentation. Good silage fermentation usually has a ratio of these acids approximately in the range from 2.5 to 3.0 [47].
In our experiment, the LA:AA ratio ranged from 3.31 (variant FM + WSC-50) to 4.16 (FM-100). Thus, no variant was within the optimal interval of LA:AA ratio. Silages with a very high LA to AA ratio can sometimes be more aerobically unstable than those with a normal ratio because low concentrations of acetic acid may not be sufficient to inhibit yeasts that assimilate lactate. In contrast, a ratio of LA to AA of less than 1 is usually indicative of abnormal fermentation [47,51].
Butyric acid (BA) was not detected in any of the silage samples. The ethanol content (EE) ranged from 0.30 (variant FM-100) to 0.83 (variant FM-100), falling within the range described as usual by Kung and Shaver [51]. According to these authors, the optimal EE content in legume silages with a DM of 30–40% reaches values of 0.2–1.0% DM and, for corn silages, 1.0–3.0% DM. Values of NH3-N content were very low and ranged from 2.03 (FM + WSC-50) to 4.82 (FM–100)—Table 6. According to Kung and Shaver [51], NH3-N concentrations in the range of 10–15% CP for legume silages with 30–40% DM and 5–7% CP for corn silages are common.

Table 6.
Parameters of silage variants FM, WSC and their mixture.
3.4. Biogas Yield
The cumulative production of biogas for 35 days in all three variants is shown in Figure 4. The diagram indicates that the lowest average yield of biogas from the very first day of the measurement was that of WSC silage. The total (cumulative) biogas yield from the WSC silage was 0.47 m3/kgVS. A higher average biogas yield was recorded throughout the measurement in the silage of mixed FM and WSC culture (50:50), with a total yield reaching 0.54 m3/kgVS. The highest production of biogas was recorded in the FM silage variant already from the first measurement. The total biogas yield was 0.60 m3/kgVS. For the 35 days of the experiment duration, 79.1% (WSC) and 85.4% (FM) of total biogas yield was produced in the first seven days. The measured values further indicated that the production of biogas gradually began to stagnate from Day 16 of the measurement, with a final stagnation recorded on Day 25. A similar trend was also observed in other experiments [24,29] where the production of biogas was measured in laboratory conditions using one batch of silage (plant mass). Therefore, a so-called breaking point should be established precisely for practical use and, hence, a moment when a further silage batch has to be added into the fermenter. This is not a problem in the case of silage grown in the MC regime as it exhibited the most continuous curve of biogas production, i.e., a curve with the smallest fluctuations.
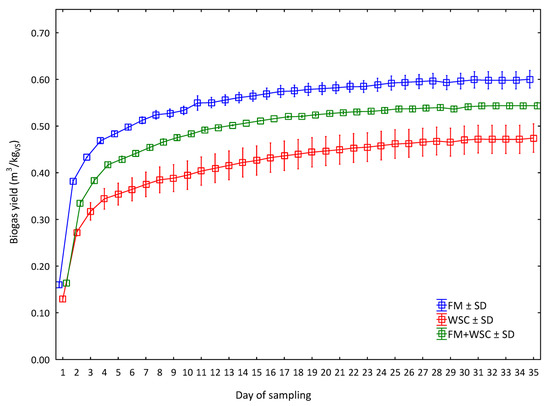
Figure 4.
Biogas yield during 35 days of the assay (average values for every day of measurement (n = 3) for one measurement, ± SD). FM = fodder mallow; WSC = white sweet clover; FM + WSC = fodder mallow + white sweet clover.
Differences between the yields of respective variants were statistically significant (Table 7). The results indicated that the biogas yield from the FM silage (0.60 m3/kgVS) was statistically significantly higher than the biogas yields from the silage of mixed culture (0.54 m3/kgVS) and WSC (0.47 m3/kgVS). The values do not entirely confirm the hypothesis that the mixed culture of FM + WSC is more suitable for the production of biogas than FM or WSC monocultures. Only in the case of WSC is it possible to theoretically consider its enhanced properties for the production of biogas if grown in the mixed culture. On the other hand, it is relatively interesting that the highest biogas yield was reached in the FM variant in which the highest ash content and a demonstrably lower starch content were recorded compared with the WSC and FM + WSC variants (Figure 4). In contrast, the WSC variant exhibited the highest content of starch and the lowest content of ash and the lowest biogas yield. Based on the generally known information about the biodegradability of ash and starch [43,44,45], it is possible to state that ash adversely affects the yield of biogas while starch affects it positively as it is a source of energy for the microorganisms responsible for biomass degradation during AD [1,2,3]. The cause of this condition can be associated with the content of other substances from the FM and WSC plants in the silage, because the silage produced from FM contained demonstrably less lignin and other vegetable fiber than the silage produced from WSC. Fiber, namely, cellulose, hemicellulose and lignin, is a substance that is difficult to biodegrade [45]. Thus, it is theoretically possible that the lower content of substances with the worse degradability (CF and ADL) contributed to the higher biogas yield from the FM silage compared with WSC and, thus, compensated for the lower content of starch. In contrast, the WSC silage exhibited the highest contents (p < 0.05) of CF and ADL, which could have been the reason for the lowest yield of biogas in this variant. If we look at these values in a greater detail, we can see that the FM variant contained 11% less CF and 2.4% less ADL. The WSC variant contained only 1.24% more starch, i.e., readily degradable substances. It is, therefore, possible that the higher content of readily degradable, carbonaceous substances does not have such an effect compared with the content of worse, degradable substances.

Table 7.
Results of Tukey’s HSD test for the parameter of average biogas yield after 35 days of the experiment.
3.5. Methane Yield
The production of methane was ascertained along with the biogas production. Methane yields did not show any statistically significant differences between the tested variants (Table 8). The highest production of methane was recorded in the silage of mixed FM + WSC culture (50:50). The total yield for the 35 days of the experiment duration amounted to 0.30 m3/kgVS. However, a statistically significant difference in the production of methane between the respective samples could not be confirmed. Thus, the values do not confirm our hypothesis that the growing of selected plants in a mixed culture contributes to the increased production of methane compared with the situation when they are grown in monocultures.

Table 8.
Results of Tukey’s HSD test for the parameter of average methane yield after 35 days of the experiment.
During the first seven days, the methane yield produced was between 69.9% (WSC) and 75.6% (FM) of total methane yield recorded for the 35 days of the experiment duration; this, however, did not have a statistical effect in the overall comparison of measured values. The cumulative production of methane during the 35 days in all three silage variants is presented graphically in Figure 5.
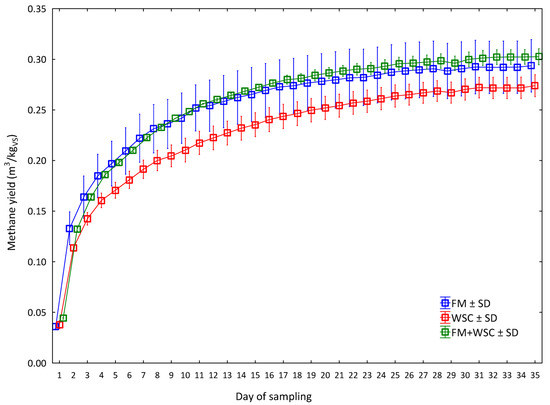
Figure 5.
Methane yield during 35 days of the experiment (average values for every day of measurement (n = 3) for one measurement, ± SD). FM—fodder mallow; WSC—white sweet clover.
The diagram in Figure 5 shows that the lowest average methane yield was already recorded in the WSC silage on the second day of measurements. The total yield in this variant (Table 8) was 0.27 m3/kgVS. After 21 days, the yield was 0.25 m3/kgVS, which is 56% higher than reported by Kintl et al. [24]—their average yield after 21 days of experiment duration was 0.16 m3/kgVS in WSC. A non-significant, higher average yield was recorded throughout the measurements in the FM silage in which the total average yield reached 0.29 m3/kgVS. The, again, non-significant, highest production of methane was already recorded from the third day of the experiment in the silage from the mixed FM + WSC (50:50) culture in which the total yield was 0.30 m3/kgVS. This was 3% more than the yield recorded in the FM variant and nearly 10% (9.47%) more than the yield recorded in the WSC variant, i.e., on average, 6.2% more than the yield of both monosubstrates. Unfortunately, these differences were not significant (Table 8). The reason was a high variability of measured values, which is also obvious from the range of error bars presenting the size of the SD (Figure 5).
Figure 6 shows the yield of methane determined on the basis of green biomass yield per unit area. Regarding the fact that no statistically significant differences existed between the methane yields of all three silage variants, it can be assumed that all three variants of silage would exhibit a similar performance in the production of electric energy. All stands were treated identically; in economic terms, this represents the same costs of sowing, fertilization, chemical protection and harvest. Converted per hectare, the lowest methane yield was recorded in the FM variant, and the highest methane yield was recorded in the FM + WSC variant. However, differences between the respective variants were not significant and were likely to have been caused by differences in TS values (Table A1). The FM variant exhibited the demonstrably lowest TS value (8.07 t/ha) compared with the other variants.
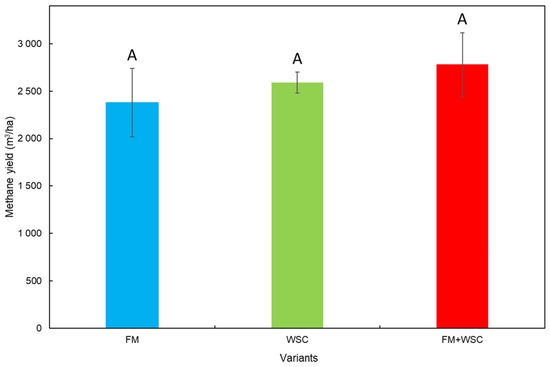
Figure 6.
Methane yield based on the yield of fresh biomass (mean of measured values (n = 3) ± SD). FM—fodder mallow, WSC—white sweet clover. Different capital letters indicate significant differences (p < 0.05).
The methane yields of all three silage variants (FM, WSC and FM + WSC; Figure 5) after 21 days of the fermentation process (0.28, 0.25 and 0.29 m3/kgVS; Table 8) were fully comparable with results reached after 21 days of the fermentation process in the methane production from the silage of maize. Vítěz et al. [29] declared a methane yield ranging from 0.27 to 0.30 m3/kgVS, Gao et al. [52] 0.20–0.32 m3/kgVS and Herrmann et al. [53] 0.33–0.35 m3/kgVS. As mentioned, the measured values (Figure 6) did not show any significant differences among the individual variants. It is interesting, however, if these values are compared with the sole crop of maize. Such a comparison is provided by Vítěz et al. [29], who tested maize silages prepared by the conventional method and by the shredlage technology in their work. After 21 days of anaerobic digestion (AD), the conventional silage and the shredlage exhibited a methane production of 0.27 m3/kgVS and 0.30 m3/kgVS, respectively. Similar results (from 0.30 to 0.36 m3/kgVS) were also reported by Amon et al. [54]. From this aspect, the used alternative materials were apparently an interesting source of biomass for biogas production at an identical biogas yield; a potential exists for growing biomass with a lower negative influence on the soil compared with the maize monoculture. On the other hand, it should be pointed out that maize has a higher production of biomass and, hence, a higher converted biogas production per hectare, which usually ranges from 4500 to 6000 m3 CH4/ha [55,56], which is, on average, a value twice as high as ours (Figure 6); therefore, it cannot be 100% replaced but, rather, a crop usable in AD can be added.
Methane yield can be considered both as a quantitative and a qualitative parameter [56]. It depends, primarily, on the composition of plant biomass entering the fermenter in the form of silage [57].
The fact that the methane yield was higher in the mixed culture silage than in the two other silage variants suggests that the yield increase occurred thanks to synergy during the AcoD process. According to Henard et al. [58], AcoD increases the process stability, optimizes the balance of nutrients and provides synergistic effects for microorganisms. However, this effect was not deeply studied in our experiment. Improvement and optimization of biogas production processes require further detailed research [59]. In principle, the AcoD process can be affected by several key parameters such as the properties of input substrate and the fermentation process itself (temperature in the fermenter, composition of microbial community, etc.) [60].
3.6. Methane Content in Biogas
The average values of methane (CH4) content in biogas in the respective variants of silage and their statistical analysis are presented in Table 9. There were no statistically significant differences between the recorded values of methane in biogas. The measured values, once again, do not confirm the hypothesis that the growing of FM and WSC in a mixed culture leads to the increased production and quality of biogas.

Table 9.
Results of Tukey’s HSD test for the parameter of average methane content in biogas after 35 days of the experiment.
Figure 7 shows the process of methane concentration in biogas developing for 35 days. The courses of the curves in the respective variants indicate similarity with courses of methane yield values (Figure 5); the differences between the variants were, however, non-significant. The highest values of methane content were recorded until the ninth day of measurements in the WSC variant. From the tenth day of measurements, differences in the content of methane were very small between the variants (up to a maximum of 1%) and statistically non-significant. The measured values suggest that the individual crops both in monocultures and in the mixed culture produced silage quality which had no adverse effect on the content of methane in biogas. It is interesting that the FM + WSC variant, i.e., biomass grown in the MC regime, almost did not show any difference from the variants with silages made of sole-grown crops from Day 12. This confirms that, if we use biomass combined from more crops, we can achieve a production of biogas that is of the same quality in terms of methane content as that from the silage of sole crops. This opens the way for possible use of multiple plant species (from different families) in the production of silage for biogas. According to Mulka et al. [61], the content of methane in biogas is influenced by the course of the reaction of carbon dioxide with hydrogen, decomposition of acetic acid, by temperature, pH, etc. A significant influence in the production of methane is also that of suitable inoculum, particularly in the initial phases of the biogas production [62]. These factors can reduce the production of methane or even stop it in extreme cases. This, however, did not happen in the case of tested silages. Kintl et al. [24] reported that an average concentration of methane in biogas reached 52.3% after 21 days in the WSC monosubstrate. In this experiment, the methane concentration after 21 days amounted to 69.0%, i.e., 31.9% more. However, not even that difference contributed to the confirmation of the tested hypothesis. The influence of the chemical composition of biomass entering the AD process on the quality of produced biogas was also corroborated by Gatta et al. [63], who even claimed in their work that the use of grasses and legumes is possible and desirable because these plant species contribute to the sustainability of biogas production from the plant biomass.
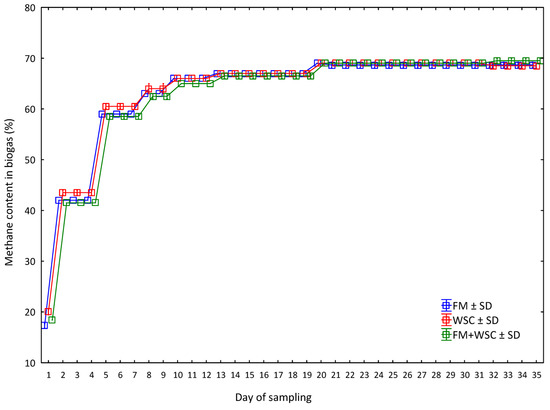
Figure 7.
Methane content in biogas during 35 days of the experiment (average values for every day of measurement (n = 3) for one measurement, ±SD). FM—fodder mallow; WSC—white sweet clover.
3.7. Interaction between Silage Parameters and Biogas Yield
Factor and PCA analyses were performed in order to assess relationships between the variables. The PCA analysis also included the calculation of the correlation matrix (Table 10), expressing relations between the studied parameters in detail.

Table 10.
Correlation matrix from PCA—summary of correlations among the measured parameters.
It follows from the correlation matrix (Table 10) that the biogas yield (m3/kgVS) exhibited a strong linear positive dependence on the parameters of ash (R = 0.91) and proteins (R = 0.87) and a negative dependence on the parameters of the fiber and lignin contents in the silage: NDF (R = −0.91), ADF (R = −0.89), CF (R = −0.88), ADL (R = −0.83) and starch (R = −0.70). Thus, the yield of biogas increased with the increasing content of proteins while it decreased with the increasing contents of fiber and starch. According to Wagner et al. [64], substrates rich in proteins are suitable for anaerobic digestion. Ahring [65] claimed, however, that using these substrates increases the risk that the process of anaerobic digestion will be inhibited by ammonia. The mutual negative correlation between the biogas yield and the parameter of starch can be explained by the very low starch content in the FM silage (7.33%/kgTS), WSC silage (8.57%/kgTS) and in the mixed FM + WSC silage (6.85%/kgTS) compared with the maize silage (20.7%/kgTS) [22,24]. In contrast, the relation between the biogas yield and contents of lipids in the silage (R = 0.29) exhibited a very weak, non-significant, negative dependence.
In addition, the methane yield also exhibited a positive dependence on the content of proteins (R = 0.52); however, this was non-significant. In contrast, the methane yield was negatively correlated with the content of starch (R = −0.61), and a similar negative correlation with the starch content was exhibited by the content of methane (R = −0.59). These dependencies were, however, non-significant.
Based on the PCA analysis, the interactions between the studied parameters and the biogas (methane) production are shown by means of biplots and scree graphs (Figure 8 and Figure A3). During the graph analysis, two main factors were set up (PC 1 and PC 2) that explained more than 83% of the variability of measured values; this is why they were chosen to explain the variability detected in the measured values (Figure A3). The measured data indicate there were two main factors (Figure A4): probably the grown plant species, which showed also in the composition of silage, and the effect of agrotechnology. PC 1 was considered the main factor as it explained more than 57% of the variability of variables, while the PC 2 factor explained hardly 26%.
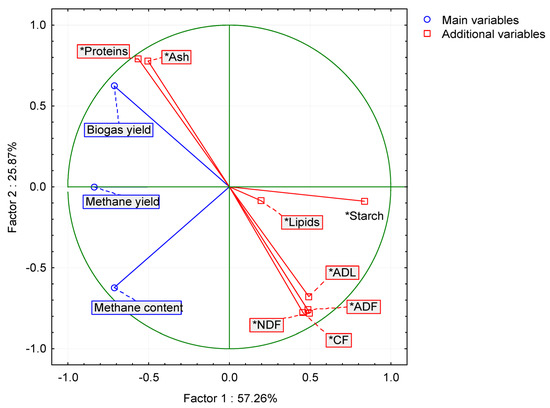
Figure 8.
Projection of the variables on the factor plane (1 × 2). NDF—neutral detergent fiber; ADF—acid detergent fiber; CF—crude fiber; ADL—acid detergent lignin.
The factor analysis (Table 11, Figure 8 and Figure A4) showed that Factor 1 strongly negatively correlated with the yield of biogas, methane and with the content of methane in biogas and strongly positively correlated with the starch value. Factor 2 strongly positively correlated with the parameters of proteins and ash and negatively correlated with the NDF, ADF, CF and ADL parameters.

Table 11.
Results of PCA. Correlation of factors and variables (factor load) according to correlations.
Factor 1 then included yield parameters of biogas, methane and the value of starch parameter, while Factor 2 represented parameters related to major substances in the silage, namely, to fiber, proteins and ash. The diagram projection of the variables on the factor plane (Figure 8) shows to what extent the individual initial variables contributed to the main components (Factor 1 and Factor 2). Factor 1 is apparently the most significant. This is also confirmed by the diagram of eigenvalues (Figure A3), which shows that Factor 1 explains 57.26% of the variability of the measured values. Based on the performed analyses (Table 10 and Table 11, Figure 8 and Figure A3), it can be assumed that the factor describes the influence of the source plant biomass on silage quality and biogas production. It can be assumed from the results of the PCA and FA that the methane content in biogas was also affected by an unknown parameter that was not monitored in the experiment. Kintl et al. [24] stated, for example, that the coumarin contained in WSC was in a strong negative correlation with the yield of methane and its content in biogas. According to Kadaňková et al. [22], coumarin can be an inhibitory factor in the process of methanogenesis. This was also corroborated by Popp et al. [66], who maintained that this happens only in cases when the microbial community in the fermenter is not adapted to coumarin. Thus, coumarin could have belonged to the unknown factors that negatively affected the process of anaerobic digestion. However, it was not possible to determine, either from the factor analysis or from PCA, whether the measured values of respective parameters were affected by crops being grown in the regime of mixed culture or whether they followed from the natural properties of crops which directly affected the quality of silage used in the process of fermentation.
4. Conclusions
We can only partly confirm the hypothesis that input materials, such as alternative crops (fodder mallow and white sweet clover) and their mixed culture, can be used for the production of biogas. Yields of biogas and methane (m3/kgVS) from the silages of these crops and their mixture were fully comparable with yields achieved in the production of biogas and methane from the silage of maize.
Furthermore, we cannot confirm the hypothesis that anaerobic fermentation of the mixture of fodder mallow and white sweet clover results in a higher methane yield than the average result of monosubstrates as we did not find any significant differences between the variants in which the plants were grown as monocultures and the variant in which they were grown as a mixed culture. Silage of legumes and other alternative crops cannot be a full-value substitute for maize silage due to low biogas yield (m3/ha). The research results show a potential for using fodder mallow and white sweet clover as intercrops or crops for co-fermentation with maize, where a relatively good biogas production could be achieved.
With respect to the fact that the course of the process of anaerobic co-digestion depends on many parameters associated with the composition and mutual ratio of fermented substrates, it is necessary to continue in the research in order to determine the influence of qualitative parameters of mixed silages and to test the proportions of individual components in the mixed substrate and their influence on the production of methane.
Author Contributions
Conceptualization, A.K. and J.E.; methodology, A.K., I.H. and J.E.; validation, I.H., T.V., T.H. and J.E.; formal analysis, J.H., M.B., V.O. and J.E.; investigation, A.K., I.H. and J.E.; resources, A.K. and T.V.; data curation, I.H. and J.E.; writing—original draft preparation, A.K., I.H., T.V. and J.E.; writing—review and editing, J.E. and T.V.; visualization, I.H. and J.E.; supervision, A.K. and J.E.; project administration, A.K.; funding acquisition, A.K. All authors have read and agreed to the published version of the manuscript.
Funding
Supported by the Ministry of Agriculture of the Czech Republic, institutional support MZE-RO1722.
Institutional Review Board Statement
Not applicable.
Informed Consent Statement
Not applicable.
Conflicts of Interest
The authors declare no conflict of interest.
Appendix A. Localization of the Experiment
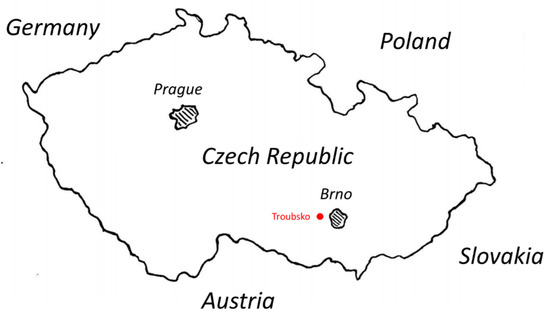
Figure A1.
Localization of the Troubsko experimental field station in CZE (Czech Republic) and European Union.
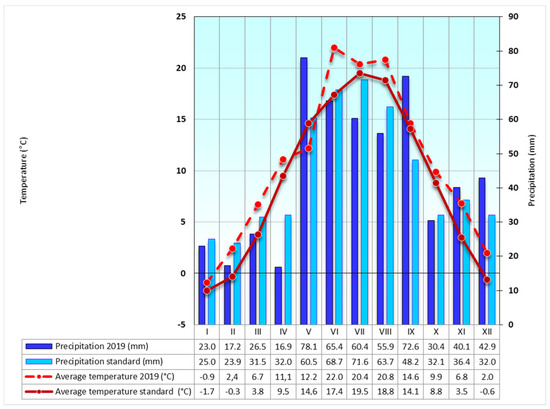
Figure A2.
Weather conditions at the Troubsko field experimental station, 2019—average monthly temperatures and mean annual precipitation amounts for long–term standard (1981–2010).
Appendix B. Qualitative Parameters of Silage–Dry Weight

Table A1.
Dry weight of prepared silage.
Table A1.
Dry weight of prepared silage.
| Variants | TS | TS | ||
|---|---|---|---|---|
| t/ha ± SD | HSD | % ± SD | HSD | |
| FM | 8.07 ± 0.57 | A | 20.75 ± 0.02 | A |
| WSC | 9.47 ± 0.72 | A | 32.35 ± 0.12 | C |
| FM + WSC | 9.19 ± 0.95 | A | 27.79 ± 0.11 | B |
Appendix C. PCA and Factor Analysis
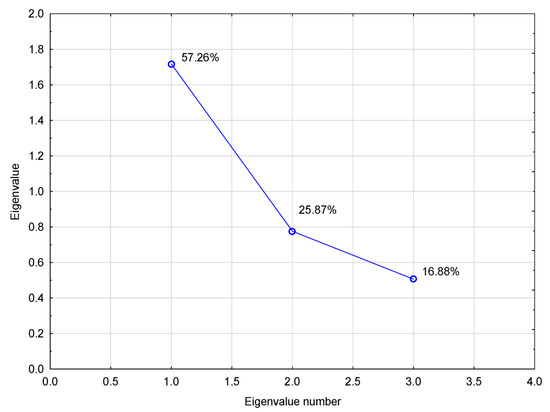
Figure A3.
Eigenvalues of correlation matrix.
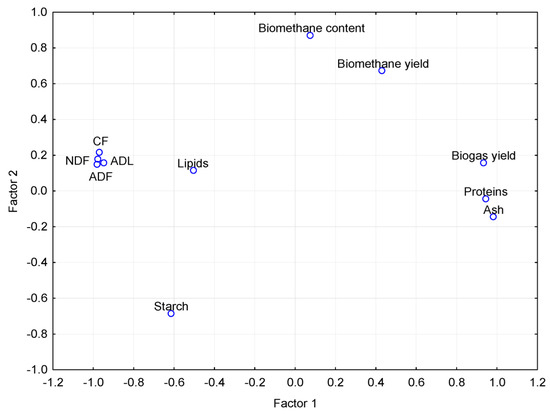
Figure A4.
Load Factor, Factor 1: Factor 2. Extraction: Main components.
References
- Hagos, K.; Jianpeng, Z.; Dongxue, L.; Chang, L.; Xiaohua, L. Anaerobic co-digestion process for biogas production: Progress, challenges and perspectives. Renew. Sustain. Energy Rev. 2017, 76, 1485–1496. [Google Scholar] [CrossRef]
- Cioabla, A.E.; Ionel, I.; Dumitrel, G.A.; Popescu, F. Comparative study on factors affecting anaerobic digestion of agricultural vegetal residues. Biotechnol. Biofuels 2012, 5, 39. [Google Scholar] [CrossRef]
- Rabii, A.; Aldin, S.; Dahman, Y.; Elbeshbishy, E. A Review on Anaerobic Co-Digestion with a Focus on the Microbial Populations and the Effect of Multi-Stage Digester Configuration. Energies 2019, 12, 1106. [Google Scholar] [CrossRef]
- Kajan, M.; Štindl, P.; Procházka, J. Experiences with anaerobic digestion in the Czech Republic. Pridobljeno 2008, 1, 16–17. [Google Scholar]
- Einarsson, R.; Persson, U.M. Analyzing key constraints to biogas production from crop residues and manure in the EU—A spatially explicit model. PLoS ONE 2017, 12, e0171001. [Google Scholar] [CrossRef]
- Meyer, A.; Ehimen, E.; Holm-Nielsen, J.B. Future European biogas: Animal manure, straw and grass potentials for a sustainable European biogas production. Biomass Bioenergy 2018, 111, 154–164. [Google Scholar] [CrossRef]
- Menšík, L.; Kincl, D.; Nerušil, P.; Srbek, J.; Hlisnikovský, L.; Smutný, V. Water erosion reduction using different soil tillage approaches for maize (Zea mays L.) in the Czech Republic. Land 2020, 9, 358. [Google Scholar] [CrossRef]
- Otte, A. Biogas und Biodiversität-ein Gegensatz. In Symposium Energiepflanzen-Landschaft Der Zukunft; Neu-Anspach: Giessen, Germany, 2010. [Google Scholar]
- Svoboda, N.; Taube, F.; Kluß, C.; Wienforth, B.; Kage, H.; Ohl, S.; Hartung, E.; Herrmann, A. Crop production for biogas and water protection—A trade-off? Agric. Ecosyst. Environ. 2013, 177, 36–47. [Google Scholar] [CrossRef]
- Veverková, M.D.; Elbl, J.; Voběrková, S.; Koda, E.; Adamcová, D.; Gusiatin, Z.M.; Al Rahman, A.; Radziemska, M.; Mazur, Z. Composting versus mechanical-biological treatment: Does it really make a difference in the final product parameters and maturity. Waste Manag. 2020, 106, 173–183. [Google Scholar] [CrossRef]
- Elbl, J.; Maková, J.; Javoreková, S.; Medo, J.; Kintl, A.; Lošák, T.; Lukas, V. Response of microbial activities in soil to various organic and mineral amendments as an indicator of soil quality. Agronomy 2019, 9, 485. [Google Scholar] [CrossRef]
- Stinner, W.; Deuker, A.; Schmalfuß, T.; Brock, C.; Rensberg, N.; Denysenko, V.T.P.; Möller, K.; Zang, J.; Janke, L.; Mozena, L.W.; et al. Perennial and Intercrop Legumes as Energy Crops for Biogas Production. In Legumes for Soil Health and Sustainable Management, 1st ed.; Meena, R., Das, A., Yadav, G., Lal, R., Eds.; Springer: Singapore, 2018; pp. 139–171. [Google Scholar]
- Balliu, A.; Nasto, T.; Sallaku, G. The Influence of Legume Crops on Subsequent Vegetable (Cole) Crops; Technical Report, FP7 Research Project No. 613781; Agriculture University of Tirana: Tirana, Albania, 2017; 24p. [Google Scholar]
- Brooker, R.W.; Bennett, A.E.; Cong, W.; Daniell, T.J.; George, T.S.; Hallett, P.; Hawes, C.; Iannetta, P.P.M.; Jones, H.G.; Karley, A.J. Improving intercropping: A synthesis of research in agronomy, plant physiology and ecology. New Phytol. 2014, 206, 107–117. [Google Scholar] [CrossRef] [PubMed]
- Hauggaard-Nielsen, H.; Ambus, P.; Jensen, E.S. The comparison of nitrogen use and leaching in sole cropped versus intercropped pea and barley. Nutr. Cycl. Agroecosyst. 2003, 65, 289–300. [Google Scholar] [CrossRef]
- Wahid, R.; Feng, L.; Cong, W.F.; Ward, A.J.; Møller, H.B.; Eriksen, J. Anaerobic mono-digestion of lucerne, grass and forbs–Influence of species and cutting frequency. Biomass Bioenergy 2018, 109, 199–208. [Google Scholar] [CrossRef]
- Hutňan, M.; Špalková, V.; Bodík, I.; Kolesárová, N.; Lazor, M. Biogas Production from Maize Grains and Maize Silage. Pol. J. Environ. Stud. 2010, 19, 323–329. [Google Scholar]
- Ofori, F.; Stern, W.R. Relative sowing time and density of component crops in a maize/cowpea intercrop system. Exp. Agric. 1987, 23, 41–52. [Google Scholar] [CrossRef]
- Thayamini, H.S.; Brintha, I. Review on Maize based intercropping. J. Agron. 2010, 9, 135–145. [Google Scholar]
- Turkington, R.; Cavers, P.; Rempel, E. The biology of Canadian weeds.: 29. Melilotus alba Desr. and M. officinalis (L.) Lam. Can. J. Plant Sci. 1978, 58, 523–537. [Google Scholar]
- Nair, R.M.; Whittall, A.; Hughes, S.J.; Craig, A.D.; Revell, D.K.; Miller, S.M.; Powell, T.; Auricht, G.C. Variation in coumarin content of Melilotus species grownin South Australia. N. Z. J. Agric. Res. 2010, 53, 201–213. [Google Scholar] [CrossRef]
- Kadaňková, P.; Kintl, A.; Koukalová, V.; Kučerová, J.; Brtnický, M. Coumarin content in silages made of mixed cropping biomass comprising maize and white sweetclover. In Proceedings of the 19th International Multidisciplinary Scientific GeoConference SGEM 2019, Albena, Bulgaria, 28 June 2019; SGEM: Sofia, Bulgaria, 2019; pp. 115–121. [Google Scholar]
- Popp, D.; Plugge, C.M.; Kleinsteuber, S.; Harms, H.; Sträuber, H. Inhibitory effect of coumarin on syntrophic fatty acid-oxidizing and methanogenic cultures and biogas reactor microbiomes. Appl. Environ. Microbiol. 2017, 83, e00438-17. [Google Scholar] [CrossRef]
- Kintl, A.; Elbl, J.; Vítěz, T.; Brtnický, M.; Skládanka, J.; Hammerschmiedt, T.; Vítězová, M. Possibilities of using white sweetclover grown in mixture with maize for biomethane production. Agronomy 2020, 10, 1407. [Google Scholar] [CrossRef]
- Zielewicz, W.; Wróbel, B. Effect of differential nitrogen fertilization on the nutritive value of fodder mallow (Malva verticillata L.) and maize (Zea mays L.) Eurostar variety. J. Res. Appl. Agric. Eng. 2018, 63, 151–156. [Google Scholar]
- Rigal, M.; Rigal, L.; Vilarem, G.; Vandenbossche, V. Sweet Clovers, a Source of Fibers Adapted for Growth on Wet and Saline Soils. J. Nat. Fibers 2016, 13, 410–422. [Google Scholar] [CrossRef]
- ČSN EN 15934 (2007). Available online: https://standards.iteh.ai/catalog/standards/cen/c7e440f9-c400-4318-8ee5-637e7f127c5d/en-15934-2012 (accessed on 20 December 2021).
- ČSN EN 15169 (2015). Available online: https://standards.iteh.ai/catalog/standards/cen/b990f274-8477-43ac-9afa-b3aa6e927413/en-15169-2007 (accessed on 20 December 2021).
- Vítěz, T.; Elbl, J.; Trávníček, P.; Kobzová, E.; Hammerschmiedt, T.; Koutný, T.; Kintl, A.; Vítězová, M. Impact of Maize Harvest Techniques on Biomethane Production. BioEnergy Res. 2021, 14, 303–312. [Google Scholar] [CrossRef]
- ISO 13906—Determination of Acid Detergent Fibre (ADF) and Acid Detergent Lignin (ADL) Contents. Geneva, International Organization for Standardization. 2008. Available online: https://csnonline.agenturacas.cz/Detailnormy.aspx?k=89284 (accessed on 5 May 2017).
- Divišová, R.; Vítová, E.; Diviš, P.; Zemanová, J.; Omelková, J. Validation of SPME-GC-FID method for determination of fragrance allergens in selected cosmetic product. Acta Chromatogr. 2015, 27, 509–523. [Google Scholar] [CrossRef]
- Dariush, M.; Ahad, M.; Meysam, O. Assessing the land equivalent ratio (LER) of two corn (Zea mays L.) varieties intercropping at various nitrogen levels in Karaj, Iran. J. Cent. Eur. Agric. 2007, 7, 359–364. [Google Scholar]
- Bozhanska, T.; Mihovsky, T.; Naydenova, G.; Knotová, D.; Pelikán, J. Comparative studies of annual legumes. Biotechnol. Anim. Husb. 2016, 32, 311–320. [Google Scholar] [CrossRef]
- Charani, E.; Sharifi, P.; Aminpanah, H. Evaluation of grain yield and yield components in intercropping of maize and bean. Biharean Biologist 2017, 11, 37–42. [Google Scholar]
- Yilmaz, F.; Atak, M.; Erayman, M.N. Identification of advantages of maize-legume intercropping over solitary cropping through competition indices in the east mediterranean region. Turk. J. Agric. For. 2008, 32, 111–119. [Google Scholar]
- Mead, R.; Willey, R. The Concept of a ‘Land Equivalent Ratio’ and Advantages in Yields from Intercropping. Exp. Agric. 1980, 16, 217–228. [Google Scholar] [CrossRef]
- Knudsen, M.T.; Hauggaard-Nielsen, H.; Jørnsgård, B.; Jensen, E.S. Comparison of interspecific competition and N use in pea–barley, faba bean–barley and lupin–barley intercrops grown at two temperate locations. J. Agric. Sci. 2005, 142, 617–627. [Google Scholar] [CrossRef]
- Maingi, M.J.; Shisanya, A.C.; Gitonga, M.N.; Hornetz, B. Nitrogen fixation by common bean (Phaseolus vulgaris L.) in pure and mixed stands in semi-arid South east Kenya. Eur. J. Agron. 2001, 14, 1–12. [Google Scholar] [CrossRef]
- Maitra, S.; Ghosh, D.C.; Sounda, G.; Jana, P.K. Performance of inter-cropping legumes in fingermillet (Eleusine coracana) at varying fertility levels. Indian J. Agron. 2001, 46, 38–44. [Google Scholar]
- Maitra, S.; Ray, D.P. Enrichment of biodiversity, influence in microbial population dynamics of soil and nutrient utilization in cereal-legume intercropping systems: A Review. Int. J. Biores. Sci. 2019, 6, 11–19. [Google Scholar] [CrossRef]
- Jabbar, A.; Ahmad, R.; Bhatti, I.H.; Virk, Z.A.; Khan, M.M. Assessment of yield advantages, competitiveness and economic benefits of diversified direct-seeded upland rice-based intercropping systems under strip geometry of planting. Pak. J. Agric. Sci. 2009, 46, 96–101. [Google Scholar]
- Matusso, J.M.M.; Mugwe, J.N.; Mucheru-Muna, M. Potential role of cereal-legume intercropping systems in integrated soil fertility management in smallholder farming systems of Sub-Saharan Africa Research Application Summary. In Proceedings of the Third RUFORUM Biennial Meeting, Entebbe, Uganda, 24–28 September 2012. [Google Scholar]
- Schulz, V.S.; Munz, S.; Stolzenburg, K.; Hartung, J.; Weisenburger, S.; Mastel, K.; Möller, K.; Claupein, W.; Graeff-Hönninger, S. Biomass and biogas yield of maize (Zea mays L.) grown under artificial shading. Agriculture 2018, 8, 178. [Google Scholar] [CrossRef]
- Steffen, F.; Requejo, A.; Ewald, C.; Janzon, R.; Saake, B. An aerobic digestion of fines from recovered paper processing–Influence of fiber source, lignin and ash content on biogas potential. Bioresour. Technol. 2016, 200, 506–513. [Google Scholar] [CrossRef] [PubMed]
- Deublein, D.; Steinhauser, A. Biogas from Waste and Renewable Resources; Wiley-VCH: Weinheim, Germany, 2010; 550p. [Google Scholar]
- Kara, K. Nutrient matter, fatty acids, in vitro gas production and digestion of herbage and silage quality of yellow sweet clover (Melilotus officinalis L.) at different phenological stages. J. Anim. Feed Sci. 2021, 30, 128–140. [Google Scholar] [CrossRef]
- Kung, L.; Shaver, R.D.; Grant, R.J.; Schmidt, R.J. Silage review: Interpretation of chemical, microbial, and organoleptic components of silages. J. Dairy Sci. 2018, 101, 4020–4033. [Google Scholar] [CrossRef]
- Danner, H.; Holzer, M.; Mayrhuber, E.; Braun, R. Acetic acid increases stability of silage under aerobic conditions. Appl. Environ. Microbiol. 2020, 69, 562–567. [Google Scholar] [CrossRef]
- Meiske, J.C.; Linn, J.G.; Goodrich, R.D. Types of laboratory silos and an evaluation of their usefulness. In Proceedings 2nd International Silage Research Conference; National Silo Assoc. Inc.: Waterloo, IA, USA, 1975; pp. 99–126. [Google Scholar]
- Cherney, D.J.R.; Cherney, J.H.; Cox, W.J. Fermentation characteristics of corn forage ensiled in mini-silos. J. Dairy Sci. 2004, 87, 4228–4246. [Google Scholar] [CrossRef]
- Kung, L.; Shaver, R. Interpretation and use of silage fermentation analysis reports. Focus Forage 2001, 13, 20–28. [Google Scholar]
- Gao, R.; Yuan, X.; Zhu, W.; Wang, X.; Chen, S.; Cheng, X.; Cui, Z. Methane yield through anaerobic digestion for various maize varieties in China. Bioresour. Technol. 2012, 118, 611–614. [Google Scholar] [CrossRef] [PubMed]
- Herrmann, C.; Heiermann, M.; Idler, C. Effects of ensiling, silage additives and storage period on methane formation of biogas crops. Bioresour. Technol. 2011, 102, 5153–5161. [Google Scholar] [CrossRef] [PubMed]
- Amon, T.; Amon, B.; Kryvoruchko, V.; Zollitsch, W.; Mayer, K.; Gruber, L. Biogas production from maize and dairy cattle manure—Influence of biomass composition on the methane yield. Agric. Ecosyst. Environ. 2007, 118, 173–182. [Google Scholar] [CrossRef]
- Kintl, A.; Vítěz, T.; Vítězová, M.; Dokulilová, T.; Nedělník, J.; Skládanka, J.; Brtnický, M. Mixed culture of corn and white lupine as an alternative to silage made from corn monoculture intended for biogas production. BioEnergy Res. 2019, 12, 694–702. [Google Scholar] [CrossRef]
- Boe, K.; Batstone, D.J.; Steyer, J.P.; Angelidaki, I. State indicators for monitoring the anaerobic digestion process. Water Res. 2010, 44, 5973–5980. [Google Scholar] [CrossRef]
- Ferreira, G.; Brown, A.N. Environmental Factors Affecting Corn Quality for Silage Production. In Advances in Silage Production and Utilization; Da Silva, T., Santos, E.M., Eds.; Intech Open: London, UK, 2016. [Google Scholar]
- Henard, C.A.; Smith, H.K.; Guarnieri, M.T. Phosphoketolase overexpression increases biomass and lipid yield from methane in an obligate methanotrophic biocatalyst. Metab. Eng. 2017, 41, 152–158. [Google Scholar] [CrossRef]
- Siddique, M.N.I.; Wahid, Z. Achievements and perspectives of anaerobic co-digestion: Achievements and perspectives of anaerobic co-digestion: A review. J. Clean. Prod. 2019, 194, 359–371. [Google Scholar] [CrossRef]
- Xie, S.; Hai, F.I.; Zhan, X.; Guo, W.; Ngo, H.H.; Price, W.E.; Nghiem, L.D. Anaerobic co-digestion: A critical review of mathematical modeling for performance optimization. Bioresour. Technol. 2016, 222, 498–512. [Google Scholar] [CrossRef]
- Mulka, R.; Szulczewski, W.; Szlachta, J.; Prask, H. The influence of carbon content in the mixture of substrates on methane production. Clean Technol. Environ. Policy 2016, 18, 807–815. [Google Scholar] [CrossRef][Green Version]
- Pandey, K.P.; Ndegwa, M.P.; Soupir, M.L.; Alldredge, R.J.; Marvin, P.J. Efficacies of inocula on the startup of anaerobic reactors treating dairy manure under stirred and unstirred conditions. Biomass Bioenergy 2011, 35, 2705–2720. [Google Scholar] [CrossRef]
- Gatta, G.; Gagliardi, A.; Soldo, P.; Monteleone, M. Grasses and legumes in mixture: An energy intercropping system intended for anaerobic digestion. Ital. J. Agron. 2013, 8, 47–57. [Google Scholar] [CrossRef]
- Wagner, A.O.; Lins, P.; Malin, C.; Reitschuler, C.; Illmer, P. Impact of protein-, lipid- and cellulose-containing complex substrates on biogas production and microbial communities in batch experiments. Sci. Total Environ. 2013, 458, 256–266. [Google Scholar] [CrossRef] [PubMed]
- Ahring, B.K. Biomethanation I Series: Advances in Biochemical Engineering Biotechnology; Springer: Berlin/Heidelberg, Germany, 2003. [Google Scholar]
- Popp, D.; Schrader, S.; Kleinsteuber, S.; Harms, H.; Sträuber, H. Biogas production from coumarin-rich plants—Inhibition by coumarin and recovery by adaptation of the bacterial community. FEMS Microbiol. Ecol. 2015, 91, 103. [Google Scholar] [CrossRef] [PubMed]
Publisher’s Note: MDPI stays neutral with regard to jurisdictional claims in published maps and institutional affiliations. |
© 2022 by the authors. Licensee MDPI, Basel, Switzerland. This article is an open access article distributed under the terms and conditions of the Creative Commons Attribution (CC BY) license (https://creativecommons.org/licenses/by/4.0/).