Article

Bioethanol Production from Spent Sugar Beet Pulp—Process Modeling and Cost Analysis

by
Damjan Vučurović
1,
Bojana Bajić
1,*,
Vesna Vučurović
1,
Rada Jevtić-Mučibabić
2 and
Siniša Dodić
1
1
Department of Biotechnology and Pharmaceutical Engineering, Faculty of Technology Novi Sad, University of Novi Sad, Bulevar cara Lazara 1, 21000 Novi Sad, Serbia
2
Institute of Food Technology in Novi Sad, University of Novi Sad, Bulevar cara Lazara 1, 21000 Novi Sad, Serbia
*
Author to whom correspondence should be addressed.
Fermentation 2022, 8(3), 114; https://doi.org/10.3390/fermentation8030114
Submission received: 22 February 2022 / Revised: 2 March 2022 / Accepted: 3 March 2022 / Published: 6 March 2022
(This article belongs to the Special Issue Biofuels Production and Processing Technology)

Abstract

:
Global economic development has led to the widespread use of fossil fuels, and their extensive use has resulted in increased environmental pollution. As a result, significantly more attention is being paid to environmental issues and alternative renewable energy sources. Bioethanol production from agro-industrial byproducts, residues, and wastes is one example of sustainable energy production. This research aims to develop a process and cost model of bioethanol production from spent sugar beet pulp. The model was developed using SuperPro Designer® v.11 (Intelligen Inc., Scotch Plains, NJ, USA) software, and determines the capital and production costs for a bioethanol-producing plant processing about 17,000 tons of spent sugar beet pulp per year. In addition, the developed model predicts the process and economic indicators of the analyzed biotechnological process, determines the share of major components in bioethanol production costs, and compares different model scenarios for process co-products. Based on the obtained results, the proposed model is viable and represents a base case for further bioprocess development.

1. Introduction

In the past few decades, sustainability has become a key consideration due to the depletion of fossil fuels and other natural resources, increased environmental awareness, and the social benefits of reducing environmental pollution [1,2,3]. Fossil fuels are the main contributors to climate change; therefore, in order to meet the increasing demand for energy production, it is necessary to utilize a valuable and eco-friendly alternative to non-renewable fuels, such as bioethanol produced from renewable feedstock. Due to growing concerns regarding the global food supply, second-generation bioethanol (from lignocellulosic non-edible biomass) and third-generation bioethanol (from algal sources) are becoming increasingly attractive [4,5]. Additionally, in accordance with the Renewable Energy Directive (Directive EU 2018/2001) [6], a common framework was established for the promotion of energy from renewable sources in the EU, setting a binding target for the EU’s gross final consumption, being that the overall share of energy from renewable sources should be 32% by 2030. This legislation also promotes the use of non-food crops for biofuel production, and has limited the amount of biofuels and bioliquids produced from food or feed crops. According to the Energy Development Strategy [7], the Republic of Serbia will require further sustainable energy development until 2030, based on activities that include intensive use of renewable energy sources.
Lignocellulosic biomass is considered to be a key renewable resource of the future, while agro-industrial byproducts, residues, and wastes have enormous potential to generate sustainable bioproducts and bioenergy [8,9]. One such agro-industrial byproduct is sugar beet pulp, which is obtained in the sugar-processing industry after sucrose extraction from sugar beet, and which represents a very attractive raw material for bioethanol production due to its composition. This sugar processing industry byproduct is typically used as animal feed; hence, it is significant to investigate the possibility of obtaining greater economic and environmental benefits by using a given raw material to produce a value-added product, such as bioethanol, along with the valorization of other process byproducts to achieve a sustainable bioprocess [10,11].
Significant research has been carried out on bioethanol production from different lignocellulosic raw materials [12,13,14]. For bioprocess design and optimization, simulations are of great importance for reducing costs and the number of required experiments, as well as predicting different potential scenarios. The application of bioprocess optimization, modeling, and simulation is of enormous importance in the development of each bioprocess [15,16]. An economic analysis of the whole process on a commercial scale can be performed using an in-depth process model which includes all unit operations from biomass handling to bioethanol distillation. Tradeoffs in energy and water use in the process, as well as capital costs, can be understood using such models. The data (emissions, energy and utilities requirements) generated by these models can be utilized for the analysis of the environmental impact of the process [17]. Computer simulation process models have been used by various researchers to study bioethanol production from different agro-industrial byproducts, residues, and wastes, such as grass straw [17], triticale grain and straw [18], sugarcane and blue agave bagasse [19], oil palm frond [20], sweet potato [21], and sugar beet raw juice [22].
According to data from the Statistical Office of the Republic of Serbia, sugar beet represents one of the most important crops in our country. More specifically, it is the third most produced crop in recent years, with a production of 2,018,215 tons in the year 2020 [23]. After processing this amount of sugar beet, about 500,000 tons of wet-pressed spent sugar beet pulp (water content approximately 75–80%) remain, which can be converted into dry spent sugar beet pulp (about 10% water content) [24]. Due to its availability and low price, spent sugar beet pulp could have great potential for bioethanol production in Serbia [25]. Furthermore, spent sugar beet pulp is especially rich in polysaccharides (hemicelluloses, cellulose, and pectin) and has a low lignin content. A lower lignin content in the feedstock facilitates pretreatment and decreases the bioethanol production costs. In the dried form, it is generally steady, and can be either utilized directly or stored for up to a year without any unfavorable effect on its quality [10,26,27]. Therefore, the aim of this research was to provide a simulation solution for a sustainable bioethanol production plant from spent sugar beet pulp with minimal waste generation. In this research, a process and cost model for a bioethanol production plant has been developed with the aim of applying it in the evaluation of new technologies and products based on lignocellulosic raw materials.

2. Materials and Methods

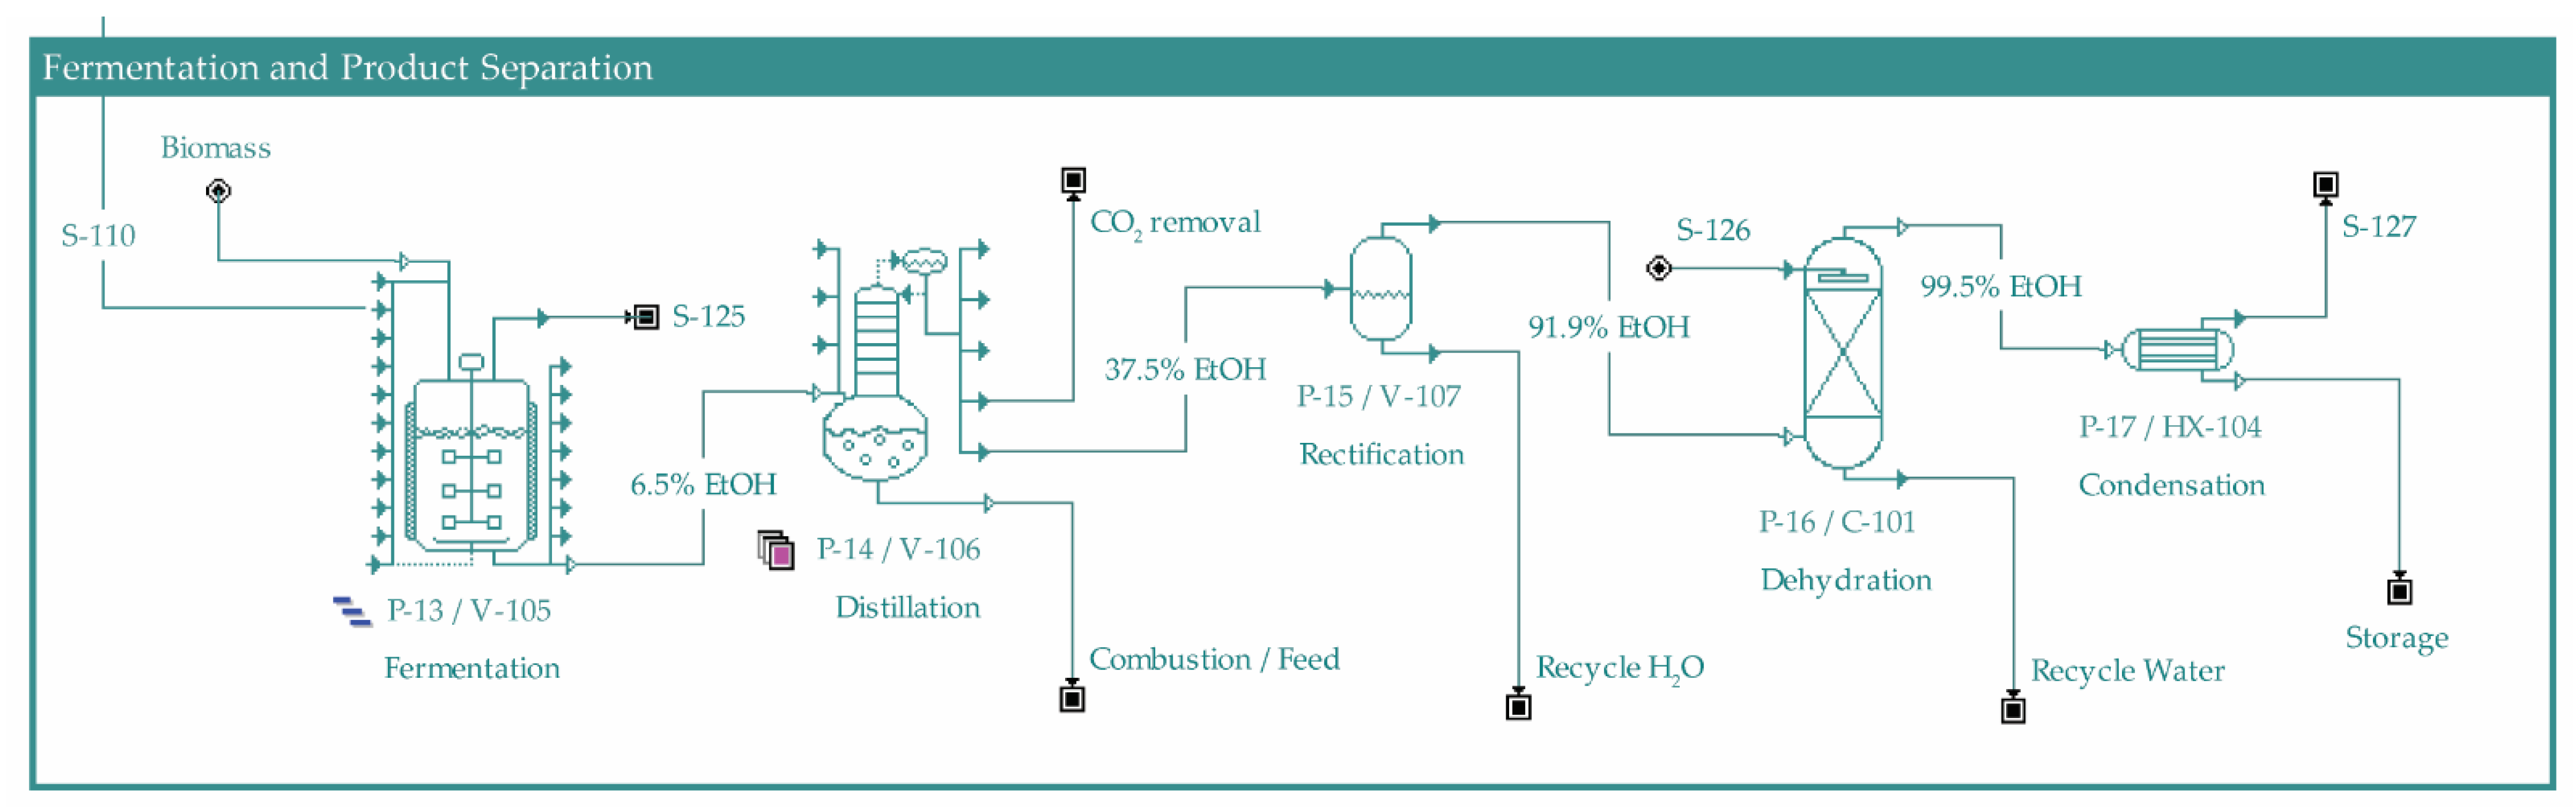
2.1. Process Overview

In this research, process design and economic analyses were performed using SuperPro Designer® v.11 (Intelligen Inc., Scotch Plains, NJ, USA). The spent sugar beet pulp is brought to the factory by trucks and is stored before being used as raw material in the bioethanol-production process. The spent sugar beet pulp is then transferred from the storage unit to the shredders, where it is ground to a size optimal for further processing. Ground sugar beet pulp is sent for pretreatment, where hemicellulose and a small part of cellulose are converted to soluble sugars, by exposing the pulp to high temperatures and dilute sulfuric acid. Under these conditions, a certain amount of lignin also dissolves, which improves the efficiency of the cellulose hydrolysis. The low lignin content of the spent sugar beet pulp makes this raw material suitable for bioethanol production [28]. After pretreatment, the mixture is cooled and the liquid part containing sulfuric acid is separated from the solid phase. Lime is added to the liquid fraction in order to neutralize the solution and obtain gypsum, which forms a precipitate. Filtration is used to separate the gypsum, and the filtrate is mixed again with the solid phase before enzymatic hydrolysis.
Fermentation and enzymatic hydrolysis are performed separately (separated hydrolysis and fermentation—SHF) using several vessels, which allows this process to be performed at a slightly elevated temperature, reducing the time and amount of enzymes required, and increasing enzymatic activity. The advantage of SHF is the ability to perform both hydrolysis and fermentation under optimal conditions, although the entire process time is longer [29]. The enzyme preparation used for cellulose hydrolysis consists of endoglucanase, exoglucanase, and β-glucosidase enzymes. The hydrolysate of spent sugar beet pulp and the production microorganism are introduced into the main bioreactor. For fermentation, a glucose- and xylose-fermenting yeast is used as a biocatalyst, and five cascade vessels are used to ferment the hydrolysate to ethanol. After fermentation, the broth containing bioethanol is sent to separate and purify the product.
The separation and purification of bioethanol from the fermentation broth are performed by distillation (in two columns) and molecular sieves. The first distillation column removes dissolved carbon dioxide and water, while the second (rectification) column concentrates the bioethanol solution to an almost azeotropic mixture. All the water from this mixture is removed by adsorption in the vapor phase in molecular sieves. Ultimately, the 99.6% bioethanol vapor is cooled in a heat exchanger, condensed, and stored until use or sale. The process water obtained from the distillation, rectification, and molecular sieves is recirculated and reused in the pretreatment reactors, which reduces the process costs.

2.2. Process Design

The process flow diagram of the bioethanol production process from spent sugar beet pulp is shown in Figure 1, Figure 2 and Figure 3. The economic analysis was conducted based on the process design and on mass and energy balances by using SuperPro Designer software. Figure 1 represents the process flow diagram of the reception and preparation of spent sugar beet pulp.
The amount of spent sugar beet pulp required for one batch in this process is 20,000 kg. This quantity is calculated based on the amount of spent sugar beet pulp available from a local sugar factory processing 250,000 t of sugar beet, and on the possible number of batches per year. Spent sugar beet pulp (89.2% dry matter) contains: 21.7 (%dm) cellulose, 24.0 (%dm) hemicellulose, 7.6 (%dm) reducing sugars, 2.4 (%dm) lignin, and 9.3 (%dm) proteins [30]. Since the capacity of transport trucks (P-1) is 10 tons, less than 1700 deliveries are required annually. Sugar beet is harvested in a relatively short timeframe, and the obtained spent pulp requires storage in order to provide a constant source of raw material to the plant. Long-term storage can be in covered storages (P-2/DSR-101) located close to the plant itself. The spent sugar beet pulp from the storage is transferred into the shredder (P-3/SR-101), where it is reduced to an optimal size for pretreatment and hydrolysis. The shredder operating time is 15 min, with an energy consumption of 4000 kW and a throughput of 80,000 kg/h. Figure 2 shows the process flow diagram of the pretreatment and saccharification stages of the bioethanol production process from spent sugar beet pulp.
The ground beet pulp is transferred to two pretreatment reactors (P-4/V-101), after which around 45,000 kg of water and 718 kg concentrated sulfuric acid are added, in order to achieve the optimal acid concentration in the reactor of 1% H2SO4. At this point, the slurry contains 30% insoluble solids. The pretreatment reactors are operated at elevated temperatures (170 °C) and have a retention time of 2 min. The volume of each reactor is 35.2 m3 (h = 6.545 m, d = 2.62 m). High-pressure steam is used as a medium for heat transfer, typically with a flow rate of around 200,000 kg/h.
Table 1 shows the reactions, with the corresponding reaction extents, in the pretreatment reactors.
The slurry leaving the pretreatment reactors is cooled to 50 °C (neutralization of the slurry takes place at this temperature), by cooling water in two plate and frame heat exchangers (P-5/HX-101) with a surface area of 89.84 m2 each. The slurry stays in the heat exchanger for 10 min, after which the treated slurry containing 22% insoluble solids is added to a decanter centrifuge (P-6/DC-101) to separate the solid from the liquid phase. This equipment unit operates at a volumetric throughput close to 378,000 L/h and a duration of 10 min. The reason for the separation of the liquid is the reduction in the acidity (sulfuric acid) of the liquid phase, which positively affects the fermentation process.
The separated liquid phase is neutralized in a vessel (P-7/V-102) by adding around 545 kg of lime (calcium hydroxide) and keeping for 1 h, which is a sufficient time for the required reaction to take place. Two 27,800 L vessels (h = 6.05 m, d = 2.42 m) are required, and the power consumption for mixing is 3.7 kW. The formed crystals are separated in a hydrocyclone (P-8/CY-101) with the following characteristics: inlet fluid velocity—5 m/s, pressure drop—1.2 bars, and body diameter—0.83 m. This procedure removes 99.5% of the formed gypsum crystals with a dry matter content of 83%, which means gypsum can be handled as a solid. After removing the gypsum, the neutralized liquid is mixed again with the solid fraction from the pretreatment in the slurry storage (P-9/V-103). The mixing power of these vessels is 24.6 kW. Two vessels with a volume of 34.7 m3 (h = 7.36 m and d = 2.45 m) are required.
The neutralized and pretreated slurry, containing 22% solids, is introduced into a heat exchanger (P-10/HX-102; heat exchange surface 45.25 m2) and heated to 65 °C or hydrolysis temperature (using low-pressure steam, whose throughput is 11,295 kg/h), before being transferred into hydrolysis vessels (P-11/V-104). The hydrolysis occurs in five 78.7 m3 (h = 8.56 m, d = 3.42 m) vessels operating in a cascade for 36 h. For this model, cellulase was fed at the rate of 10 international filter paper units (IFPU) per gram of cellulose, assuming an enzyme concentration of 50 kU/m3 [31]. Table 2 shows the reactions and their reaction extents for the hydrolysis process. After the hydrolysis process, the hydrolysate of spent sugar beet pulp contains 13.6% reducing sugars.
The hydrolysate of spent sugar beet pulp is cooled to 30 °C in three heat exchangers, with a heat exchange surface of 93.5 m2 each. Figure 3 shows the process flow diagram of the fermentation and product separation stages of the bioethanol production process.
Fermentation occurs in five 87.4 m3 (h = 10 m, d = 3.3 m) fermenters (P-13/V-105) for 36 h. Table 3 shows the reactions and their reaction extents for the fermentation process. The concentration of bioethanol in the fermentation broth after the bioprocess is 6.5%, while the sugar concentration is 1.63%. After the bioprocess, the fermentation broth is introduced into two distillation columns (reboiler temperature of 85 °C, condenser temperature of 45 °C) of 37,900 L (P-14/V-106), with a reflux ratio of 3:1, and adjusted to emit CO2 and as little bioethanol as possible at the top of the column, removing 86% of the water at the bottom of the column. A high percentage of bioethanol (>99%) from the feed is separated as a 37.55% mixture of water and bioethanol.
Due to its composition, the contents from the bottom of the distillation column can be dried and burned or used as animal feed while reducing operating costs, which is examined in the economic analysis of the model.
The vapor phase from the column (a mixture of bioethanol and water) is introduced directly to the rectification column (P-15/V-107) with a working volume of 1800 L (heating steam throughput 5237 kg/h). The vapor phase at the top of the rectification column contains 91.9% bioethanol, while the content of bioethanol at the bottom of the column is 0.06%.
The vapor phase from the top of the rectification column is introduced into the adsorption unit of molecular sieves (P-16/C-101). The 7300 L column removes 95% of the water. Pure 99.56% bioethanol is cooled to 20 °C in a heat exchanger (P-17/HX-104) with a heat exchange surface of 71.9 m2, and placed into storage. The heat transfer medium is chilled water, with a throughput of 345,444 L/h.

3. Results and Discussion

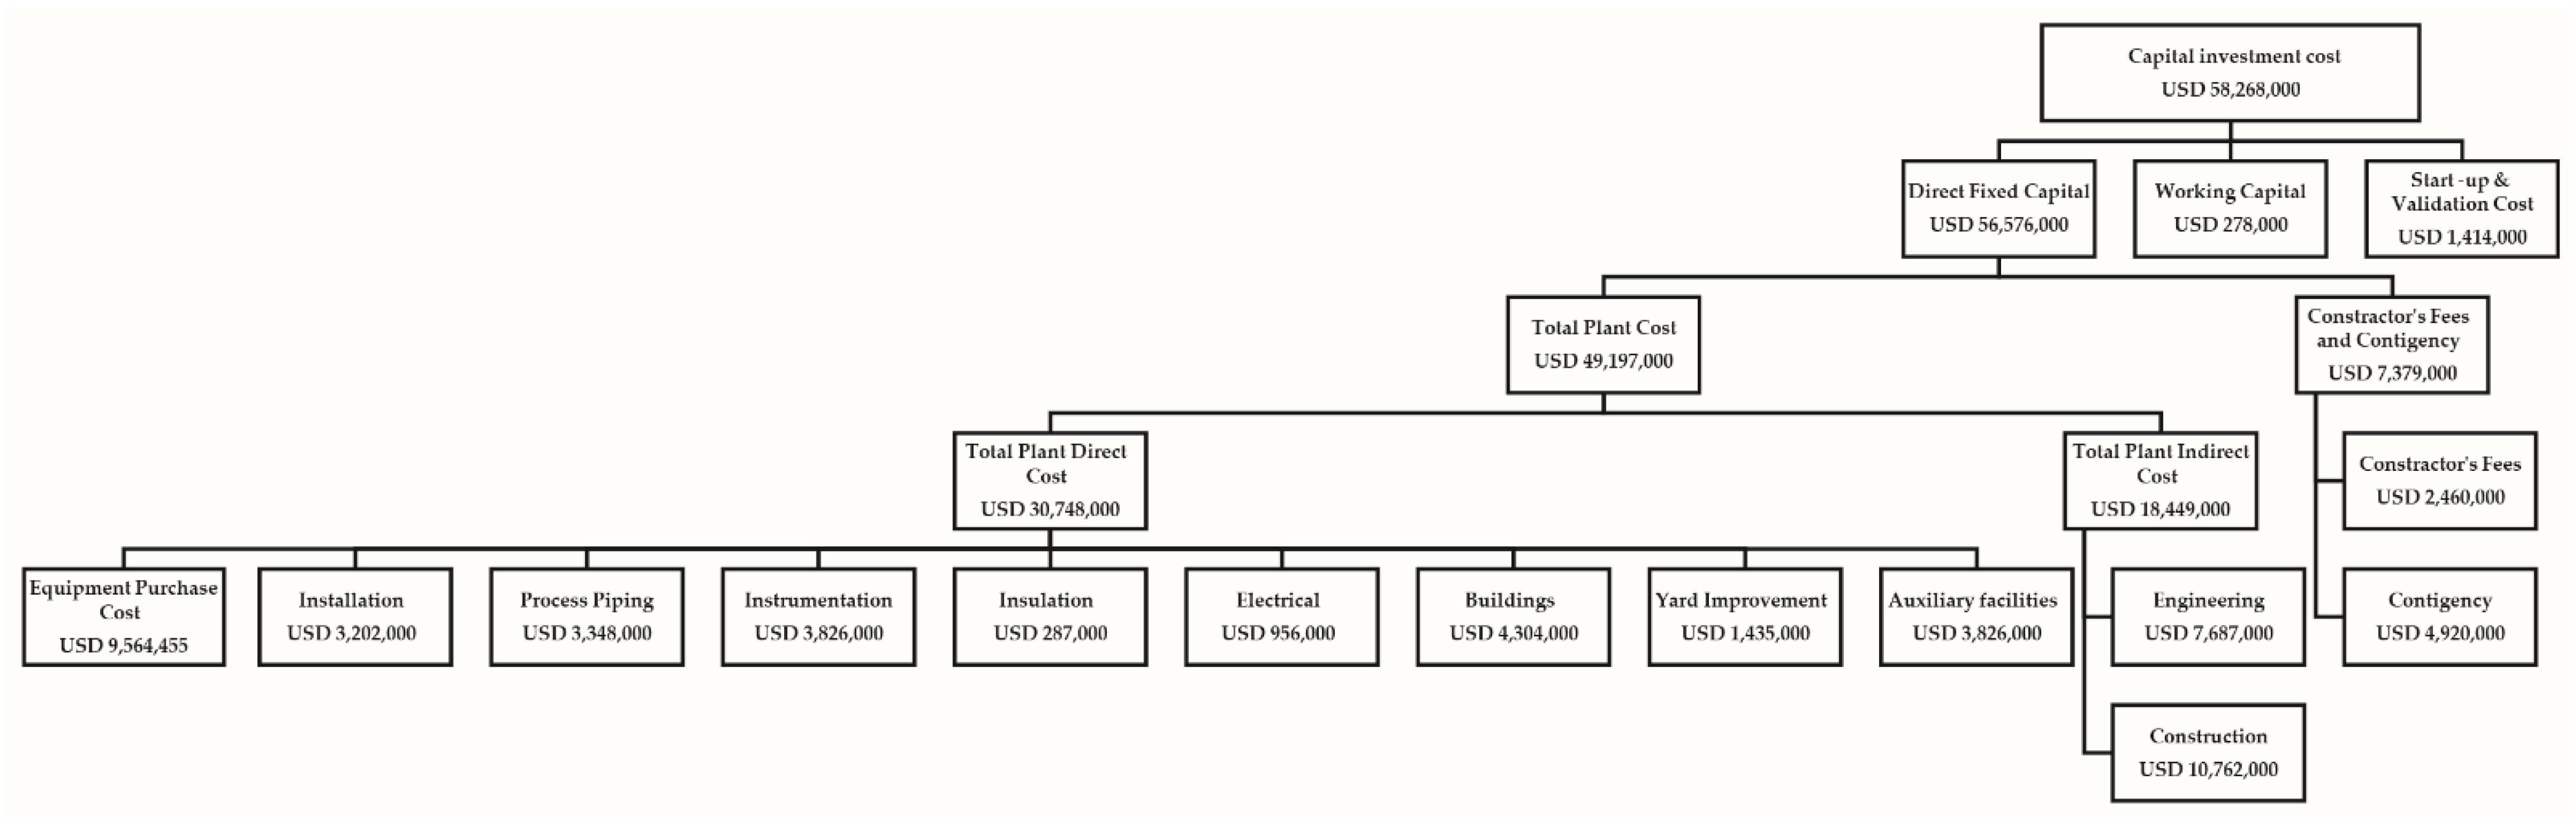
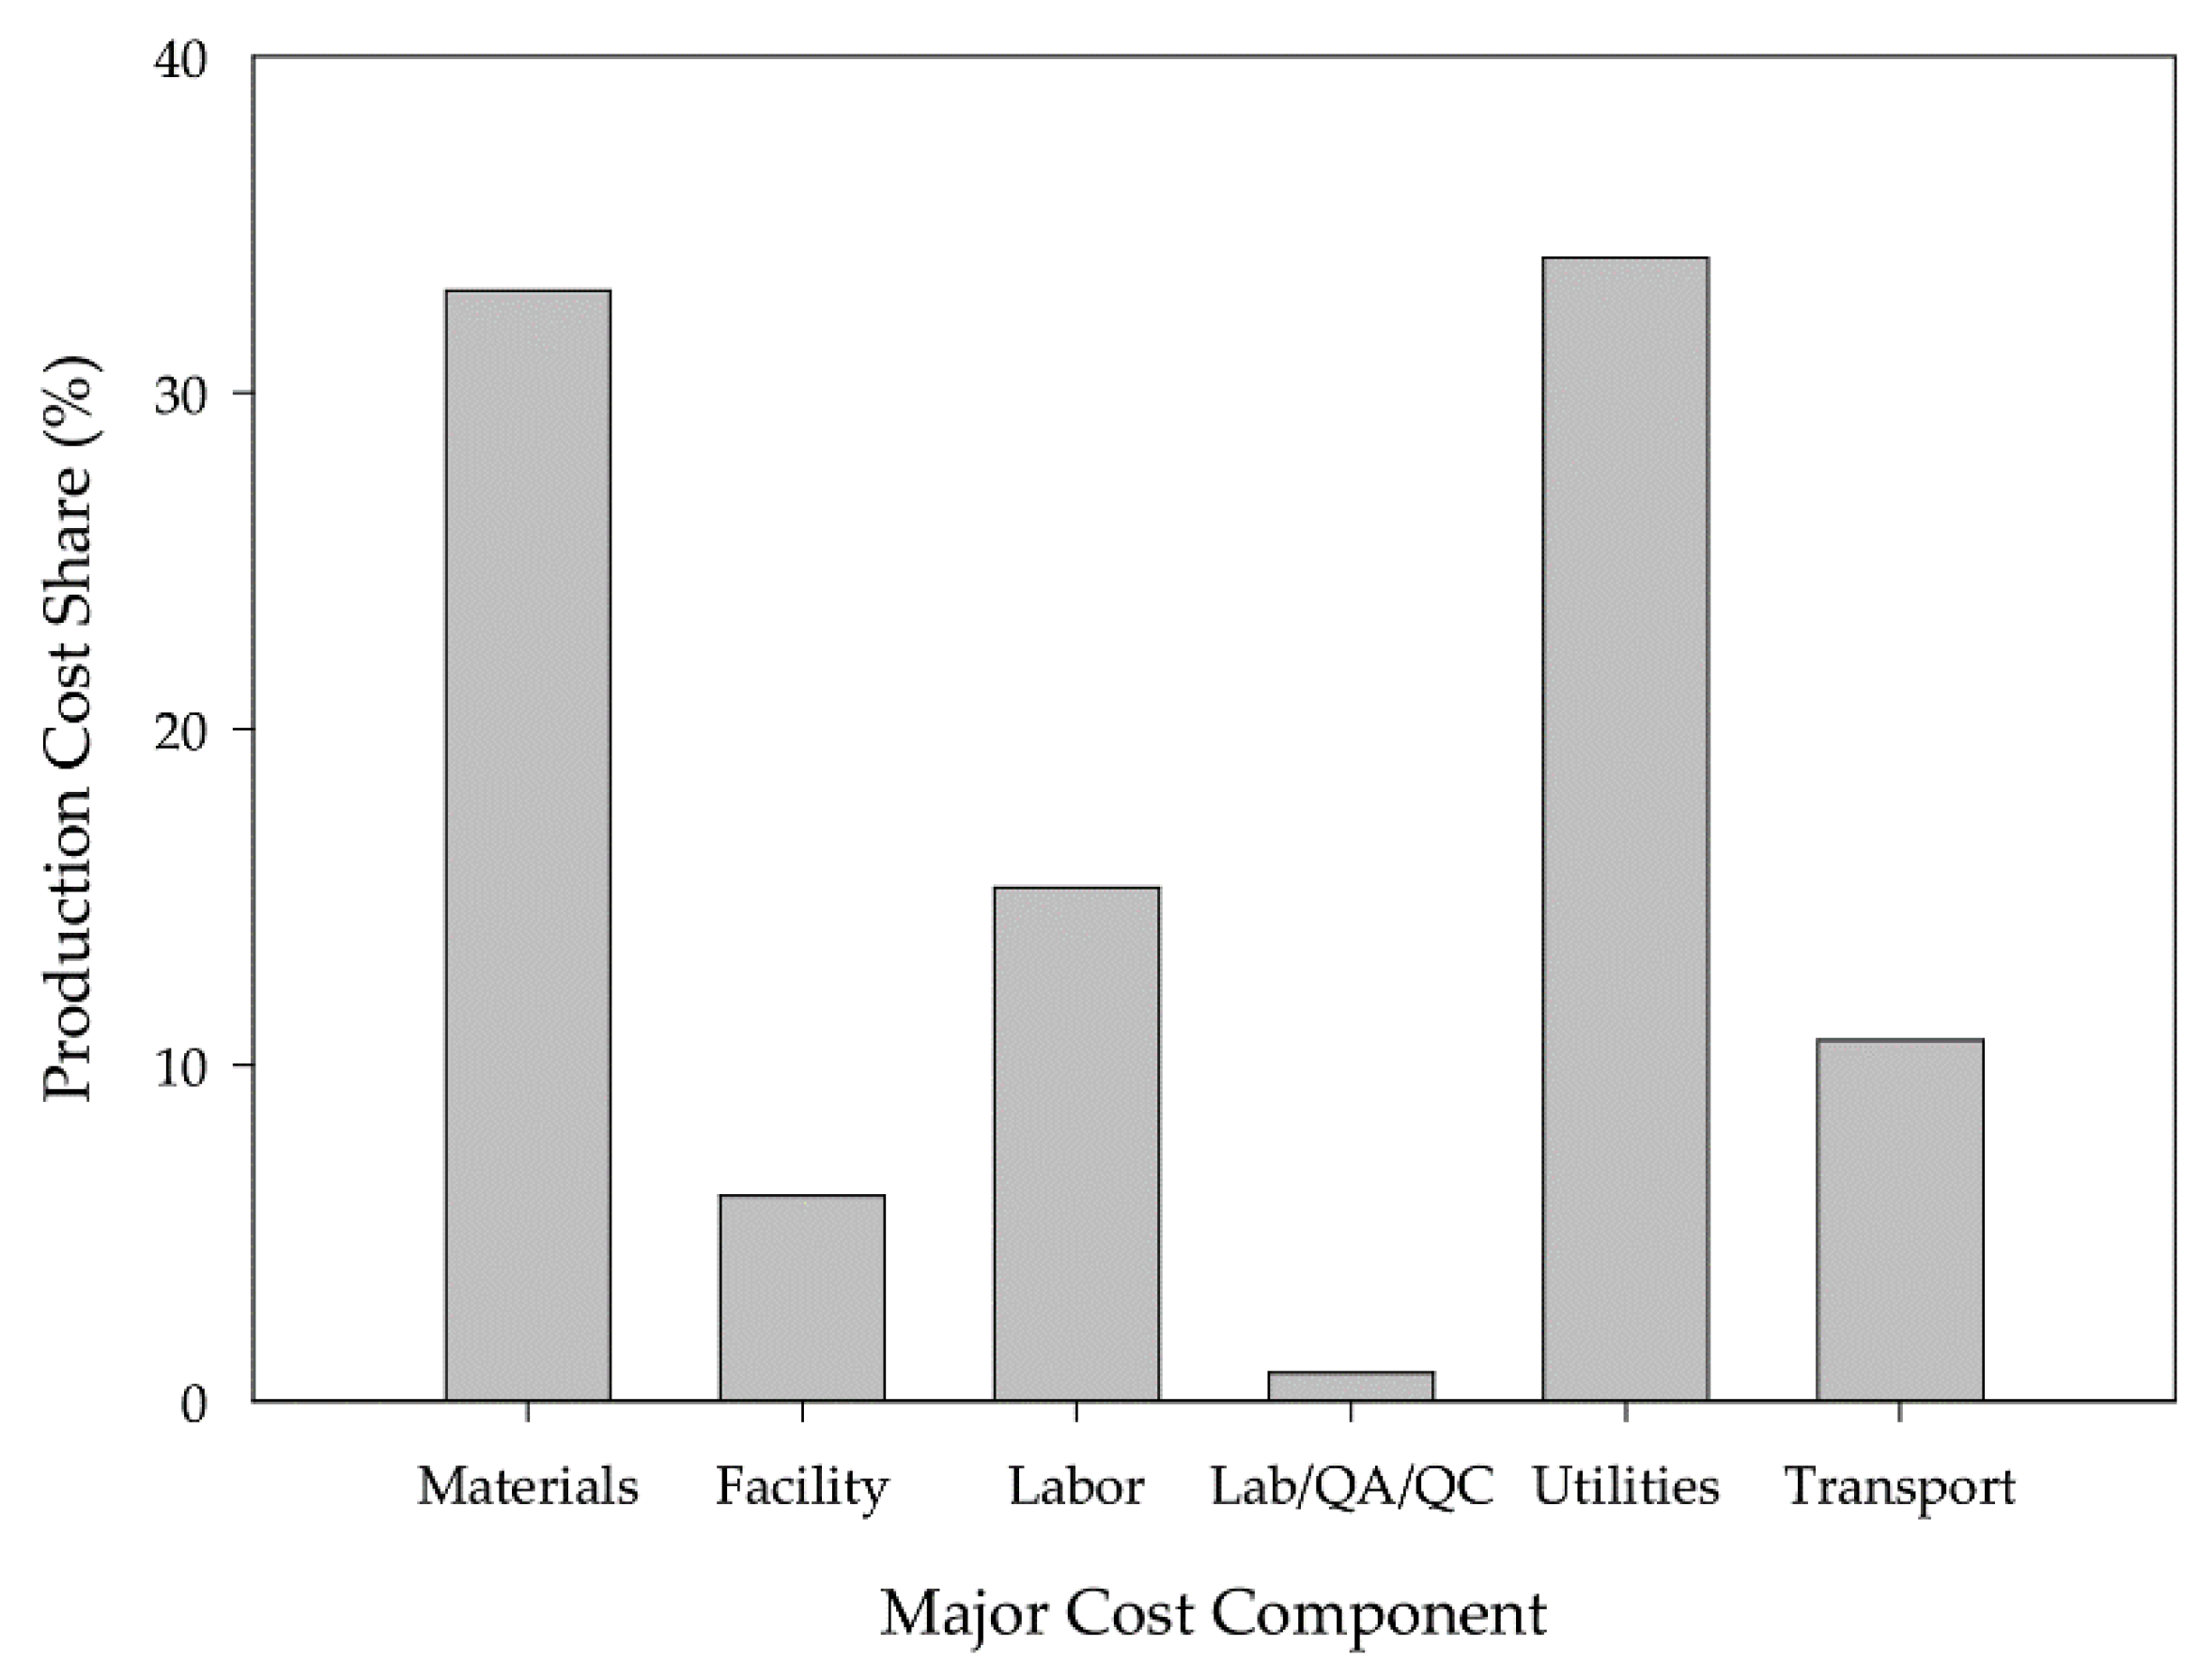
3.1. Economic Analysis

Figure 4 represents the results of the economic analysis, and provides a detailed breakdown of the capital investment costs for this process model. This form of presentation of these results was chosen in order to distinctly show how each cost item is generated by adding up the previous ones. For example, the capital investment cost is obtained by adding together the direct fixed capital (DFC), working capital, and start-up and validation costs; the DFC is the sum of the total plant cost (TPC) and contractor’s fees and contingencies, etc.
It should also be noted that the purchase price of major equipment in Figure 4 was obtained from local and foreign equipment suppliers. However, if the suppliers and modeled equipment capacities did not match, the following equation was used to obtain the appropriate price:
P M = P S   ( C M C S ) 0.6
where PM is the estimated price (USD) of the modeled equipment item with the capacity CM (L, kW, kg/h, or something else), while PS is the supplier’s price (USD) of the same equipment item with its available capacity CS, which has the same units as the modeled capacity CM.
As seen in Figure 4, the estimated capital investment that should be charged to this project is USD 58,268,000. However, the bioethanol industry practice is to multiply the total equipment purchase cost by three in order to obtain the total capital investment, which would lower the current capital expenses by almost 50%. Other studies also reported this type of difference in their capital cost estimations [22,32], demonstrating that this industry feedback is valid only in the initial phase of process modelling, when there is a lack of real data.
Unit production cost breakdown is shown in Figure 5, which shows that the two key parameters are the raw materials and the utilities, each with over 30% share in the bioethanol-production cost. Spent sugar beet pulp, as a primary feedstock, has a major impact on the cost of producing bioethanol, due to the high quantities used per batch. The price of spent sugar beet pulp changes with changes to the price of sugar beet, as a result of market and weather conditions. For this reason, a 10-year average price was used in the model. Likewise, the required quantities of biomass (yeast), cellulase enzymes, H2SO4, and lime were defined by the model, and their prices are 1.15, 0.08, 0.07, and 0.07 USD/kg, respectively.
On the other hand, utilities also play a major role in unit production costs, due to the high energy demand in the pretreatment and separation phase of the process. Prices for steam, electricity and chilled water are 12.00 USD/MT, 0.1 USD/kWh, and 0.4 USD/MT, respectively.
The prices for all materials, raw material, utilities, and byproducts were obtained from official reports and personal consultations with suppliers [23,33].
Since the bottoms (water) of the rectifier column and molecular sieves are recycled into the pretreatment reactor, the need for industrial water is reduced to a minimum.
Since the variability of raw material prices has been taken into account, the energy efficiency (utilities exploitation) has been examined through different model scenarios.

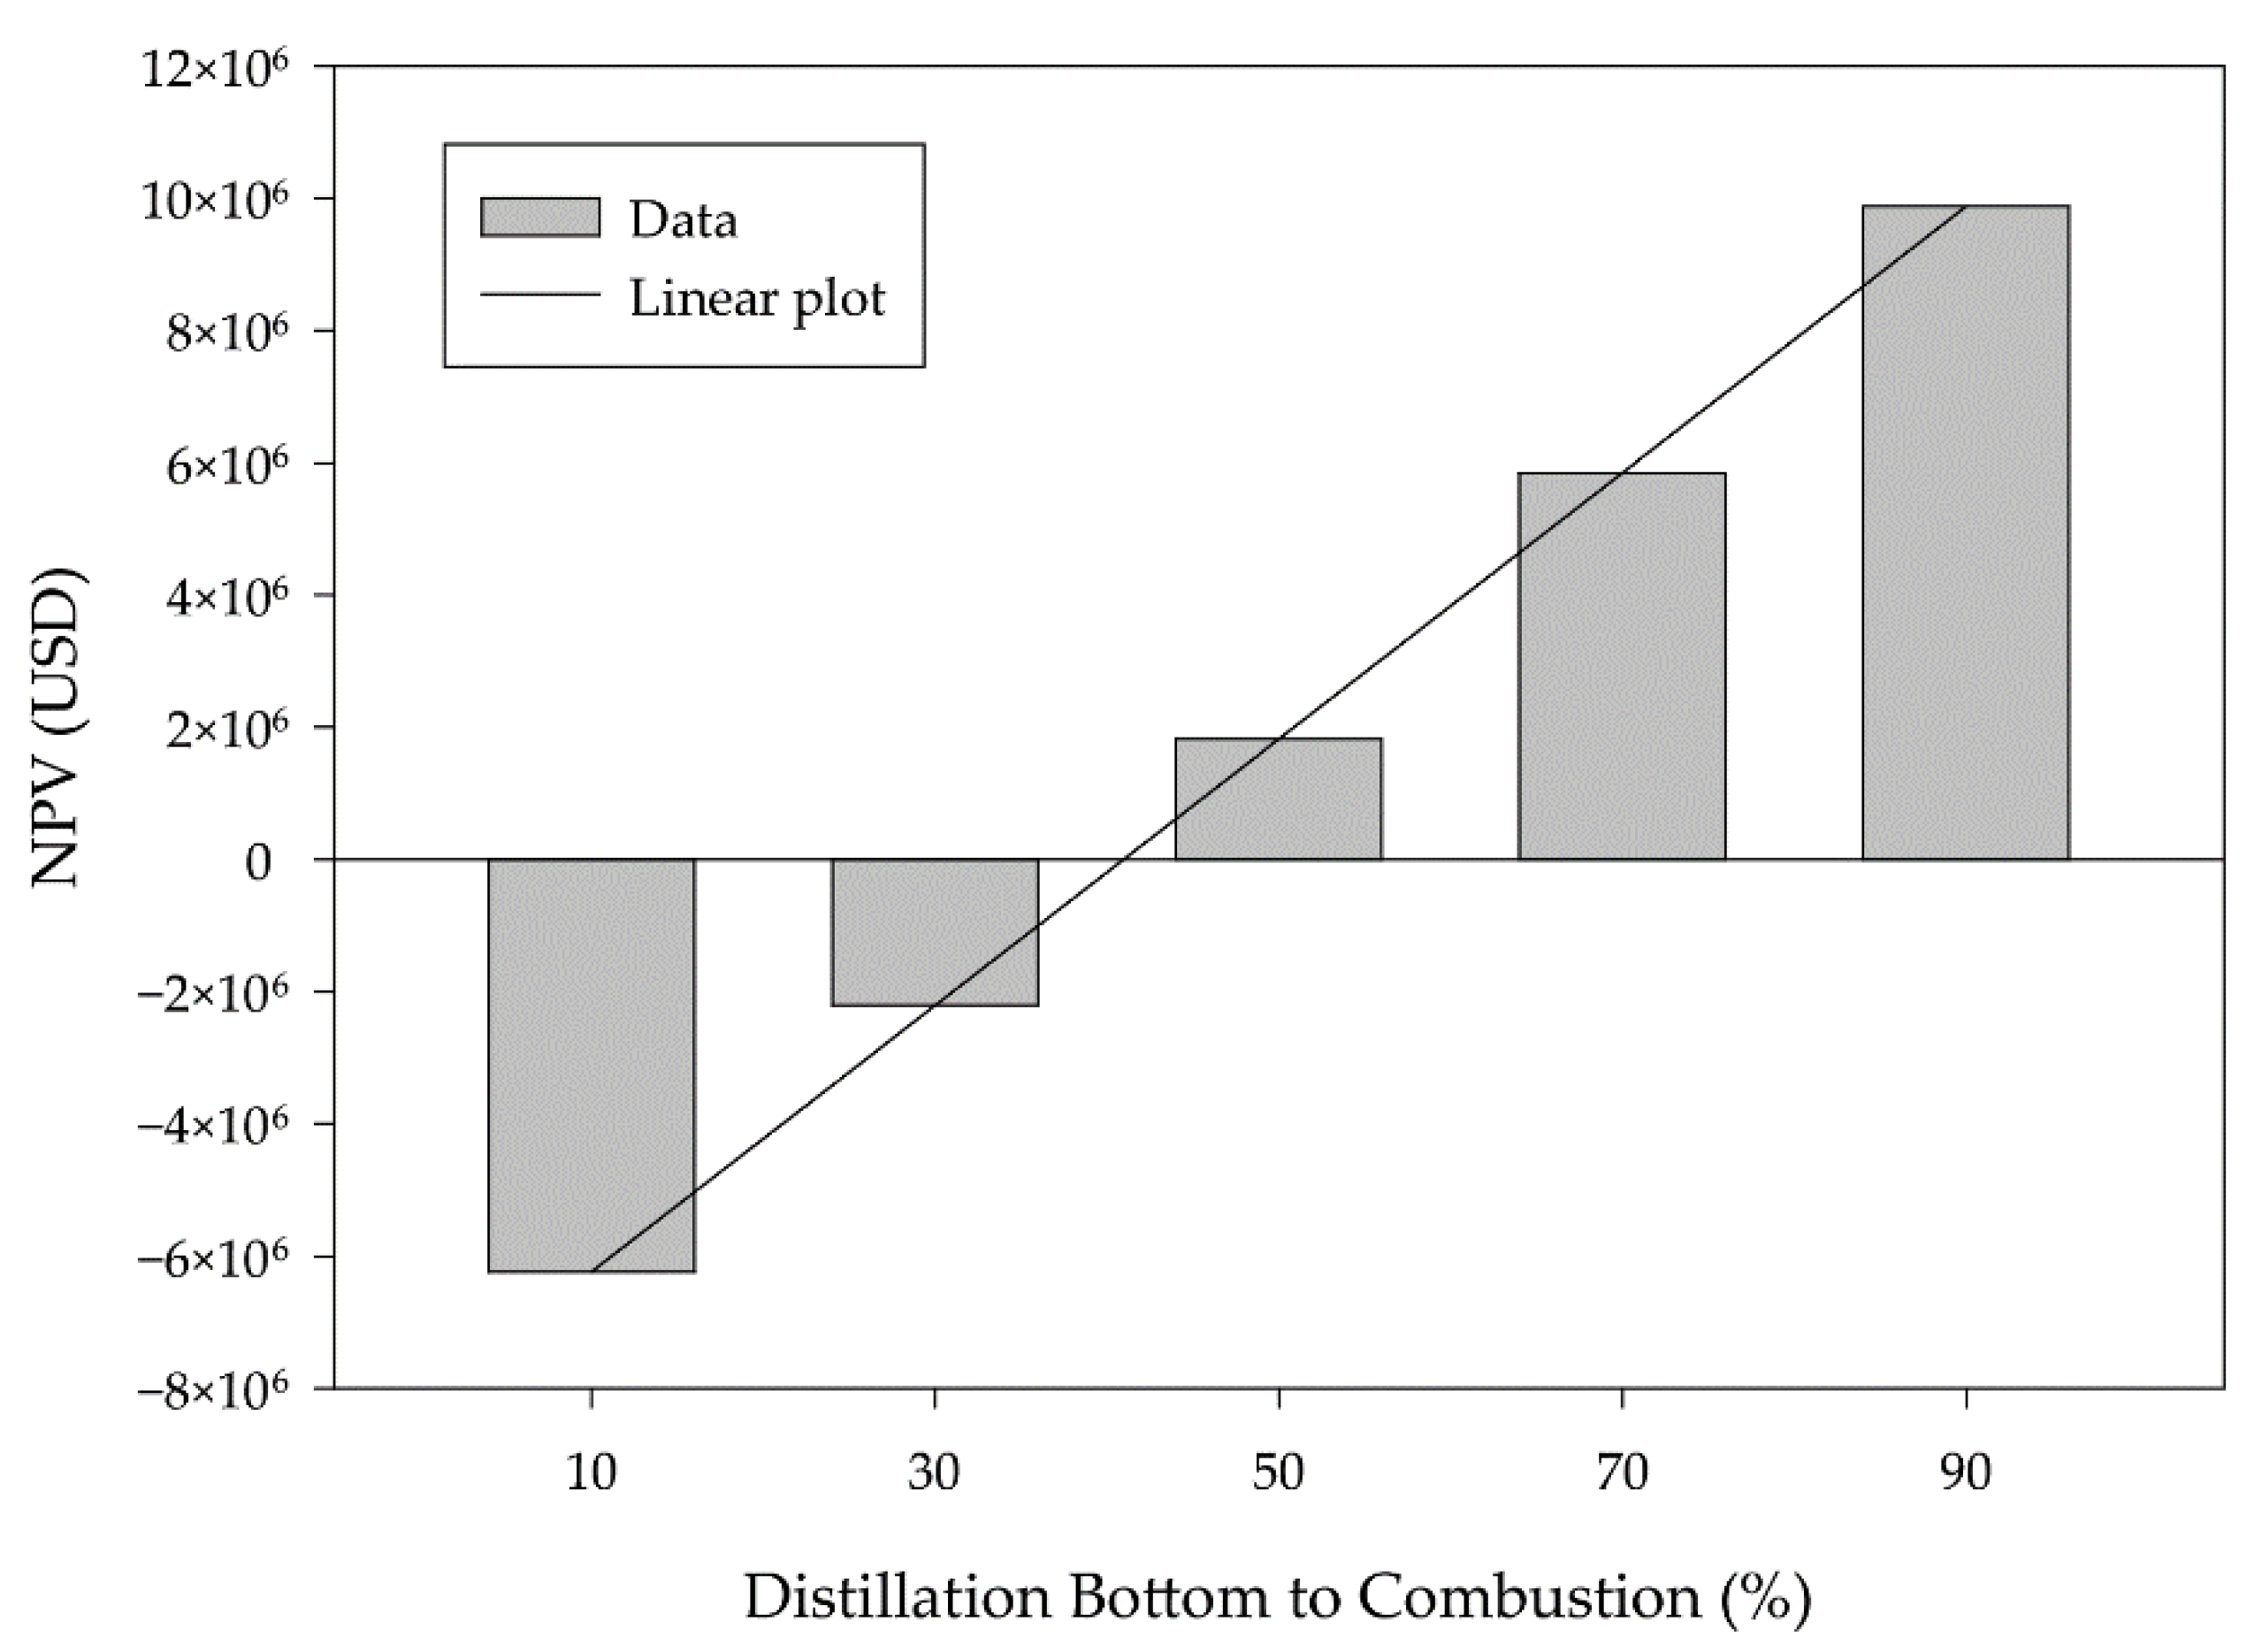
3.2. Scenario and Sensitivity Analysis

There are several products that can be obtained in the process of spent sugar beet conversion to bioethanol. Bioethanol, as the main product, is intended to be sold as a renewable fuel, i.e., a substitute for fossil fuels (gasoline). Hence, its price was taken from the Global Petrol Prices website [34], used in the model as 1.07 USD/kg (~0.84 USD/L). Co-products of the examined model are carbon dioxide and animal feed. Carbon dioxide from fermentation can be sold to food and beverage producers for the price of 0.015 USD/kg. The bottoms from the distillation column, containing the nonfermented parts of the pulp and yeasts, can be dried, thus obtaining animal feed with a market price of 0.05 USD/kg. On the other hand, the dried distillation stillage can be used in combustion to generate heat for the process, thus lowering the need for buying steam and lowering operating costs. Table 4 shows the economic indices of the model for the two examined scenarios, i.e., when the stillage is used for feed or for combustion.
Gross margin helps a company assess the profitability of its manufacturing activities, i.e., the higher the value of this parameter, the more capital a company retains. It equates to revenue minus cost of goods sold divided by revenue. Return on investment (ROI) is used to calculate the investor’s benefit compared to their investment cost, and it is determined as net income divided by the capital cost of the investment. In general, the higher the ROI, the greater the benefit earned. Payback time is the most important static method in investment calculations. It represents how long it will take to get back the money that has been invested, and it is often used because it is easy to apply and understand. If a project pays back its investment in five years, it is better than a project with a 10-year payback time. Net present value (NPV) is the present value of the cash flow at the required rate of return of a project compared to the initial investment. In other words, NPV considers the time value of money, translating future cash flows into today’s dollars. A project is acceptable if it has a positive value of NPV. The internal rate of return (IRR) is defined as the discount rate which, when applied to the cash flow of a project, produces an NPV equal to zero. This discount rate can then be thought of as the forecast return for the project. If the IRR is greater than a preset percentage target (7% in this case), the project can be accepted. If the IRR is less than the target, the project is rejected.
Comparing the two scenarios from Table 4, it turns out that the one with the stillage combustion is more favorable. Moreover, the negative value of NPV, as well as the IRR value lower than 7% for the feed scenario, makes it arid for investment. Likewise, the payback time for acceptable projects in practice should be lower, or around 7 years, which is not the case for the scenario where the dried stillage is used as animal feed.
Since the only project index that became undesirable in the scenario analysis was NPV (IRR is tied to NPV), it was interesting to examine how using one part of the stillage for combustion and the other remaining part for animal feed would influence this economic parameter, i.e., at which the ratio of combustion/feed is NPV equal to zero. By varying the percentage of the amount of stillage going to combustion from 10 to 90% (by 20 increments), which meant that, on the other side, 90 to 10% of stillage was going to animal feed production, the effect of this split on NPV was obtained and is shown in Figure 6. The bars in Figure 6 represent the obtained data for NPV, while the line shows the linear connection between NPV and stillage to combustion percentage, which was obtained after fitting a linear equation into the data obtained. The equation is as follows:
N P V =   8,252,807.650 + 201,403.985   S T C
where STC is the percentage of stillage sent to combustion. From the intersection of the linear plot and X-axis in Figure 6, as well as from the above equation, the percentage of combusted stillage should be 40.97% for the NPV to be 0.
At this ratio of combustion/feed, the economic indices are as follows: gross margin—64.81%, return on investment—13.24%, payback time—7.55 years, and internal rate of return—6.99%. This means that the project is economically viable, with nearly 60% of the distillation stillage usable for animal feed.

4. Conclusions

The developed process model for bioethanol production presents the base case for processing about 17,000 tons of spent sugar beet pulp annually. A cost model has been developed for an economic analysis of this bioethanol production from spent sugar beet pulp. The obtained distillation stillage can be used as animal feed or for combustion to generate heat for the process, thus lowering the need for utilities and reducing operating costs. Therefore, two scenarios were assessed: when stillage is used for animal feed and when it is used for combustion, as well as at what split ratio of combustion/feed for the stillage is acceptable. Comparing the two scenarios, results showed that the scenario with the stillage combustion is more favorable. The results obtained for the stillage split factor showed that this project becomes economically viable when approximately 40% of the distillation stillage or more is used for generating power, with the remaining being exploited as animal feed.

Author Contributions

D.V., B.B. and S.D.; methodology, D.V. and B.B.; data collection and analysis, V.V. and R.J.-M.; writing—original draft preparation, B.B., V.V. and R.J.-M.; writing—review and editing, D.V. and S.D.; supervision, D.V. and S.D. All authors have read and agreed to the published version of the manuscript.

Funding

This work was supported by the Ministry of Education, Science and Technological Development of the Republic of Serbia (Grant no. 451-03-68/2022-14/200134).

Institutional Review Board Statement

Not applicable.

Informed Consent Statement

Not applicable.

Data Availability Statement

Not applicable.

Conflicts of Interest

The authors declare no conflict of interest. The funders had no role in the design of the study, nor in the collection, analyses, or interpretation of the data, nor in the writing of the manuscript, nor in the decision to publish the results.

References

  1. Alexandri, M.; López-Gómez, J.P.; Olszewska-Widdrat, A.; Venus, V. Valorising Agro-industrial Wastes within the Circular Bioeconomy Concept: The Case of Defatted Rice Bran with Emphasis on Bioconversion Strategies. Fermentation 2020, 6, 42. [Google Scholar] [CrossRef]
  2. Martins, F.; Felgueiras, C.; Smitkova, M.; Caetano, N. Analysis of Fossil Fuel Energy Consumption and Environmental Impacts in European Countries. Energies 2019, 12, 964. [Google Scholar] [CrossRef] [Green Version]
  3. Dodić, S.; Vučurović, D.; Popov, S.; Dodić, J.; Zavrago, Z. Concept of cleaner production in Vojvodina. Renew. Sust. Energ. Rev. 2010, 14, 1629–1634. [Google Scholar] [CrossRef]
  4. Tse, T.J.; Wiens, D.J.; Reaney, M.J.T. Production of Bioethanol—A Review of Factors Affecting Ethanol Yield. Fermentation 2021, 7, 268. [Google Scholar] [CrossRef]
  5. Branco, R.H.R.; Serafim, L.S.; Xavier, A.M.R.B. Second Generation Bioethanol Production: On the Use of Pulp and Paper Industry Wastes as Feedstock. Fermentation 2019, 5, 4. [Google Scholar] [CrossRef] [Green Version]
  6. Directive (Eu) 2018/2001 of the European Parliament and of the Council, Official Journal of the European Union. 2018. Available online: https://eur-lex.europa.eu/eli/dir/2018/2001/oj (accessed on 29 December 2021).
  7. Energy Sector Development Strategy of the Republic of Serbia until 2025 with Projections until 2030, Official Gazette of RS, No. 101/2015, Belgrade. 2015. Available online: https://www.pravno-informacioni-sistem.rs/SlGlasnikPortal/eli/rep/sgrs/skupstina/ostalo/2015/101/1/r (accessed on 29 December 2021).
  8. Anwar, Z.; Gulfraz, M.; Irshad, M. Agro-industrial lignocellulosic biomass a key to unlock the future bio-energy: A brief review. J. Radiat. Res. Appl. Sci. 2014, 7, 163–173. [Google Scholar] [CrossRef]
  9. Ning, P.; Yang, G.; Hu, L.; Sun, J.; Shi, L.; Zhou, Y.; Wang, Z.; Yang, J. Recent advances in the valorization of plant biomass. Biotechnol. Biofuels 2021, 14, 102. [Google Scholar] [CrossRef]
  10. Rezić, T.; Oros, D.; Marković, I.; Kracher, D.; Ludwig, R.; Šantek, B. Integrated Hydrolyzation and Fermentation of Sugar Beet Pulp to Bioethanol. J. Microbiol. Biotechnol. 2013, 23, 1244–1252. [Google Scholar] [CrossRef] [Green Version]
  11. Gumienna, M.; Szambelan, K.; Jeleń, H.; Czarnecki, Z. Evaluation of ethanol fermentation parametersfor bioethanol production from sugar beet pulp and juice. J. Inst. Brew. 2014, 120, 543–549. [Google Scholar] [CrossRef]
  12. Mood, S.H.; Golfeshan, A.H.; Tabatabaei, M.; Jouzani, G.S.; Najafi, G.H.; Gholami, M.; Ardjmand, M. Lignocellulosic biomass to bioethanol, a comprehensive review with a focus on pretreatment. Renew. Sust. Energ. Rev. 2013, 17, 77–93. [Google Scholar] [CrossRef]
  13. Vasić, K.; Knez, Ž.; Leitgeb, M. Bioethanol Production by Enzymatic Hydrolysis from Different Lignocellulosic Sources. Molecules 2021, 26, 753. [Google Scholar] [CrossRef] [PubMed]
  14. Awoyale, A.A.; Lokhat, D. Experimental determination of the effects of pretreatment on selected Nigerian lignocellulosic biomass in bioethanol production. Sci. Rep. 2021, 11, 557. [Google Scholar] [CrossRef] [PubMed]
  15. Heinzle, E.; Biwer, A.P.; Cooney, C.L. Development of Sustainable Bioprocesses: Modeling and Assessment; John Wiley & Sons: Chichester, UK, 2006. [Google Scholar]
  16. Sokolowski, J.A.; Banks, C.M. Principles of Modeling and Simulation a Multidisciplinary Approach; John Wiley & Sons: Hoboken, NJ, USA, 2009. [Google Scholar]
  17. Kumar, D.; Murthy, G.S. Impact of pretreatment and downstream processing technologies on economics and energy in cellulosic ethanol production. Biotechnol. Biofuels. 2011, 4, 27. [Google Scholar] [CrossRef] [PubMed] [Green Version]
  18. Mupondwa, E.; Li, X.; Tabil, L. Integrated bioethanol production from triticale grain and lignocellulosic straw in Western Canada. Ind. Crops Prod. 2018, 117, 75–87. [Google Scholar] [CrossRef]
  19. Barrera, I.; Amezcua-Allieri, M.A.; Estupinan, L.; Martínez, T.; Aburto, J. Technical and economical evaluation of bioethanolproduction from lignocellulosic residues in Mexico:Case of sugarcane and blue agave bagasses. Chem. Eng. Res. Des. 2016, 107, 91–101. [Google Scholar] [CrossRef]
  20. Abdullah, S.S.S.; Shirai, Y.; Ali, A.A.M.; Mustapha, M.; Hassan, M.A. Case study: Preliminary assessment of integrated palm biomass biorefinery for bioethanol production utilizing non-food sugars from oil palm frond petiole. Energy Convers. Manag. 2016, 108, 233–242. [Google Scholar] [CrossRef] [Green Version]
  21. Ferrari, M.D.; Guigou, M.; Lareo, C. Energy consumption evaluation of fuel bioethanol production from sweet potato. Bioresour. Technol. 2013, 136, 377–384. [Google Scholar] [CrossRef]
  22. Vučurović, D.; Dodić, S.; Popov, S.; Dodić, J.; Grahovac, J. Process model and economic analysis of ethanol production from sugar beet raw juice as part of the cleaner production concept. Bioresour. Technol. 2012, 104, 367–372. [Google Scholar] [CrossRef]
  23. Statistical Yearbook of the Republic of Serbia; Statistical Office of the Republic of Serbia: Belgrade, Serbia, 2021.
  24. Hutnan, M.; Drtil, M.; Mrafkova, L. Anaerobic biodegradation of sugar beet pulp. Biodegradation 2000, 11, 203–211. [Google Scholar] [CrossRef]
  25. Ivetić, D.; Šćiban, M.; Antov, M. Enzymatic hydrolysis of pretreated sugar beet shreds: Statistical modeling of the experimental results. Biomass Bioenergy 2012, 47, 387–394. [Google Scholar] [CrossRef]
  26. Rana, A.K.; Gupta, V.K.; Newbold, J.; Roberts, D.; Rees, R.M.; Krishnamurthy, S.; Thakur, V.K. Sugar beet pulp: Resurgence and trailblazing journey towards a circular bioeconomy. Fuel 2022, 312, 122953. [Google Scholar] [CrossRef]
  27. Balat, M.; Balat, H.; Oz, C. Progress in bioethanol processing. Prog. Energy Combust. Sci. 2008, 34, 551–573. [Google Scholar] [CrossRef]
  28. Zheng, Y.; Yu, C.; Cheng, Y.S.; Zhang, R.; Jenkins, B.; VanderGheynst, J.S. Effects of ensilage on storage and enzymatic degradability of sugar beet pulp. Bioresour. Technol. 2011, 102, 1489–1495. [Google Scholar] [CrossRef]
  29. Vohra, M.; Manwar, J.; Manmode, R.; Padgilwar, S.; Patil, S. Bioethanol production: Feedstock and current technologies. J. Environ. Chem. Eng. 2014, 2, 573–584. [Google Scholar] [CrossRef]
  30. Asadi, M. Beet-Sugar Handbook; John Wiley & Sons: Hoboken, NJ, USA, 2007. [Google Scholar]
  31. Marzo, C.; Diaz, A.B.; Caro, I.; Blandino, A. Conversion of Exhausted Sugar Beet Pulp into Fermentable Sugars from a Biorefinery Approach. Foods 2020, 9, 1351. [Google Scholar] [CrossRef] [PubMed]
  32. Bajić, B.; Vučurović, D.; Dodić, S.; Grahovac, J.; Dodić, J. Process model economics of xanthan production from confectionery industry wastewaters. J. Environ. Manag. 2017, 203, 999–1004. [Google Scholar] [CrossRef] [PubMed]
  33. Power Industry of Serbia, Annual Report for 2020. Available online: Epsdistribucija.rs/pdf/GI_2020.pdf (accessed on 29 December 2021).
  34. Global Petrol Prices. Available online: https://www.globalpetrolprices.com/ethanol_prices/ (accessed on 29 December 2021).
Figure 1. Process flow diagram of the process of bioethanol production from spent sugar beet pulp, consisting of reception (transportation and storage) and preparation (shredding) stages.
Fermentation 08 00114 g001
Figure 2. Process flow diagram of the bioethanol production process from spent sugar beet pulp, consisting of pretreatment (acid hydrolysis) and saccharification (enzyme hydrolysis) stages.
Fermentation 08 00114 g002
Figure 3. Process flow diagram of the bioethanol production process from spent sugar beet pulp, consisting of fermentation and product separation (distillation, rectification, and dehydration) stages.
Fermentation 08 00114 g003
Figure 4. Detailed breakdown of the capital investment costs for the bioethanol-production plant from spent sugar beet pulp.
Fermentation 08 00114 g004
Figure 5. The share of the major cost components in the total operating costs for the modeled spent sugar beet pulp bioethanol production plant.
Fermentation 08 00114 g005
Figure 6. Spent sugar beet pulp bioethanol production process model net present value (NPV) as a function of stillage to combustion percentage.
Fermentation 08 00114 g006
Table 1. Pretreatment reactions with reaction extents.
ReactionReferent ComponentReaction Extent (%)
Cellulose + nWater → nGlucoseCellulose7.7
Cellulose + 1/2nWater → 1/2nCellobioseCellulose0.7
Hemicellulose + nWater → nXyloseXylan92.5
(Lignin)n → nSoluble LigninHemicellulose5
Table 2. Hydrolysis reactions and reaction extents.
ReactionReferent ComponentReaction Extent (%)
Cellulose + 1/2nWater → 1/2n CellobioseCellulose1.2
Cellulose + nWater → nGlucoseCellulose90
Cellobiose + Water → 2GlucoseCellobiose100
Table 3. Reactions and reaction extents for the fermentation process.
ReactionReferent ComponentReaction Extent (%)
Glucose → 2Bioethanol + 2Carbon dioxideGlucose90
Glucose + 5.7Other compounds → 6Biomass + 2.87Oxygen + 2.4WaterGlucose4
Glucose + 2Water → 2Glycerol + OxygenGlucose0.4
Glucose + 2 Carbon dioxide → Oxygen + 2Succinic acidGlucose0.6
Glucose → 3Acetic acidGlucose1.5
Glucose → 2 Lactic acidGlucose0.2
3Xylose → 5Bioethanol + 5 Carbon dioxideXylose80
Xylose + 4.67 Other compounds → 5Biomass + 2.35Oxygen + 2WaterXylose4
3Xylose + 5Water → 5Glycerol + 2.5OxygenXylose0.3
Xylose + Water → Xylitol + 0.5 OxygenXylose4.6
3Xylose + 5Carbon dioxide → 2.5Oxygen + 5Succinic acidXylose0.9
2 Xylose → 5Acetic acidXylose1.4
3 Xylose → 5Lactic acidXylose0.2
Table 4. Different model scenarios for process co-products.
Project IndicesCombustion ScenarioAnimal Feed Scenario
Gross margin (%)69.1161.05
Return on investment (%)16.0811.27
Payback time (years)6.228.88
Internal rate of return (%)10.224.55
Net present value at 7.00% (USD)11,887,591−8,252,807
Publisher’s Note: MDPI stays neutral with regard to jurisdictional claims in published maps and institutional affiliations.

