Abstract
High antioxidant levels in food are gradually becoming popular because of enhanced risk of oxidative stress in humans. Bread wheat is rich in vital antioxidants, but a major portion of its bioactive compounds are not available to humans. This study was conducted with the aim to fulfill the antioxidants and nutrients gap between the available and potential levels of wheat grains through fermentation by Bacillus subtilis KCTC 13241. In this experiment, the whole wheat grains were used by keeping in consideration the importance of minerals and to measure an increase in their availability after fermentation. The antioxidants and nutritional potential of different wheat varieties was determined by DPPH (2,2-diphenyl-1-picryl- hydrazyl) and ABTS (3-ethyl-benzothiazo- line-6-sulfonic acid) radical scavenging assays as well as by the concentration of amino acids, flavonoids, minerals, carbohydrates and phenolic compounds. Different wheat varieties were showed different free radical scavenging potential after fermentation, which was significantly higher with respect to their corresponding unfermented wheat varieties. The highest nutritional and free radical scavenging potential was found in a fermented wheat variety, named Namhae, and this combination is highly useful for cereal-based food industries.
1. Introduction
Globally, cereals are the most important part of the human diet and a source of protein, carbohydrates, fibers, minerals and vitamins. Processing cereal products is important both for nutritive and sensorial properties. Microbial fermentation, the conversion of complex organic molecules into simpler ones such as amino acids, peptides, etc., has been commonly used to improve the nutritional quality of foodstuff [1]. These peptides and amino acids are potent natural antioxidants [2]. Consumption of food products manufactured by using an unfermented whole grain of cereals has been coupled with some chronic diseases, such as diabetes, cancer, etc. [3].
Wheat is a staple food of the people of temperate regions and ranks second in overall production after maize. It contains numerous phenolic compounds, namely vanillic, caffeic, ferulic, salicylic, p-coumaric, gentisic, sinapic acids and syringic [4]. Polyphenolics have diverse biological properties, including antioxidant, anti-inflammatory and anti-microbial properties [5]. In wheat, phenolics are usually present in conjugated form with proteins, sugars and fatty acids. Thus, the hydrolysis process must be adopted to get them available in wheat grains [3]. Some studies reported that total phenolics in cereals were significantly enhanced by microbial fermentation [6]. However, other hydrolysis processes, such as enzymatic reaction, could not be adopted because of the highly expensive enzymes required for the reaction.
Fermentation with Bacillus subtilis has been employed globally for making proteinases in the past few decades [7]. In microbial fermentation, microorganisms release a number of carbohydrates like xylanase, cellulases, esterase and pectinases, which convert bound phenolics to available form [8]. Phenolics have potentially been used to prevent different chronic disease, including cancer, diabetes mellitus, cardiovascular disease, neurodegenerative diseases and osteoporosis [9].
Thus, those people who are eating raw wheat grains in any form suffer from health complications. The main objective of this experiment is to check the hidden nutritional and antioxidants potential of different wheat varieties and possibility of increase in their level by fermentation with Bacillus subtilis KCTC 13241 to avoid these health complications. Bacillus subtilis KCTC 13241 was selected for fermentation on the basis that this strain was already employed in the fermentation of soybean, peanut, Moringa, etc. [10,11,12] and it was reported as the best strain among all. A lot of rat studies were also conducted to check its potential as a probiotic and no negative results have been found.
2. Materials and Methods
2.1. Reagents
Acetonitrile, HPLC grade water and methanol were bought from Fisher Scientific (Fairlawn, OH, USA). Ferric chloride, 2,4,6-tripyridyl-s-triazine, sodium acetate, rutin, glacial acetic acid, 2,2-azinobis (3-ethyl-benzothiazoline-6-sulfonic acid), Folin–Ciocalteu phenol reagent and potassium per sulfate were purchased from Sigma Chemical Co. (St. Louis, MO, USA). All chemicals were of analytical grade.
2.2. Inoculum Preparation
A formerly isolated and purified strain, B. subtilis KCTC 13241, was employed in the fermentation of wheat grains. Under laboratory conditions, B. subtilis was retained on the slants of nutrient agar. For the preparation of inoculum, the active culture of microbes was streaked on the slants of nutrient agar and incubated at 27 °C for 24 h. The newly grown active cells were collected in sterilized distilled water. After adjusting the level of 7.43 log CFU mL−1, the suspension were utilized for the microbial fermentation of cooked wheat grains [11].
2.3. Preparation of Fermented Wheat
There were four varieties of wheat used in this experiment, named Baekjoong, Jeokjoong, Milseoung and Namhae. Twenty grams of wheat grain were taken in Erlenmeyer flasks of 250 mL mixed with 20 mL of distilled water, steamed at 130 °C for 20 minutes and eventually cooled to room temperature. Steamed substrates were then inoculated with bacterial suspension and incubated at 25 °C for 3 days and named fermented wheat (FW). On the other hand, the same inoculated wheat varieties were immediately frozen instead of incubation and named as cooked wheat (CW) as a control. The experiment was repeated three times.
2.4. Viable Cell Number
One gram sample plus nine milliliters of 0.85% sodium chloride solution was mixed to get bacterial suspension. After dilution of the bacterial suspension, it was spread over an agar medium and incubated for 36 h at 27 °C to count bacterial colonies [10].
2.5. Sample Extraction
Samples extraction was performed by using the protocol of Xu and Chang [13] with few adjustments. Samples were freeze-dried and ground by using the electric grinder. The prepared samples were extracted by taking 10 grams of each sample plus 100 milliliters of 80% of methanol (v/v) and incubated for 24 hours at 25 °C. After incubation, the extracts were gone through centrifugation for 20 minutes at 3000 rpm. The collected supernatants were further filtered by using a PVDF filter of 0.45 µm Millipore (Schleicher & Schuell, GmbH, Dassel, Germany). The filtrates were kept at 4 °C in the dark for the proposed analysis.
2.6. Determination of Total Phenolic Contents
Total phenolics were estimated by the following protocol of Folin-Ciocalteu assay [14]. The methanolic extracts were filtered by a 0.2 µm syringe filter (Water, Milford, MA, USA). In total, 50 mL of methanolic extract plus 1 mL of 2% Na2CO3 (sodium carbonate) was mixed and left for 3 minutes. Then, this was mixed with 50 µL of one normal Folin–Ciocalteu phenol reagent and left for 30 minutes at 25 °C in the dark. The samples were run on a spectrophotometer (Thermal Fischer Scientific, Vantaa, Finland) to read absorbance at 750 nm wavelength against a blank sample. The concentration of total phenolics was computed by employing standard calibration curve, which was plotted by employing gallic acid and stated as µgGAE/g grain (microgram gallic acid equivalent per gram of wheat grains).
2.7. Evaluation of Total Flavonoid Content
The total flavonoid content was determined by following the method reported by Adhikari et al. [15]. Fermented wheat grains extract was mixed with equal proportion of deionized water, and then, 35 microliters of 5% sodium nitrate (NaNO3) solution was added and allowed to react for five minutes at 25 °C followed by the addition of 70 µL of 10% aluminum chloride (AlCl3). After 5 minutes, 175 mL of one molar sodium hydroxide (NaOH) was added to record absorbance immediately at 505 nm by using spectrophotometer (Thermo Fischer Scientific, Vantaa, Finland). A calibration curve was drawn by using catechin as a standard, and total flavonoids were stated as microgram catechin equivalent per gram (µgCE/g).
2.8. DPPH (2,2-diphenyl-1-picrylhydrazyl) Radical-Scavenging Assay
The free radical-scavenging activity of fermented wheat extracts was measured by using the protocol illustrated by Bilal et al. [16] with slight modifications. A total of 0.1 mM DPPH solution was freshly prepared in 99.9% pure methanol, which was used for the analysis. An equal amount of methanolic extracts plus 0.1 mM freshly prepared DPPH solution was mixed properly and kept for half an hour in the incubator to measure absorbance at 516 nm and Trolox was treated as a control. The following equation was used to calculate the DPPH radical-scavenging activity and expressed in a percentage:
where AbS was the absorbance of the test compound and AbC was the absorbance of control.
2.9. ABTS Cation Radical-Scavenging Assay
The ABTS cation radical-scavenging activity was measured by following the protocol demonstrated by Bilal et al. [16]. Potassium per sulphate was used for the oxidation of ABTS to generate ABTS•+ in the solution. It was diluted by using 50% ethanol to attain an absorbance of 0.7 ± 0.02 at 735 nm. The oxidized ABTS reagent was mixed with the sample and kept for 3 minutes to record absorbance at 735 nm by using spectrophotometer. In total, 50% ethanol was used as a blank and Trolox as a positive control. The following equation was used to calculate the ABTS radical-scavenging activity:
2.10. Free Amino Acids Composition
The free amino acids composition was determined by following the protocol used by Ali et al. [10]. One gram of sieved sample was hydrolyzed with six molar HCl for 24 h at 105 °C to determine the amino acid profile using a Hitachi Amino Acid Analyzer (L-8900, Hitachi, Tokyo, Japan). Standard amino acid mixture solution (Type H, Wako Pure Chemical Industries Ltd., Japan) was used for the determination of the endogenous amino acid profile. Samples from all treatments were analyzed in triplicate and stated as mg per gram of dry weight.
2.11. Analysis of Minerals and Carbohydrates
Minerals were identified and quantified by Andualem et al. [17] method with slight modifications. In total, 15 milliliters of HNO3 was added into 0.5 g of the incinerated freeze-dried sample of FW and CW. An equal volume of distilled water was added for dilution. Plasma-atomic emission spectrometer (ICP AES: Varian Vista, Varian Australia, Victoria, Australia) was used to determine the concentration of different minerals. Standard solutions for each mineral were used for calibration of the instrument.
The carbohydrates were identified and quantified according to the method followed by Kang et al. [18]. Ground dried samples were homogenized with liquid nitrogen and sugar extracted by using 80% aqueous ethanol. The ethanol was evaporated by rotary evaporator. The residues were dissolved in water and filtrate was injected to HPLC Waters system (Millipore Crop, Waters Chromatography, Milford, MA, USA) and the sugar signals were detected by Waters refractive index detector. The de-ionized water was used as mobile phase and the flow rate was 0.5 mL/min at 90 °C. Glucose and fructose were measured on the basis of peak areas and comparison with a calibration curve obtained with the corresponding standards.
2.12. Statistical Analysis
Recorded data were subjected to ANOVA (analysis of variance) by employing SAS v9.3 (SAS Institute Inc., Cary, NC, USA). The treatment means separation was done by DMRT (Duncan’s multiple range tests) at the 95% confidence level. The results were stated as the means ± SD (standard deviation) of three replicates.
3. Results and Discussion
3.1. Variation in Viable Microbial Population in Fermented and Cooked Wheat
Viable microbial population can be used as a standard to assess the extent of food fermentation [19]. The ability of four different fermented wheat (FW) varieties to support viable microbial cells is shown in Figure 1.
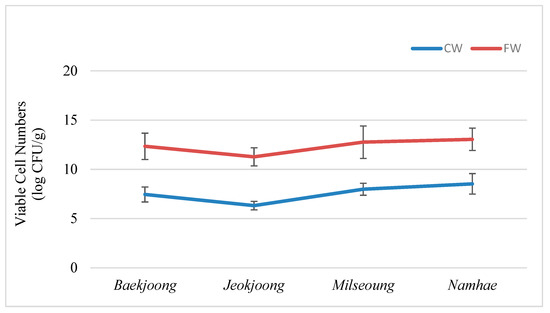
Figure 1.
Viable cell numbers of cooked wheat and fermented wheat. Error bars (mean ± SD) represent significant differences among the treatments. The data were analyzed with a one-way ANOVA followed by Duncan multiple range tests (p < 0.05). CW: cooked wheat, FW: fermented wheat.
Among four varieties of wheat, the descending order of bacterial population (log CFU/g) was recorded in FW as Namhae (13.05 ± 1.13), Milseoung (12.76 ± 1.65), Baekjoong (12.34 ± 1.34) and Jeokjoong (11.27 ± 0.92), but in cooked wheat (CW), the highest population was recorded in Namhae (8.53 ± 1.04) and the lowest was in Jeokjoong (6.32 ± 0.43). The microbial population recorded in CW Baekjoong and Milseoung was 7.45 ± 0.76 and 7.98 ± 0.61, respectively. The variation in microbial population within the same factor was due to the difference in nutritional status and size of wheat grains and the variation between the factors was due to change in the time span of incubation. Results of the previous experiment showed that the viable bacterial population increased significantly after fermentation [20], which is also proven by the present study. Kun et al. [21] also reported that the bifidobacteria grows well on carrot juice without the supply of external nutrients and initial bifidobacteria concentration of 106 cfu/mL was reached to 108 cfu/mL after 24 h of fermentation. Lee et al. [22] observed that the viable microbial population of Hosim Chungkookjang was increased from 5.6 CFU/g to a maximum value of 9.3 CFU/g in the first 24 h of fermentation.
3.2. Total Phenolic Contents (TPC) of Fermented and Cooked Wheat
The total phenolic contents of fermented and their corresponding cooked wheat varieties are demonstrated in Figure 2. Phenolic compounds have crucial role in human health because of their ability to suppress lipid peroxidation [3].

Figure 2.
Total phenolic contents of cooked wheat and fermented wheat. Error bars (mean ± SD) represent significant differences among the treatments. The data were analyzed with a one-way ANOVA followed by Duncan multiple range tests (p < 0.05). CW: cooked wheat, FW: fermented wheat.
Figure 2 shows that the highest TPC (µg GAEg-1) was available in fermented wheat (FW) variety named as Namhae FW and the concentrations of FW in comparison with CW in descending order were as: Namhae FW (1671.32 ± 32.54), CW (1139.57 ± 23.01); Milseoung FW (1597.43 ± 10.87), CW (1106.96 ± 9.43); Baekjoong FW (1533.78 ± 20.39), CW (1054.21 ± 12.17) and Jeokjoong FW (1321.46 ± 19.17), CW (954.43 ± 14.54). The results of TPC showed that the quantity of free phenolic compounds was considerably increased when these wheat varieties were allowed to ferment for 72 h. Previous experimental results also showed that the phenolic content of different cereals was significantly increased when fermented and the highest concentration of available TPC was noted in fermented buckwheat [2]. In cereals, fermentation leads to a breakdown of the cell wall, causing synthesis as well as the liberation of various bioactive compounds [23], and the above statement is also supported by the present experiment. Chen et al. [24] also declared that the TPC of fermented soybeans was increased significantly after 96 h of fermentation. The results of a previous study also revealed that the concentration of available TPC increased in fermented cereals and the extent of increase was depended on the strains of microorganisms and species of crops [25]. In the present study, the increase in TPC not only revealed the hidden available antioxidants potential of wheat varieties but also the fermentation potential of B. subtilis KCTC 13241 for the wheat varieties.
3.3. Total Flavonoid Contents (TFC) of Fermented and Cooked Wheat
Flavonoids could be used to avoid different diseases, including neurodegenerative disorders, cancer as well as cardiovascular disease [6]. Consumption of vegetables and fruits rich in flavonoids boosts the defense system against heart diseases and cancer [7]. The difference in TFC of FW and the corresponding CW is shown in Figure 3.

Figure 3.
Total flavonoid contents of cooked wheat and fermented wheat. Error bars (mean ± SD) represent significant differences among the treatments. The data were analyzed with a one-way ANOVA followed by Duncan multiple range tests (p < 0.05). CW: cooked wheat, FW: fermented wheat.
In this experiment, most of the fermented wheat varieties had shown a significant increase in TFC as compared to its corresponding cooked variety (CW). Namhae (FW) had a maximum flavonoids content of 142.65 ± 2.25 and its corresponding Namhae (CW) showed 76.33 ± 6.31, followed by Milseoung (FW) with 137.26 ± 6.73 TFC and its corresponding Milseoung (CW) had 65.96 ± 4.76 TFC. This is followed by Baekjoong (FW), which had 124.57 ± 7.94 TFC compared to its counterpart Baekjoong (CW) with 51.29 ± 4.41 µg CE/g TFC. The lowest concentration of TFC was found in the Jeokjoong (FW), which was 109.21 ± 5.11, and it was significantly less than other FW varieties. These results are supported by the outcomes of a past study, which reported the significant high TFC in fermented soybeans extract compared to its corresponding cooked soybeans extract [7]. The difference in TFC of FW varieties might be due to a difference in the genetic potential of wheat varieties, as shown by Bilal et al. [16]. Another study showed similar results, in that the concentration of TFC in soybean was significantly enhanced when fermented with different strains of microorganisms [26]. Xu and Chang [13] also reported that the fermented foods are rich in flavonoids, which reduce the chance of lethal diseases in human. In the current study, the TFC of FW and CW are compared with the TFC of other fermented crops, owing to a lack of research related to fermented wheat. Thus, one of the reasons to design this experiment was to study the maximum possible aspects of fermented wheat varieties appropriately. Low level of TFC in cooked wheat was due to a lack of bacterial fermentation and, thus, conversion of complex and indigenously available bounded phytochemicals to active and freely available phytochemicals did not take place.
3.4. DPPH Free Radical Scavenging Activity
The DPPH free radical scavenging assay has been extensively used to measure the free radical scavenging potential of food items owing to its great easiness and high accuracy [2]. The free radicals of DPPH have been employed in the estimation of free radical scavenging potential of different plants extracts [27]. The DPPH free radical scavenging potential of the four FW and CW varieties is shown in Figure 4.

Figure 4.
DPPH free radical scavenging activity of cooked wheat and fermented wheat. Error bars (mean ± SD) represent significant differences among the treatments. The data were analyzed with a one-way ANOVA followed by Duncan multiple range tests (p < 0.05). CW: cooked wheat, FW: fermented wheat.
The scavenging potential of FW and CW extracts was expressed in percentage and the highest concentration was observed in Namhae (FW) 44.36 ± 2.15 (%), which was higher compared to Namhae CW (control), which showed a very low scavenging activity of 27.43 ± 0.84 (%), followed by Milseoung (FW), with 39.03 ± 1.56 (%) of scavenging potential, which was higher compared to its corresponding cooked Milseoung (control), which showed 25.88 ± 1.23 (%) of scavenging activity. The DPPH free radical scavenging potential of Baekjoong (FW) was 35.71 ± 1.39 (%), but its corresponding control (CW) showed a very weak potential of 23.04 ± 1.45 (%). Among all the treatments, the lowest potential was noticed in Jeokjoong (FW), which was 32.01 ± 0.99 (%), while its corresponding control was 20.61 ± 1.76 (%). Other investigations also demonstrated that some wheat varieties have a weak scavenging potential (31%) for DPPH free radicals [28]. In this experiment, Namhae (FW) showed a stronger antioxidative potential as compared to already published data on the scavenging potential of other cereals [2]. Acosta-Estrada et al. [29] revealed that wheat is placed in a slightly lower rank in comparison with the antioxidative potential of legumes. Kim et al. [30] demonstrated that CKJ (fermented soybeans) had a significantly higher antioxidant activity than cooked plain soybeans. The increase in the antioxidants activity after bacterial fermentation rely on the TFC and TPC generated by the probiotic Bacillus subtilis strain after fermentation [20].
3.5. ABTS Radical Scavenging Potential of FW and CW Extract
The ABTS free radical scavenging assay has also been widely used for assessing the antioxidative potential of food products [16]. Free radicals scavenging compounds have more potential to scavenge ABTS•+ than DPPH free radical [31]. The ABTS•+ scavenging potential of FW and CW is shown in Figure 5 and expressed as a percentage (%).

Figure 5.
ABTS free radical scavenging activity of cooked wheat and fermented wheat. Error bars (mean ± SD) represent significant differences among the treatments. The data were analyzed with a one-way ANOVA followed by Duncan multiple range tests (p < 0.05). CW: cooked wheat, FW: fermented wheat.
The highest ABTS•+ scavenging potential was presented by Namhae (FW), which was 53.94 ± 2.39 (%), followed by Milseoung (FW), with 47.19 ± 2.87 (%), and Baekjoong (FW), which was 42.45 ± 2.06 (%). The least antioxidative potential among all FW was noted in Jeokjoong (FW), which was 38.83 ± 1.45 (%). The ABTS•+ scavenging capacity of cooked (controls) Namhae, Milseoung, Baekjoong and Jeokjoong were 36.49 ± 2.23, 33.28 ± 1.65, 31.17 ± 1.27 and 29.86 ± 1.04 (%), respectively. Starzyńska-Janiszewska et al. [32] described that there was a significant increase in the antioxidant potential of fermented seeds extracts as compared to plain seeds extracts (control). Another study on solid state fermentation of wheat revealed that the ABTS free radical scavenging potential of fermented wheat was significantly higher than the corresponding control, which was confirmed by the decrease of IC50 values of ROFW (Rhizopus oryzae fermented wheat) [33]. Some previous studies announced that the fermented foods extracts might protect DNA strands from breakage caused by the ROSs [30,34]. Hwang et al. [35] demonstrated the ABTS free radical scavenging activity of CKJ (fermented soybeans) prepared from Seormoktae and Seoritae increased from 64.87% and 70.81% at 0 h fermentation to 81.12% and 91.06% at 48 h fermentation, respectively. CKJ (fermented soybeans) prepared from Seormoktae and Seoritae showed 81.12 and 91.06% ABTS•+ scavenging potential, respectively, after 48 h of fermentation [35,36].
3.6. Amino Acid Profile of FW and CW
The enzyme released by Bacillus Subtilis hydrolyzes the protein present in wheat into free amino acids and short peptides that can be readily available to human body [1]. This experiment involved a quantitative analysis of 14 amino acids including seven essential amino acids (phenylalanine, valine, threonine, methionine, leucine, isoleucine and histidine) and seven non-essential amino acids (arginine, serine, glutamic acid, glycine, alanine, aspartic acid and tyrosine). A comparison of the amino acid concentrations of FW and CW varieties can be found in Table 1.

Table 1.
The composition of free amino acids in cooked and fermented wheat.
The concentration of amino acids was expressed in mg/g. The total amount of essential and non-essential amino acids in FW decreased in order as Namhae ˂ Milseoung ˂ Baekjoong ˂ Jeokjoong and their corresponding concentrations are 116.71 ± 4.64, 115.91 ± 5.17, 102.78 ± 5.32 and 101.93 ± 4.13, respectively. The CW varieties (controls) had a significantly low total amino acid concentration, corresponding to their relevant FW variety with an order of decrease of 95.94 ± 5.98, 95.33 ± 6.76, 84.02 ± 4.87 and 81.48 ± 5.32 mg/g for Namhae, Milseoung, Baekjoong and Jeokjoong, respectively. Glutamic acid is the most abundant amino acid in both FW as well as CW varieties. Few amino acids, such as tyrosine, histidine and methionine, have also been described as antioxidants, and especially histidine shows strong free radical scavenging potential [37]. Amino acids have surplus electrons which can be used to scavenge free radicals. Some amino acids regulate the expression of genes, enhance skeletal muscles’ growth and even burn non-essential body fat [38]. Leucine, valine, isoleucine and phenylalanine act as neurotransmitters which affect the performance of brain and nervous system [39]. A high proportion of available amino acids acts as a supportive character in the quality assurance of food products [15]. Although cereals are known for their high level of carbs, this study had effectively improved the available protein in grains after fermentation.
3.7. Minerals and Carbohydrate Contents of FW and CW
Minerals are divided into two main categories of micro and macro minerals. Calcium, potassium, sodium, phosphorous, magnesium and sulfur are macro minerals, whereas iron, selenium, copper, iodine, cobalt, zinc, chromium, molybdenum and boron are micro minerals [40]. In this experiment, the ten most important minerals were studied and their concentrations are presented in Table 2.
Table 2.
Minerals and carbohydrate contents of cooked and fermented wheat.
Wheat cultivars showed the interesting results related to minerals. Jeokjoong showed the highest contents of iron, calcium, magnesium and potassium in both FW as well as CW. Baekjoong displayed higher concentration of other minerals, such as phosphorus, manganese and sodium. Overall, the total available minerals content of fermented grains after fermentation was increased. In the current study, first-time minerals composition was determined in fermented wheat. This difference in the mineral contents might be due to the interaction of bacterial fermentation with the breakdown of other metabolites [41]. Calcium plays crucial role in nerve functioning, blood clotting and the immune system and also supports to relax and contract the muscles. Sodium helps for the regulation of the electrolyte balance, heart function and metabolic activities. Magnesium aids to synthesize the proteins, immune system and control constipation, while potassium is needed for nerve transmission, control blood pressure and muscles shriveling. Iron is present in red blood cells and carries oxygen to different parts of body and is helpful in metabolism [42]. The values of glucose and fructose are also illustrated in Table 2. Jeokjoong CW exhibited the highest value of glucose (0.46/100 g) and this value increased significantly (0.65/100 g) after fermentation as compared to other varieties. The concentration of fructose was higher in cooked Baekjoong (71.02/100 g) among all cooked varieties, but after fermentation, the highest concentration was found in fermented Milseoung (90.54/100 g). The above variations in the carbohydrate contents might be due to differences in the innate potential of cultivars and their fermentation compatibility with Bacillus Subtilis. Prückler et al. [42] reported an increase of fructose and glucose in all samples during fermentation. Another study demonstrated that at the early stages of fermentation, higher levels of fructose and glucose were detected than their respective controls [43]. Sahlström et al. [44] illustrated that in the early stages of fermentation, a high level of glucose and fructose was found because of hydrolysis of starch. The results of the present experiment were strongly supported by the results of the abovementioned literature.
4. Conclusions
It is concluded that the Namhae variety is the most potent with regards to the mentioned parameters. Fermentation of bread wheat using Bacillus subtilis KCTC 13241 is a crucial and cost-effective way for quality enhancement of both antioxidants and nutritional aspects. Wheat contains a high concentration of antioxidants in bound form, making them functionally inert due to a lack of absorption in the intestine. Taking into account the obtained results, it is evident that these fermented wheat varieties are of considerable value because of their enhanced capacity to reduce oxidative stress, as well as reducing hidden hunger resulting from malnutrition. Currently, the research is mainly focused on increasing wheat yield, which inevitably results in the dilution of quality characteristics. At the same time, only a minimal amount of attention is paid to using the quality parameters at their maximum potential through suitable techniques. That is why a significant-quality gap was found between the available and potential level in the unfermented wheat varieties. To fulfill this gap, fermentation with B. subtilis KCTC 13241 is the best combination, as well as being convenient, reliable and very cheap. In the future, the fermented wheat products might be assessed in regards to the alleviation of aging symptoms and mechanisms which are involved in the activation of biochemical compounds and relationship between specific microbe strains and wheat varieties.
Author Contributions
M.Z.I., M.W.A., S.T. and M.N. participated in the design, conducted the experiment and analyzed the results. M.Z.I. wrote the manuscript and also revised it. J.K.L. reviewed and commented on the manuscript. All authors have read and agreed to the published version of the manuscript.
Funding
This research received no external funding.
Institutional Review Board Statement
Not applicable.
Informed Consent Statement
Not applicable.
Data Availability Statement
Not applicable.
Acknowledgments
This study has been done with the support of a research grant of kangwon National University in 2022, Republic of Korea.
Conflicts of Interest
The authors declare no potential conflicts of interest with respect to the research, authorship and publication of this manuscript.
References
- Liu, F.; Chen, Z.; Shao, J.; Wang, C.; Zhan, C. Effect of fermentation on the peptide content, phenolics and antioxidant activity of defatted wheat germ. Food Biosci. 2017, 20, 141–148. [Google Scholar] [CrossRef]
- Dordević, T.M.; Šiler-Marinković, S.S.; Dimitrijević-Branković, S.I. Effect of fermentation on antioxidant properties of some cereals and pseudo cereals. Food Chem. 2010, 119, 957–963. [Google Scholar] [CrossRef]
- Wojdyło, A.; Oszmiański, J.; Czemerys, R. Antioxidant activity and phenolic compounds in 32 selected herbs. Food Chem. 2007, 105, 940–949. [Google Scholar] [CrossRef]
- Naczk, M.; Shahidi, F. Phenolics in cereals, fruits and vegetables: Occurrence, extraction and analysis. J. Pharm. Biomed. Anal. 2006, 41, 1523–1542. [Google Scholar] [CrossRef] [PubMed]
- Trouillas, P.; Calliste, C.; Allais, D.; Simon, A.; Marfak, A.; Delage, C.; Duroux, J. Antioxidant, anti-inflammatory and antiproliferative properties of sixteen water plant extracts used in the Limousin countryside as herbal teas. Food Chem. 2003, 80, 399–407. [Google Scholar] [CrossRef]
- Cai, S.; Wang, O.; Wu, W.; Zhu, S.; Zhou, F.; Ji, B.; Gao, F.; Zhang, D. Comparative study of the effects of solid-state fermentation with three filamentous fungi on the total phenolics content (TPC), flavonoids, and antioxidant activities of subfractions from oats (Avena sativa L.). J. Agric. Food. Chem. 2012, 60, 507–513. [Google Scholar] [CrossRef]
- Juan, M.Y.; Chou, C.C. Enhancement of antioxidant activity, total phenolic and flavonoid content of black soybeans by solid state fermentation with Bacillus subtilis BCRC 14715. Food Microbiol. 2010, 27, 586–591. [Google Scholar] [CrossRef]
- Bhanja, T.; Kumari, A.; Banerjee, R. Enrichment of phenolics and free radical scavenging property of wheat koji prepared with two filamentous fungi. Bioresour. Technol. 2009, 100, 2861–2866. [Google Scholar] [CrossRef]
- Martins, S.; Mussatto, S.I.; Martínez-Avila, G.; Montañez-Saenz, J.; Aguilar, C.N.; Teixeira, J.A. Bioactive phenolic compounds: Production and extraction by solid-state fermentation. A review. Biotechnol. Adv. 2011, 29, 365–373. [Google Scholar] [CrossRef] [Green Version]
- Ali, M.W.; Kim, I.D.; Bilal, S.; Shahzad, R.; Saeed, M.T.; Adhikari, B.; Nabi, R.B.S.; Kyo, J.R.; Shin, D.H. Effects of bacterial fermentation on the biochemical constituents and antioxidant potential of fermented and unfermented soybeans using probiotic bacillus subtilis (KCTC 13241). Molecules 2017, 22, 2200. [Google Scholar] [CrossRef] [Green Version]
- Ali, M.W.; Shahzad, R.; Bilal, S.; Adhikari, B.; Kim, I.D.; Lee, J.D.; Lee, I.J.; Kim, B.O.; Shin, D.H. Comparison of antioxidants potential, metabolites, and nutritional profiles of Korean fermented soybean (Cheonggukjang) with Bacillus subtilis KCTC 13241. J. Food Sci. Technol. 2018, 55, 2871–2880. [Google Scholar] [CrossRef] [PubMed]
- Ali, M.W.; Ilays, M.Z.; Saeed, M.T.; Shin, D.H. Comparative assessment regarding antioxidative and nutrition potential of Moringa oleifera leaves by bacterial fermentation. J. Food Sci. Technol. 2020, 57, 1110–1118. [Google Scholar] [CrossRef] [PubMed]
- Xu, B.J.; Chang, S.K.C. A comparative study on phenolic profiles and antioxidant activities of legumes as affected by extraction solvents. J. Food Sci. 2007, 72, S159–S166. [Google Scholar] [CrossRef] [PubMed]
- Katsube, T.; Tabata, H.; Ohta, Y.; Yamasaki, Y.; Anuurad, E.; Shiwaku, K.; Yamane, Y. Screening for Antioxidant Activity in Edible Plant Products: Comparison of Low-Density Lipoprotein Oxidation Assay, DPPH Radical Scavenging Assay, and Folin-Ciocalteu Assay. J. Agric. Food Chem. 2004, 52, 2391–2396. [Google Scholar] [CrossRef] [PubMed]
- Adhikari, B.; Dhungana, S.K.; Waqas Ali, M.; Adhikari, A.; Kim, I.D.; Shin, D.H. Antioxidant activities, polyphenol, flavonoid, and amino acid contents in peanut shell. J. Saudi Soc. Agric. Sci. 2018, 18, 2–7. [Google Scholar] [CrossRef]
- Bilal, S.; Khan, A.L.; Waqas, M.; Shahzad, R.; Kim, I.D.; Lee, I.J.; Shin, D.H. Biochemical constituents and in vitro antioxidant and anticholinesterase potential of seeds from Native Korean Persimmon Genotypes. Molesafcscules 2016, 21, 893. [Google Scholar] [CrossRef] [Green Version]
- Andualem, B.; Gessesse, A. Proximate composition, mineral content and antinutritional factors of Brebra (Millettia ferruginea) seed flour as well as physicochemical characterization of its seed oil. Springerplus 2014, 3, 298. [Google Scholar] [CrossRef] [Green Version]
- Kang, S.M.; Radhakrishnan, R.; You, Y.H.; Joo, G.J.; Lee, I.J.; Lee, K.E.; Kim, J.H. Phosphate Solubilizing Bacillus megaterium mj1212 Regulates Endogenous Plant Carbohydrates and Amino Acids Contents to Promote Mustard Plant Growth. Indian, J. Microbiol. 2014, 54, 427–433. [Google Scholar] [CrossRef]
- Hwang, I.S.; Kim, J.E.; Lee, Y.J.; Kwak, M.H.; Lee, H.G.; Kim, H.S.; Lee, H.S.; Hwang, D.Y. Growth sensitivity in the epiphyseal growth plate, liver and muscle of SD rats is significantly enhanced by treatment with a fermented soybean product (cheonggukjang) through stimulation of growth hormone secretion. Mol. Med. Rep. 2014, 9, 166–172. [Google Scholar] [CrossRef]
- Cho, K.M.; Lee, J.H.; Yun, H.D.; Ahn, B.Y.; Kim, H.; Seo, W.T. Changes of phytochemical constituents (isoflavones, flavanols, and phenolic acids) during cheonggukjang soybeans fermentation using potential probiotics Bacillus subtilis CS90. J. Food Compos. Anal. 2011, 24, 402–410. [Google Scholar] [CrossRef]
- Kun, S.; Rezessy-Szabó, J.M.; Nguyen, Q.D.; Hoschke, Á. Changes of microbial population and some components in carrot juice during fermentation with selected Bifidobacterium strains. Process Biochem. 2008, 43, 816–821. [Google Scholar] [CrossRef]
- Lee, D.; Kulkarni, K.P.; Kim, B.; Mi, Y.; Tae, J.; Lee, J. Comparative assessment of quality characteristics of Chungkookjang made from soybean seeds differing in oleic acid concentration. J. Funct. Foods 2019, 52, 529–536. [Google Scholar] [CrossRef]
- Katina, K.; Liukkonen, K.H.; Kaukovirta-Norja, A.; Adlercreutz, H.; Heinonen, S.M.; Lampi, A.M.; Pihlava, J.M.; Poutanen, K. Fermentation-induced changes in the nutritional value of native or germinated rye. J. Cereal Sci. 2007, 46, 348–355. [Google Scholar] [CrossRef]
- Chen, Y.; Wang, Y.; Chen, J.; Tang, H.; Wang, C.; Li, Z.; Xiao, Y. Bioprocessing of soybeans (Glycine maxL.) by solid-state fermentation withEurotium cristatumYL-1 improves total phenolic content, isoflavone aglycones, and antioxidant activity. RSC Adv. 2020, 10, 16928–16941. [Google Scholar] [CrossRef]
- Kariluoto, S.; Aittamaa, M.; Korhola, M.; Salovaara, H.; Vahteristo, L.; Piironen, V. Effects of yeasts and bacteria on the levels of folates in rye sourdoughs. Int. J. Food Microbiol. 2006, 106, 137–143. [Google Scholar] [CrossRef]
- Lee, I.H.; Hung, Y.H.; Chou, C.C. Solid-state fermentation with fungi to enhance the antioxidative activity, total phenolic and anthocyanin contents of black bean. Int. J. Food Microbiol. 2008, 121, 150–156. [Google Scholar] [CrossRef]
- Katalinic, V.; Milos, M.; Kulisic, T.; Jukic, M. Screening of 70 medicinal plant extracts for antioxidant capacity and total phenols. Food Chem. 2006, 94, 550–557. [Google Scholar] [CrossRef]
- Yu, L.; Perret, J.; Davy, B.; Wilson, J.; Melby, C.L. Antioxidant properties of cereal products. J. Food Sci. 2002, 67, 2600–2603. [Google Scholar] [CrossRef]
- Acosta-Estrada, B.A.; Gutiérrez-Uribe, J.A.; Serna-Saldívar, S.O. Bound phenolics in foods, a review. Food Chem. 2014, 152, 46–55. [Google Scholar] [CrossRef]
- Kim, N.Y.; Song, E.J.; Kwon, D.Y.; Kim, H.P.; Heo, M.Y. Antioxidant and antigenotoxic activities of Korean fermented soybean. Food Chem. Toxicol. 2008, 46, 1184–1189. [Google Scholar] [CrossRef]
- Sachindra, N.M.; Bhaskar, N. In vitro antioxidant activity of liquor from fermented shrimp biowaste. Bioresour. Technol. 2008, 99, 9013–9016. [Google Scholar] [CrossRef] [PubMed]
- Starzyńska-Janiszewska, A.; Stodolak, B.; Jamróz, M. Antioxidant properties of extracts from fermented and cooked seeds of Polish cultivars of Lathyrus sativus. Food Chem. 2008, 109, 285–292. [Google Scholar] [CrossRef] [PubMed]
- Dey, T.B.; Kuhad, R.C. Enhanced production and extraction of phenolic compounds from wheat by solid-state fermentation with Rhizopus oryzae RCK2012. Biotechnol. Rep. 2014, 4, 120–127. [Google Scholar] [CrossRef] [Green Version]
- Niki, E.; Noguchi, N. Evaluation of antioxidant capacity. What capacity is being measured by which method? IUBMB Life 2000, 50, 323–329. [Google Scholar] [CrossRef]
- Hwang, C.E.; Seo, W.T.; Cho, K.M. Enhanced antioxidant effect of black soybean by Cheonggukjang with potential probiotic Bacillus subtilis CSY191. Korean J. Microbiol. 2013, 49, 391–397. [Google Scholar] [CrossRef]
- Udenigwe, C.C.; Aluko, R.E. Chemometric analysis of the amino acid requirements of antioxidant food protein Hydrolysates. Int. J. Mol. Sci. 2011, 12, 3148–3161. [Google Scholar] [CrossRef] [Green Version]
- Wu, G. Amino acids: Metabolism, functions, and nutrition. Amino Acids 2009, 37, 1–17. [Google Scholar] [CrossRef]
- Fernstrom, J.D. Large neutral amino acids: Dietary effects on brain neurochemistry and function. Amino Acids 2013, 45, 419–430. [Google Scholar] [CrossRef]
- Lukaski, H.C. Vitamin and mineral status: Effects on physical performance. Nutrition 2004, 20, 632–644. [Google Scholar] [CrossRef]
- Maria John, K.M.; Enkhtaivan, G.; Lee, J.; Thiruvengadam, M.; Keum, Y.-S.; Kim, D.H. Spectroscopic determination of metabolic and mineral changes of soya-chunk mediated by Aspergillus sojae. Food Chem. 2015, 170, 1–9. [Google Scholar] [CrossRef]
- Gharibzahedi, S.M.T.; Jafari, S.M. The importance of minerals in human nutrition: Bioavailability, food fortification, processing effects and nanoencapsulation. Trends Food Sci. Technol. 2017, 62, 119–132. [Google Scholar] [CrossRef]
- Prückler, M.; Lorenz, C.; Endo, A.; Kraler, M.; Dürrschmid, K.; Hendriks, K.; Soares da Silva, F.; Auterith, E.; Kneifel, W.; Michlmayr, H. Comparison of homo- and heterofermentative lactic acid bacteria for implementation of fermented wheat bran in bread. Food Microbiol. 2015, 49, 211–219. [Google Scholar] [CrossRef] [PubMed]
- Codinǎ, G.G.; Mironeasa, S.; Voica, D.V.; Mironeasa, C. Multivariate analysis of wheat flour dough sugars, gas production, and dough development at different fermentation times. Czech J. Food Sci. 2013, 31, 222–229. [Google Scholar] [CrossRef] [Green Version]
- Sahlström, S.; Park, W.; Shelton, D.R. Factors Influencing Yeast Fermentation and the Effect of LMW Sugars and Yeast Fermentation on Hearth Bread Quality. Cereal Chem. 2004, 81, 328–335. [Google Scholar] [CrossRef]
Publisher’s Note: MDPI stays neutral with regard to jurisdictional claims in published maps and institutional affiliations. |
© 2022 by the authors. Licensee MDPI, Basel, Switzerland. This article is an open access article distributed under the terms and conditions of the Creative Commons Attribution (CC BY) license (https://creativecommons.org/licenses/by/4.0/).