Article

Influence of Fermentation Conditions (Temperature and Time) on the Physicochemical Properties and Bacteria Microbiota of Amasi

by
Mpho Maleke
1,
Wesley Doorsamy
2,
Adrian Mark Abrahams
1,
Martins Ajibade Adefisoye
1,
Kedibone Masenya
3 and
Oluwafemi Ayodeji Adebo
1,*
1
Department of Biotechnology and Food Technology, Faculty of Science, Doornfontein Campus, University of Johannesburg, P.O. Box 17011, Doornfontein, Johannesburg 2028, Gauteng, South Africa
2
Institute for Intelligent Systems, Doornfontein Campus, University of Johannesburg, P.O. Box 17011, Doornfontein, Johannesburg 2028, Gauteng, South Africa
3
Neuroscience Institute, University of Cape Town, Private Bag X3, Rondebosch, Cape Town 7701, Western Cape, South Africa
*
Author to whom correspondence should be addressed.
Fermentation 2022, 8(2), 57; https://doi.org/10.3390/fermentation8020057
Submission received: 20 December 2021 / Revised: 24 January 2022 / Accepted: 25 January 2022 / Published: 28 January 2022

Abstract

:
The aim of this present study was to optimize the fermentation conditions (time and temperature) of amasi (a Southern African fermented dairy product) using response surface methodology (RSM), and to determine the physicochemical properties, as well as the microbial composition, using next generation sequencing. Fermentation time and temperature were optimized to produce different amasi samples and different parameters, including pH, total soluble solids (TSS), total titratable acids (TTA), and consistency. All the variables studied were found to show significant (p ≤ 0.05) changes with increasing fermentation time and temperature. Numerical optimization was used to obtain the optimal fermentation conditions for amasi; based on RSM, it was 32 °C for 140 h, while with k-means clustering, it was 25 °C for 120 h. Under both conditions for the optimal samples, the pH reduced from 6.64 to 3.99, TTA increased from 0.02 to 0.11 (% lactic acid), TSS decreased from 9.47 to 6.67 °Brix, and the consistency decreased from 23 to 15.23 cm/min. Most of the identified bacteria were linked to lactic acid bacteria, with the family Lactobacillaceae being the most predominant in amasi, while in raw milk, Prevotellaceae was the most abundant. The fermentation conditions (time and temperature) had a significant influence on the parameters investigated in this study. Results of this study could provide information for the commercialization of quality amasi.

1. Introduction

Traditional fermented milk (TFM) products are widely consumed in Southern Africa and play an important role in people’s nutrition [1]. These products are processed by natural fermentation of raw or pasteurized milk, of which majority are processed from cow’s milk [2]. Most of the TFMs are usually domestically produced and thus mostly for home consumption. These TFM products with comparable or identical production processes and characteristics may be known by other names throughout the Southern Africa region, including madila from Botswana [3], mafi from Lesotho, mabisi from Zambia and Namibia [4], and amasi from South Africa and Zimbabwe [5]. In other African countries, they are also commonly known as nunu in Nigeria and Ghana [6], as well as ergo in Ethiopia [2].
According to Gadaga et al. [7], amasi is made by spontaneously (naturally) fermenting raw milk for 1–3 days at room temperature. During this process, lactose in milk is converted to lactic acid by activities of the fermenting microbes present in the milk [8]. This leads to a sour milk product with a pH value ranging from 3.6 to 4.2 [9] and a thick consistency, that can either be smooth or lumpy depending on the desirability of the consumer. The sourness and thickness of amasi may vary considerably depending on the producer and consumer preference. This was a common procedure used to preserve milk in the rural communities due to lack of storage facilities [4].
The microbial community that is present in raw milk is usually from bacterial species, mainly from Pseudomonas and Citrobacter [10]. Kim et al. [11] also reported on members from bacterial genera Lactococcus, Lactobacillus and Streptococcus. The ones from amasi include Lactococcus, Streptococcus and Enterobacter species [10,12,13]. A description of microorganisms present in amasi is necessary since their presence is directly connected to the quality of the product and other factors such as the origin of milk, utensil use, etc. The regular changes in nutritional content and pH of the milk during the fermentation process usually leads to fluctuations in microbial composition of the product [14]. This suggests that there might be some variances in the microbial composition present at the start (in raw milk) and in the final product. Such changes in the microbial community are not only linked to the accessibility of nutrients and pH, but can also be linked with the activities of microbial interactions [15].
The importance of fermentation time and temperature is vital since they have an impact on the quality and composition of final product [8]. Hence, the need to optimize the fermentation conditions (time and temperature) using a mathematical model such as response surface methodology (RSM) was investigated in this study. RSM is a mathematical model that is used optimize various processing conditions including temperature, time, levels of ingredients, and other parameters [16]. It is a valuable method for investigating factors that have an impact on responses by differentiating them at the same time, and it can be used to investigate the relationship of more than one dependent variable, known as responses, and factors, which are independent variables [17,18,19].
To verify the efficacy of RSM for optimization, and to determine optimal subspaces within the solution space, an unsupervised machine learning algorithm k-means clustering is widely used here. The k-means clustering technique is commonly used to divide a given data set into k-clusters, where k represents the number of groups specified by the analyst [20]. It classifies objects into several classes, which is known as class similarity, while objects from various clusters are as dissimilar as possible, which is known as low inter-class similarity. The clusters in k-means algorithm are represented by their centres, known as centroid, which resembles the mean of points assigned to the clusters. The reduction of total intra-cluster distance is the main objective for using k-means [20]. Some of the advantages of using k-means clustering are that it can proficiently handle larger amount of data sets and it can produce a local optimum solution [21]. Many researchers in the food industry are starting to get used to the machine learning (ML) algorithms as this multivariant validation tools to improve methods and the final product’s quality. Considering the dearth of information on the influence of fermentation time and temperature on the composition of amasi, the current study aims at optimizing fermentation conditions (temperature and time) of amasi using a multi-response numerical optimization and subsequent use of an unsupervised ML technique (k-means clustering) for validating the RSM generated models. The k-means technique assists here by denoting subspaces (or clusters) within the solution space where the fermentation parameters are expected to be optimal. In this way, the RSM efficacy is confirmed, but the optimal regions formed by cluster can be determined. Physicochemical tests were conducted on the raw milk and derived amasi, and the microbial (bacteria) community was investigated using an amplicon sequencing approach.

2. Materials and Methods

2.1. Collection of Raw Samples

Raw cow milk samples were purchased from Agricultural Research Council (ARC)—Irene farm, Pretoria, South Africa. The raw milk was transported in a cooler box (with dry ice packs) to the Food Technology Laboratory at the University of Johannesburg South Africa and was processed upon arrival.

2.2. Experimental Design and Processing of Amasi

Central composite design (CCD) of RSM was used to obtain an experimental design and optimize the effect of fermentation conditions. The input factors of fermentation studied were fermentation time (h) coded as X1 and fermentation temperature (℃) coded as X2, with the range of 4–140 h and 18–32 °C, correspondingly (Table 1). The choice of the factor levels was based on other studies in literature on the processing of amasi from raw milk [8,10,12,13,22,23]. Thirteen experimental runs generated from the grouping of the mentioned factors are also presented in Table 2. A second-order polynomial equation (Equation (1)), described the relationship between the variables (fermentation time and temperature) in terms of their linear, quadratic and interactive effects, where Y was the response, β 0 was the q constant, β 1 , 2 were coefficients, and X 1 and X 2 were factors.
Y = β 0 + β 1 X 1 + β 2 X 2 + β 11 X 1 2 + β 22 X 2 2 + β 12 X 1 X 2

2.3. Production of Amasi

Using the method described by Kayitesi et al. [12], the raw cow milk was processed into amasi by pouring 200 g of milk into a sterile container and covering it with a lid. The milk was then allowed to naturally ferment using the fermentation conditions provided in Table 2. For each experimental run, the fermentation process was done in triplicates, and subsequent parameters such as pH, titratable acidity (TTA), total soluble solids (TSS), and consistency (cm/min) were determined and also done in triplicates.

2.4. Determination of the Physicochemical Properties of the Produced Amasi

2.4.1. pH and Titratable Acidity

The pH measurement was performed as indicated by Tomovska et al. [24] where 10 mL of the fermented samples were transferred into sterile containers and the pH value was measured with a pH meter (HANNA, Woonsocket, RI, USA). Titratable acidity (TTA) was determined by titrating a mixture of 10 g of raw milk and fermented sample in 100 mL of distilled water against 0.1 M NaOH (Merck, Modderfontein, South Africa), using phenolphthalein as indicator while stirring continuously until a faint pink colour was achieved.

2.4.2. Consistency

As described by Muyabo and Urambo [25] with some modification, the consistency of amasi was measured using a Bostwick consistometer (Endecotts, London, UK). The sample was poured into the reservoir of the consistometer up to the brim and levelled with a spatula, and was allowed to travel for 30 s. The results were reported as the distance travelled in cm for 30 s.

2.4.3. Total Soluble Solids (TSS)

The TSS were analyzed using a refractometer (HANNA instruments, Woonsocket, RI, USA). Prior to measuring the TSS content of sample, the equipment was calibrated with distilled water. The TSS was then measured by placing a drop of sample on the surface of the refractometer, then the reading was taken on the screen. The TSS was measured in triplicates and expressed as °Brix.

2.5. RSM Based-Multi-Response Numerical Optimization

Based on the experimental results of the investigated parameters (pH, TTA, TSS and consistency) a multi-response numerical optimization was done on Minitab software (Minitab Ltd., Coventry, UK) to determine the optimal processing conditions for amasi. All the parameters were set at maximum, with the exception of pH at minimum. Response parameters were represented with model equations and their respective coefficients from Minitab. The optimal processing conditions obtained were fermentation temperature at 32 °C and fermentation time for 140 h. Amasi was obtained at these fermentation conditions and similar parameters (pH, TTA, TSS and consistency) were determined.

2.6. Unsupervised Machine Learning (k-Means Clustering) Optimization

To perform the k-means clustering, a matrix laboratory commonly known as MATLAB (R2020a, MathWorks, Natick, MA, USA) software was used. The input and output parameters from RSM experimental runs were used for the k-means optimization. For data preparation, the rows were labelled as observations and columns as variables, and missing values in the data set were removed or estimated [21]. Then, the data was standardized to compare the variables. A number of clusters was chosen, in this case it was four, and objects were selected randomly from the data set as the initial cluster centers or means. The observations were then assigned to their closest centroid based on the Euclidean distance between the object and the centroid; this step is called the cluster assignment step [26]. The software computed a new mean value of each cluster after the assignment step. The centers were recalculated, and every observation was checked again to confirm if it was closer to another cluster. The updated cluster means were used to assign all objects again and this was done until the cluster assignment stopped changing. The generated clusters were spread through four regions on the k-means plot (Figure 1A–C). This enables further analysis beyond the point estimates provided by RSM. The ‘regions’ around clusters highlighted hereto indicate expected similarities or groupings of the fermentation process, associated with the parameters indicated.
The conditions represented in Table 2 were used to further cluster the data. Unsupervised machine learning algorithm on MATLAB (R2020a, MathWorks, Natick, MA, USA) was used to obtain another set of optimal processing conditions for amasi. The resulting optimal processing conditions were fermentation temperature at 25 °C and fermentation time for 120 h. Amasi was processed under these optimal conditions and similar parameters (pH, TTA, TSS and consistency) were determined.

2.7. Fermentation of Optimized Amasi

Optimized amasi was fermented under the two optimal conditions from RSM and k-means. Amasi was naturally fermented for 120 h at 25 °C (OP25) and for 140 h at 32 °C (OP32) as per stated method (2.3). To investigate the effect of starter culture addition on the optimized amasi, freeze-dried LAB culture (CHN-22) was used to ferment amasi for 120 h at 25 °C (SC25) and for 140 h at 32 °C (SC32). The starter cultures were purchased at Lake Foods (Johannesburg, South Africa). To produce this, the raw milk was heated at 72 °C for 30 min and cooled to 43–45 °C. Then, 0.4 g of the starter culture was inoculated into the cooled milk, and this was allowed to ferment as per the above conditions. The samples obtained from the fermentation together with the raw milk (RM) samples were also analyzed for pH, TTA, TSS and consistency. Response parameters were represented with model equations and their respective coefficients from Minitab. The optimal processing conditions obtained were fermentation temperature at 32 °C and fermentation time for 140 h. Amasi was obtained at these fermentation conditions and similar parameters (pH, TTA, TSS and consistency) were determined.

2.8. Bacteria Composition of Amasi Using Amplicon Sequencing/Metabarcoding

2.8.1. Deoxyribonucleic Acid (DNA) Extraction of Amasi and Data Analysis of Microbial Composition

The bacterial DNA extraction was performed using a ZymoBIOMICS DNA miniprep kit (Inqaba Biotech, Pretoria, South Africa). A total of three DNA samples was extracted from the raw milk (RM), and 25 °C (OP25) and 32 °C (OP32) optimized fermented milk samples. The extracted DNA was stored at −80 °C for further processing. The quality and concentration of the DNA was determined using a nano-drop equipment (Implen Nanophotometer N60—Touch, Cape Town, South Africa). The extracted DNA was subsequently sent to Inqaba Biotech Pty (Ltd), Johannesburg, South Africa, for 16S rRNA sequencing. The hypervariable regions targeted were V3–V4 of the 16S rRNA gene and were sequenced on an Illumina MiSeq. This was amplified using the primer pair: 5′-CCTACGGGNGGCWGCAG-3′ and 5′-GACTACHVGGGTATCTAATCC-3′.
The analysis for bacterial composition was achieved using the quantitative insights into microbial ecology (Qiime2) version 2019.10 [27] with demux plugins (https://github.com/qiime2/q2-demux (accessed on 24 May 2021)) [28]. The data for 16S rRNA sequencing was received in the fastq file format and included forward and reverse paired-end reads. The 16S rRNA data was de-multiplexed at the sequencing facility. The forward and reverse reads were combined into one “qza” file in the conda environment and imported into Qiime2 with the use of the Casava 1.8 pipeline (paired-end). The length of nucleotides to trim and truncate, for the subsequent qiime denoise analysis, was attained from the demux.qzv visualization. The demux.qzv visualization presented the quality scores of the data, which permitted the removal of data with a reading that was lower than Phred33 scores. Using the Deblur plugin, the chimeric sequences and sequence variant calling of the Illumina-amplicon sequences were removed.
The assignments for bacterial taxonomy were analyzed using qiime feature-classifier and a pre-trained Naìve-Bayes classifier SILVA 138 database was used for the classification of bacteria [29]. The analysis of compositional and taxonomic data was performed using feature-classifier plugins [30] and taxa (https://github.com/qiime2/q2 (accessed on 28 May 2021)). The sequences were discarded based on the similarity, resulting in operation taxonomic units (OTUs), as well as the generation of representative sequence for each OTU [31]. The final representative sequences, denoted as OTUs, were used for downstream taxonomic assignment. The feature table was then used to produce a phylogenetic tree with the “phylogeny fasttree” command [32].

2.8.2. Exploratory Analyses

Exploratory analysis was conducted using R v.3.5.1 and Bioconductor v.3.0 [33]. Taxonomic classification readings were standardized and visualized using the phyloseq and microbiomeSeq packages.

2.9. Statistical Analysis

The analyses were performed in triplicates. The data produced was analyzed using IBM SPSS statistics (Armonk, NY, USA) software in order to determine the significance of variance between the means, and was expressed as ± to represent the standard deviation (SD). The degree of freedom was set at p ≤ 0.05.

3. Results and Discussion

The effect of fermentation time and temperature (independent variables) on pH, TSS, TTA and consistency (dependent variables) of amasi were investigated. Central composite design (CCD) was used to study the relationship between the independent and dependent parameters, and later used to quantify the optimum conditions. Table 3 represents the physicochemical analysis (pH, TSS, TTA and consistency), and Table 4 represents the analysis of variance (ANOVA) that was done based on the experimental runs (Table 2). The data was later analyzed using multi-response numerical optimization (Minitab) and k-means to obtain the optimal sample (OP), and physicochemical analysis was also repeated on the optimal sample.

3.1. Optimization of Fermentation Conditions (Time and Temperature) of Amasi

The experimental results on the effect of fermentation time and temperature on the processing of amasi from raw milk are shown in Table 3. The ANOVA (Table 4) was used as part of the search for a solution to examine the best fit of the produced model. The capability of the models was obtained by the coefficients of the determination values and lack-of-fit tests [16,34]. The optimized data is represented in Table 5; the experimental data was analyzed to investigate the lack-of-fit and the importance of the quadratic model, as well as the effect of interaction between the input and output variables.
The lack-of-fit test was defined by Gan et al. [35] as a dimension of the let-down of a model to display the trial results at the point not shown in the regression, and Lima et al. [36] found that the goodness-of-fit of the model was obtained by the constant of determination (R2) and can be approximately 80%. Accordingly, the p-value can be used to determine the significance of each constant in a data set. When the F-value is high and the p-value is low, it means that the conforming constant is more important.
The F-values and p-values of ≤ 0.05 indicate that the quadratic model of amasi development is statistically important at 95% confidence. Except for accuracy, which was negligible with a p-value of 0.440, the lack of fit for each response factor is important. The R2 values for all the responses were less than or equal to 80%, indicating that the model clearly explains a large proportion of the variability [
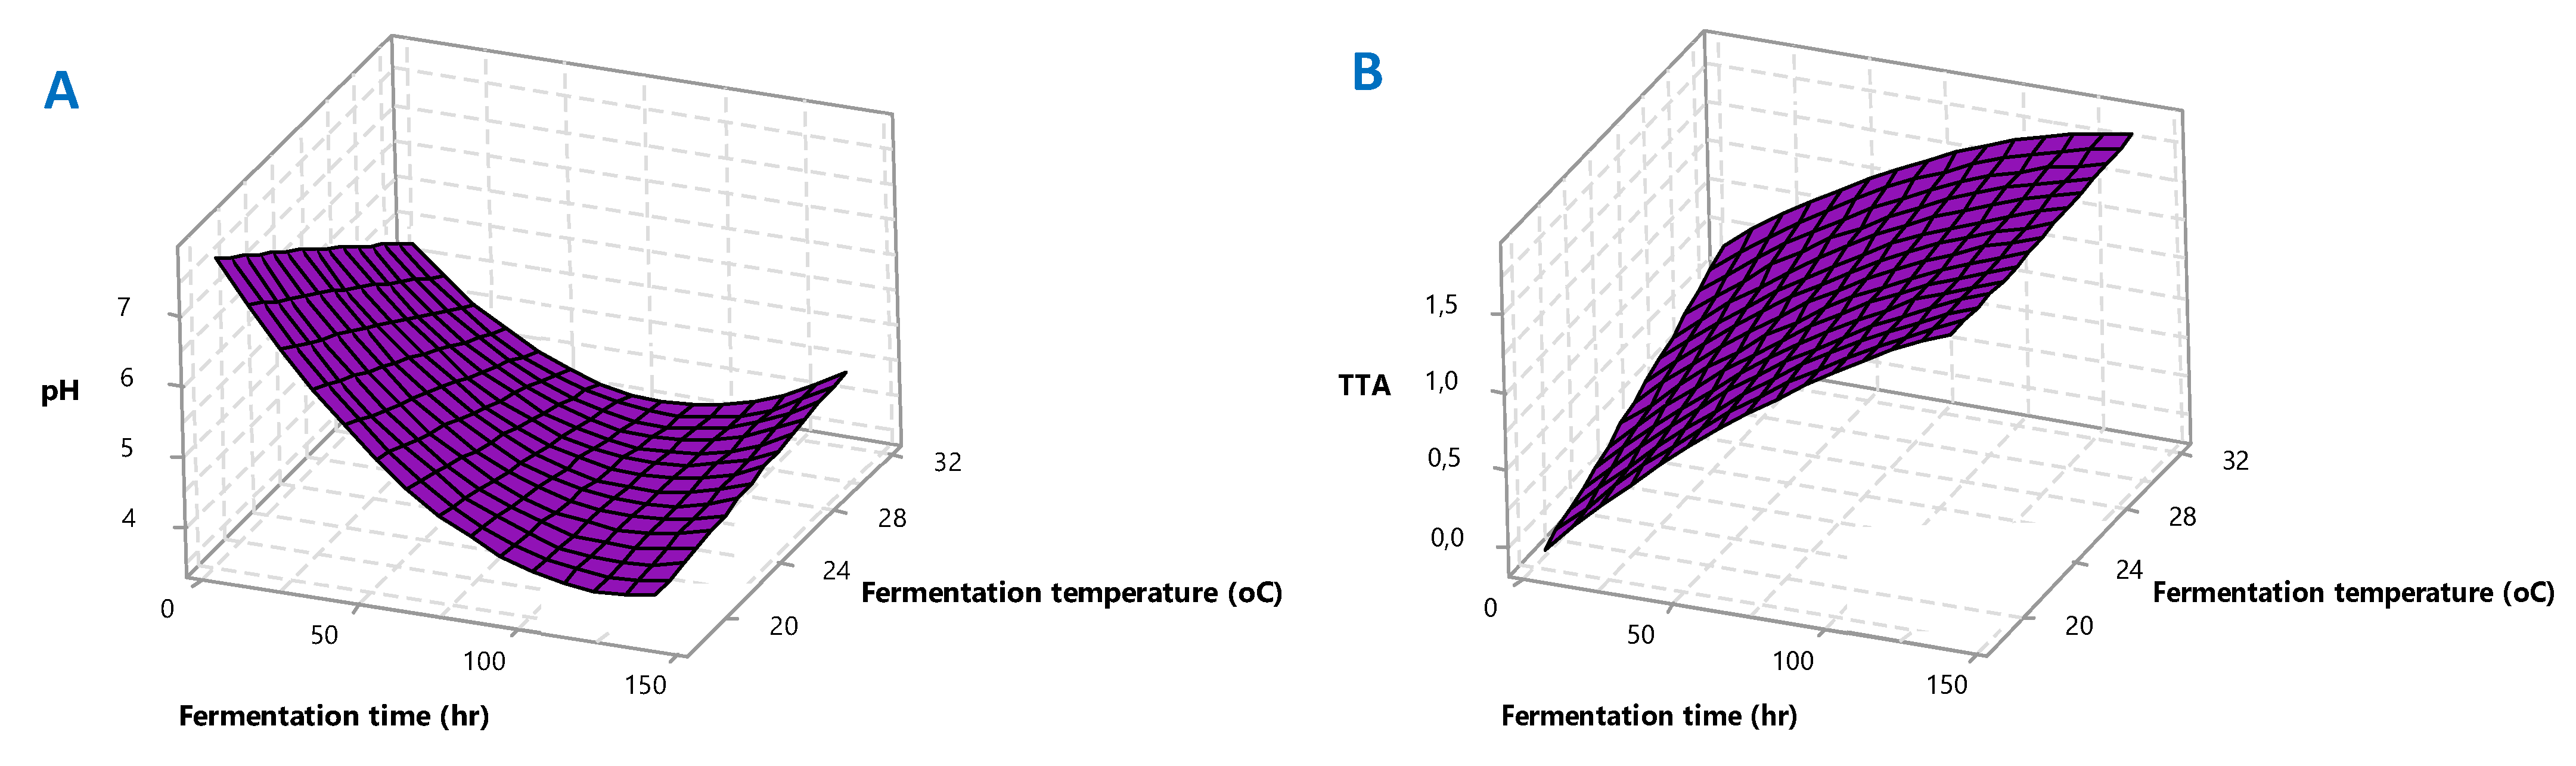
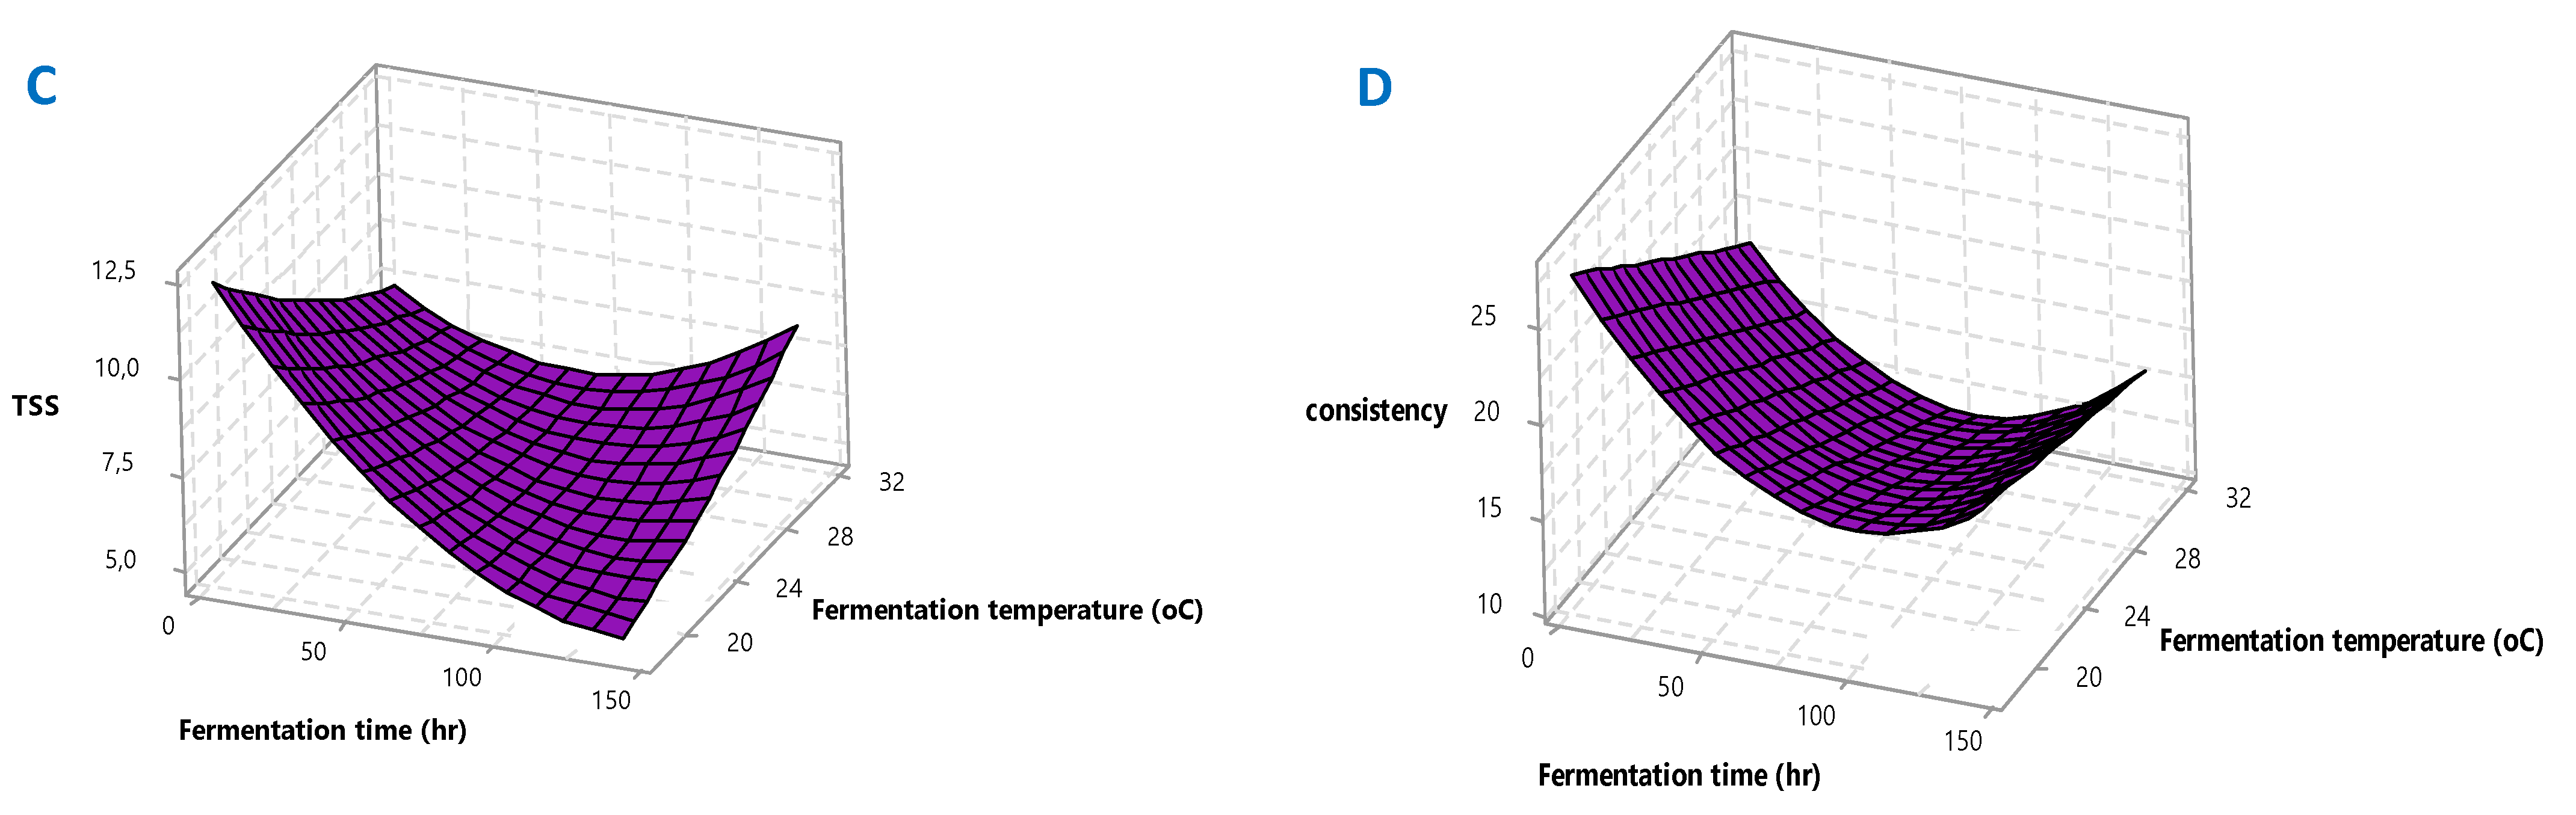
37]. The 3D response surface plots for pH, TTA, TSS and consistency are given in Figure 2A–D for better visualization. The polynomial equations and 3D plots were used to identify the mathematical solution of optimization.

3.2. The Effect of Fermentation Conditions on Physicochemical Properties of Amasi

The pH, TTA, TSS and consistency of amasi were taken at the end of each fermentation, and is illustrated in Table 3. The changes of physicochemical properties were affected by the fermentation conditions (time and temperature). As anticipated, the pH value of raw milk significantly (p ≤ 0.05) decreased from the initial value of 6.64 (Table 5) throughout the whole fermentation time. It was observed that the highest pH value of 6.76 was recorded at 4.11 h, which decreased to 3.83 (43.34% decrease) after 139 h. This was in correspondence with the TTA of 0.02% at 4.11 h, and this increased to 1.17% at the longest time. This was expected since the value of pH is inversely proportional to the lactic/organic acids content [38]. A similar decrease in pH and simultaneous increase in TTA with the increasing fermentation time have been reported in other studies [8,16]. The acidic conditions within the environment allow most fermenting microorganisms such as LAB species (Lactococcus and Streptococcus) to be more active, thus causing a low pH and high TTA value. These microorganisms produce lactic acid and other organic acids; this might be due to the degradation of some carbohydrate and sugar-related components [39,40]. The inverse relationship of pH and TTA is good for the product because, in acidic conditions, most pathogenic microorganisms are inhibited, thereby improving the microbiological safety of the product [41]. The use of low fermentation temperatures (20–25 °C) resulted in high pH and low TTA values (6.32–6.76; 0.02–0.02%), as compared to the high fermentation temperatures (25–32 °C) that resulted in low pH and high TTA values (3.83–3.96; 0.11–0.17%). The high pH values observed could be associated with the increased metabolic activities of the fermenting microorganisms [19].
Central composite design was used to optimize the fermentation conditions using the mini tab; the polynomial model for responses (Y1—pH, Y2—titratable acidity, Y3—total soluble solids, Y4—consistency) was regressed by taking only the significant terms into consideration, and the equations for each response are represented below:
Y 1 = 11.07 0.0947 x 1 0.165 x 2 + 0.000267 x 1 2 0.00035 x 2 2 + 0.001563 x 1 x 2
Y 2 = 0.79 + 0.0258 x 1 + 0.025 x 2 0.000041 x 1 2 + 0.00058 x 2 2 0.000354 x 1 x 2
Y 3 = 24.37 0.1873 x 1 0.798 x 2 + 0.000378 x 1 2 + 0.00857 x 2 2 + 0.00432 x 1 x 2
Y 4 = 40.8 0.286 x 1 0.70 x 2 + 0.001132 x 1 2 + 0.0006 x 2 2 + 0.00323 x 1 x 2
where Y1 is the pH, X1 is the fermentation time, and X2 is the fermentation temperature. The R2 value of the equation was 0.92 (92%); this indicated that the regression model could explain 92% of the data variability. The one-degree term X1 and X2 were significant at p ≤ 0.05, suggesting that fermentation temperature and fermentation time have a significant linear effect on pH values. The effect is also reflected in the response surface plot (Figure 2A). As observed in Table 6, only one-degree term X1 and X2 were extremely significant (p ≤ 0.05); this means that fermentation time and fermentation temperature have a significant effect on TTA values (Y2). It can also be visually observed in Figure 2B. On the other hand, X22 had no significant effect on all the investigated parameters. For the TSS model (Y3), only X1, X12, and X1X2 were significant (Table 6), and R2 was found to be 0.92 (Table 4), portraying 92% reproducibility. On the other hand, in consistency, it was X1, X2 and X12 that had an R2 value of 0.80. The singular effects X1 and X2 were significant at p ≤ 0.05, suggesting that fermentation temperature and time have a significant linear effect on TSS and consistency. The effect is also reflected in the response surface plot (Figure 2C,D).
The experimental values of TSS (Y3) and consistency (Y4) of the amasi samples are represented in Table 3. The F-value (16.21) and p-value (0.001) indicated that the model for optimizing TSS in amasi was significant (Table 4). The TSS value of amasi decreased with an increasing fermentation time. The lowest TSS value of amasi observed was with a higher fermentation time (140 h) which was 5.80 °Brix and the highest was 10 °Brix and 9.60 °Brix at a lower fermentation time (24 and 4 h). This suggests that TSS of amasi depends on the acid production and as the pH values were decreasing, the TSS values also decreased. This is also an indication that longer fermentation periods resulted in increased sugar metabolism and biotransformation of these components [42]. A similar trend was reported in yoghurt samples, where the TSS values decreased with the decreasing pH values and increased fermentation temperature [43].
The consistency (cm) of amasi samples show a similar trend to TSS; a more viscous sample was observed at higher temperatures. For instance, at 32 °C, a consistency of 11 cm was observed, while a higher consistency of 23 cm was observed at lower temperatures (20 °C). A higher consistency indicates that the sample was less viscous compared to that of a higher consistency. Amasi at 32 °C had more whey as it was fermented at higher temperatures, and this caused the product to be thicker because the whey was removed at the end of the fermentation. The result was also similar to that reported in mabisi from Zambia [8], as well as in a fermented milk product from Malaysia [16]. There are limited studies that have reported the consistency of natural fermented dairy products using Bostwick or any equipment to measure consistency. Monyane and Jideani [44] only analysed the viscosity of commercially produced amasi using a viscometer.

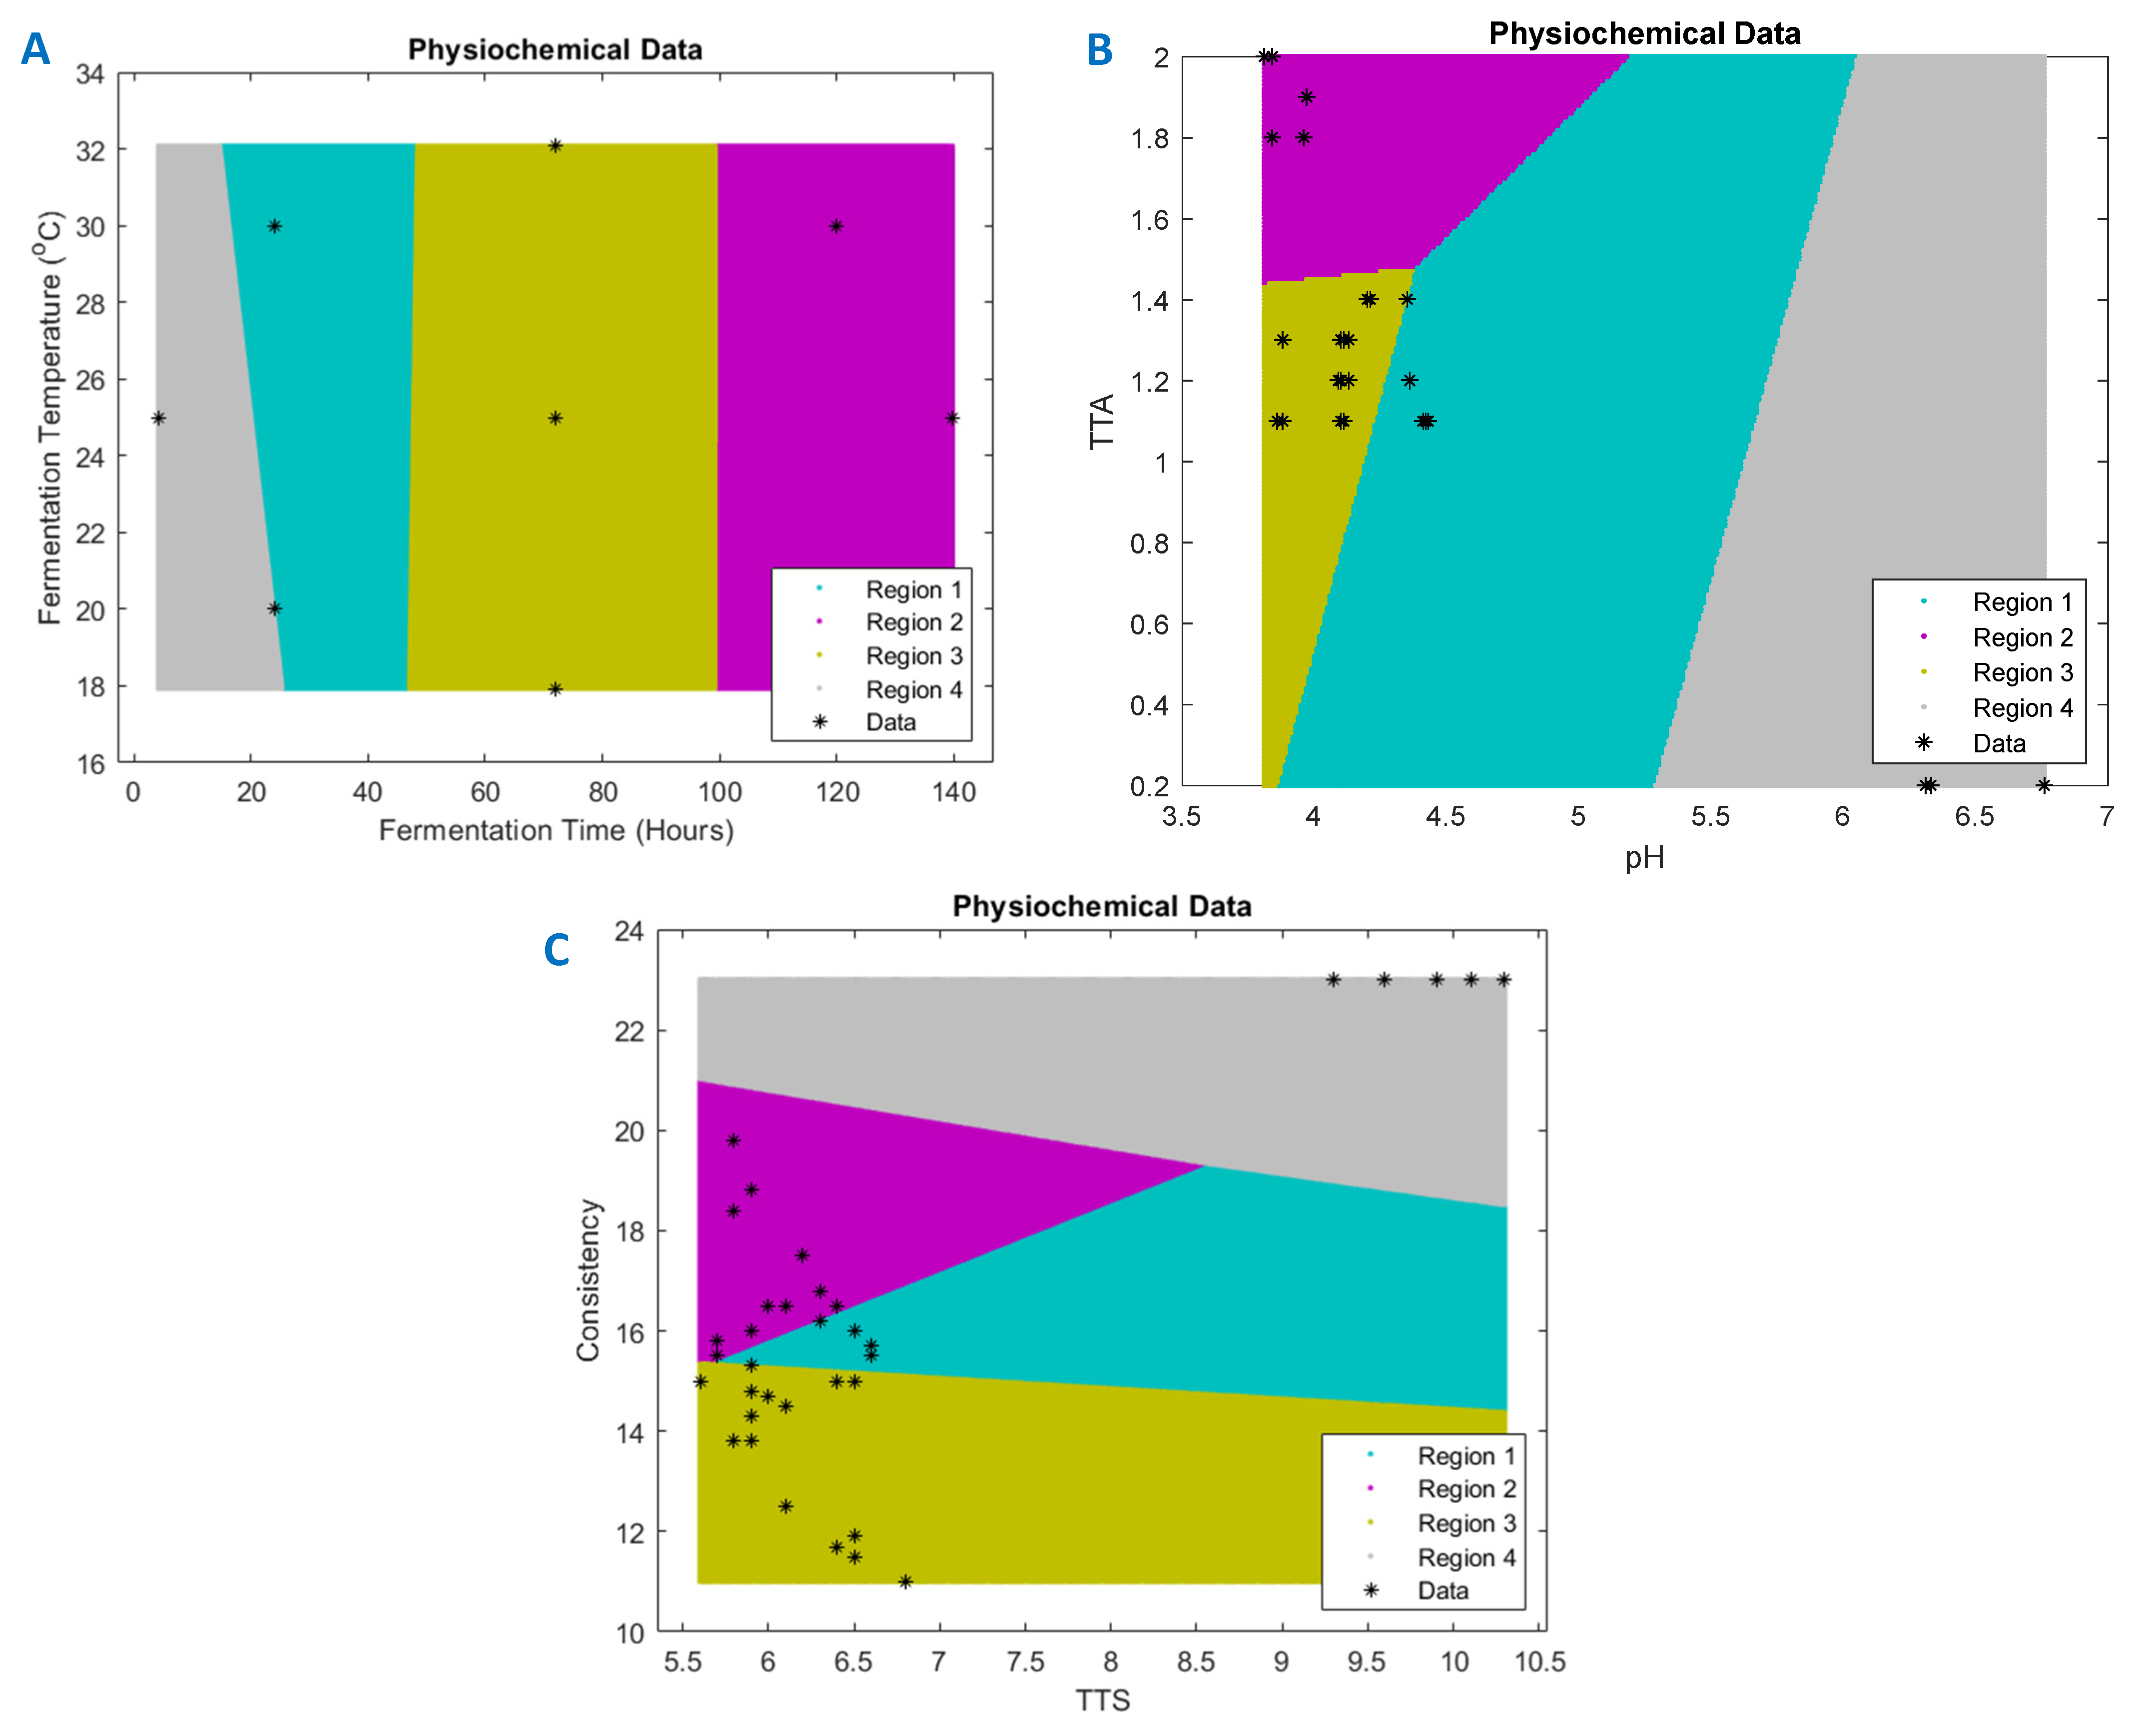
3.3. RSM Model Validation Using k-Means Clustering

The k-means clustering is a method used to obtain clusters and cluster centres in a data set. The data set obtained from the RSM experimental runs (Table 2) was used to generate the k-means clustering on MATLAB R2020a (MathWorks, Natick, MA, USA). The input features analysed in this study were fermentation time and fermentation temperature, while the output features were pH, TTA, TSS, and consistency. The rows were labelled as observations and columns as variables. The model generated four regions per plot (Figure 1A–C), and each cluster was represented in a different colour of a region. The desired number of clusters that was chosen for this study was four, and the k-means procedure iteratively moved the centres to reduce the total with the cluster variance.
The k-means clustering technique is a very simple technique that can be used in combination with the RSM technique to go beyond point estimates and group experimental instances into clusters and analyse regions of optimality. Additionally, it can competently deal with a large data set at once, although there are some weaknesses of using k-means. A drawback of this technique is that it is unsupervised and thus the number of clusters need to be specified. The resulting optimal fermentation conditions were 32 °C at 140 h and 25 °C at 120 h. According to the k-means clustered results, these optimal points are within two of the clustered ‘regions’ or solution subspaces. The response variables for these conditions, which were done in triplicate, are represented in Table 5.

3.4. Amplicon Sequencing/Metabarcoding of the Naturally Fermented-Amasi

Most natural fermented dairy products are dominated by species of acetic acid and lactic acid bacteria. The bacterial composition between samples of the same product may differ due to variations in their source of raw material, processing, fermentation time, and temperature. Moonga et al. [45] observed that Zambian fermented milk, mabisi (a product similar to amasi), depended on the production method, pH, and geographical location of the sample. This study investigated the bacterial composition of three different samples using next generation sequencing; the extracted DNA was sequenced for 16S rRNA on an Illumina MiSeq at Inqaba Biotech. The raw cow milk sample (RM) was compared with two amasi samples fermented at different temperatures: OP25 and OP32. The results obtained showed that fermentation conditions have an influence on the microbial community of fermented dairy products. Previous studies on the microbiota of amasi processed from raw milk included various species from LAB, Enterococcus, and yeast [4,13,15,45].

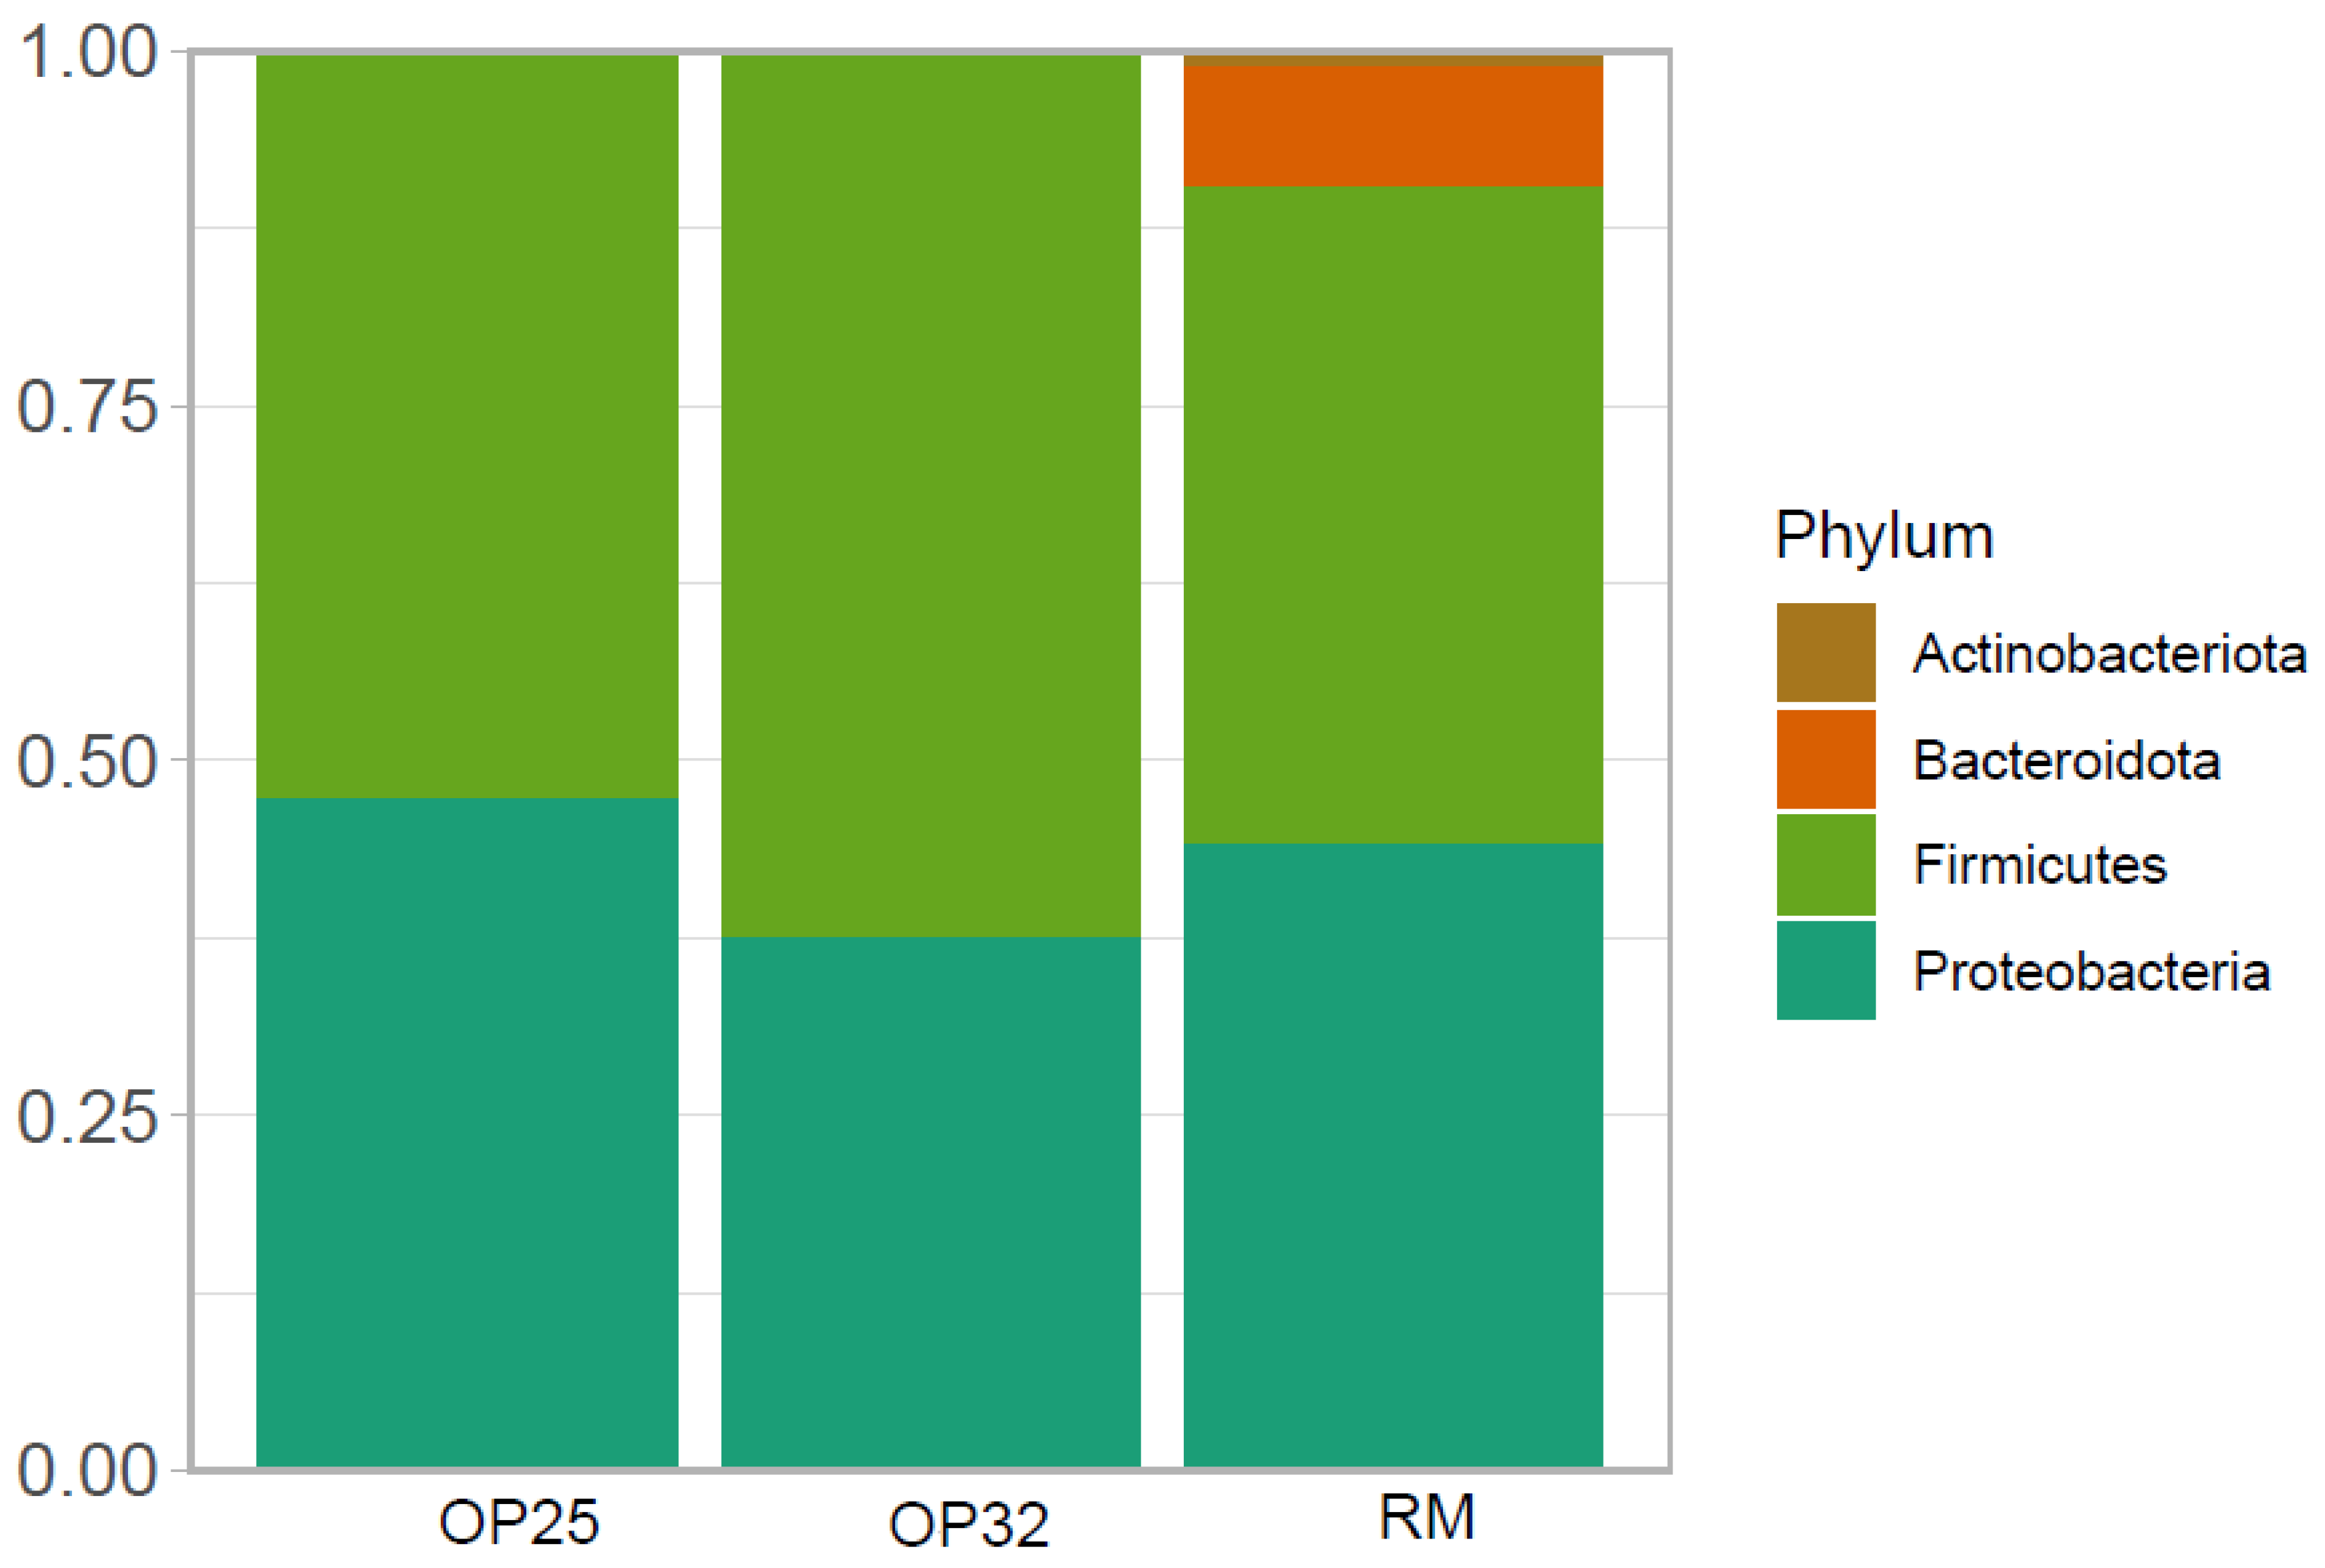
3.4.1. Microbiological Composition of Bacterial Communities at Phyla Level

In the present study, four phyla were detected in the three samples (RM, OP25 and OP32), and are summarized in Figure 3. The bacterial reads of amasi were clustered further into six classes, 20 families, and six species (discussed in subsequent sections). The bacterial composition of all three samples were dominated by Firmicutes and Proteobacteria. Bacteroidetes was only dominant in raw milk as compared to the two amasi samples. The most dominant phylum in all three samples was Firmicutes. The members of the phyla Firmicutes and Proteobacteria were also reported by [15] in mabisi, a fermented dairy product from Zambia. Comparing the raw milk with the two amasi samples, the bacterial composition at the phylum level seems to be decreasing excessively from the raw milk sample. As the fermentation temperature and time were increased for amasi, the Firmicutes also increased in the M32 sample due to a decreased pH which could give an increased bacterial composition. A similar trend was also reported by [43], where an elevation of fermentation temperature and low pH favoured the survival of Lactobacillus, which belongs to the phyla Firmicutes.

3.4.2. Microbiological Composition of Bacterial Communities at Class Level

The bacterial community at class level was more abundant in raw milk than in fermented milk. In the three classes observed (Figure 4), Bacilli was the most abundant in all three samples. Within the phylum Firmicutes, Bacilli was dominant in raw milk, followed by Bacteroidetes and Gammaproteobacteria from the phyla Bacteroidetes and Proteobacteria. Alphaproteobacteria was the second most abundant class in both amasi fermented at 25 and 32 °C. In amasi fermented at 25 °C, Gammaproteobacteria was the third abundant. At low pH levels between 3.83–4.10, the two classes (Clostridia and Actinobacteria) were observed to be less abundant in amasi fermented at 25 and 32 °C.

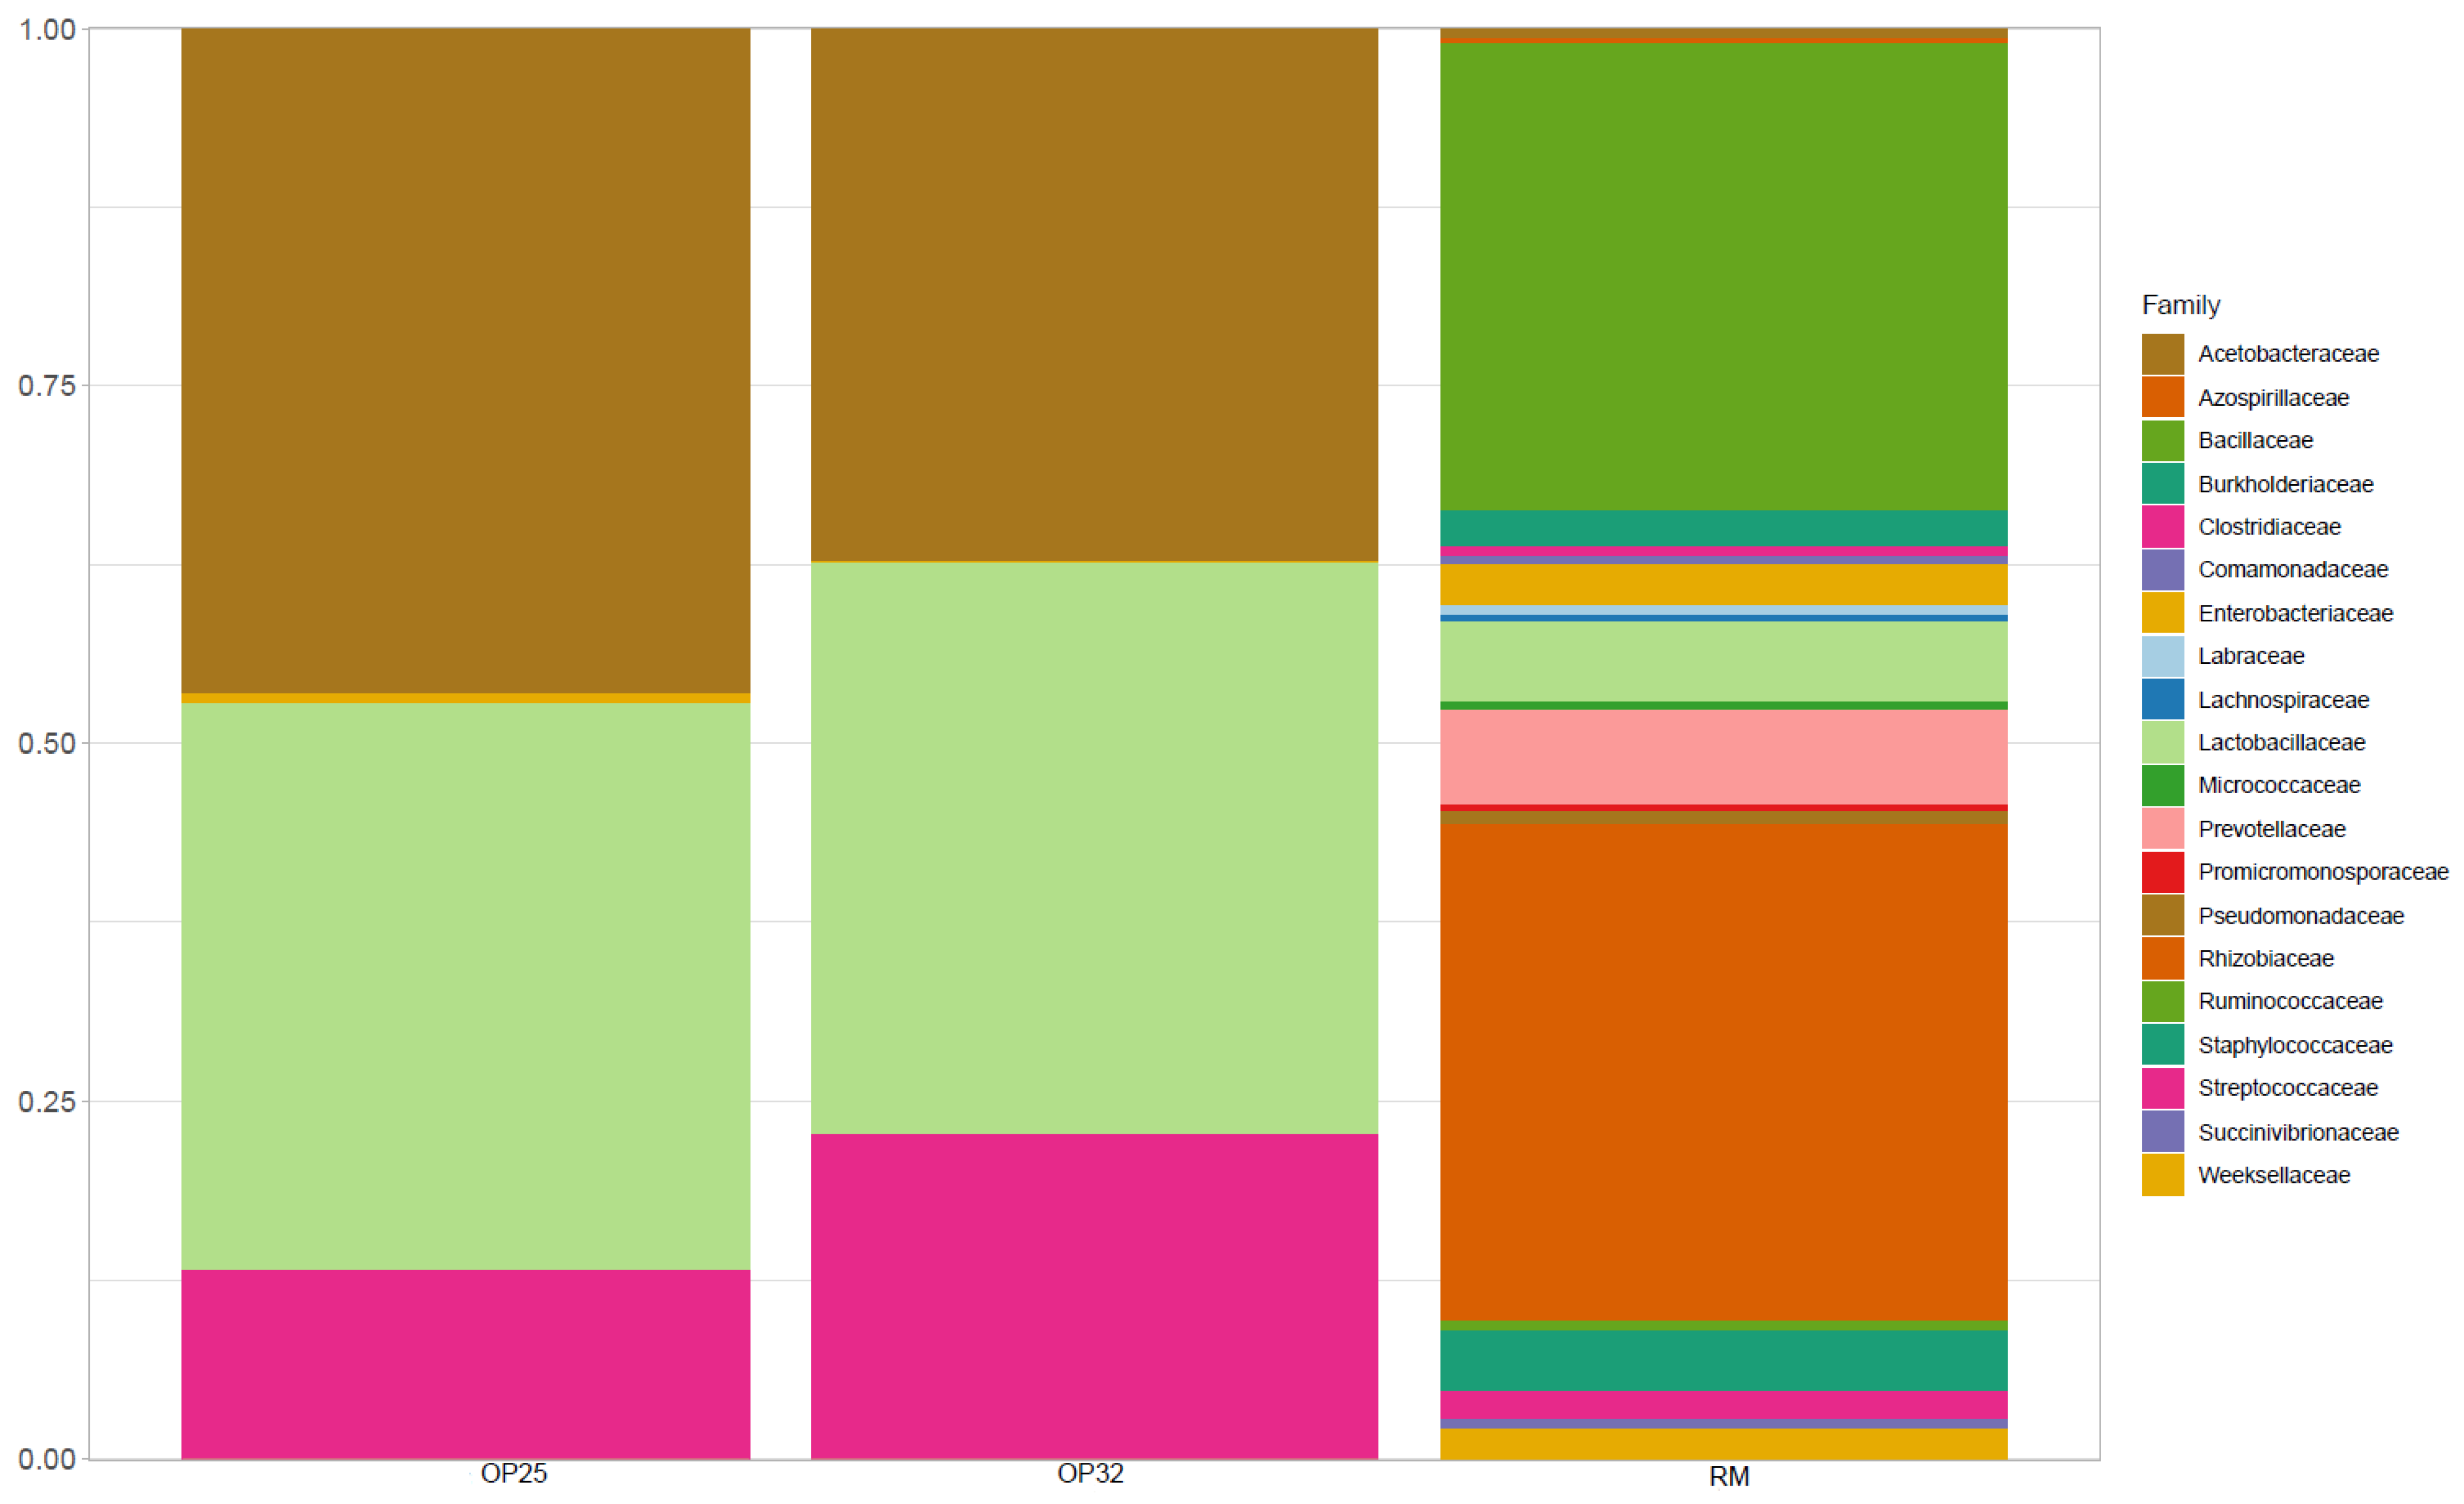
3.4.3. Microbiological Composition of Bacterial Communities at Family Level

A total of 20 bacterial communities at the family level were reported (Figure 5). Lactobacillaceae was found to be the most abundant in both amasi samples fermented at 25 and 32 °C, but was less abundant in the raw milk sample. Prevotellaceae was the most dominant in raw milk, while it was found in less abundance for the amasi samples. Streptococcaceae is observed to be in high abundance, followed by Acetobacteraceae in M32, but found to be decreasing in M25. They were low in abundance from RM, and started to increase in M25 as the pH decreased from 6.64 to 3.99 (25 °C), and it further increased in M32 as pH decreased to 3.44 (32 °C). Prevotellaceae, which was more dominated in the raw milk, started to decrease when the fermentation was initiated. De Waal [10], reported the presence of Prevotell copri (AB064923) species within family Prevotellaceae on fresh unfermented milk, while it was absent in fermented milk. The abundance of Lactobacillaceae and Streptococcaceae over other families suggested the dominance of LAB during the fermentation process, and this was equally reported in other studies [8,10,46]. In Southern Africa, raw cow milk is rarely consumed due to the occurrence of lactose intolerance and other safety reasons. During the processing of amasi, most of the lactose is converted into lactic acid and other compounds by microorganisms present during fermentation. This also facilitates better nutritional contents in amasi as compared to raw milk. The dominance of Lactobacillaceae and Streptococcaceae in amasi is acceptable due to LAB being considered as a healthy bacterium that may allow shifts in gut microbiota composition and healthier composition [46].
According to Moonga [15], fermentation temperature (25–30 °C) and pH (4.1–4.3) have an influence in determining the composition of bacteria in fermented milk. In this study, fermentation temperature and pH allowed the growth of some species from the families that were observed in Figure 5. At species level, most species were not detected; this was also reported in previous studies [10,13,46]. This could be due to the short fragment that was used for sequencing because only V3–V4 hypervariable regions were sequenced in this study.

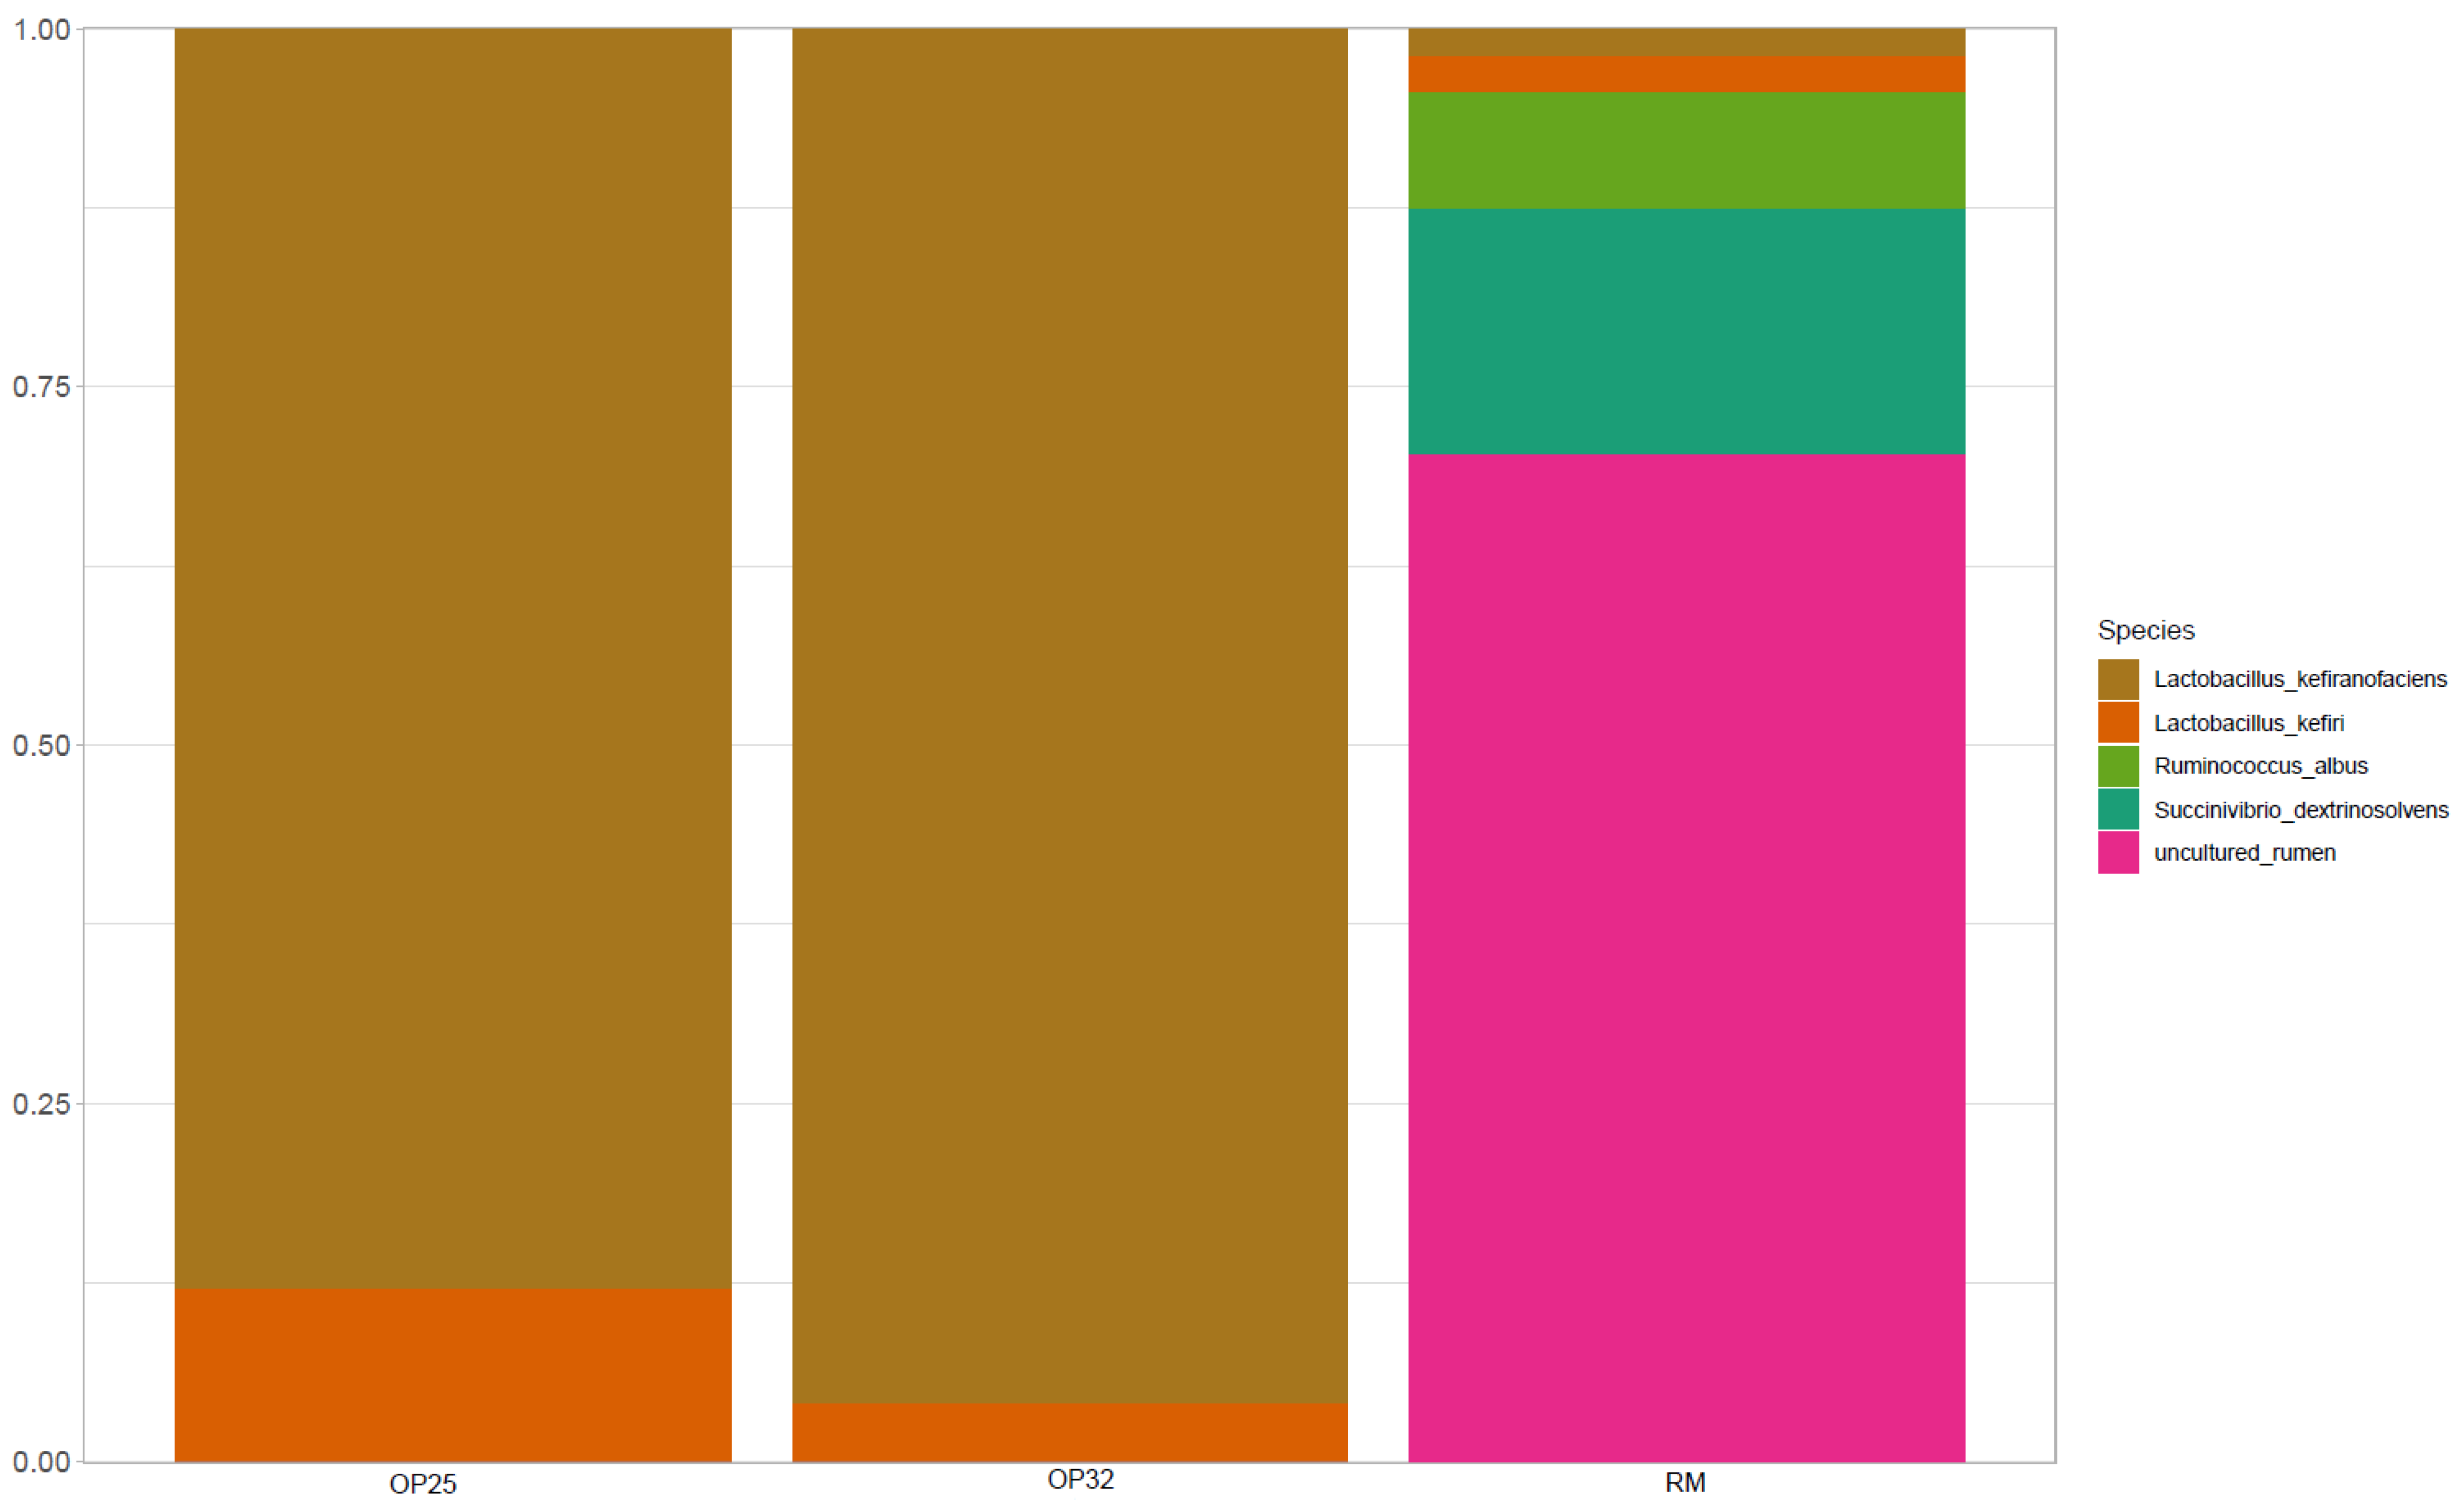
3.4.4. Microbiological Composition of Bacterial Communities at Species Level

At species level, the dominant species in all three samples (Figure 6) were potentially classified as ‘N/A’, followed by uncultured rumen, which was only dominant in raw milk. While in OP32 and OP25 it was observed in low abundance, Lactobacillus kefiranofaciens was found to be the second dominant species, but less abundant in OP25. The Lactobacillus kefiranofaciens species was observed to be in low abundance in raw milk. Lactobacillus kefiri slightly increased as fermentation was initiated. Lactobacillus kefiranofaciens was reported to be in abundance in mabisi in a study reported by Schoustra et al. [4], while Lactobacillus kefiri was reported in mursik, a fermented milk product from Kenya [6], and also in omashikawa from Namibia [3]. The results show that fermentation temperature has a significant influence on the bacterial community composition. The low pH also plays an important role, as an acidic environment is required by most microorganisms for the fermentation process.

4. Conclusions

The processing of amasi from raw milk under optimized fermentation time and temperature using the RSM tool and in combination with unsupervised machine learning algorithms for optimization analysis and validation was successful. The unsupervised learning technique also yields optimal regions or solution subspaces which are useful, due to the variability of experimental conditions, in contrast to being solely dependent on points estimated from the RSM. The fermentation conditions (time and temperature) had a significant influence on the parameters investigated on this study. The resulting low pH values and high total titratable acidity also reduced the consistency of amasi. The low pH also influenced the bacterial composition of amasi. Lactic acid bacteria were found to be dominant in amasi samples at the family level (Lactobacillaceae), while in raw milk, Prevotellaceae was found to be the one dominating. Future investigation is recommended in identifying yeast microorganisms present in amasi, isolation of these microorganisms, and whole genome sequencing of the microorganisms to fully understand the significance of these organisms in amasi.

Author Contributions

Conceptualization, O.A.A.; methodology, M.M., W.D., A.M.A., M.A.A., K.M. and O.A.A.; validation, M.M., W.D., A.M.A., M.A.A. and O.A.A.; formal analysis, M.M.; investigation, M.M.; resources, O.A.A.; data, M.M., A.M.A. and O.A.A.; writing (original draft), M.M.; review and editing, M.M., W.D., A.M.A., M.A.A., K.M. and O.A.A.; supervision, W.D., M.A.A. and O.AA. All authors have read and agreed to the published version of the manuscript.

Funding

The research was funded by the University of Johannesburg (UJ) Global Excellence and Stature (GES) 4.0 Catalytic Initiative Grant, and the National Research Foundation (NRF) of South Africa Grant Holder Linked Bursary and Thuthuka funding (Grant no: 121826).

Institutional Review Board Statement

Not applicable.

Informed Consent Statement

Not applicable.

Data Availability Statement

The data generated and analysed during the current study is available from the corresponding author on reasonable request.

Acknowledgments

Special thanks also go to members of the Food Innovation Research Group (FIRG), Witness Qaku, Lanrewaju Ibrahim Fajimi, Ajibola Oyedeji and Opeolu Ogundele for their assistance.

Conflicts of Interest

The authors declare no conflict of interest.

Abbreviations

ANOVAAnalysis of variance
ARCAgricultural Research Council
CCDCentral composite design
LABLactic acid bacteria
MATLABMatrix laboratory
NaOHSodium hydroxide
NANot applicable
OPOptimized
OUTOperation taxonomic units
TFMTraditional fermented milk
TSSTotal soluble solids
TTATitratable acidity
RMRaw milk
SCStarter culture

References

  1. Maleke, M.S.; Adefisoye, M.A.; Doorsamy, W.; Adebo, O.A. Processing, nutritional composition and microbiology of amasi: A Southern African fermented milk product. Sci. Afri. 2021, 12, e00795. [Google Scholar] [CrossRef]
  2. Agyei, D.; Owusu, K.J.; Akabanda, F.; Akomea, F.S. Indigenous African fermented dairy products: Processing technology, microbiology and health benefits. Crit. Rev. Food Sci. Nutr. 2019, 60, 991–1006. [Google Scholar] [CrossRef] [PubMed]
  3. Schutte, L.M. Isolation and Identification of the Microbial Consortium Present in Fermented Milks from Sub-Saharan Africa; Stellenbosch University: Stellenbosch, South Africa, 2013. [Google Scholar]
  4. Schoustra, S.E.; Kasase, C.; Toarta, C.; Kassen, R.; Poulin, A.J. Microbial community structure of three traditional Zambian fermented products: Mabisi, chibwantu and munkoyo. PLoS ONE 2013, 8, e63948. [Google Scholar] [CrossRef] [PubMed] [Green Version]
  5. Beukes, E.M.; Bester, B.H.; Mostert, J.F. The microbiology of South African traditional fermented milks. Int. J. Food Microbiol. 2001, 63, 189–197. [Google Scholar] [CrossRef]
  6. Akabanda, F.J.; Owusu, K.K.; Tano, D.C.; Glover, D.S.; Nielsen, D.S.; Jespersen, L. Taxonomic and molecular characterization of lactic acid bacteria and yeasts in nunu, a Ghanaian fermented milk product. Food Microbiol. 2013, 34, 277–283. [Google Scholar] [CrossRef]
  7. Gadaga, T.H.; Mutukumira, A.N.; Narvhus, J.A.; Feresu, S.B. A review of traditional fermented foods and beverages of Zimbabwe. Int. J. Food Microbiol. 1999, 53, 1–11. [Google Scholar] [CrossRef]
  8. Moonga, H.B.; Schoustra, S.E.; Linnemann, A.R.; Kuntashula, E.; Shindano, J.; Smid, E.J. The art of mabisi production: Traditional fermented milk. PLoS ONE 2019, 14, e0213541. [Google Scholar] [CrossRef] [Green Version]
  9. Todorov, S.D.; Nyati, H.; Meincken, M.; Dicks, L.M.T. Partial characterization of bacteriocin AMA-K, produced by Lactobacillus plantarum AMA-K isolated from naturally fermented milk from Zimbabwe. Food Control 2007, 18, 656–664. [Google Scholar] [CrossRef]
  10. de Waal, P.J. The Biodiversity and Description of Microbiota in Traditionally Fermented Milk Products: A Study in Rural South Africa. Master’s Thesis, University of Cape Town, Cape Town, South Africa, 2020. [Google Scholar]
  11. Kim, I.S.; Hur, Y.K.; Kim, E.J.; Ahn, Y.T.; Kim, J.G.; Choi, Y.J.; Huh, C.S. Comparative analysis of the microbial communities in raw milk produced in different regions of Korea. Asian-Australas. J. Anim. Sci. 2017, 30, 1643. [Google Scholar] [CrossRef] [Green Version]
  12. Kayitesi, E.; Behera, S.K.; Panda, S.K.; Dlamini, B.; Mulaba-Bafubiandi, A.F. Amasi and mageu expedition from ethnic Southern African foods to cosmopolitan markets. In Fermented Food—Part II: Technological Interventions; Ray, R.C., Montet, D., Eds.; CRC Press: New York, NY, USA, 2017; pp. 385–388. [Google Scholar]
  13. Osvik, C.D.; Sperstard, S.; Brenies, E.; Hereida, E.; Goadfroid, J.; Zhou, Z.; Ren, P.; Geoghegan, C.; Holzapfel, W.; Ringo, E. Bacteria of diversity of amasi, a South African fermented milk product, determined by clore library & denating gradient gel electrophoresis analysis. Afr. J. Microbiol. Res. 2013, 7, 4146–4158. [Google Scholar]
  14. Chileshe, J.; van den Heuvel, J.; Handema, R.; Zwaan, B.J.; Talsma, E.F.; Schoustra, S. Nutritional composition and microbial communities of two non-alcoholic traditional fermented beverages from Zambia: A study of mabisi and munkoyo. Nutrients 2020, 12, 1628. [Google Scholar] [CrossRef] [PubMed]
  15. Moonga, H.B. Product Optimization of Zambian Traditionally Fermented Milk-Mabisi. Ph.D. Thesis, Wageningen University, Wageningen, The Netherlands, 2019. [Google Scholar]
  16. Yaakob, H.; Ahmed, N.R.; Daud, S.K.; Malek, R.A.; Rahman, R.A. Optimization of ingredients and processing levels for the production of coconut yoghurt using response surface methodology. Food Sci. Tech. 2012, 21, 933–940. [Google Scholar]
  17. Hlangwani, E.; Doorsamy, W.; Adebiyi, J.A.; Ibrahim, L.I.; Adebo, O.A. A modelling method for the development of a bioprocess to optimally produce umqombothi (a South African traditional beer). Sci. Rep. 2021, 11, 20626. [Google Scholar] [CrossRef]
  18. Liang, S.; Wanf, F.; Chen, J.; Granata, D.; Li, L.; Yin, J.-F.; Xu, Y.-Q. Optimization of a tannase-assisted process for obtaining teas rich in theaflavins from Camelia sinensis leaves. Food Chem. X 2022, 13, 100203. [Google Scholar] [CrossRef]
  19. Adebo, O.A.; Njobeh, P.B.; Adebiyi, J.A.; Kayitesi, E. Co-influence of fermentation time and temperature on physicochemical properties, bioactive components and microstructure of ting (a Southern African food) from whole grain sorghum. Food Biosci. 2018, 25, 118–127. [Google Scholar] [CrossRef]
  20. Ayesha, N. A study of data mining tools and techniques to agriculture with applications. Int. J. Trend Res. Dev. 2017, 2, 1–4. [Google Scholar]
  21. Lakshmi, K.; Visalakshi, N.K.A.; Shanthi, S. Data clustering using K-Means based on Crow search algorithm. Indian Acad. Sci. 2018, 43, 1–12. [Google Scholar] [CrossRef] [Green Version]
  22. Gadaga, T.H.; Lehohla, M.; Ntuli, V. Traditional fermented foods of Lesotho. J. Microbiol. Biotechnol. Food Sci. 2013, 2, 2387–2391. [Google Scholar]
  23. Kebede, A.; Viljoen, B.C.; Gadaga, T.H.; Narvhus, J.A.; Lourens-Hattingh, A. The effect of container type on the growth of yeast and lactic acid bacteria during production of Sethemi, South African spontaneously fermented milk. Food Res. Int. 2013, 40, 33–38. [Google Scholar] [CrossRef]
  24. Tomovska, J.; Gjorgievski, N.; Makarijoski, B. Examination of pH, titratable acidity and antioxidant activity in fermented milk. J. Mater. Sci. Eng. 2018, 6, 326–333. [Google Scholar]
  25. Muyambo, S.; Urombo, A.J. Shelf quality studies: Modelling of the flow quality and lactic acid bacteria—Bafidobacteria quantity as parameters for monitoring shelf quality of stirred yoghurt using shelf time, pH, Bostwick consistency and temperature. Int. Res. J. Biol. Bioinform. 2016, 8, 1–12. [Google Scholar]
  26. Hastie, T.; Tibshirani, R.; Friedman, J. Unsupervised learning. The Elements of Statistical Learning: Data Mining, Inference and Prediction; Springer Science and Business Media: New York, NY, USA, 2017; pp. 507–520. [Google Scholar]
  27. Caporaso, J.G.; Kuczynski, J.; Stombaugh, J.; Bittinger, K.; Bushman, F.D.; Costello, E.K. QIIME allows analysis of high-throughput community sequencing data. Nat. Methods 2010, 7, 335–336. [Google Scholar] [CrossRef] [PubMed] [Green Version]
  28. Amir, A.; McDonald, D.; Navas-Molina, J.A.; Kopylova, E.; Morton, J.T.; Zech, X.Z. Deblur rapidly resolves single-nucleotide community sequence patterns. MSystems 2017, 2, e00191-16. [Google Scholar] [CrossRef] [PubMed] [Green Version]
  29. Yilmaz, P.; Parfrey, L.W.; Yarza, P.; Gerken, J.; Pruesse, E.; Quast, C. The SILVA and “all-species living tree project (LTP)” taxonomic frameworks. Nucleic Acids Res. 2014, 42, 643–648. [Google Scholar] [CrossRef] [PubMed] [Green Version]
  30. Mandal, S.; Van Treuren, W.; White, R.A.; Eggesbo, M.; Knight, R.; Peddada, S.D. Analysis of composition of microbiomes: A novel method for studying microbial composition. Microb. Ecol. Health Dis. 2015, 26, 27663. [Google Scholar] [CrossRef] [PubMed] [Green Version]
  31. Schloss, P.D.; Handelsman, J. Introducing DOTUR, a computer program for defining operational taxonomic units and estimating species richness. Appl. Environ. Microbiol. 2005, 71, 501–506. [Google Scholar] [CrossRef] [Green Version]
  32. Price, M.N.; Dehal, P.S.; Arkin, A.P. FastTree 2—Approximately maximum-likelihood trees for large alignments. PLoS ONE 2010, 5, 9490. [Google Scholar] [CrossRef]
  33. Gentleman, R.C.; Carey, V.J.; Bates, D.M.; Bolstad, B.; Dettling, M.; Dudoit, S. Bioconductor: Open software development for computational biology and bioinformatics. Genome Biol. 2004, 5, 80. [Google Scholar] [CrossRef] [Green Version]
  34. Puerari, C.; Strejc, J.; Souza, A.C.; Karabín, M.; Schwan, R.F.; Brányik, T. Optimization of alcohol-free beer production by lager and cachaça yeast strains using response surface methodology. J. Inst. Brew. 2016, 1221, 69–75. [Google Scholar] [CrossRef] [Green Version]
  35. Gan, H.; Karim, R.; Muhammad, S.K.; Bakar, J.; Hashim, D.; Rahman, R. Optimization of the basic formulation of a traditional baked cassava cake using response surface methodology. LWT-Food Sci. Technol. 2007, 40, 611–618. [Google Scholar] [CrossRef]
  36. Lima, C.J.; Coelho, L.; Contiero, J. The use of response surface methodology in optimization of lactic acid production: Focus on medium supplementation, temperature, and pH control. Food Technol. Biotechnol. 2010, 48, 175–181. [Google Scholar]
  37. Varnalis, A.; Brennan, J.; MacDougall, D.; Gilmour, S. Optimization of high temperature puffing of potato cubes using response surface methodology. J. Food Eng. 2004, 61, 153–163. [Google Scholar] [CrossRef]
  38. Güler-Akin, M.B.; Akin, M.S. Effect of cysteine and different incubation temperatures on the microflora, chemical composition, and sensory characteristics of bio-yogurt made from goat’s milk. Food Chem. 2007, 100, 788–793. [Google Scholar] [CrossRef]
  39. Holzapfel, W.H.; Taljaard, J.L. Industrialization of mageu fermentation in Southern Africa. In Industrialization of Indigenous Fermented Foods; Steinkraus, K.H., Dekker, M., Eds.; Taylor and Francis Inc.: New York, NY, USA, 1989; pp. 363–407. [Google Scholar]
  40. Edema, M.O.; Sanni, A.I. Functional properties of selected starter cultures for sour maize bread. Food Microbiol. 2008, 25, 616–625. [Google Scholar] [CrossRef] [PubMed]
  41. Fadahunsi, I.F.; Soremekun, O.O. Production, nutrional and microbiological evaluation of mahewu a South African tradional fermented porriage. J. Adv. Biol. Biotechnol. 2017, 14, 1–10. [Google Scholar] [CrossRef]
  42. Adebo, O.A.; Oyedeji, A.B.; Adebiyi, J.A.; Chinma, C.E.; Oyeyinka, S.A.; Olatunde, O.O.; Green, E.; Njobeh, P.B.; Kondiah, K. Kinetics of phenolic compounds modification during maize flour fermentation. Molecules 2021, 26, 6702. [Google Scholar] [CrossRef] [PubMed]
  43. Wu, S.; Li, D.; Li, S.; Bhandari, B.; Yang, B.; Chen, X.D.; Mao, Z. Effects of incubation temperature, starter culture level and total solids content on the rheological properties of yoghurt. Int. J. Eng 2009, 5. [Google Scholar] [CrossRef]
  44. Monyane, J.N.; Jideani, A.I.D. The physiochemical and sensory evaluation of commercial sour milk (amasi) products. Afr. J. Food Sci. 2013, 7, 56–62. [Google Scholar] [CrossRef]
  45. Moonga, H.B.; Schoustra, S.E.; Linnemann, A.R.; Kuntashula, E.; van den Heuvel, J.; Shindano, J.; Smid, E.J. Influence of fermentation temperature on microbial community composition and physicochemical properties of mabisi, a traditionally fermented milk. LWT-Food Sci. Technol 2021, 136, 1–12. [Google Scholar] [CrossRef]
  46. Chileshe, J.; Talsma, E.F.; Schoustra, S.E.; Borgonjen-Van den Berg, K.J.; Handema, R.; Zwaan, B.J.; Brouwer, I.D. Potential contribution of cereal and milk based fermented foods to dietary nutrient intake of 1–5 years old children in central province in Zambia. PLoS ONE 2020, 15, e0232824. [Google Scholar] [CrossRef]
Figure 1. Plot k-means clustering: (A) fermentation time vs. fermentation temperature; (B) pH vs. TTA (titratable acidity); (C) TTS (total soluble solids) vs. consistency.
Fermentation 08 00057 g001
Figure 2. Response surface plot for the effect of fermentation time and temperature on (A) pH, (B) TTA (titratable acidity), (C) TSS (total soluble solids), (D) consistency.
Fermentation 08 00057 g002aFermentation 08 00057 g002b
Figure 3. Relative abundance of bacterial communities of raw milk and naturally fermented amasi samples at phylum level.
Fermentation 08 00057 g003
Figure 4. Relative abundance of bacterial communities of raw milk and naturally fermented amasi samples at class level.
Fermentation 08 00057 g004
Figure 5. Relative abundance of bacterial communities of raw milk and naturally fermented amasi samples at family level.
Fermentation 08 00057 g005
Figure 6. Relative abundance of bacterial communities of raw milk and naturally fermented amasi samples at species level.
Fermentation 08 00057 g006
Table 1. Experimental ranges for optimization of amasi fermentation conditions (temperature and time).
Levels
FactorsCodes−α−101
Fermentation time (h) X 1 42472120140
Fermentation temperature (°C) X 2 1820253032
X1—fermentation time, X2—fermentation temperature; h—hours, α—alpha, (−α, +α, 0, −1, and 1)—minimum and maximum treatment levels.
Table 2. Experimental combinations for amasi fermentation.
Experimental RunFermentation Time (h)Fermentation Temperature (°C)
17225
27225
37225
47225
57225
614025
7425
812020
92420
1012030
112430
127232
137218
Table 3. Experimental run results for fermentation conditions (X1 and X2).
SampleX1 (h)X2 (℃)pHTTA (% Lactic Acid)TSS (°Brix)Consistency (cm)
172254.10 b ± 0.010.10 b ± 06.13 ab ± 0.2117.43 e ± 0.60
272254.13 c ± 00.11 c ± 0.015.93 a ± 0.1514.03 b ± 0.40
372254.10 b ± 0.010.11 c ± 0.015.90 a ± 0.2016.10 d ± 0.36
472254.11 bc ± 0.150.12 c ± 06.37 b ± 0.2312.10 a ± 0.35
572254.10 b ± 0.100.11 c ± 0.015.87 a ± 0.1514.83 c ± 0.61
6140253.83 a ± 0.170.17 d ± 0.015.80 a ± 0.1715.03 c ± 0.25
74256.76 f ± 00.02 a ± 09.60 c ± 0.3023.00 g ± 0
8120204.36 d ± 0.010.11 c ± 0.105.83 a ± 0.0619.00 f ± 0.72
924206.32 e ± 0.010.02 a ± 010.00 d± 0.3623.00 g ± 0
10120303.96 b ± 0.010.17 d ± 0.016.50 b ± 0.1015.17 b ± 0.29
1124304.42 d ± 0.010.10 b ± 06.50 b ± 0.1016.07 c ± 0.40
1272323.87 a ± 0.010.11 b ± 0.016.57 b ± 0.2111.40 a ± 0.36
137217.934.21 c ± 0.010.13 c ± 06.17 a ± 0.1516.17 c ± 0.35
X1—time, X2—temperature, TTA—titratable acidity, TSS—total soluble solids, cm—centimetres. Each value is a mean of triplicates, ±SD of triplicates, means with different letters within a column significantly differ (p ≤ 0.05).
Table 4. Analysis of variance of the response variables.
ResponseSource Sum of SquaresDfMeanF Valuep ValueR2
pHModel9.635651.927116.930.0010.92
Lack of fit0.796130.26541561.070
Pure error0.000740.0002
Total10.432412
TTA (% lactic acid)Model2.515450.50317.340.010.84
Lack of fit0.458930.153029.030.004
Pure error0.021140.0053
Total2.995412
TSS (°Brix)Model21.692354.338516.210.0010.92
Lack of fit1.695430.565112.730.016
Pure error0.177640.0444
Total23.565312
Consistency (cm)Model121.866524.37325.430.0230.80
Lack of fit14.34234.78081.120.440
Pure error17.06344.2659
Total153.27212
TTA—titratable acidity, TSS—total soluble solids, Df—degree of freedom, R2—coefficient of determination, cm—centimetres.
Table 5. Physicochemical analysis of raw milk and amasi samples.
SamplepHTSS (°Brix)TTA (% Lactic Acid)Consistency (cm)
RM6.64 ± 0.01 d9.47 ± 0.15 c0.02 ± 0 a23.00 ± 0 e
OP 253.44 ± 0.01 a6.03 ± 0.38 a0.23 ± 0 c9.53 ± 0.25 a
OP 323.99 ± 0.08 b6.67 ± 0.15 b0.11 ± 0 b15.23 ± 0.25 b
SC 253.94 ± 0.03 b6.67 ± 0.06 b0.14 ± 0 b17.27 ± 0.25 d
SC 324.10 ± 0.02 c6.87 ± 0.06 b0.12 ± 0.07 b15.70 ± 0.17 c
RM—raw milk, OP 25—optimized fermented milk (amasi) at 25 °C, OP 32—optimized fermented milk (amasi) at 32 °C, SC 25—fermented milk (amasi) with starter culture at 25 °C, SC 32—fermented milk (amasi) with starter culture at 32 °C. TSS—total soluble solids, TTA—total titratable acidity. Each value is a mean of triplicates, ± SD of triplicates, means with different letters within a column significantly differ (p ≤ 0.05).
Table 6. Model coefficients of physicochemical analysis of raw milk and amasi samples.
CoefficientY1Y2Y3Y4
β11.07−0.7924.3740.8
X1−0.0947 *0.0258 *−0.1873 *−0.286 *
X2−0.165 *0.025−0.798−0.70 *
X120.000267 *−0.0000410.000378 *0.001132 *
X22−0.000350.000580.008570.0006
X1X20.001563−0.0003540.00432 *0.00323
β—intercept, X1—fermentation time, X2—fermentation temperature, X12—quadratic effects of fermentation time, X22—quadratic effects of fermentation temperature, X1X2—interactive effect of fermentation time and temperature, Y1—pH, Y2—titratable acidity (TTA), Y3—total soluble solids (TSS), Y4—consistency. * significant at p ≤ 0.05.
Publisher’s Note: MDPI stays neutral with regard to jurisdictional claims in published maps and institutional affiliations.

