Article

Effects of Different Soybean and Maize Mixed Proportions in a Strip Intercropping System on Silage Fermentation Quality

1
Agricultural College, Northeast Agricultural University, Harbin 150030, China
2
Heilongjiang Academy of Green Food Science/National Soybean Engineering Technology Research Center, Harbin 150028, China
*
Authors to whom correspondence should be addressed.
Fermentation 2022, 8(12), 696; https://doi.org/10.3390/fermentation8120696
Submission received: 9 November 2022 / Revised: 28 November 2022 / Accepted: 28 November 2022 / Published: 1 December 2022
(This article belongs to the Section Industrial Fermentation)

Abstract

:
Soybean (Glycine max Merr.), with a high nutritional value, is an important oil crop and a good protein feed crop. Due to the shortage of high-protein feed and the high import pressure on soybean, scarce high-protein feed is the main research target for improving feed quality. High-quality soybean (Qihuang 34) and high-yield silage maize (Zea mays L.) (Jingling silage 386) varieties were used as the experimental materials in this study. The silage quality and the microbial community of the mixed silage of soybean and maize were analyzed, and the compatible intercropping ratios of maize–soybean mixed silage were evaluated. This experiment designed five strip intercropping systems (SIS) in a randomized block. The intercropping row ratios of maize and soybean were 0:1 (pure soybean, S), 1:0 (pure maize, M), 1:1 (MS1), 1:3 (MS2), and 1:5 (MS3). Dry matter yield and fresh matter yield were improved in the treatments of MS1 and MS2. In the mixed silage systems of maize and soybean, with an increase in soybean proportion, crude protein (CP), neutral detergent fiber (NDF), and acid detergent fiber (ADF) contents gradually increased, but the contents of water-soluble carbohydrates (WSC) and dry matter (DM) reduced to different degrees (p < 0.05). Moreover, the soybean silage alone had a poor fermentation performance, as indicated by high pH, high acetic acid (AA), propionic acid (PA), butyric acid (BA), and ammonia-N (NH3-N) concentrations, and low lactic acid (LA) concentration. By contrast, the mixed silage materials were conducive to reducing the pH, PA, BA, and NH3-N, and increasing the LA content. The relative abundance of Lactobacillus and Weissella in the MS were higher, and the abundance of undesirable bacteria were lower than in the S. The MS2 materials had the lowest pH, the highest LA concentration, and the highest relative abundance of Lactobacillus and Weissella among the three mixed silage groups. Therefore, the mixed silage in the SIS modified the microbial communities and improved the feed fermentation quality while increasing yields. The better intercropping ratio of maize–soybean mixed silage was 1:3. These results could provide a theoretical basis for the wide application and popularization of soybean as a high-protein silage forage source.

1. Introduction

For decades, livestock farming has been the economic mainstay of the agriculture industry and rural development in most developing and developed countries [1]. With the fast growth of animal husbandry worldwide, the demand for high-quality and low-cost feed is increasing. Fodder availability with an acceptable and good protein content is becoming increasingly important [2]. Whole-plant maize (Zea mays L.) is a crucial silage forage source for livestock production worldwide, especially in China with a large population [3], because of its high yield, rich nutrition, and good palatability, in addition to its high water-soluble carbohydrates (WSC), making ensiling easy [4]. However, whole-plant maize is unsuitable for solving the demand for protein in livestock due to its low crude protein (CP) concentration, varying from 55 g/kg to 70 g/kg DM in dry matter (DM, China standard NY/T 34, 2004) [5]. Therefore, some high-protein feed additives, such as good-quality alfalfa, soybean meal, and fish meal, are becoming increasingly essential protein sources in compound feed [6]. However, the cost of these high-protein feeds is very expensive and increasing year by year [7]. It is urgent to solve the search for palatable alternative forage or forage combinations with high-protein, rich nutrients, high yield, and storage resistance.
Soybean (Glycine max Merr.) is considered to be a suitable and promising forage resource for livestock as hay feed and silage, not only for its photoperiod characteristics of short-day crops but also for its richness in protein and vitamins [3]. Nevertheless, it is challenging to naturally ensile soybean due to its high buffering capacity and low WSC, leading to silage fermentation failure with high butyric acid (BA) content [8,9,10]. Alfalfa is a widely used legume forage, and studies on alfalfa mixed silage with maize have been conducted by previous researchers, with some progress. Based on these results, a growing body of studies has found that maize and soybean co-ensiling could be an exceptionally feasible way to improve the quality of soybean silage alone. Co-ensiling enhances the fermentation system’s stability because maize provides compatible WSC to promote fermentation, and soybean increases protein content and nutrients [11,12]. With the continuous exploration of silage research, some researchers realized that silage is a microbial-based fermentation process, and Lactic acid bacteria (LAB) play a crucial role in top-quality silage fermentation. By contrast, Mold, Clostridium, and other microbials could harm fermentation quality [9,13]. Ni et al. found that co-ensiling might affect the microbial community by increasing the relative abundance of desirable LAB compared to soybean ensiling alone [14]. Microbial diversity can be vastly underestimated during silage when using the dilution method of plate-counting technique [15]. Next-generation sequencing technology has been used to precisely probe bacterial communities in silage [16]. Analyzing microbial communities in soybean and maize mixed silage fermentation using next-generation sequencing technology could reflect the microbial environment and the quality causes of soybean and maize mixed silage.
At present, most large silage plants or dairy farms have implemented a wholly mechanized operation process for corn silage, such as mechanical cutting, crushing, cellaring, and silage. Similarly, it will be a trend in the future that wholly mechanized operation processes are required for soybean and maize mixed silage. Therefore, a reasonable intercropping mode between soybean and maize would be needed to facilitate the whole mechanization process and improve the quality of mixed silage. The strip intercropping system (SIS) of maize–soybean has been extensively used in the south of China, improving land-use efficiency and water and soil conservation. The yields of intercrops often exceed those of their sole-crops by using effective conditions, such as light, temperature, water, gas, and heat [17,18]. Thus, it is beneficial to increase biomass yield and silage production using the SIS of maize–soybean [19,20]. However, there has been little research on the fermentation quality and microbial community diversity of maize–soybean mixed silage in different intercropping ratios of the SIS. Therefore, this study aimed to investigate the most suitable intercropping ratios combined with maize–soybean mixed silage fermentation for mechanized silage in the future. In addition, the fermentation quality indexes were evaluated using chemical and chromatographic methods, and the bacterial composition and diversity of the silage with the maize–soybean mixture were analyzed using Illumina MiSeq sequencing. These experimental data could provide important theoretical support for the utilization and popularization of soybean silage with the SIS.

2. Materials and Methods

2.1. Materials and Experimental Design

A soybean cultivar with a high protein content, “Qihuang34” (QH34, Crop Research Institute of Shandong Academy of Agricultural Sciences, Jinan, China), and a silage corn cultivar with a high yield, “Jinling silage 386” (JL386, Jinling Silage Corn Seed Industry in Inner Mongolia, Inner Mongolia, China), as the experimental materials were cultivated in the experimental field of the Northeast Agricultural University, Harbin, China (126°3′30″ E, 45°44′34″ N, elevation 178 m) on 15 May 2021. The experiment was designed with five cultivation modes, which included the monoculture of maize (M), the monoculture of soybean (S), and three intercropping modes of maize and soybean, with the row ratios of maize and soybean in SIS being 1:1 (MS1), 1:3 (MS2), and 1:5 (MS3), as seen in Figure 1. There were 12 rows altogether per plot: each row was 3 m in length and 0.65 m in width, and the cultivation density in the monoculture/inter-cropping was 70,000 plants per hectare for maize and 250,000 plants per hectare for soybean. The field trials were conducted using a randomized plot design with three replicates for each treatment. The other management was the same as that of the field.

2.2. Measuring Yield and Silage Materials Preparation

According to previous research results, maize at the early dough stage and soybean at the early podding stage were also suitable for silage for yield and quality [21], and the early dough stage of JL386 just encountered the early podding stage of QH34 in this experiment. The maize and soybean in the monoculture and different intercropping ratio treatments were manually harvested by leaving a stubble height of 10 cm based on the maize and soybean planting density ratios. The whole maize fresh matter yield (MFM) and whole soybean fresh matter yield (SDM) were measured by weight. Subsequently, lengths of soybean and maize were dried at 65 °C for 72 h to calculate the soybean dry matter yield (SDM) and the maize dry matter yield (MDM) separately, and the others were wilted outdoors for 8 h on clean plastic sheets. Afterward, the materials in different treatments were chopped to about 2 cm by a forage chopper (YL100L-2, Weihai, China), thoroughly mixed, and grouped into 15 samples. The same treatment piles were mixed again, and 500 g in each treatment was weighed and immediately packed into polyethylene plastic bags (25 cm × 30 cm, Wenzhou, China). All of the samples were vacuum sealed by a sealer (DZQ-420C, Anshengke, Quanzhou, China), and each treatment was repeated in five bags and stored in the darkness for 60 d at room temperature (20 °C–25 °C).

2.3. Silage Chemical Composition Analysis

2.3.1. Conventional Silage Quality Detection

A total of 100 g of each silage or ensiling sample was dried at 65 °C for 72 h to determine the DM content, grounded through a 1 mm sieve, and stored at room temperature before chemical analysis in a desiccator. The thracenone–sulfuric acid method was used to determine the WSC content [22]. The crude fat (CF) and CP concentrations were determined using the Soxhlet and Kjeldahl methods, respectively [22]. The neutral detergent fiber (NDF) and acid detergent fiber (ADF) concentrations were analyzed using the method of Van Soest et al. [23]. The conventional silage quality of the silage mixture was also determined using the above methods.

2.3.2. Organic Acid and Ammonia-N

After 60 d of fermentation, 10 g of silage sample in the fermentation bags of different treatments was placed in a blender jar, diluted to 100 g with distilled sterilized water, and homogenized in a high-speed blender for 35 s. After filtering the homogenate through four layers of medical gauze, the pH was determined immediately. After ten minutes of centrifugation at 8000× g at 4 °C, a portion of the aqueous extract was submitted to organic acid determination and then separated using a high-performance liquid chromatography (HPLC, Primaide, Hitachi, Tokyo, Japan) through a 0.22 m membrane. The HPLC was equipped with a UV detector with a detection wavelength of 210 nm. The column temperature was set at 50  °C, and the mobile phase was composed of methanol and 0.01 mol/L potassium dihydrogen phosphate at a pH of 3.5 (0.7 mL/min, 50 °C). The concentration of ammonia-N (NH3-N) (grams of ammonia-N per kilogram of total nitrogen) was determined according to the method described by Broderick and Kang [24].

2.4. Silage Bacterial Community Analysis

2.4.1. Bacterial DNA Extraction and PCR Amplification

According to the manufacturer’s instructions, total bacterial genomic DNA samples were extracted using the Fast DNASPIN extraction kits (MP Biomedicals, Santa Ana, CA, USA) and stored at −20 °C before further analysis. PCR amplification of the bacterial 16S rRNA genes V3-V4 region was performed using the forward primer 338F (5′-ACTCCTACGGGAGGCAGCA-3′) and the reverse primer 806R (5-GGACTACHVGGGTWTCTAAT-3′).

2.4.2. Illumina Miseq Sequencing Analysis

The standard protocols used the Illumina MiSeq platform with the MiSeq Reagent Kit v3 at Wuhan Frasergen Bioinformatics Co., Ltd. (Wuhan, China), and pair-end 2 × 300 bp sequencing was performed. The MiSeq raw reads were deposited in the National Center for Biotechnology Information (NCBI) database under accession number PRJNA898777. The raw tags obtained in this study were filtered using a QIIME (V1.8.0) pipeline, and the UCHIME algorithm was applied to identify and remove chimeric sequences. After chimera detection, the remaining high-quality sequences were clustered into operational taxonomic units (OTUs) at 97% sequence identity using UCLUST [25]. A representative sequence was selected from each OTU using default parameters.

2.5. Statistical Analysis

This experiment used a completely randomized design with a 5 × 3 (5 treatments and 3 duplicates), and the data were analyzed using one-way analysis of variance (SPSS 26.0 Chicago, IL, USA). The Tukey’s honestly significant difference (HSD) test was utilized to examine different sample means, and significance was declared at p < 0.05. Bioinformatics and Statistical Analysis Sequence data analyses were mainly performed using QIIME (V1.8.0) and R software (V4.0.3).

3. Results

3.1. Effects of Intercropping on the Yield

As shown in Table 1, the S group had the highest SFM (23.86 t/ha) (p < 0.05), and the SFM values of MS2 and MS3 were significantly higher than MS1 (p < 0.05). In contrast, MS1 had the highest MFM (77.69 t/ha) in all groups (p < 0.05). There was no significant difference in the value of MFM between group M (75.19 t/ha) and group MS2 (75.36 t/ha), and the MFM of MS3 was the lowest (70.81 t/ha) (p < 0.05). This indicated that intercropping improved the MFM in the system, but the SFM decreased with an increase in soybean proportion. The MSFM values of the three intercropping groups were obviously higher than the monoculture groups, and the MSFM values of MS1 (94.05 t/ha) and MS2 (94.61 t/ha) were higher than MS3 (91.05 t/ha) (p < 0.05). There was no significant difference between MS2 and MS1 in the value of MSFM. The value of SDM was lowest in MS1 (5.89 t/ha) (p < 0.05). MS1 had the highest MDM (27.96 t/ha) (p < 0.05) in all groups, while MS3 had lower MSDM compared to MS1 and MS2 (p <0.05). This indicated that intercropping improved the MDM and decreased the SDM in the system.

3.2. Chemical Composition of Materials before Ensiling

Through chemical detection, the main conventional feeding quality of the treatments mixed with different proportions of maize and soybean showed different degrees of chemical composition (Table 2). The DM content of the S treatment was lower than the other treatments. MS1 and MS2 had more DM content than M (p < 0.05). In addition, the CP, NDF, and ADF contents in the S treatment were the highest in all treatments, but its content of WSC was lower than that of other treatments (p < 0.05). It might be concluded that the feed quality of the silage with soybean alone was not as good as that of different combinations. The CP contents of MS1, MS2, and MS3 were significantly higher than that of the M treatment (p < 0.05), the content of WSC was also higher than that of the S treatment, and their ADF and NDF contents were lower than those of S treatment (p < 0.05). Based on the above indicators, such as the CP, WSC, NDF, and ADF contents, the feed quality of maize and soybean in SIS after the mixed harvest was conducive to silage fermentation.

3.3. Chemical Composition and Characteristics of Silage Fermentation

After 60 days of silage fermentation, the CP, NDF, and ADF contents of each treatment showed a small drop, the DM and CF contents increased a little, and the content of WSC was highly variable before and after silage. This study showed that the silage fermentation process had little effect on the main conventional chemical indexes of maize, soybean, and both mixtures, and the fermentation process was beneficial for increasing the palatability of the feed (Table 3). From Table 3, it can be seen that the S treatment had poor silage quality, as shown by a low LA concentration (50.47 g/kg DM) and high AA (36.99 g/kg DM), PA (5.06 g/kg DM), and BA (2.14 g/kg DM) concentrations. Additionally, a high concentration of NH3-N (84.98 g/kg TN) (p < 0.05) was found in the S treatment. In contrast, the M treatment had a good fermentation process. It had the highest concentration of LA (85.00 g/kg DM) (p < 0.05), the lowest concentrations of AA (18.66 g/kg DM) (p< 0.05), BA (2.55 g/kg DM) (p < 0.05), and NH3-N (44.12 g/kg TN) (p < 0.05), and BA content was not detected. The maize–soybean mixed silage in SIS, including MS1, MS2, and MS3, had a lower pH level (3.82–4.06) (p < 0.05), lower contents of NH3-N (44.63–48.93 g/kg TN) (p < 0.05), AA (23.75–28.76 g/kg DM) (p < 0.05), and PA (2.56–3.61 g/kg DM) (p < 0.05), and a higher LA concentration (72.54–79.55 g/kg DM) (p < 0.05). Similarly, no BA was detected in each co-silage treatment. In the three co-silage groups, MS2 had a lower pH (3.82) (p < 0.05), and lower contents of NH3-N (44.63 g/kg TN) (p < 0.05), AA (23.75 g/kg DM) (p < 0.05), and PA (2.56 g/kg DM) (p < 0.05), and a higher LA concentration (79.55 g/kg DM) (p < 0.05). Therefore, the MS2 treatment in the strip intercropping of maize and soybean was a better intercropping ratio for successful mixed fermentation.

3.4. Microbial Community of the Silage

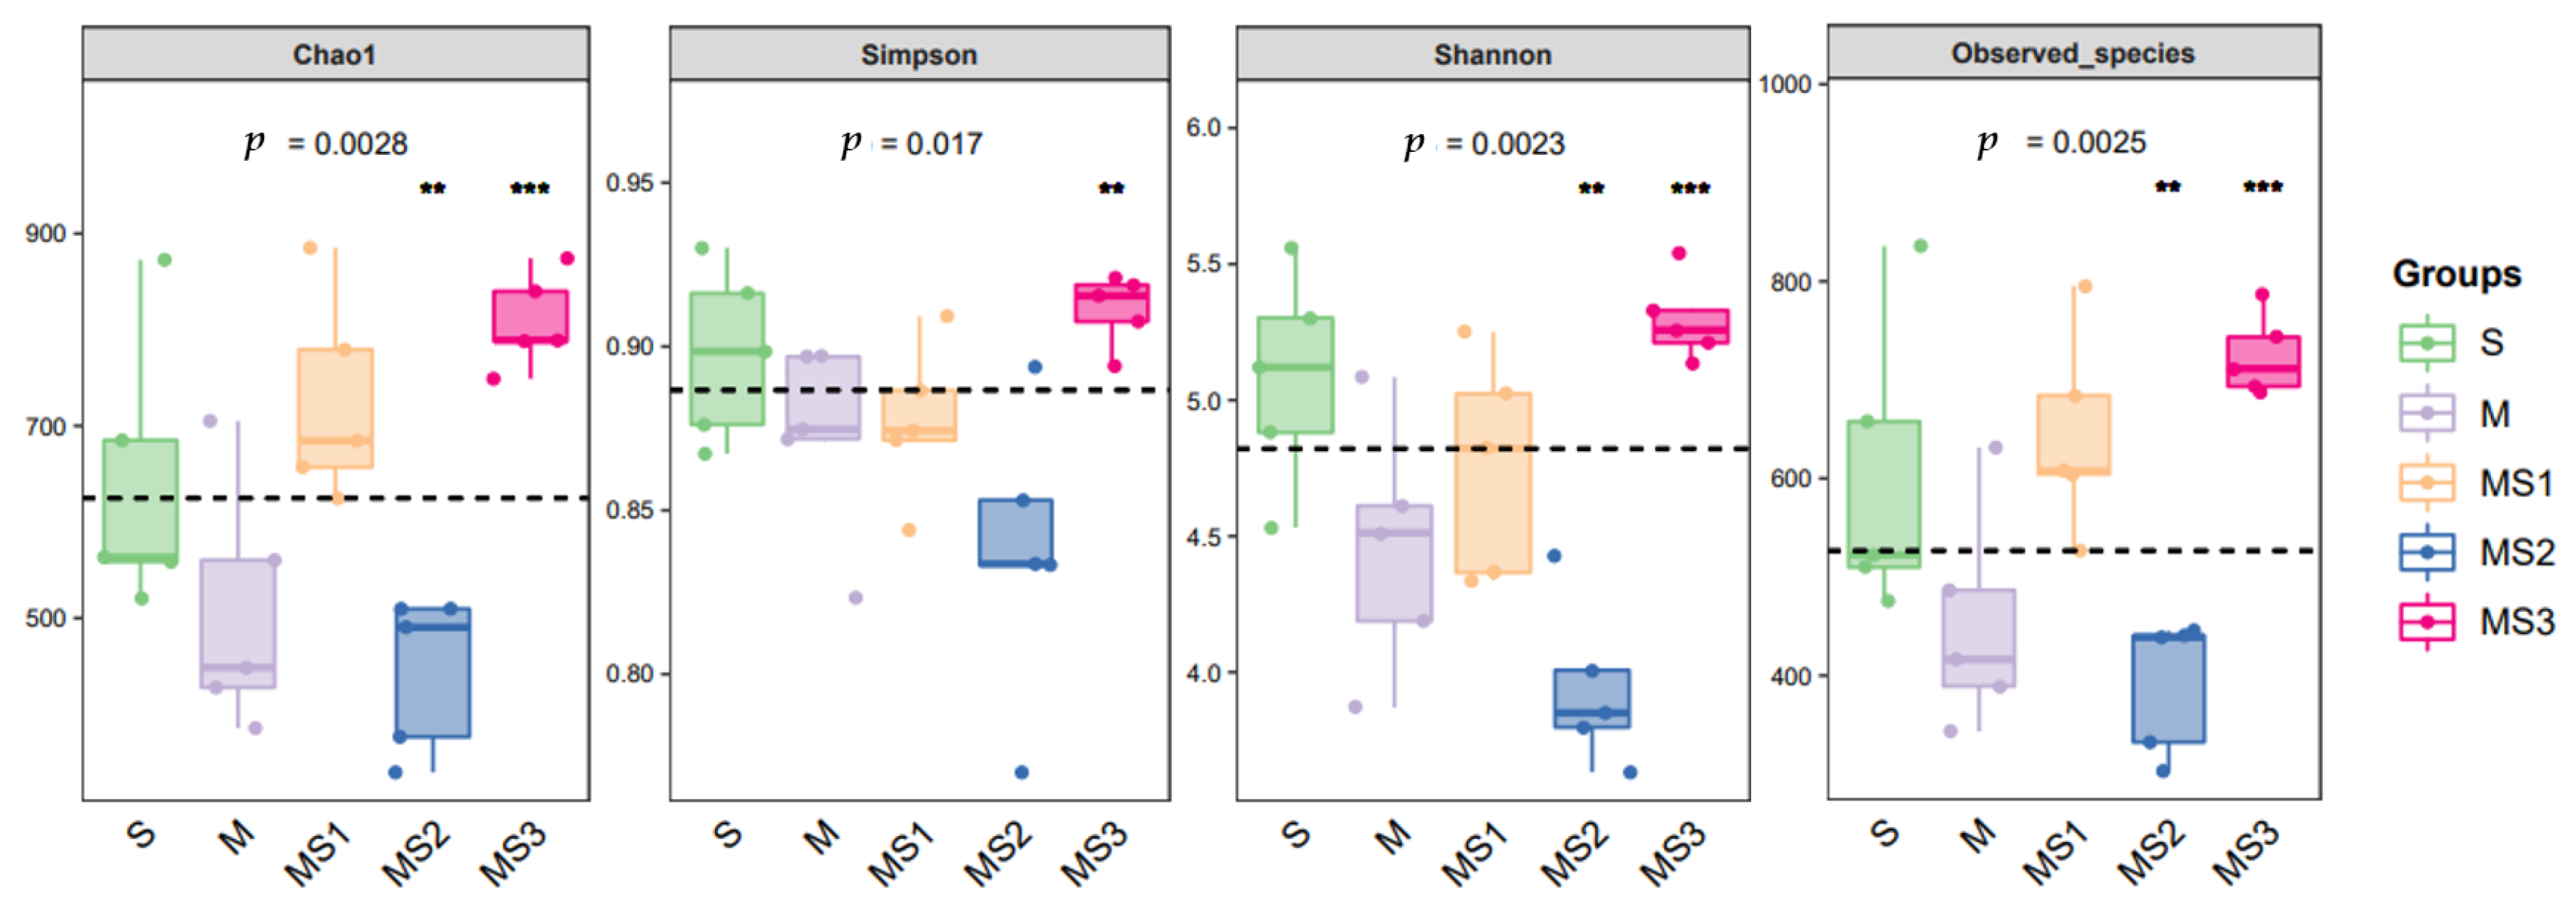
After silage fermentation quality control, based on Illumina sequencing, the valid sequences of 25 samples were determined to be 1,833,494, with an average of 73,340 reads per sample. The trend of rarefaction curves for richness showed that a sufficient sequencing depth in the silage bacterial communities had been attained (Figure S1). The Alpha-diversity Index is shown in Figure 2, including the Chao1, Shannon, and observed species diversity indexes. The Chao1 index reflects the microbial community richness; the greater the value of Chao1, the higher the overall number of species. The Simpson and Shannon indexes measure community diversity and consider the community’s richness and uniformity. A greater community diversity corresponds to a greater Shannon index and a lower Simpson index value. The observed species index represents the intuitive quantity statistics of OTUs. MS2 had lower Chao1, Shannon, and observed species indexes than other treatments (p < 0.05), and the index of Chao1 in soybean silage alone was higher than M and MS2, while its Simpson index was higher than MS2 (p < 0.05) and its Shannon index was higher than M, MS1, and MS2 (p < 0.01). The index of Chao1 in soybean silage was higher than MS2 (p < 0.05). Good coverage was greater than 99% for all samples (Figure S2). If the coverage index was closer to one, the test result resembled the actual sample more accurately. The Venn diagram shows that all five treatments share 129 OTUs (Figure 3). The exclusive OTUs ranged from 44 in the MS2 silage sample to 295 in the S silage sample. The MS2 silage sample had the least exclusive OTUs compared to the other treatments.
Furthermore, based on the unweighted UniFrac PCoA plot of the five silage groups, it reflected more objectively the similarity between the two community samples (Figure 4). The Beta-diversity analysis showed variations in the bacterial communities of 25 samples, which were divided into five different clusters. The Adonis test demonstrated that the clusters were reliable (R2 = 0.82 p = 0.01). As presented in Figure 5A, at the phylum level, the phyla Firmicutes and Proteobacteria are the dominant bacteria in all treatments. The relative abundance of Firmicutes (81.94%) in the M treatment was the highest among all treatments, followed successively by MS2 (77.86%), MS1 (69.91%), S (59.86%), and MS1 (40.32%). In contrast, MS3 had the highest relative abundance of Proteobacteria (56.46%). As shown in Figure 5B, at the genus level, the dominant genus in the silage bacterial community is the Lactobacillus genus (10.28%–47.10%), and the Weissella genus is mainly present in the M, MS1, MS2, and MS3 silage groups (6.40%–29.00%). The relative abundance of the Lactobacillus genus (47.1%) in the M treatment was the highest among all treatments, followed by MS2 (38.6%), MS1 (34.3%), MS3 (22.8%), and S (10.28%). Meanwhile, the relative abundance of the Weissella genus (35.0%) in the MS2 treatment was the highest among all treatments, followed by M (29.0%), MS1 (25.2%), MS3 (0.6%), and S (0.4%). The dominant genus in the S treatment was the genus of Bacillus (30.00%), which is commonly found in foods related to fermented soybeans [26], and Acetobacter (24.30%), and this treatment also contained the Clostridium_sensu_stricto_5 genus (4.28%), which is harmful to silage fermentation quality. In addition, the MS3 sample had the highest relative abundance of the Klebsiella genus (36%), which is not common in silage. It has been found in lots of fermented food [26].
This experiment selected the S and M treatments for the linear discriminant analysis to further explore the significantly different taxa in the silage and discover the key species. In the unweighted UniFrac PCoA analysis (Figure 4), group S had the farthest distance from group M, implying the slightest similarity in community structure. The chemical composition difference between the S and M groups was also the largest (Table 3). These 44 biomarkers can be found in Figure 6. At the genus level, the S group was differentially enriched with the genera Bacillus, Acetobacter, Acinetobacter, Klebsiella, Paenibacillus, Clostridium_sensu_stricto_5, and Clostridium_sensu_stricto_1, whereas the M group was enriched with Lactobacillus, Weissella, and Providencia (Figure 6B). We also observed that the phylum Proteobacteria and the phylum Firmicutes were enriched in the S group.

3.5. Correlations between Chemical Composition and Microbial Community

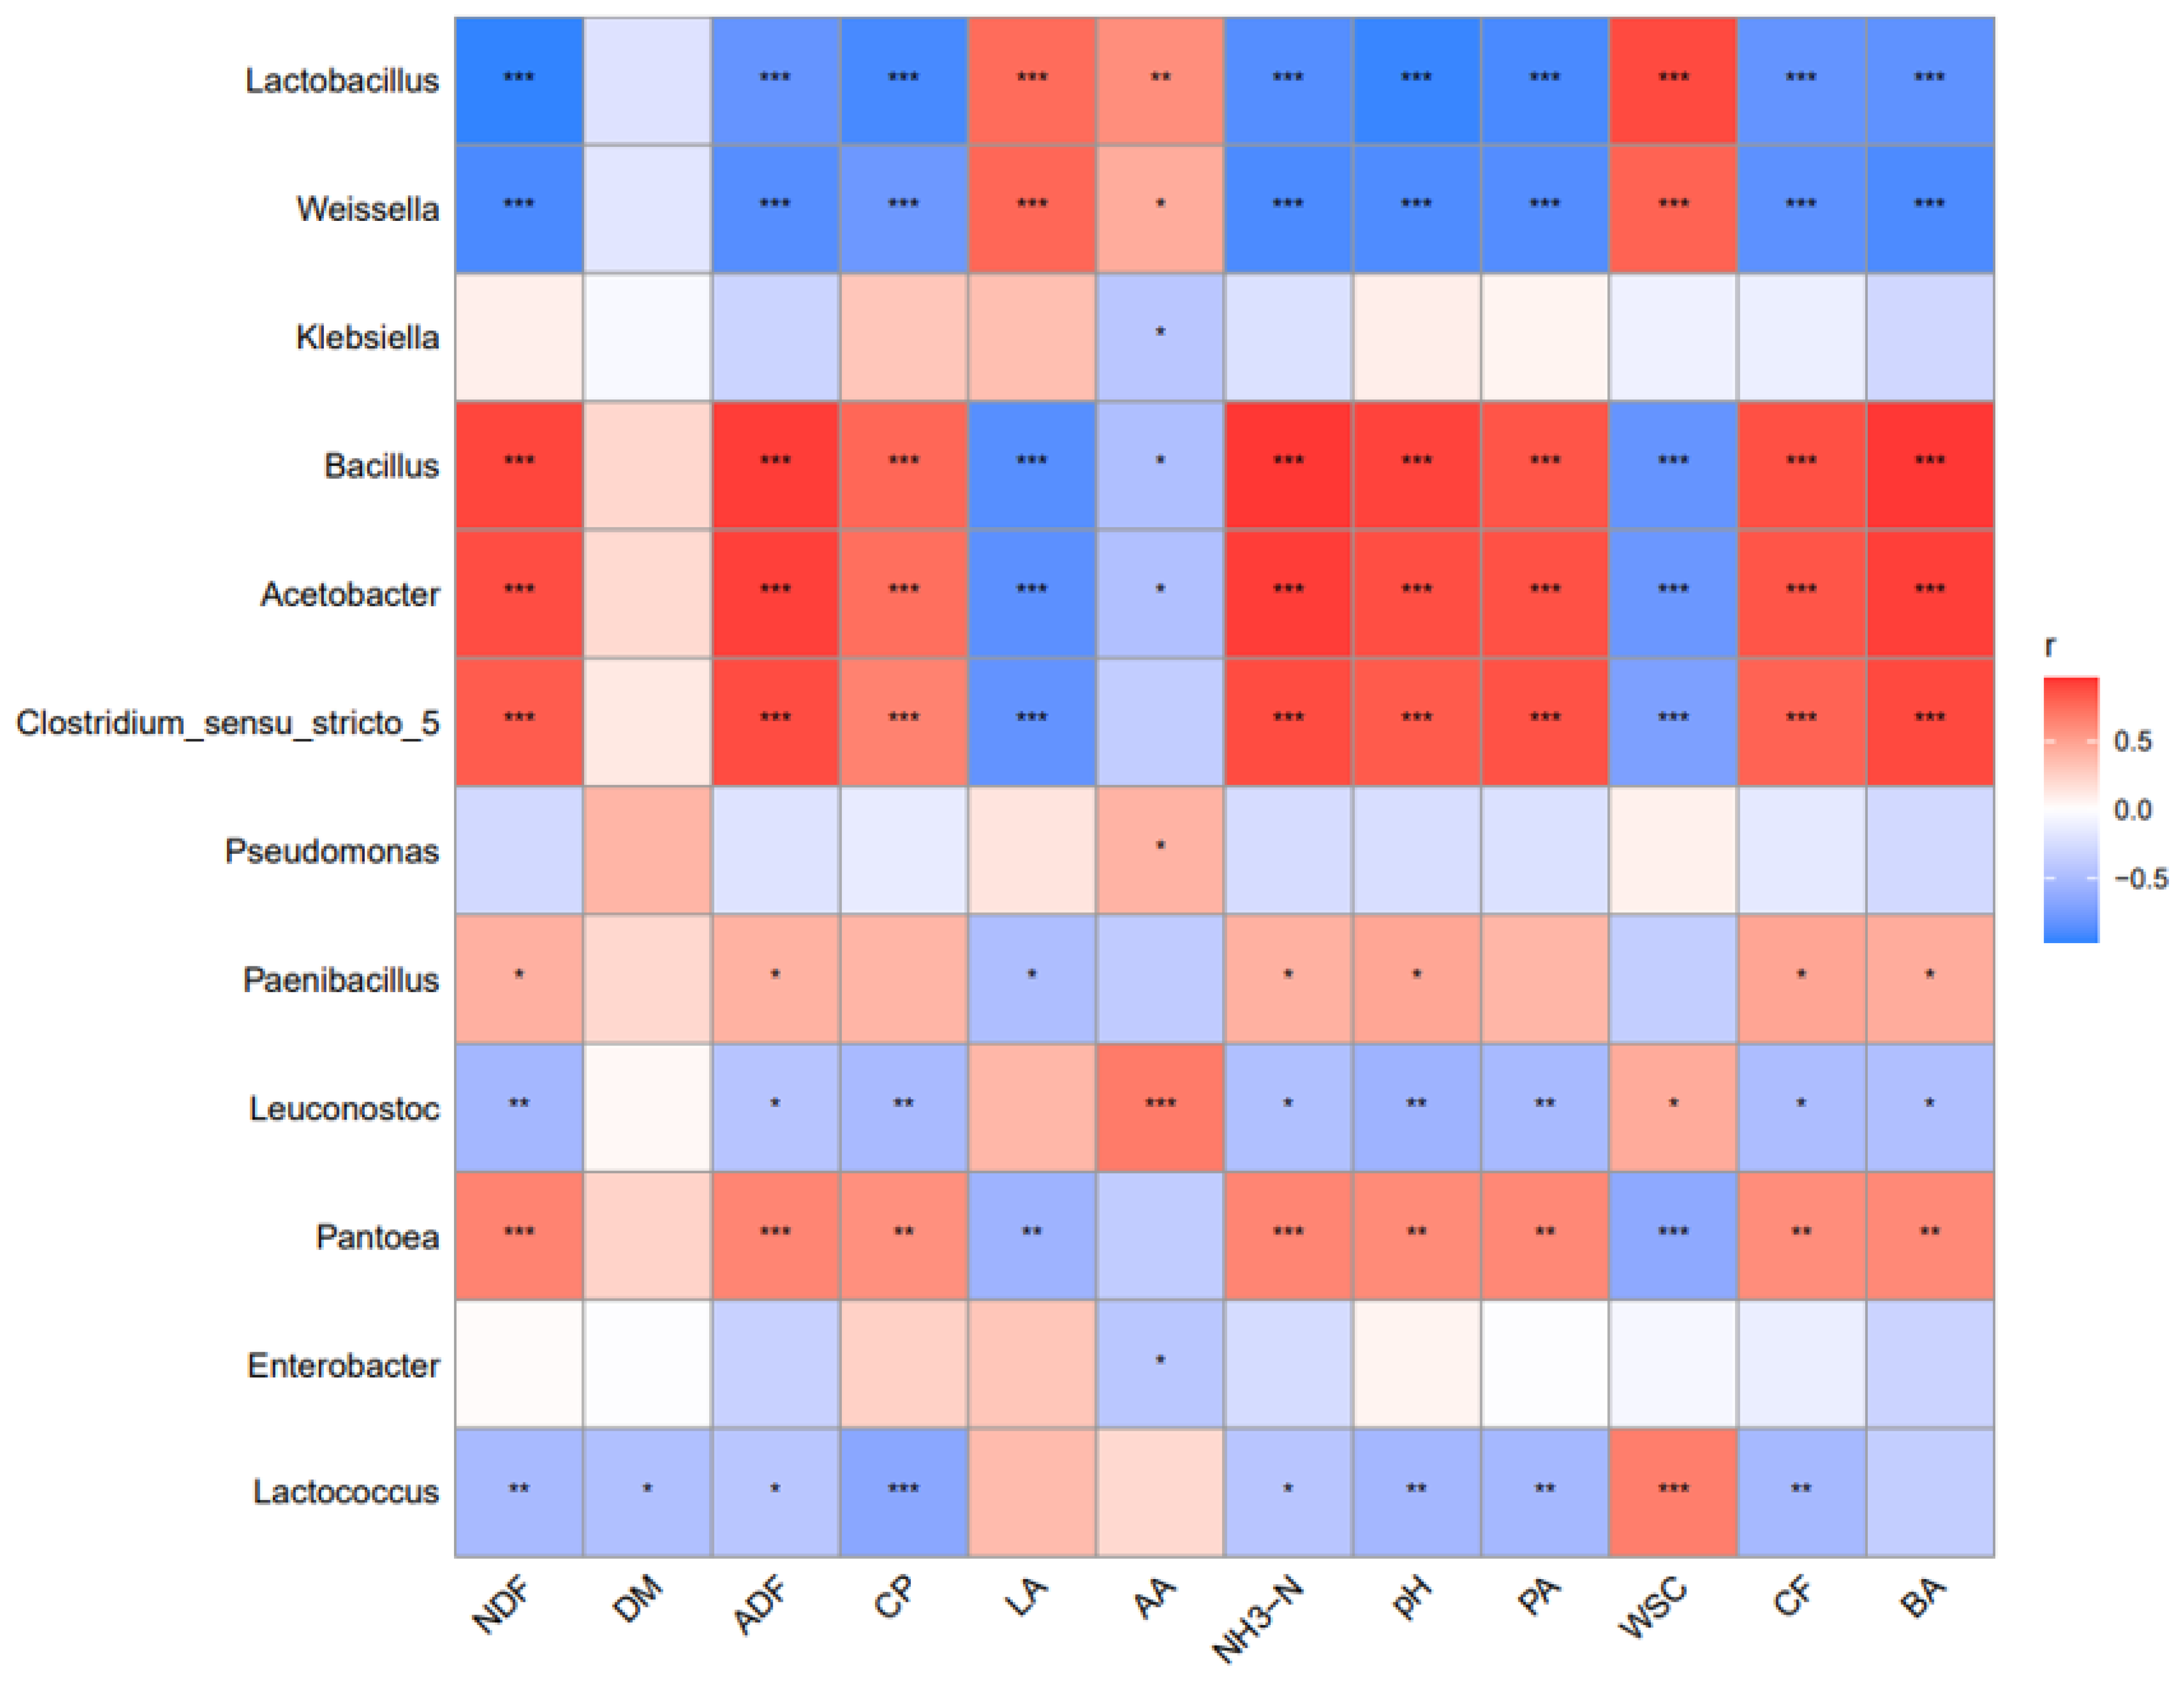
As shown in Figure 7, the nutrition and fermentation quality in the silage groups significantly affect the bacterial community. The content of WSC was significantly positively correlated with the Lactobacillus (p < 0.001), Weissella (p < 0.001), Lactococcus (p < 0.001), and Leuconostoc genera (p < 0.05). It was significantly negatively correlated with the Clostridium_sensu_stricto_5 genus (p < 0.001), which indicated that WSC could promote the growth of Lactobacillus, Weissella, Lactococcus, and Leuconostoc to produce more LA and inhibit the growth of Clostridium. The correlation between the content of LA and the microbial community was very similar to that of WSC. The content of AA and the genera Weissella (p < 0.05) and Lactococcus (p < 0.01) had positive correlations; thus, the genera Weissella and Lactococcus, involved in the heterotactic fermentation process, produced AA. The pH value is an important indicator to ensure the quality of silage. There were negative correlations between the value of pH and the amounts of the Lactobacillus (p < 0.001), Weissella (p < 0.001), Lactococcus (p < 0.01), and Leuconostoc (p < 0.01) genera. The dominant floras, the genera Lactobacillus, Weissella, Lactococcus, and Leuconostoc, produced LA throughout fermentation and reduced the pH in the silage. There were positive correlations (p < 0.001) between the content of BA and the amount of the genus Clostridium_sensu_stricto_5, which was detected only in the S group (Figure 5 and Table 3). Especially, the relative abundance of the genera Lactobacillus (p < 0.001), Weissella (p < 0.001), Lactococcus (p < 0.001), and Leuconostoc (p < 0.01) negatively correlated with the content of CP, and a similar observation was made for NH3-N, NDF, and ADF. The content of DM was only negatively correlated with the relative abundance of the Lactococcus genus (p < 0.05).

4. Discussion

4.1. Crop Yield and Chemical Composition of the Silage

In the SIS, the MFM and MDM significantly increased under the corresponding intercropping ratios of the MS1 and MS2 groups, and the MSFM and MSDM in the MS1 and MS2 groups were higher than others. However, in the MS3 group, the MFM decreased significantly compared to the M group. The S group had the highest SFM in all the groups, but there was no significant difference between the S, MS1, and MS2 groups in the SDM. These results showed that the MFM and MDM increased, while the SFM and SDM reduced in MS1 and MS2. However, the MFM decreased with an increase in the soybean ratio [20].
Previous studies have shown that maize contains a high level of WSC, which is essential for silage fermentation; a concentration greater than 50 g/kg DM is essential for good-quality silage [14]. Apparently, the content of WSC in the S treatment (40.55 g/kg DM) was insufficient for an adequate silage fermentation process. However, the content of WSC in MS1, MS2, and MS3 was higher than 50 g/kg of DM as maize–soybean mixture silage. The contents of DM in MS1 and MS2 were higher than M, and it could be attributed to the improvement in photosynthetic utilization efficiency in the SIS of maize and soybean [27], which would be conducive to the formation and accumulation of DM [28]. It could be seen that the S treatment had a higher CP content than the other treatments due to its variety of characteristics. When maize and soybean were mixed to ensile, the CP content of the MS1, MS2, and MS3 treatments significantly increased more than that of the M treatment. In addition, because of the high ADF and NDF contents of soybean, it is considered a poor kind of forage. However, in the mixed silage of soybean and maize, the contents of NDF and ADF were significantly lower than those in single soybean alone, and the CP, DM, and WSC contents of both mixed silage reached the ideal levels. These would have positive effects on ruminant feed intake and digestibility [29]. It indicates that the strip intercropping of maize and soybean incorporates the benefits of soybean and maize monocropping and is more conducive to obtaining high-protein and high-quality fresh materials for ensiling. This finding is in agreement with those obtained by others [14,19].

4.2. Microbial Community and Bacterial Diversity of the Silage

There are few relevant types of research about the microbial community in silage treated with different SIS intercropping ratios. In this study, the bacterial community of mixed silage with five intercropping ratios of maize and soybean was evaluated using 16SrDNA sequencing to further clarify the feeding quality of mixed silage. Alpha-diversity measures the abundance and distribution of species in a community and is the most straightforward metric for comparing communities [30]. The MS2 silage sample had lower Chao1, Shannon, and observed species indexes than other treatments, meaning their bacterial diversity was lower than others. On the other hand, the exclusive OTUS of the MS2 silage sample was the least in all the groups. It also indicated that the microbial community in the MS2 silage group was more stable [31]. The Beta-diversity analysis showed the extent of similarities and differences among microbial communities. From the Beta-diversity analysis, 25 samples were divided into five different clusters. The microbial community of the samples from the S silage group and the M group differed the most among all groups. The distance between groups MS1, MS2, and MS3 was relatively close, but the three mixed silage groups had significant distances from the S silage group, indicating that the intercropping of soybean and maize mixed silage could alter the original microbial community structure. In addition, all S samples were more spread out from each other than the other groups, which might mean that the soybean silage alone was less stable.
To further comprehend the impact of different silage groups on the microbial community, the relative diversity of the bacterial community at the phylum level and the genus level was investigated. At the phylum level, the phyla Firmicutes and Proteobacteria were the main bacteria in silage, and other studies had reached similar conclusions. It is generally accepted that LAB, as the dominant bacteria in silage fermentation, can be divided into the genera Enterococcus, Lactobacillus, Lactococcus, Leuconostoc, Pedicoccus, Streptococcus, and Weissella [14,32]. In this study, the Lactobacillus and Weissella genera were the dominant microbes in all groups except the S silage group. The Lactobacillus and Weissella genera were found to be the most abundant in the M silage group, with 76.26%, followed by the MS2 silage group (73.07%). As we know, LA is the desired fermentation product in silage, produced primarily by homolactic fermentation (Lactobacillus) and heterotactic fermentation (Weissella) by consuming WSC. Related to it, the contents of LA and WSC in the M silage group were the largest. However, AA and BA are undesirable; Acetobacter fermentation products are AA, and the Clostridium genus is a genus of bacteria that produce BA [33,34]. The AA content was highest in the S silage group, and its relative diversity of the Acetobacter genus was also the highest in all groups (24.3%), and the content of BA was detected. Meanwhile, large numbers of reads were mapped to the OTUs relevant to the Clostridium genus only in the S silage group. A large number of the Bacillus genus (36%) was detected in S, and the Klebsiella genus (36%) was detected in MS3, which showed that soybean fermentation alone was not easy to succeed and the proportion of soybean in the system should not be too much in mixed fermentation.
In previous studies, there are very few reports on the LEfSe analysis of the differences between soybean and maize silage systems. The 44 different biomarkers between soybean and maize silage were analyzed in this experiment. At the genus level, the S group was differentially enriched in the genera Clostridium_sensu_stricto_5 and Clostridium_sensu_stricto_1, which are generally considered to be the disadvantaged bacteria for fermentation. The high protein content causes an incomplete fermentation reaction and reduces the number of beneficial bacteria in the silage [19]. The key to the success of silage fermentation is that lactic acid bacteria quickly acquire the dominant position by consuming the nutrients in the silage and establishing a low pH environment to limit the protease and microorganism’s bacterial community [35]. This experiment found that LA and WSC had significant positive correlations with the genera Lactobacillus, Weissella, Lactococcus, and Leuconostoc and significant negative correlations with the genus Clostridium_sensu_stricto_5. Some microbes consume WSC and CP during silage fermentation to produce cellulase, which collapses NDF and ADF [36,37]. Therefore, the contents of WSC and LA play an essential role in predicting the changing trend of beneficial and harmful bacteria in silage. During the entire silage process in this study, we only explored the correlation between the bacterial community and the chemical indicators in the stable silage system after 60 days of fermentation. Thus, the detailed correlation mechanism between the chemical compositions and the bacterial community requires further study.
In this study, the microbial community of the soybean and maize mixed silage in the SIS had been significantly improved, and the reproduction of undesirable microorganisms was inhibited [19]. With a comprehensive analysis of the main feed quality indicators and microbial community, the mixed silage with a 1:3 intercropping ratio in the SIS of maize–soybean had the best fermentation and microbial community. However, there were limitations in that, for all the groups in this experiment, 60 days of silage was selected because the feed fermentation was in a relatively stable period of quality, which was missing the dynamics of the fermentation process. In the future, the mixed silage quality of maize and soybean can be further studied at different silage times, and it will provide a theoretical basis for quality promotion and efficient application of mixed silage.

5. Conclusions

This study showed that mixed silage in the SIS of maize and soybean could improve feed quality and fermentation while increasing yields. Compared to M silage alone or S silage alone, the mixed silage both increased the content of CP and DM and decreased the content of ADF and NDF. Meanwhile, the mixed silage had a low pH and lower AA, PA, and BA contents, and a higher LA content. In the microbial community, the relative abundance of the Lactobacillus and Weissella genera in the mixed silage increased, and undesirable bacteria, such as Clostridium, decreased compared to the single soybean silage. Moreover, the MS2 group had the lowest pH, highest LA concentration, and the highest relative abundance of the Lactobacillus and Weissella genera among the three mixed silage groups. Thus, mixed silage in the strip intercropping of maize and soybean could alter microbial populations and increase feed and fermentation quality, and the better intercropping ratio for maize–soybean was 1:3.

Supplementary Materials

The following supporting information can be downloaded at https://www.mdpi.com/article/10.3390/fermentation8120696/s1. Figure S1: Rarefaction curves for richness of samples in silage. S, pure soybean; M, pure maize; MS1, MS2, and MS3 separately meant row ratio of maize and soybean intercropping (1:1, 1:3, and 1:5). Figure S2: Good’s coverage for all silage samples. The numbers under the Good’s coverage were the p values of the Kruskal-Wallis test. Asterisks * denoted significant differences (p < 0.01); ** denoted significant differences (p < 0.001. S, pure soybean; M, pure maize; MS1, MS2, and MS3 separately meant row ratio of maize and soybean intercropping (1:1, 1:3, and 1:5).

Author Contributions

Conceptualization Y.J. and S.W. (Shaodong Wang); methodology, Y.J.; software, S.W. (Sui Wang); validation, S.W. (Shaodong Wang), Y.J., S.W. (Sui Wang), H.M., L.W., Z.Z. and X.T.; formal analysis, H.M.; investigation, H.M.; resources, Y.J.; data curation, H.M.; writing—original draft preparation, H.M.; writing—review and editing, H.M. and Y.J.; visualization, X.T.; supervision, S.W. (Shaodong Wang); project administration, Y.J.; funding acquisition, S.W. (Shaodong Wang) All authors have read and agreed to the published version of the manuscript.

Funding

The experiment was supported from National key R&D Program of Chian (2021YFD1201103).

Data Availability Statement

The data presented in this study are available from the corresponding author upon request.

Acknowledgments

The authors thank the Crop Research Institute of Shandong Academy of Agricultural Sciences for supplying soybean seeds and thank Frasergen for sequencing services.

Conflicts of Interest

The authors declare no conflict of interest.

References

  1. Chen, L.; Bao, X.; Guo, G.; Huo, W.; Xu, Q.; Wang, C.; Li, Q.; Liu, Q. Effects of Hydrolysable Tannin with or without Condensed Tannin on Alfalfa Silage Fermentation Characteristics and In Vitro Ruminal Methane Production, Fermentation Patterns, and Microbiota. Animals 2021, 11, 1967. [Google Scholar] [CrossRef] [PubMed]
  2. Xu, R.; Zhao, H.; Liu, G.; You, Y.; Ma, L.; Liu, N.; Zhang, Y. Effects of nitrogen and maize plant density on forage yield and nitrogen uptake in an alfalfa–silage maize relay intercropping system in the North China Plain. Field Crops Res. 2021, 263, 108068. [Google Scholar] [CrossRef]
  3. Jahanzad, E.; Sadeghpour, A.; Hashemi, M.; Keshavarz Afshar, R.; Hosseini, M.B.; Barker, A.V. Silage fermentation profile, chemical composition and economic evaluation of millet and soya bean grown in monocultures and as intercrops. Grass Forage Sci. 2016, 71, 584–594. [Google Scholar] [CrossRef]
  4. Qu, Y.; Jiang, W.; Yin, G.; Wei, C.; Bao, J. Effects of Feeding Corn-lablab Bean Mixture Silages on Nutrient Apparent Digestibility and Performance of Dairy Cows. Asian-Australas J. Anim. Sci. 2013, 26, 509–516. [Google Scholar] [CrossRef] [PubMed]
  5. Contreras-Govea, F.E.; Muck, R.E.; Armstrong, K.L.; Albrecht, K.A. Nutritive value of corn silage in mixture with climbing beans. Anim. Feed. Sci. Technol. 2009, 150, 1–8. [Google Scholar] [CrossRef]
  6. Khatoon, H.; Banerjee, S.; Guan Yuan, G.T.; Haris, N.; Ikhwanuddin, M.; Ambak, M.A.; Endut, A. Biofloc as a potential natural feed for shrimp postlarvae. Int. Biodeterior. Biodegrad. 2016, 113, 304–309. [Google Scholar] [CrossRef]
  7. Hatungimana, E.; Stahl, T.C.; Erickson, P.S. Growth performance and apparent total tract nutrient digestibility of limit-fed diets containing wet brewer’s grains to Holstein heifers. Transl. Anim. Sci. 2020, 4, txaa079. [Google Scholar] [CrossRef]
  8. Ni, K.; Wang, F.; Zhu, B.; Yang, J.; Zhou, G.; Pan, Y.; Tao, Y.; Zhong, J. Effects of lactic acid bacteria and molasses additives on the microbial community and fermentation quality of soybean silage. Bioresour. Technol. 2017, 238, 706–715. [Google Scholar] [CrossRef]
  9. McDonald, P.; Henderson, A.; Heron, S.J.E. The Biochemistry of Silage, 2nd ed.; Chalcombe Publications: Shedfield, UK, 1991. [Google Scholar]
  10. Carpici, E.B. Nutritive values of soybean silages ensiled with maize at different rates. Legume Res.-Int. J. 2016, 39, 810–813. [Google Scholar] [CrossRef] [Green Version]
  11. Larsen, S.U.; Hjort-Gregersen, K.; Vazifehkhoran, A.H.; Triolo, J.M. Co-ensiling of straw with sugar beet leaves increases the methane yield from straw. Bioresour. Technol. 2017, 245, 106–115. [Google Scholar] [CrossRef]
  12. Jiang, Y.; Dennehy, C.; Lawlor, P.G.; Hu, Z.; Zhan, X.; Gardiner, G.E. Inactivation of enteric indicator bacteria and system stability during dry co-digestion of food waste and pig manure. Sci. Total Environ. 2018, 612, 293–302. [Google Scholar] [CrossRef] [PubMed]
  13. Muck, R.E. Microbiologia da silagem e seu controle com aditivos. Rev. Bras. De Zootec. 2010, 39, 183–191. [Google Scholar] [CrossRef] [Green Version]
  14. Ni, K.; Zhao, J.; Zhu, B.; Su, R.; Pan, Y.; Ma, J.; Zhou, G.; Tao, Y.; Liu, X.; Zhong, J. Assessing the fermentation quality and microbial community of the mixed silage of forage soybean with crop corn or sorghum. Bioresour. Technol. 2018, 265, 563–567. [Google Scholar] [CrossRef]
  15. McCabe, M.S.; Cormican, P.; Keogh, K.; O’Connor, A.; O’Hara, E.; Palladino, R.A.; Kenny, D.A.; Waters, S.M. Illumina MiSeq Phylogenetic Amplicon Sequencing Shows a Large Reduction of an Uncharacterised Succinivibrionaceae and an Increase of the Methanobrevibacter gottschalkii Clade in Feed Restricted Cattle. PLoS ONE 2015, 10, e0133234. [Google Scholar] [CrossRef]
  16. Wang, M.; Gao, R.; Franco, M.; Hannaway, D.B.; Ke, W.; Ding, Z.; Yu, Z.; Guo, X. Effect of Mixing Alfalfa with Whole-Plant Corn in Different Proportions on Fermentation Characteristics and Bacterial Community of Silage. Agriculture 2021, 11, 174. [Google Scholar] [CrossRef]
  17. Yan, Y.; Gong, W.; Yang, W.; Wan, Y.; Chen, X.; Chen, Z.; Wang, L. Seed Treatment with Uniconazole Powder Improves Soybean Seedling Growth under Shading by Corn in Relay Strip Intercropping System. Plant Prod. Sci. 2010, 13, 367–374. [Google Scholar] [CrossRef]
  18. Echarte, L.; Maggiora, A.D.; Cerrudo, D.; Gonzalez, V.H.; Abbate, P.; Cerrudo, A.; Sadras, V.O.; Calviño, P. Yield response to plant density of maize and sunflower intercropped with soybean. Field Crops Res. 2011, 121, 423–429. [Google Scholar] [CrossRef]
  19. Zeng, T.; Li, X.; Guan, H.; Yang, W.; Liu, W.; Liu, J.; Du, Z.; Li, X.; Xiao, Q.; Wang, X.; et al. Dynamic microbial diversity and fermentation quality of the mixed silage of corn and soybean grown in strip intercropping system. Bioresour. Technol. 2020, 313, 123655. [Google Scholar] [CrossRef] [PubMed]
  20. Zeng, T.; Wu, Y.; Xin, Y.; Chen, C.; Du, Z.; Li, X.; Zhong, J.; Tahir, M.; Kang, B.; Jiang, D.; et al. Silage Quality and Output of Different Maize&ndash;Soybean Strip Intercropping Patterns. Fermentation 2022, 8, 174. [Google Scholar] [CrossRef]
  21. Nazli, M.H.; Halim, R.A.; Abdullah, A.M.; Hussin, G.; Samsudin, A.A. Potential of four corn varieties at different harvest stages for silage production in Malaysia. Asian-Australas J. Anim. Sci. 2019, 32, 224–232. [Google Scholar] [CrossRef]
  22. AOAC. Official Methods of Analysis, 15th ed.; Association of Official Analytical Chemists: Arlington, VA, USA, 1990. [Google Scholar]
  23. Van Soest, P.J.; Robertson, J.B.; Lewis, B.A. Methods for Dietary Fiber, Neutral Detergent Fiber, and Nonstarch Polysaccharides in Relation to Animal Nutrition. J. Dairy Sci. 1991, 74, 3583–3597. [Google Scholar] [CrossRef] [PubMed]
  24. Broderick, G.A.; Kang, J.H. Automated Simultaneous Determination of Ammonia and Total Amino Acids in Ruminal Fluid and In Vitro Media1. J. Dairy Sci. 1980, 63, 64–75. [Google Scholar] [CrossRef] [PubMed]
  25. Edgar, R.C. Search and clustering orders of magnitude faster than BLAST. Bioinformatics 2010, 26, 2460–2461. [Google Scholar] [CrossRef] [PubMed] [Green Version]
  26. Tamang, J.P. Biochemical and modern identification techniques|Microfloras of Fermented Foods. In Encyclopedia of Food Microbiology; Academic Press: Cambridge, MA, USA, 2014; pp. 250–258. [Google Scholar]
  27. Liu, X.; Rahman, T.; Song, C.; Yang, F.; Su, B.; Cui, L.; Bu, W.; Yang, W. Relationships among light distribution, radiation use efficiency and land equivalent ratio in maize-soybean strip intercropping. Field Crops Res. 2018, 224, 91–101. [Google Scholar] [CrossRef]
  28. Cui, L.; Yang, W.-y.; Huang, N.; Liu, J.; Wang, Y.-l.; Wang, X.-h.; Liu, Y.; Yan, S. Effects of maize plant types on dry matter accumulation characteristics and yield of soybean in maize-soybean intercropping systems. Ying Yong Sheng Tai Xue Bao 2015, 26, 2414–2420. [Google Scholar] [PubMed]
  29. Riaz, M.Q.; Südekum, K.H.; Clauss, M.; Jayanegara, A. Voluntary feed intake and digestibility of four domestic ruminant species as influenced by dietary constituents: A meta-analysis. Livest. Sci. 2014, 162, 76–85. [Google Scholar] [CrossRef]
  30. Yang, Z.; Zhou, L. Is Intestinal Bacterial Diversity Enhanced by Trans-Species Spread in the Mixed-Species Flock of Hooded Crane (Grus monacha) and Bean Goose (Anser fabalis) Wintering in the Lower and Middle Yangtze River Floodplain? Animals 2021, 11, 233. [Google Scholar] [CrossRef]
  31. Drouin, P.; Ferrero, F. Testing selectivity of bacterial and fungal culture media compared to original silage samples using next generation sequencing. J. Microbiol. Methods 2020, 179, 106088. [Google Scholar] [CrossRef]
  32. Cai, Y.; Benno, Y.; Ogawa, M.; Ohmomo, S.; Kumai, S.; Nakase, T. Influence of Lactobacillus spp. from an Inoculant and of Weissella and Leuconostoc spp. from Forage Crops on Silage Fermentation. Appl. Environ. Microbiol. 1998, 64, 2982–2987. [Google Scholar] [CrossRef] [Green Version]
  33. Rimal, S.; Sang, J.; Poudel, S.; Thakur, D.; Montell, C.; Lee, Y. Mechanism of Acetic Acid Gustatory Repulsion in Drosophila. Cell Rep. 2019, 26, 1432–1442.e4. [Google Scholar] [CrossRef]
  34. Kim, M.-H.; Yun, K.E.; Kim, J.; Park, E.; Chang, Y.; Ryu, S.; Kim, H.-L.; Kim, H.-N. Gut microbiota and metabolic health among overweight and obese individuals. Sci. Rep. 2020, 10, 19417. [Google Scholar] [CrossRef] [PubMed]
  35. McGarvey, J.A.; Franco, R.B.; Palumbo, J.D.; Hnasko, R.; Stanker, L.; Mitloehner, F.M. Bacterial population dynamics during the ensiling of Medicago sativa (alfalfa) and subsequent exposure to air. J. Appl. Microbiol. 2013, 114, 1661–1670. [Google Scholar] [CrossRef] [PubMed]
  36. Yan, Y.; Li, X.; Guan, H.; Huang, L.; Ma, X.; Peng, Y.; Li, Z.; Nie, G.; Zhou, J.; Yang, W.; et al. Microbial community and fermentation characteristic of Italian ryegrass silage prepared with corn stover and lactic acid bacteria. Bioresour. Technol. 2019, 279, 166–173. [Google Scholar] [CrossRef]
  37. Yin, F.; Cheng, Z.; Zhang, F. Effect of maize straw additives on the nutritional quality and bacterial communities of ensiled forage rape for animal feed. Chil. J. Agric. Res. 2021, 81, 585–596. [Google Scholar] [CrossRef]
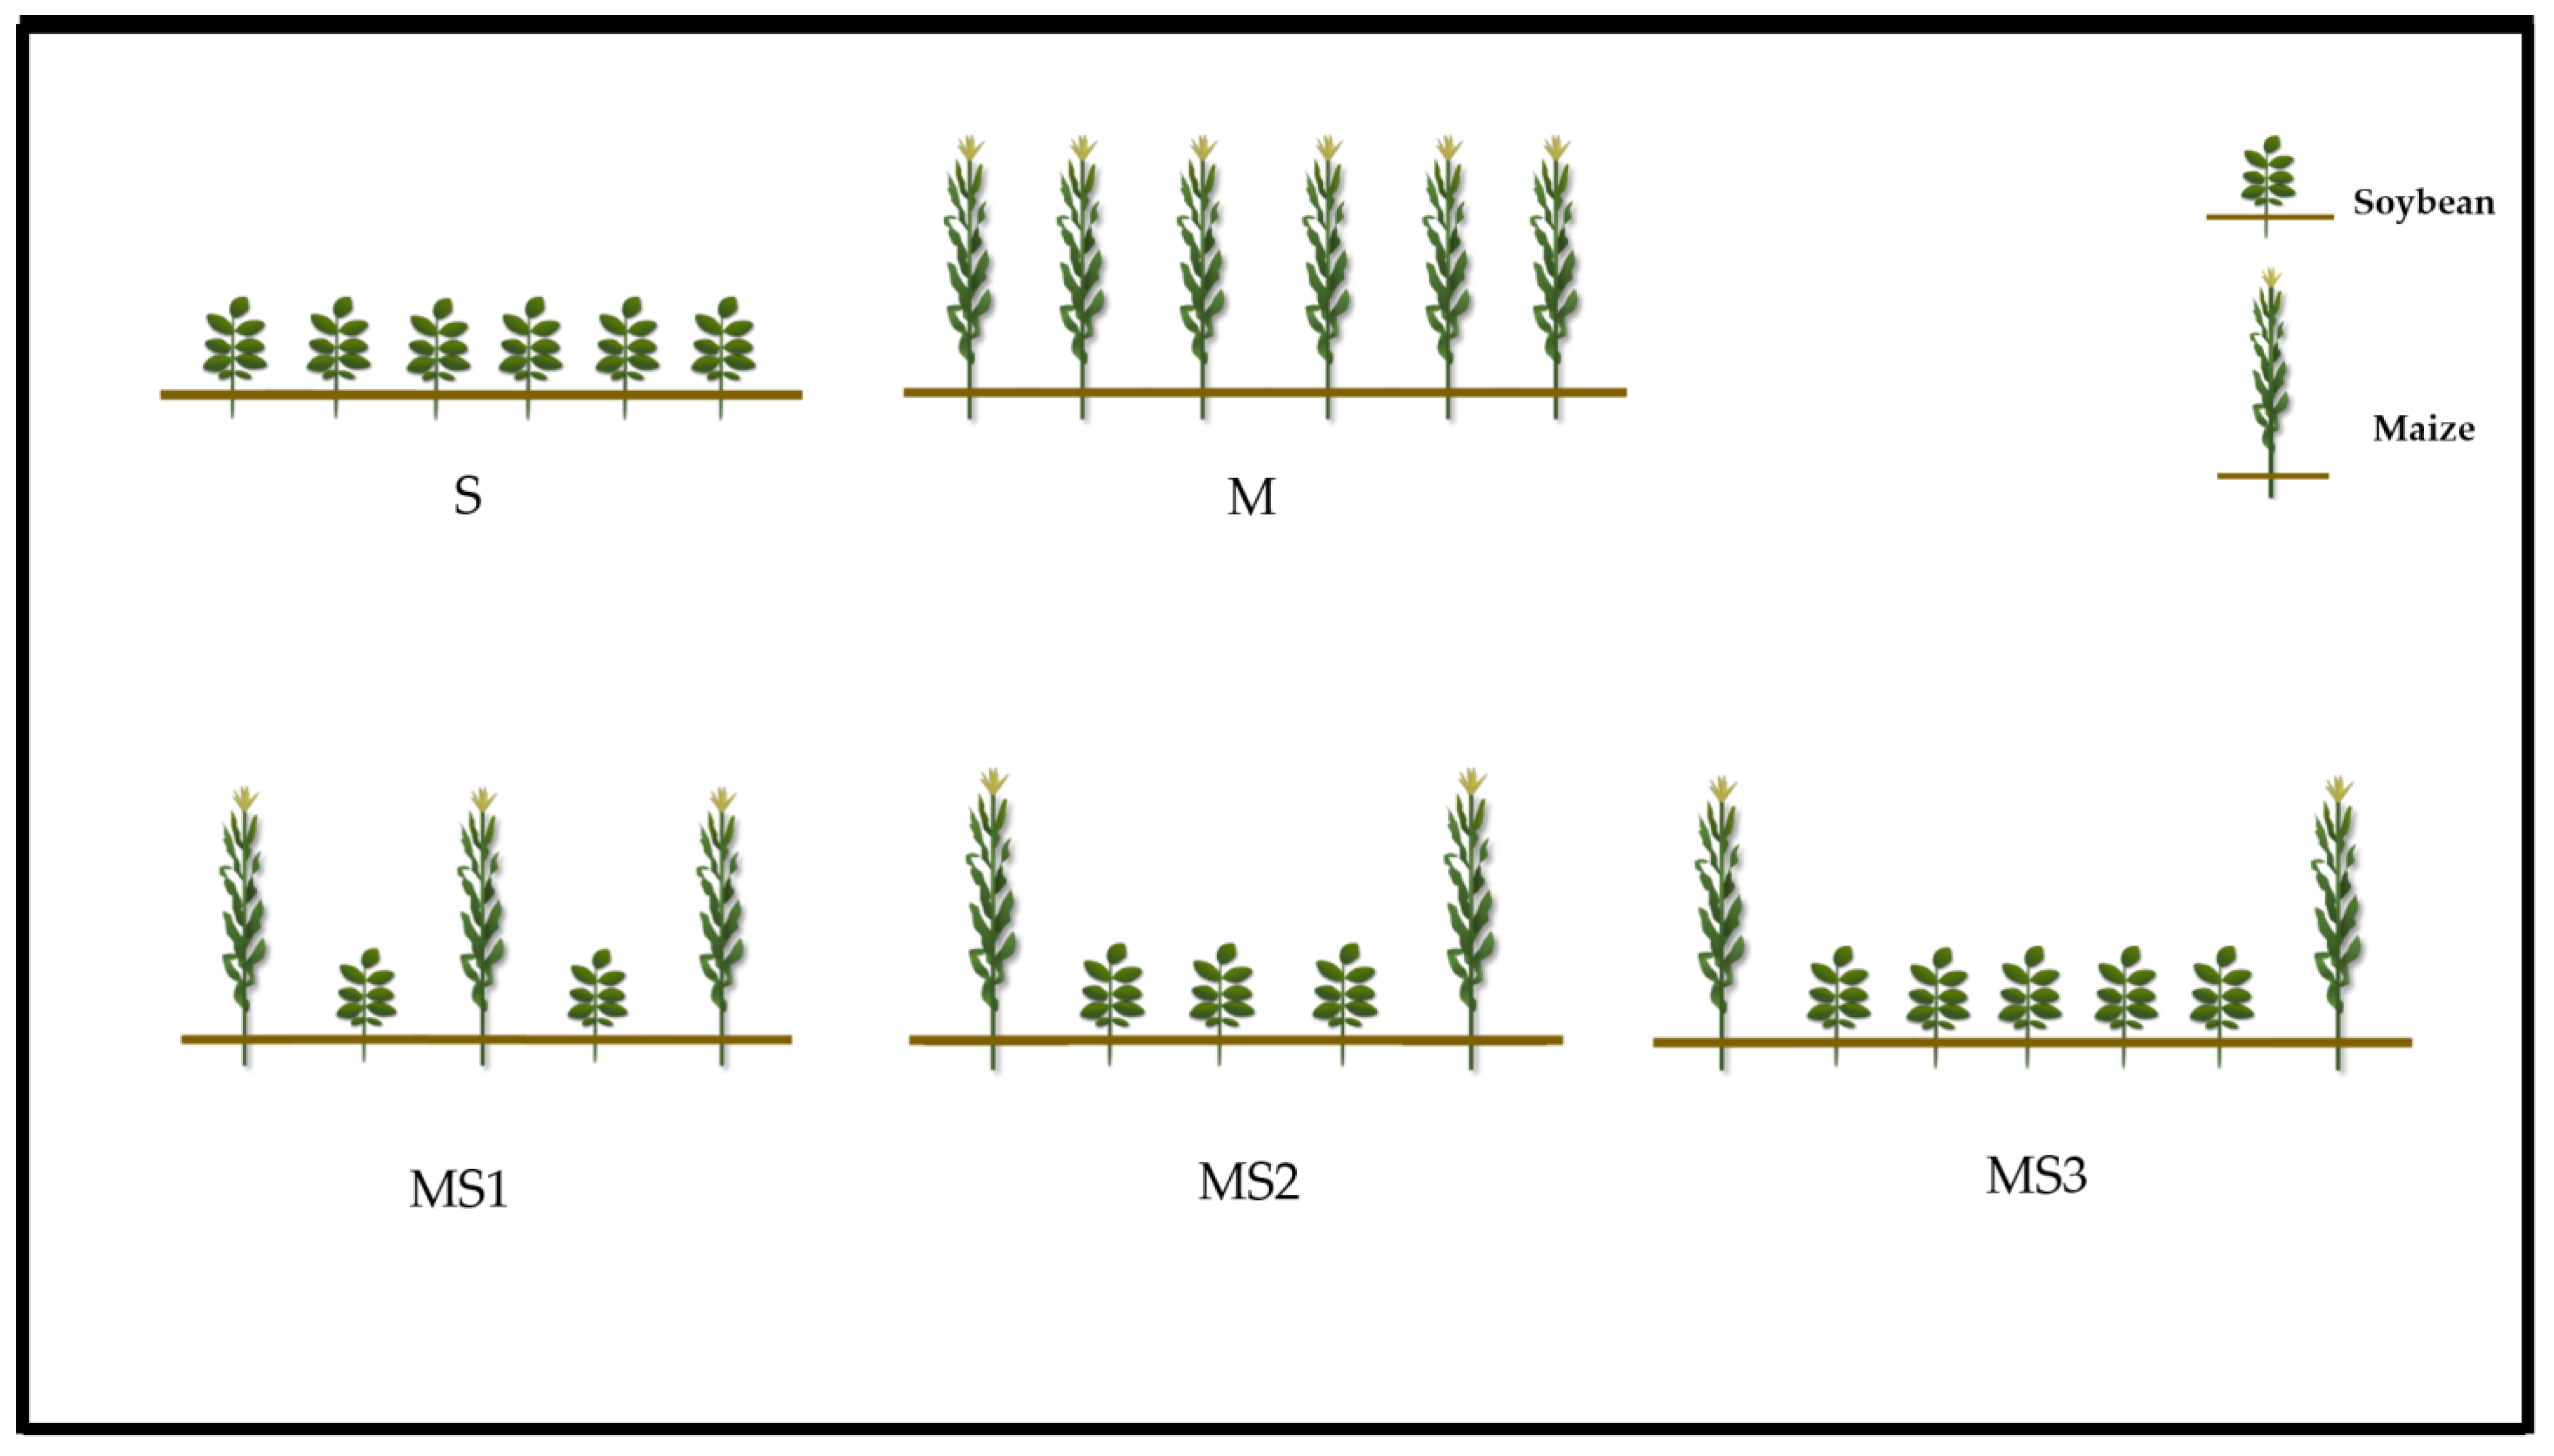
Figure 1. Illustration of the row layout of pure soybean, pure maize, and maize–soybean intercropping in the experimental planting patterns. S: pure soybean; M: pure maize; MS1, MS2, and MS3 separately meant row ratios of maize and soybean intercropping (1:1, 1:3, and 1:5).
Fermentation 08 00696 g001
Figure 2. Boxplots of the Chao1, Shannon, and observed species indexes after silage fermentation of the different treatments. The numbers under the Alpha-diversity Index label are the p-values of the Kruskal–Wallis test. Asterisks: ** denotes significant difference (p < 0.01); *** denotes significant difference (p < 0.001). S: monoculture of soybean; M: monoculture of maize; MS1, MS2, and MS3 mean different row ratios of maize and soybean intercropping (1:1, 1:3, and 1:5).
Fermentation 08 00696 g002
Figure 3. Venn diagram of the common or unique bacterial OTUs of different treatments. S: monoculture of soybean; M: monoculture of maize; MS1, MS2, and MS3 mean different row ratios of maize and soybean intercropping (1:1, 1:3, and 1:5).
Fermentation 08 00696 g003
Figure 4. Unweighted UniFrac PCoA plot of the five silage treatments. S: monoculture of soybean; M: monoculture of maize; MS1, MS2, and MS3 mean different row ratio of maize and soybean intercropping (1:1, 1:3 and 1:5).
Fermentation 08 00696 g004
Figure 5. Relative abundance of bacteria at the phylum level (A) and genus level (B). S: monoculture of soybean; M: monoculture of maize; MS1, MS2, and MS3 mean different row ratios of maize and soybean intercropping (1:1, 1:3, and 1:5).
Fermentation 08 00696 g005
Figure 6. Linear discriminant analysis Effect Size (LEfSe) shows microbial differences between M and S at different taxonomic levels. (A) Cladogram demonstrating differences at various phylogenic levels, and (B) LEfSe analysis with linear discriminant analysis (LDA) score. S: monoculture of soybean; M: monoculture of maize. The threshold for the LDA score of discriminative features is set to 4.0. The Kruskal–Wallis and Wilcoxon test filter threshold is 0.05.
Fermentation 08 00696 g006
Figure 7. Correlational analysis between chemical composition and bacterial community at the genus level. The heatmap is the Spearman correlation coefficient r (−1 to 1). A value over 0 means there is a negative correlation (blue), and a value below 0 means there is a positive correlation (red), Asterisks: * denotes significant difference (p < 0.05); ** denotes significant difference (p < 0.01); *** denotes significant difference (p < 0.001).
Fermentation 08 00696 g007
Table 1. The fresh and dry matter yields of maize and soybean using different cultivation models.
Treatment
ItemSMMS1MS2MS3SEMp-Value
SFM(t/ha)23.86 a0 d16.36 c19.25 b20.24 b0.58<0.001
MFM(t/ha)0 d75.19 b77.69 a75.36 b70.81 c0.45<0.001
MSFM(t/ha)23.86 d75.19 c94.05 a94.61 a91.05 b0.47<0.001
SDM(t/ha)7.25 a0 c5.89 b6.89 a7.24 a0.16<0.001
MDM(t/ha)0 d26.04 c27.96 a27.00 b25.31 c0.24<0.001
MSDM(t/ha)7.25 d26.04 c33.85 a33.90 a32.55 b0.17<0.001
Note: SFM: soybean fresh matter yield; MFM: maize fresh matter yield; MSFM: maize and soybean fresh matter yield; SDM: soybean dry matter yield; MDM: maize dry matter yield; MSDM: maize and soybean dry matter yield. Monoculture of soybean (S), monoculture of maize (M), and the row ratios of maize and soybean intercropping are 1:1 (MS1), 1:3 (MS2), and 1:5 (MS3). Means with different superscript letters (a–d) in a row are significantly different (p < 0.05) based on Tukey’s honestly significant difference (HSD) test. SEM: standard error of the mean.
Table 2. The main chemical composition of different treatments before ensiling.
Treatment
ItemSMMS1MS2MS3SEMp-Value
NDF (g/kg DM)477.06 a419.72 e422.30 d425.91 c446.72 b0.69<0.001
ADF (g/kg DM385.21 a275.06 d282.66 c289.33 b275.39 d1.15<0.001
CF (g/kg DM)35.15 a25.00 c27.51 bc28.13 bc29.45 b0.85<0.001
DM (g/kg FW)304.00 c346.35 b359.51 a358.31 a357.49 a1.04<0.001
WSC (g/kg DM)41.55 e130.33 a94.03 b88.53 c80.08 d0.34<0.001
CP (g/kg DM)183.55 a85.17 e125.10 c125.53 d150.03 b0.27<0.001
Note: NDF: neutral detergent fiber; ADF: acid detergent fiber; CF: crude fat; DM: dry matter; FW: fresh weight; WSC: water-soluble carbohydrates; CP: crude protein. Monoculture of soybean (S), monoculture of maize (M), and the row ratios of maize and soybean intercropping are 1:1 (MS1), 1:3 (MS2), and 1:5 (MS3). Means with different superscript letters (a–e) in a row are significantly different (p < 0.05) based on Tukey’s honestly significant difference (HSD) test. SEM: standard error of the mean.
Table 3. The fermentation quality and chemical composition of different mixed silage treatments after ensiling.
Treatment
ItemSMMS1MS2MS3SEMp-Value
pH4.62 a3.63 e3.92 c3.83 d4.06 b0.02<0.001
LA (g/kg DM)50.47 d85.00 a77.54 bc79.55 ab72.54 c1.28<0.001
AA (g/kg DM)36.99 a18.66 d25.27 c23.75 c28.76 b0.77<0.001
PA (g/kg DM)5.06 a2.55 c2.56 c2.78 c3.61 b0.11<0.001
BA (g/kg DM)2.14 a0.00 b0.00 b0.00 b0.00 b0.09<0.001
NDF (g/kg DM)476.50 a416.58 d419.50 d422.95 c443.15 b0.67<0.001
ADF (g/kg DM)380.80 a272.06 d282.76 c288.05 b274.84 d0.95<0.001
NH3-N (g/kg TN)84.98 a44.12 c44.63 c47.78 b48.93 b0.44<0.001
CF (g/kg DM)36.65 a25.59 d28.71 c29.13 c30.45 b0.21<0.001
DM (g/kg FW)305.98 d356.35 b369.03 a368.31 ab337.49 c2.69<0.001
WSC (g/kg DM)19.40 e43.23 a33.03 b31.53 c30.08 d0.27<0.001
CP (g/kg DM)173.55 a81.17 d121.10 c120.53 c147.03 b0.32<0.001
Note: LA: lactic acid; AA: acetic acid; PA: propionic acid; BA: butyric acid; NDF: neutral detergent fiber; ADF: acid detergent fiber; DM: dry matter; NH3-N: ammonia nitrogen; TN: total nitrogen; CF: crude fat; DM: dry matter; FW: fresh weight; WSC: water-soluble carbohydrates; CP: crude protein. Monoculture of soybean (S), monoculture of maize (M), and the row ratios of maize and soybean intercropping are 1:1 (MS1), 1:3 (MS2), and 1:5 (MS3). Means with different superscript letters (a–e) in a row are significantly different (p < 0.05) based on Tukey’s honestly significant difference (HSD) test. SEM: standard error of the mean.
Publisher’s Note: MDPI stays neutral with regard to jurisdictional claims in published maps and institutional affiliations.