Article

Bio-Electrochemical Performance of a Ceramic Microbial Fuel Cell Treating Kitchen Waste Leachate: Effect of Organic Loading Rate and Anode Electrode Surface Area

School of Infrastructure, Indian Institute of Technology Bhubaneswar, Argul, Bhubaneswar 752050, Odisha, India
*
Author to whom correspondence should be addressed.
Fermentation 2022, 8(10), 544; https://doi.org/10.3390/fermentation8100544
Submission received: 19 September 2022 / Revised: 12 October 2022 / Accepted: 12 October 2022 / Published: 15 October 2022
(This article belongs to the Special Issue Advances in Resource Recovery from Organic Wastes (ARROW))

Abstract

:
Performance evaluation of a ceramic microbial fuel cell (CMFC) by varying organic strength, hydraulic retention time (HRT) and anode electrode surface area (AESA) to treat leachate generated from acidogenesis of kitchen waste (KW) was studied by the central composite design of experiment. The increase in organic loading rate (OLR) positively affected power density (PD) while negatively influencing organic removal and coulombic efficiency (CE). This behavior is possible due to substrate inhibition and the coercive effect of low HRT, i.e., substrate washout, biofilm abrasion, and reduced contact period, while at high HRT, the volatile fatty acid (VFA) degradation improved. Since acetic acid is the final product of long-chain VFAs degradation, a pseudo consumption order for VFAs was obtained: butyric > propionic > acetic. The AESA aided organics removal and PD but had a negligible effect on CE. According to ANOVA, the COD removal was linearly modeled, while PD and CE were quadratic. The validation runs (VR) proved efficient as the highest COD removal was for VR2 (83.7 ± 3.6%), while maximum PD and CE values obtained were 0.224 ± 0.02 W/m3 and 2.62 ± 0.33%, respectively, for VR3, supported by the lower anode potential.

1. Introduction

Wastage of food has become a global nuisance in the past couple of decades. The global community generates a whopping 2.0 billion tons of municipal solid waste (MSW) annually. The predominant fraction of this waste is organic (OFMSW) and comprises at least 47% [1]. The kitchen waste (KW), i.e., food, fruits, and vegetables, mainly represents this organic fraction [2,3,4]. Improper waste handling at the source makes this fraction either part of a landfill or is subjected to anaerobic digestion (AD). The former harms the nearby habitat, while the latter generates methane. Methane as an energy source has low calorific value, storage difficulties, and is a potent greenhouse gas, making it a contested resource for other valuable commodities. Instead, the intermediate fermentation products of AD, volatile fatty acids (VFA), can be utilized to extract green commodities such as hydrogen, octane enhancers, biopolymer production, bioelectricity, etc., or can be utilized as a carbon source for biological nutrient removal [5,6,7,8,9,10].
One of the cleanest energy sources is electricity which can be generated with the help of microbial fuel cells (MFCs). The MFC comprises anodic and cathodic chambers with individual electrodes separated by a cation exchange membrane (CEM). During the bio-oxidation of organic matter in the anode, the generated electrons and protons are transferred to the cathode with the help of an external circuit connecting the electrodes and the membrane, respectively. In the cathode, an electron acceptor such as oxygen, potassium ferry cyanide, etc., reduces them to water and produces electricity. The organic matter employed can be substituted by a high energy potential substrate, i.e., OFMSW, to produce electricity [11]. Some notable studies using MFC to treat OFMSW are discussed herein, but detailed literature can be found elsewhere [12,13].
Bridier et al. [14] employed fermented substrate having potatoes, tomatoes, beef patty, milk powder, biscuits, and water for MFC operation. The system suffered a 60% decline in coulombic efficiency (CE) from its initial performance. In another study, Xin et al. [15] performed a fungal mash-assisted hydrolysis of food waste of cafeteria waste in an air-cathode MFC. It generated a power density of 0.173 W/m3. Similarly, Yang et al. [16] used anaerobically digested effluents from food waste in a photo-MFC and achieved 75% organic removal efficiency (ORE). However, these studies did not consider the effect of VFA concentration on enhancing power density (PD). Further, Tremouli et al. [17] achieved 78% ORE in a membrane-less MFC with four air cathodes from fermented household waste. From these studies, the direct treatment of waste was perceived as a deterrent to MFC performance. Generally, the VFA production from these wastes needs to undergo hydrolysis, acidogenesis/ acetogenesis, or fermentation. This behavior is enhanced by the heterogeneity of several components in the waste mix, with their main constituent being carbohydrates, protein, and lipids at different levels of complexity [18]. This complex nature of compounds necessitates the presence of a diverse microbial community of hydrolyzers, fermentative and fermentation product-consuming, and electrochemically active bacteria at the anode. This encouragement to deploy multiple biological oxidation pathways, especially in a single anode chamber, compromises system performance [19]. Therefore, an intermediate step for homogenizing the waste into simple compounds, i.e., VFAs, must be employed; e.g., a leach bed reactor (LBR) [20,21,22,23]. These compounds can act as a suitable substrate for the MFC with easy transfer from LBR to MFC as leachate.
From the literature, the following operating parameters, organic strength, and HRT have been found to play an essential role in treating leachate under continuous mode in an MFC. However, the influence of anode electrode surface area (AESA) and organic loading rate (OLR) in degrading complex components of KW is yet to be explored extensively. Besides, most studies have used batch mode for treating a high-strength organic substrate, which has been found to stimulate multiple metabolic pathways [24]. Therefore, an attempt has been made to understand the interaction effect of these parameters on the organic removal, VFA consumption, and power generation using a design of experiment study on a ceramic-MFC (CMFC). In addition, the study aims to minimize the non-exoelectrogens mechanisms by regulating the aforementioned operating parameters.

2. Material and Methods

2.1. Microbial Fuel Cell Fabrication

An up-flow dual-chamber CMFC with perplex glass having earthen membranes was fabricated. The effective volume of each anodic and cathodic chamber was 95 mL (4 × 4 × 7 cm). The compartments were separated by an earthen membrane (4 mm thick) prepared by mixing laterite soil and bentonite (20%). The membrane’s proton and oxygen mass transfer coefficients are 3.34× 10⁻⁶ cm/s and 9.33 ×10⁻⁴ cm/s, respectively. Stainless steel mesh was used as the anode, whereas graphite plate (3 × 4 cm) formed the cathode electrode. The concealed copper wire was used as all the electrical connections between electrodes and external resistance (100 Ω). Detailed schematics of the CMFC can be found in a study conducted by the same research group [20]. After necessary dilution, the leachate obtained during the acidogenesis of kitchen waste in an LBR [20] was fed to the CMFC using a peristaltic pump (Miclins–PP 20 EX, Miclins, Tamil Nadu, India).

2.2. Analytical Methods

2.2.1. Leachate

The leachate was obtained after the acidogenic degradation of kitchen waste collected from the Indian Institute of Technology Bhubaneswar campus mess facility. It included cooked food (rice, bread, and curries) and precooked (fruits and vegetables with their peel) in a 70:30 ratio (w/w). Inert components such as plastic, paper, and bones were removed.
The leachate obtained from acidogenic LBR was subjected to analysis for pH by a pH meter (Orion A325, Thermo Scientific, Maharashtra, India) and chemical oxygen demand (COD) by Standard Methods [25]. For individual VFAs (acetic (AA), propionic (PA), butyric (BA), and valeric acid (VA)), the leachate was filtered through 0.45 µm filter paper and sufficiently diluted before its analysis using High Plasma Liquid Chromatography (reverse phase C18 column, Thermo Fischer, Germany) with a mobile phase of acetonitrile (25%) and 0.02 M KH2PO4 at 0.5 mL/min flow rate and 215 nm wavelength [26].

2.2.2. Electrical Performance of MFC

Daily assessment of CMFC performance was performed with a digital multimeter (Keysight 34972A, Keysight, India). The measurement of potential included open circuit voltage (OCV), closed-circuit voltage (100 Ω, external resistance), anode, and cathode potential against a reference electrode (Ag/AgCl, +197 mV vs. Standard Hydrogen Electrode, SHE). Cyclic voltammetry (CV) was done with the help of a three-electrode system potentiostat (Compactstat-plus B09135, IVIUM Technologies, Netherlands) at a scan rate of 10 mV/s. The electrochemical impedance study (EIS) was performed to determine ohmic, double-layer capacitance, and polarization resistance or internal resistance contributed by the various components of the fuel cell. In EIS, a potentiostat was coupled to a frequency response analyzer. It generated an alternating current signal of minimal amplitude to be applied to study the current response of the MFC. The EIS was performed in the frequency range of 1,00,000 Hz to 0.1 Hz, and the data obtained were analyzed by fitting it into an equivalent circuit model. The most used circuit model is the Randles circuit and Randles circuit with Warburg element. The CE was calculated using equation 1 [27].
CE = 8 I Fq Δ COD
Here, 8 is a constant used for COD based on MO2 = 32 for the molecular weight of O2. I is the current generated, q is the influent flow rate, F is the faraday’s constant, and ∆COD is the difference between influent and effluent COD.

2.3. Experimental Setting

The CMFC was inoculated with sludge from the sediment zone of a pond at the IIT-Bhubaneswar campus and diluted leached from LBR. The sludge was heat-treated in an oven for 15 min at 100 °C to suppress methanogenesis [28]. The leachate after collection from the LBR was stored at –4 °C. After inoculation, the MFC was subjected to designed experimental runs. The three independent variables correspond to the operating conditions of the CMFC, viz., COD concentration (mg/L), HRT (h), and AESA (cm2).
In the present study, a Central Composite Design (CCD) with three factors, three levels, and three center points yielded 31 treatment combinations. The set of experimental runs are shown in Table 1. These parameters were tested by Design-Expert software (version 7.0.0, Minnesota, United States) for structuring the study for optimization. The experimental study implements the CCD for optimizing the system performance. The factors responsible for system performance have been identified by performing a preliminary investigation and literature review. The chosen elements in the optimization study are organic strength (A), HRT (B), and AESA (C), with COD removal, PD, and CE are the response variables. The three factors’ high level (+1) values are 3.0 g/L, 20 h, and 32 cm2, while low level (−1) values are 1.0 g/L, 12 h, and 16 cm2, respectively, for COD, HRT, and AESA. Finally, multifactor optimization was carried out by employing the desirability function to maximize organics removal and power generation.

3. Results and Discussion

3.1. COD Removal in Earthen MFC

3.1.1. Effect of Leachate Strength

The organic strength of leachate is one of the significant factors affecting the OLR of CMFC, the other being the HRT. The COD removal values are reported in Table 1. It was observed that when the leachate strength was increased from 0.9 g/L (R7) to 3.5 g/L (R16), the CODRE dropped from 81.3 ± 4.1% to 43.9 ± 4.5%. Increasing substrate supply to a treatment unit leads to higher microorganism growth and should help enhance organic removal [29]. However, the trend ceases to follow after a certain concentration due to substrate inhibition phenomenon, as observed by Choi and Ahn [30]. In comparison, the organic removal achieved has improved slightly from 75% removal obtained from other studies using an organic fraction of the waste [16].

3.1.2. Effect of HRT

Another parameter, HRT, plays a significant part in controlling OLR on the CMFC system. In the present study, when the HRT was varied from 9.3 h (R14) to 22.7 h (R13), a slight increase in COD removal efficiency was obtained from 69.7 ± 3.2% to 73.3 ± 3.9%, respectively. Constant COD and AESA at higher values of HRT were perceived to encourage organic removal. A similar response of removal efficiencies was observed for R5 (79.5 ± 3.8%, 20 h) and its counterpart R2 (69.4 ± 4.9, 12 h). These improved results can be ascribed to a drop in HRT values, providing more contact time between substrate and biomass [29]. In addition, the lower HRT values cause hydraulic abrasion of the biofilm [31]. This appearance of biomass was evident from frequent and prolonged sloughing in the CMFC system operating at an HRT value of 12 h or below (physical observation).

3.1.3. Effect of Anode Electrode Surface Area

The AESA acts as an endless source of electron acceptor and allows for microbial growth to occur by providing more surface area for its development. These microbes degrade complex compounds into simpler ones. Also, it enhances biochemical reactions to surpass the thermodynamic barrier with the help of self-induced potential [32]. Besides, the OLR of the CMFC system is independent of the AESA. The removal trends are outlined in Table 1. On tripling the AESA for R4 (37.45 cm2) than R15 (10.55 cm2), the CODRE increased by 11%. Noticeable boost to removal efficiencies was obtained for runs having 16 cm2 surface area, i.e., R1, R6, R9, and R10, in contrast to their equivalent runs with a 32 cm2 surface area, i.e., R3, R2, R5, and R8, respectively. Most of the MFCs research is dedicated to improving the electrode material. This task is accomplished by enhancing the reaction rate at the electrode surface assisted by catalysts and increasing the number of sites for the reaction to take place, i.e., surface area [33]. In this regard, stainless steel, as an anode electrode, has performed more efficiently than carbon cloth and graphite plate in treating acetate solution, 20 mM [34].

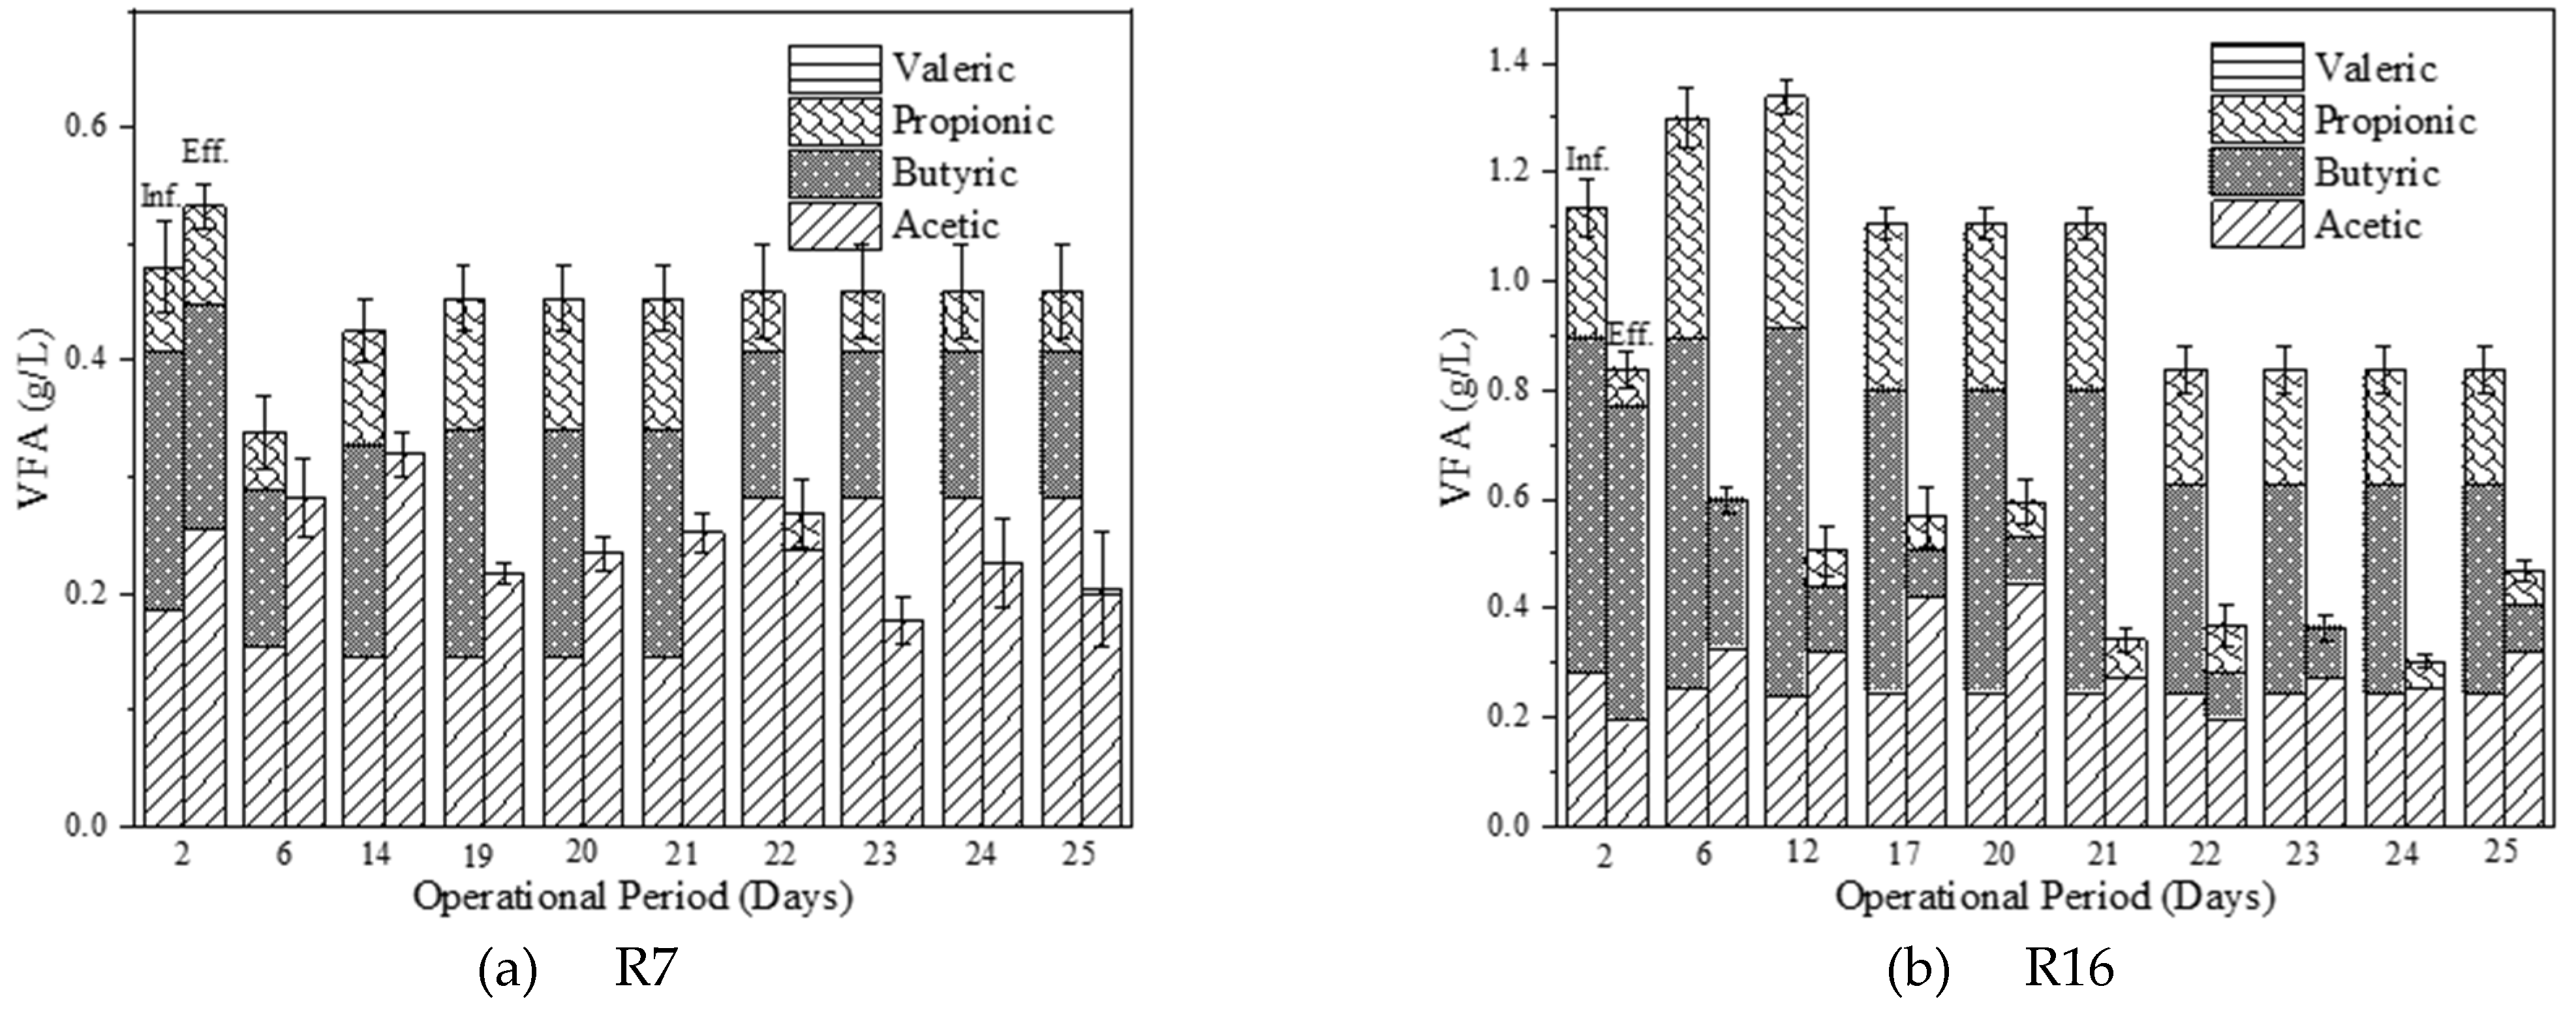
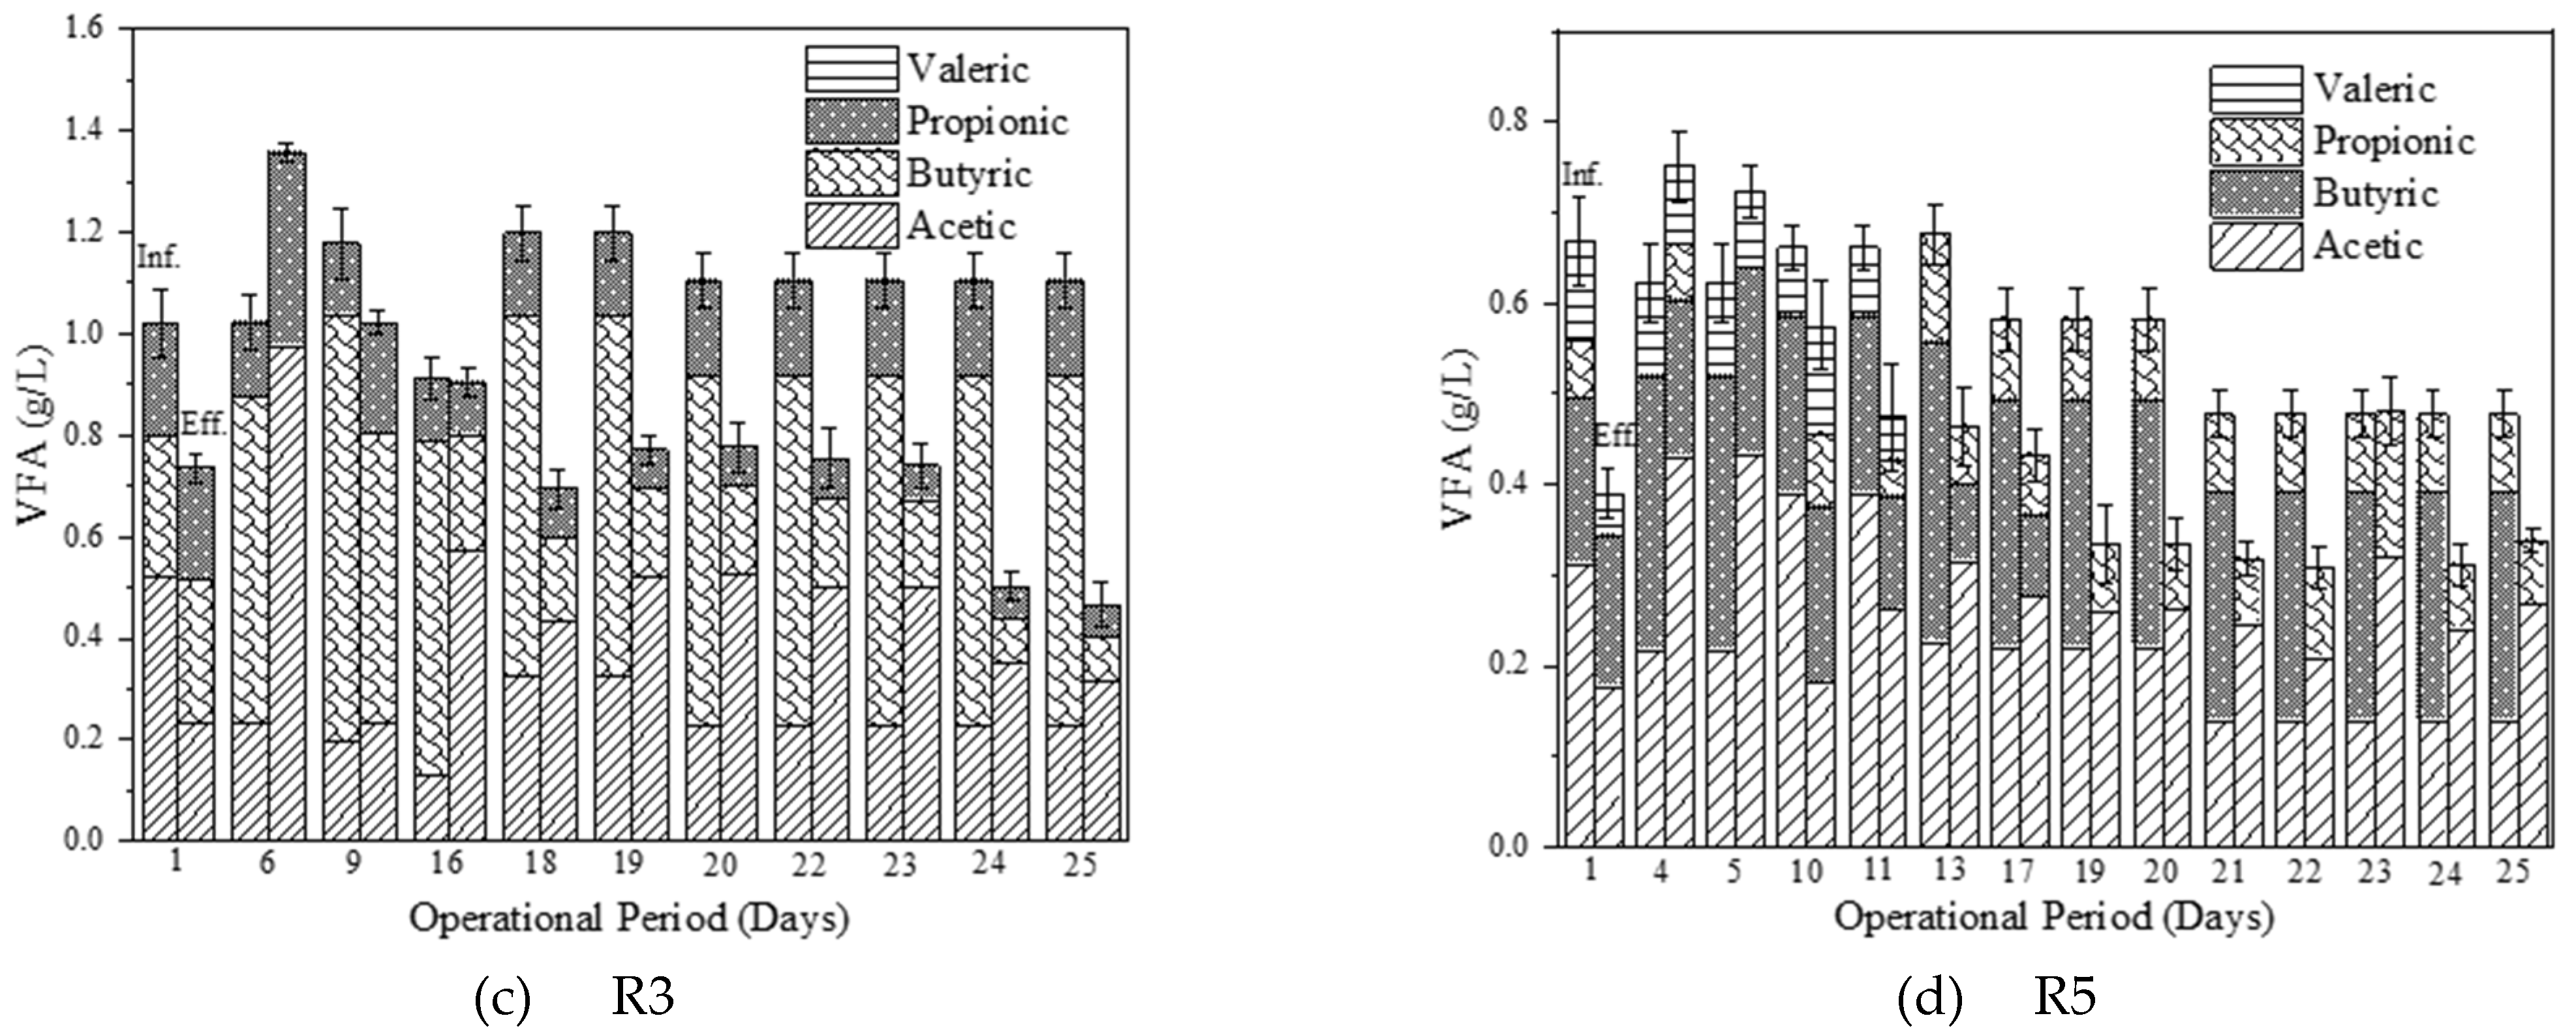
3.2. VFA Degradation in CMFC

3.2.1. Effect of Leachate Strength

The leachate represented both readily degradable and complex contents. In runs R7 and R16, the VFA contribution was dominated by AA, BA, and PA with no presence of VA. The VFA consumption profiles are shown in Figure 1a,b for R7 and R16, respectively. The microbes preferred BA and PR for degradation. The AA concentration was consistent throughout the study due to the degradation of long-chain fatty acids, i.e., BR and PR, to small-chain fatty acids, i.e., AA [35].
In R16, the high organic concentration of substrate led to the presence of higher VFA content. After close observations, the VFA consumption followed similar affinity trends as in R7. Due to the higher content of VFA in the leachate, an affinity for consuming only readily consumable compounds rather than degrading complex fractions was observed. Unlike R7, the complex compound degradation led to only VFA content as a residual compound in the effluent. This response is confirmed by the higher VFA/COD ratio of effluent from R7 (0.96) compared to R16 (0.36). The average VFA consumption of R16 was 65.51 ± 7.08%, which was higher than R7 (44.84 ± 3.22%) despite being subjected to low organic concentration. It depicts the development of multiple metabolic pathways at the expense of removal efficiency. In addition, the system’s primary source of electricity generation can be attributed to AA, as it is the final product of the degradation pathways of longer chain VFAs, and the only remaining product in the effluent.
The increase in leachate strength showed lower organic efficiency for R2 than for R8. However, the VFA consumption was more in R8 (74 ± 6.25%) than in R2 (54.73 ± 4.34%). This constitutes affinity towards readily consumable substances at a high organic concentration at 12 h HRT. Besides, high OLR supports enhanced microbial growth that allows improved VFA consumption. Interestingly, due to the smaller organic concentration (R2, 1.5 g/L COD), the complex compounds were degraded in the initial period of system operation. This breakdown adds small chain VFAs, and their consumption was relatively less during the initial period (less than two weeks). This development became consistent over time and was visible from the 5th to the 13th day when VFA removal was less and fell even below zero. This negative consumption exhibits higher VFAs being disintegrated to lower chain VFAs.
For R8, a divergence from the above behavior was supported by abundant VFA that led to a preference for readily degradable compounds with no to negligible degradation of complex compounds. The same trend was seen for R3 and R5 runs represented in Figure 1c,d. However, the behavior changed slightly due to higher HRT, which will be discussed in the subsequent section.

3.2.2. Effect of HRT

As observed in the removal of the organic, the higher HRT allows a sufficient period for substrate degradation than the lower HRT. Also, the efficiency is adversely affected by the HRT. The same behavior was expected for VFAs. For low HRT, the VFA consumption was also significantly affected by substrate washout. At a low HRT of 9.3 h (R14), the VFA consumption was 70.01 ± 1.6% compared to a high HRT of 22.7 h (R13), which was 73.82 ± 4.77%. It shows R14′s propensity to consume readily degradable compounds over complex ones. Additionally, any favor to degrade complex compounds will support different degradation pathways for both runs. The individual VFA fractions are shown in Figure 2b,c. After stabilization, in R13, the VFAs present in the effluent were AA and PA (~15%), whereas for R14, all the primary VFAs were present with AA, PA (~25%), and BA (~15%). In comparison, the R7 has a low substrate and sufficient time for consuming higher organics.
The following observations are made when R3 and R5 having 20 h HRT are compared with R8 and R2 subjected to 12 h HRT. Figure 1c,d show individual VFA compositions for R3 and R5. Despite having 20 h HRT, the run with higher COD concentration (R3) did not show improved VFA consumption. Nonetheless, R5 consumed more VFA than R2, with their respective efficiency being 68.72 ± 3.49% and 54.73 ± 4.34%. The behavior was expected to be similar for R3 and R8, i.e., on stepping up the HRT, the run would provide better efficiency, but this was not the case. The only plausible reason for encouraging such behavior is the lower substrate concentration (1.5 g/L, R5). The 20 h HRT allows consumption of small chain fatty acids that are expected to degrade from complex compounds. However, the high HRT for high substrate concentration (3.0 g/L) might only be assisting in complex compound degradation, i.e., R3, and was not observed during R8 at 12 h HRT. This degradation of complex content recontributed to the organic content with insufficient time for their consumption for R3.

3.2.3. Effect of Anode Electrode Surface Area

For VFA removal, a higher microbial concentration will consume more VFA, and microbial diversity helps in degrading complex substrates. A larger anode electrode surface area facilitates biofilm development. Nevertheless, a reverse trend was obtained from the study. For R15 (10.55 cm2) and R4 (37.45 cm2), the VFA consumption decreased from 74.13 ± 4.53% to 63.79 ± 3.64%, respectively. The low surface area provides affinity only towards the VFAs. These conditions replicated low HRT conditions (less than 12 h) and thus carried out high consumption of readily consumed VFAs. Comparing the results for all the other central point runs viz., R11, R12, and R17, the VFA consumption profile was similar with an efficiency of 75.31 ± 4.64%, 77.44 ± 6.39%, and 71.45 ± 2.13%, respectively. These runs could consume BA and PA completely, while AA was found in the effluent.
Improved VFA consumption was observed for runs having AESA 32 cm2, i.e., R2 (54.73 ± 4.34%) and R8 (74 ± 6.25%) with their peers having lower AESA (16 cm2), i.e., R6 (50.96 ± 3.14%,) and R10 (68.60 ± 5.73%), respectively. It points to higher VFA consumption for the increase in AESA for constant HRT (12 h). In contrast, the discussion on the effect of 20 h HRT follows. Both runs, R9 and R1, had a VFA efficiency of 66.46 ± 4.27% and 75.47 ± 4.83%, respectively. Similarly, on equating the runs with increased AESA to 32 cm2, the respective efficiencies for R5 and R3 were 65.62 ± 8.24% and 52.43 ± 8.71%. This behavior suggests less surface area is better for VFA consumption. The higher AESA and higher HRT (20 h) cause regeneration of new small chain VFAs obtained by disintegrating complex substrates and, thus, shrink the VFA removal efficiency.

3.3. Power Density

The biological oxidation of the organic products generates electrons and protons in the anodic chamber, which are then transferred to the cathode. Therefore, if substrate concentration is more, it will result in higher production of electrons and protons accompanied by higher electricity generation. Further, the PD is affected by several parameters such as substrate type and strength, source of inoculum, reactor architecture, electrode material, surface area, solution conductivity, and internal and external resistance. Moreover, substrate type and concentration influence microbial community composition [36].

3.3.1. Effect of the Leachate Strength

On increasing substrate concentration from 0.98 g/L (R7) to 3.51 g/L (R16), PD increased by 80% from 0.134 W/m3 to 0.242 W/m3. Lower PD values were obtained for runs operated on low strength COD (1.5 g/L) viz., R2, R5, R6, and R9 than high strength COD (3.0 g/L) viz., R8, R3, R10, and R1, respectively. The high concentration bought a 20–35% increase in PD values of CMFC. The center point runs R11, R12, and R17 produced similar PD values of 0.217 ± 0.04, 0.227 ± 0.04, and 0.206 ± 0.02 W/m3, respectively. In addition, the runs with high OLR values (greater than 5.27 kg/m3·d) produced more power. This value of the OLR falls in the range found successful in operating an MFC [37]. The maximum PD of the CMFC system was for R3 (0.346 W/m3 or 103 mW/m2).
On a few occasions, the magnitude of PD values was lower than in other studies employing different substrates. The PD values obtained from treating complex waste such as buffered cellulose, composite food waste, food waste, and OFMSW were 0.28 W/m3, 107.89 mW/m2, 163.5 mW/m2 and 116 mW/m2, respectively [12,38,39]. However, these values were significantly low compared with simple substrates, e.g., acetate (2.4 W/m2). In this study, the PD produced was from a CMFC using leachate obtained from acidogenesis of KW with no polymer membrane and costly metal catalyst (such as Platinum), as was the case with other studies [12]. Therefore, the CMFC was found to be more efficient and economical.

3.3.2. Effect of HRT

Reducing HRT values increases substrate supply in the MFC system and helps improve the system’s power output [33]. When HRT was reduced from 22.7 h (R13) to 9.3 h (R14), the PD increased from 0.161 ± 0.032 W/m3 (R13) to 0.220 ± 0.05 W/m3 (R14). Therefore, an inevitable trade-off must be struck between increased organic content or decreased HRT to enhance the system’s power. Leachate, a concentrated substrate, permits such changes to fit user demand easily by dilution. Nonetheless, it was noticed that the low HRT also led to power reduction due to hydraulic abrasion when provided with low AESA.
A higher HRT for complex waste will provide time for substrate degradation and vice versa for lower HRT. Interestingly, the easily consumed substrate will be present in abundance at low HRT and desired over complex compounds, thus producing higher PD. This preferential conduct caused a washout of complicated compounds from the CMFC. On the other hand, the high HRT restricted the influx of these readily consumable compounds, and microbes facilitated the oxidation of the complex substrate. It nurtured different metabolic pathways of degradation with an ultimate reduction in power output.

3.3.3. Effect of Anode Electrode Surface Area

On raising AESA from 10.55 cm2 (R15) to 37.45 cm2 (R4), PD increased from 0.150 ± 0.02 W/m3 to 0.232 ± 0.03 W/m3. A similar boost in power generation was observed when runs with 16 cm2 AESA, i.e., R1, R6, R9, and R10, were increased to runs having 32 cm2, i.e., R3, R2, R5, and R8 with similar OLRs, respectively. On the other hand, on curtailing the AESA for R15 (10.55 cm2) compared to central point runs (24 cm2), the PD increased from 0.150 ± 0.02 W/m3 to 0.227 W/m3 (average for three center point runs). These improved results give the impression that the surface area plays a key role in PD enhancement.

3.4. Coulombic Efficiency

The energy yield of the MFC is related to the CE of the process. It is the number of electrons transferred for electricity generation through MFC. The CE is generally proportional to organic concentration, as it will produce higher electron flow. However, the CE reduced with an increase in leachate strength from 2.23% to 1.42% for 0.98 g/L and 3.51 g/L, respectively. Although the strength of the substrate affected the CE, the role of HRT cannot be ruled out. The values increased from 0.91% to 1.82% on upturning the HRT from 9.3 h (R14) to 22.7 h (R13). This upswing is possible only when sufficient time is allocated for waste oxidation. This supports the trend, keeping in mind the category of leachate is a complex substrate and will require adequate time before making a significant contribution to electricity generation [40]. Finally, a slight affirmative change was obtained in CE values when AESA was increased from 10.55 cm2 for R15 (1.40 ± 0.15%) to 37.45 cm2 for R4 (1.46 ± 0.18%). Therefore, even by doubling AESA (Stainless Steel), not much appreciation in CE value was observed.
The relatively low CE values to total organic removal efficiency indicate underutilization of the biofilm’s oxidation capacity and imply limitations in the complete conversion of carbon fuel to electricity. It also supports the notion of the dominance of methanogenic or non-electrogenic activity (e.g., nitrification-denitrification, sulfate, ammonium, etc.), oxygen diffusion from the cathode, and the age of biofilm [29]. Anyway, the type of substrate also affects the CE. The CE values obtained for various substrates such as non-fermentable substrate (>75%), ethanol or propionate or fermentable compounds (40–70%), synthetic wastewater (25–30%), and complex wastewater (0.8–13%) [38].

3.5. Cyclic Voltammetry
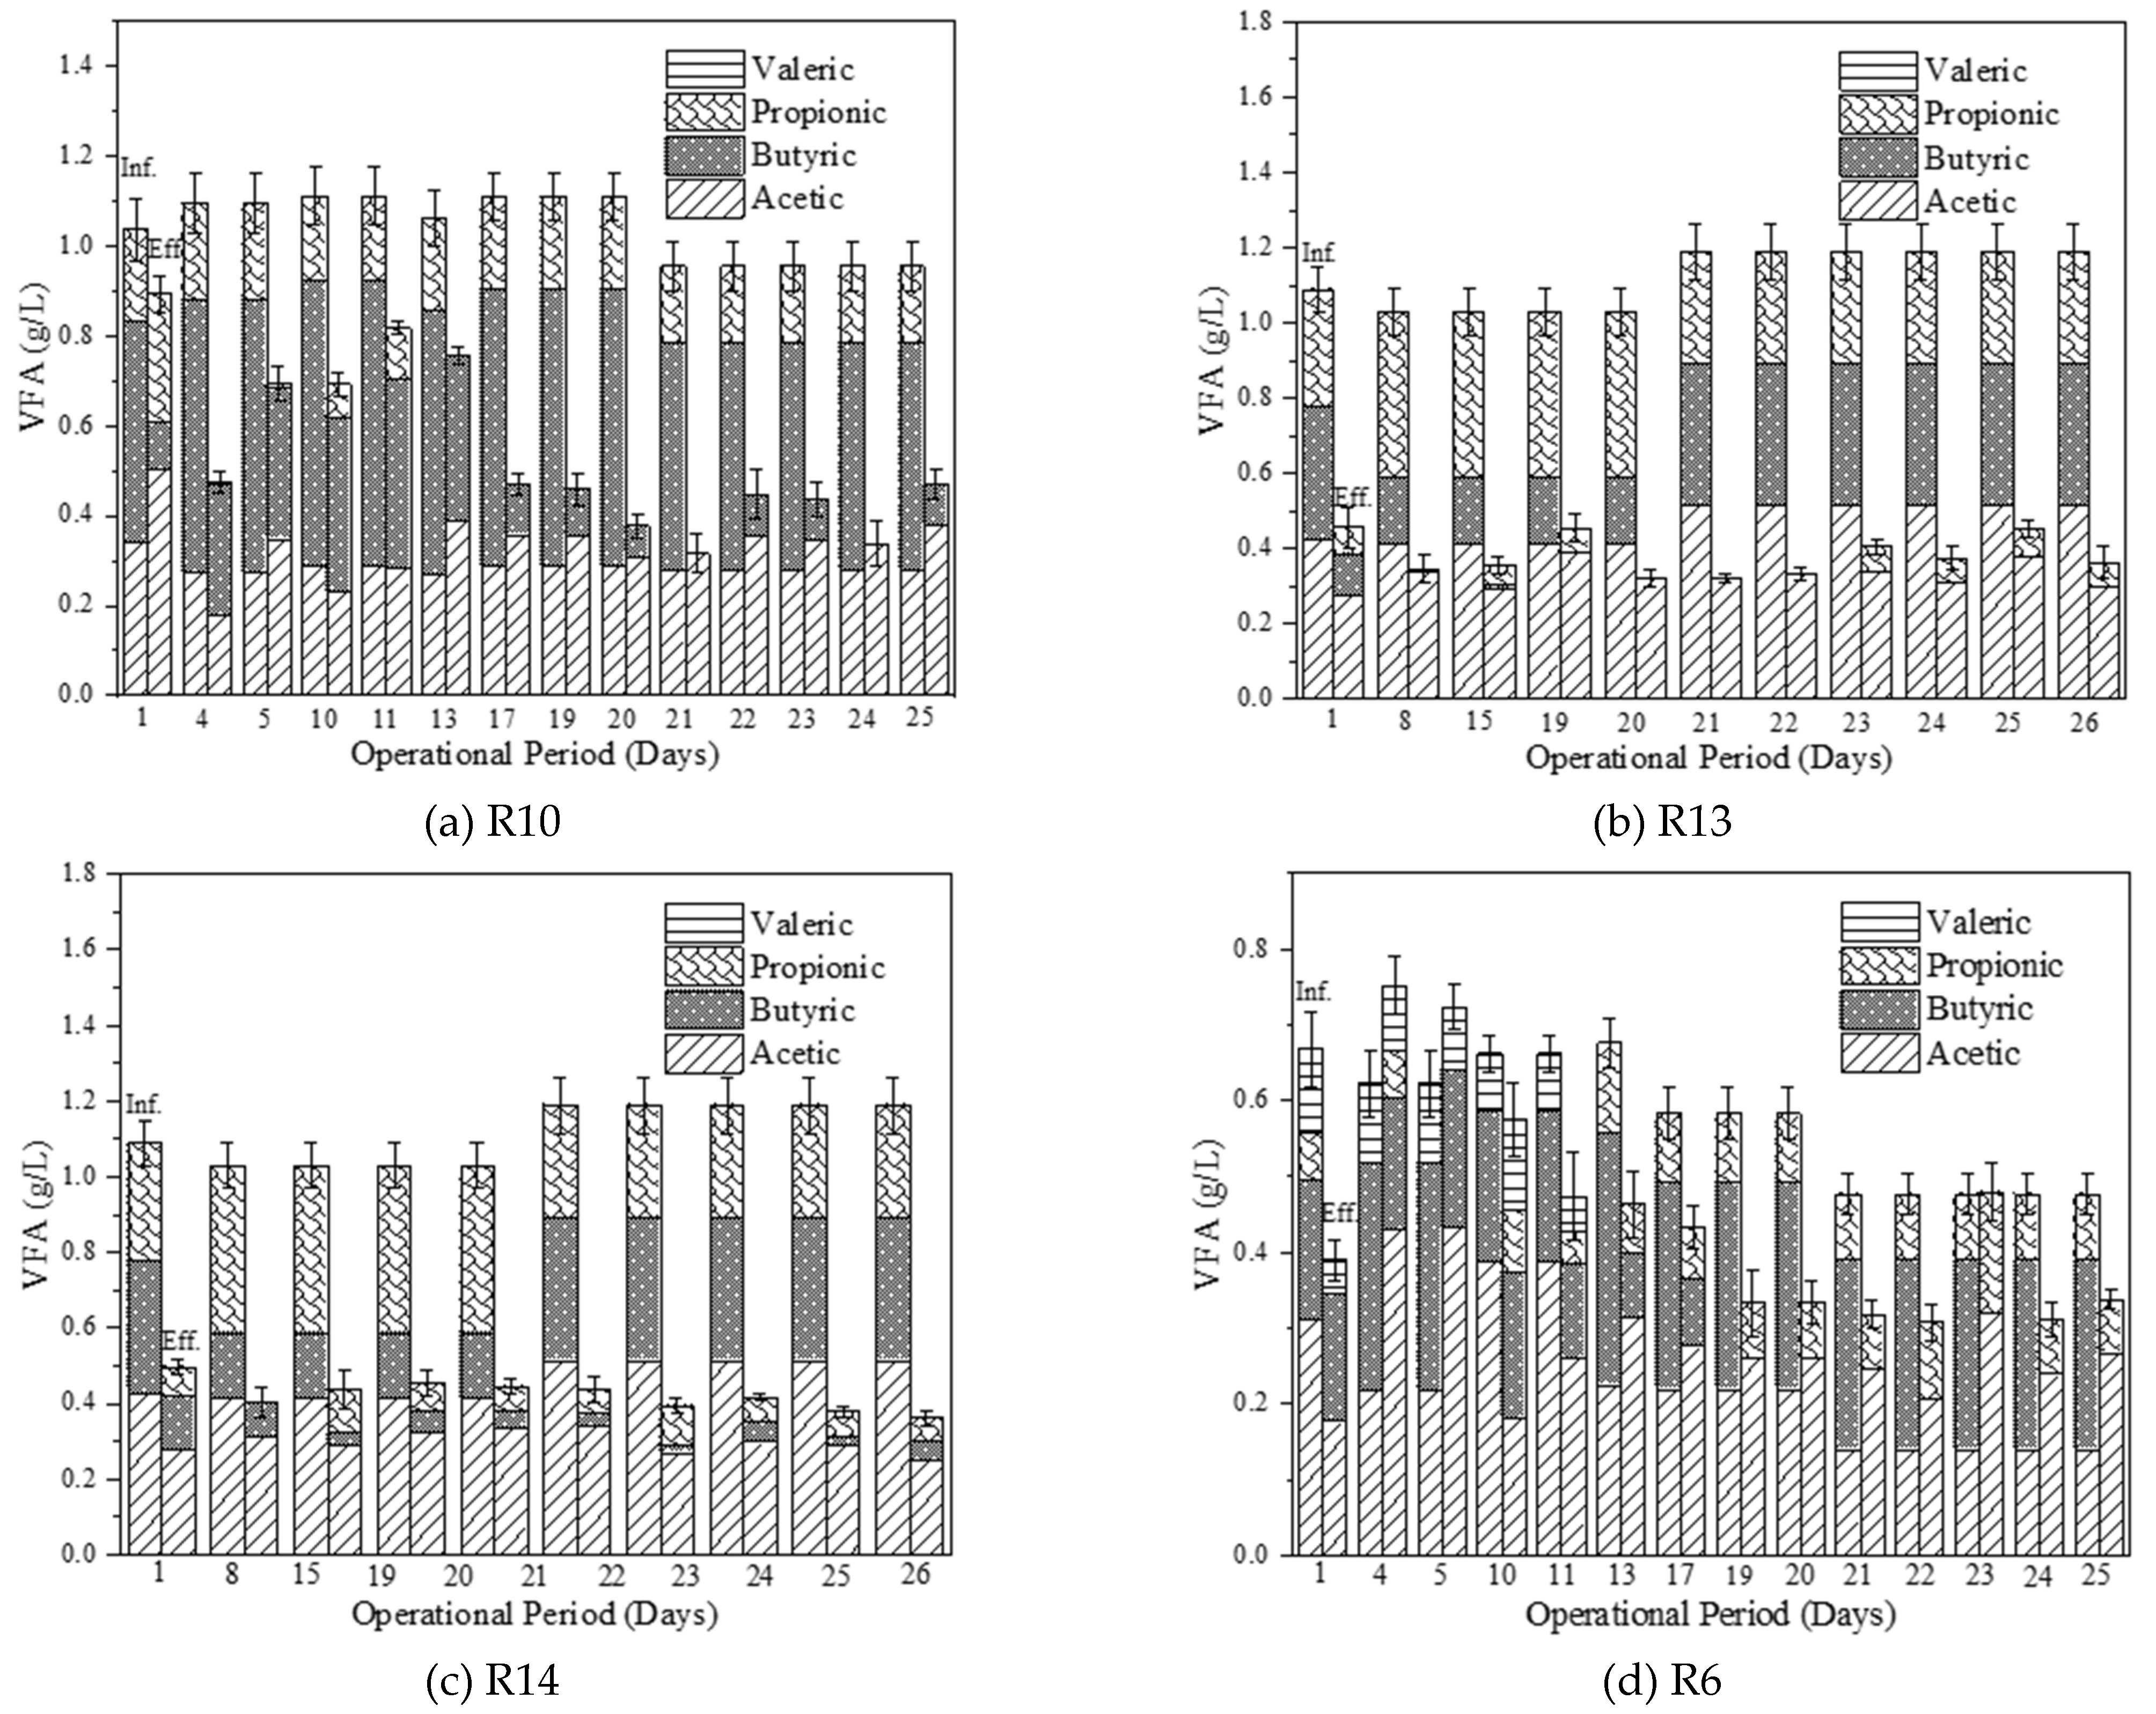
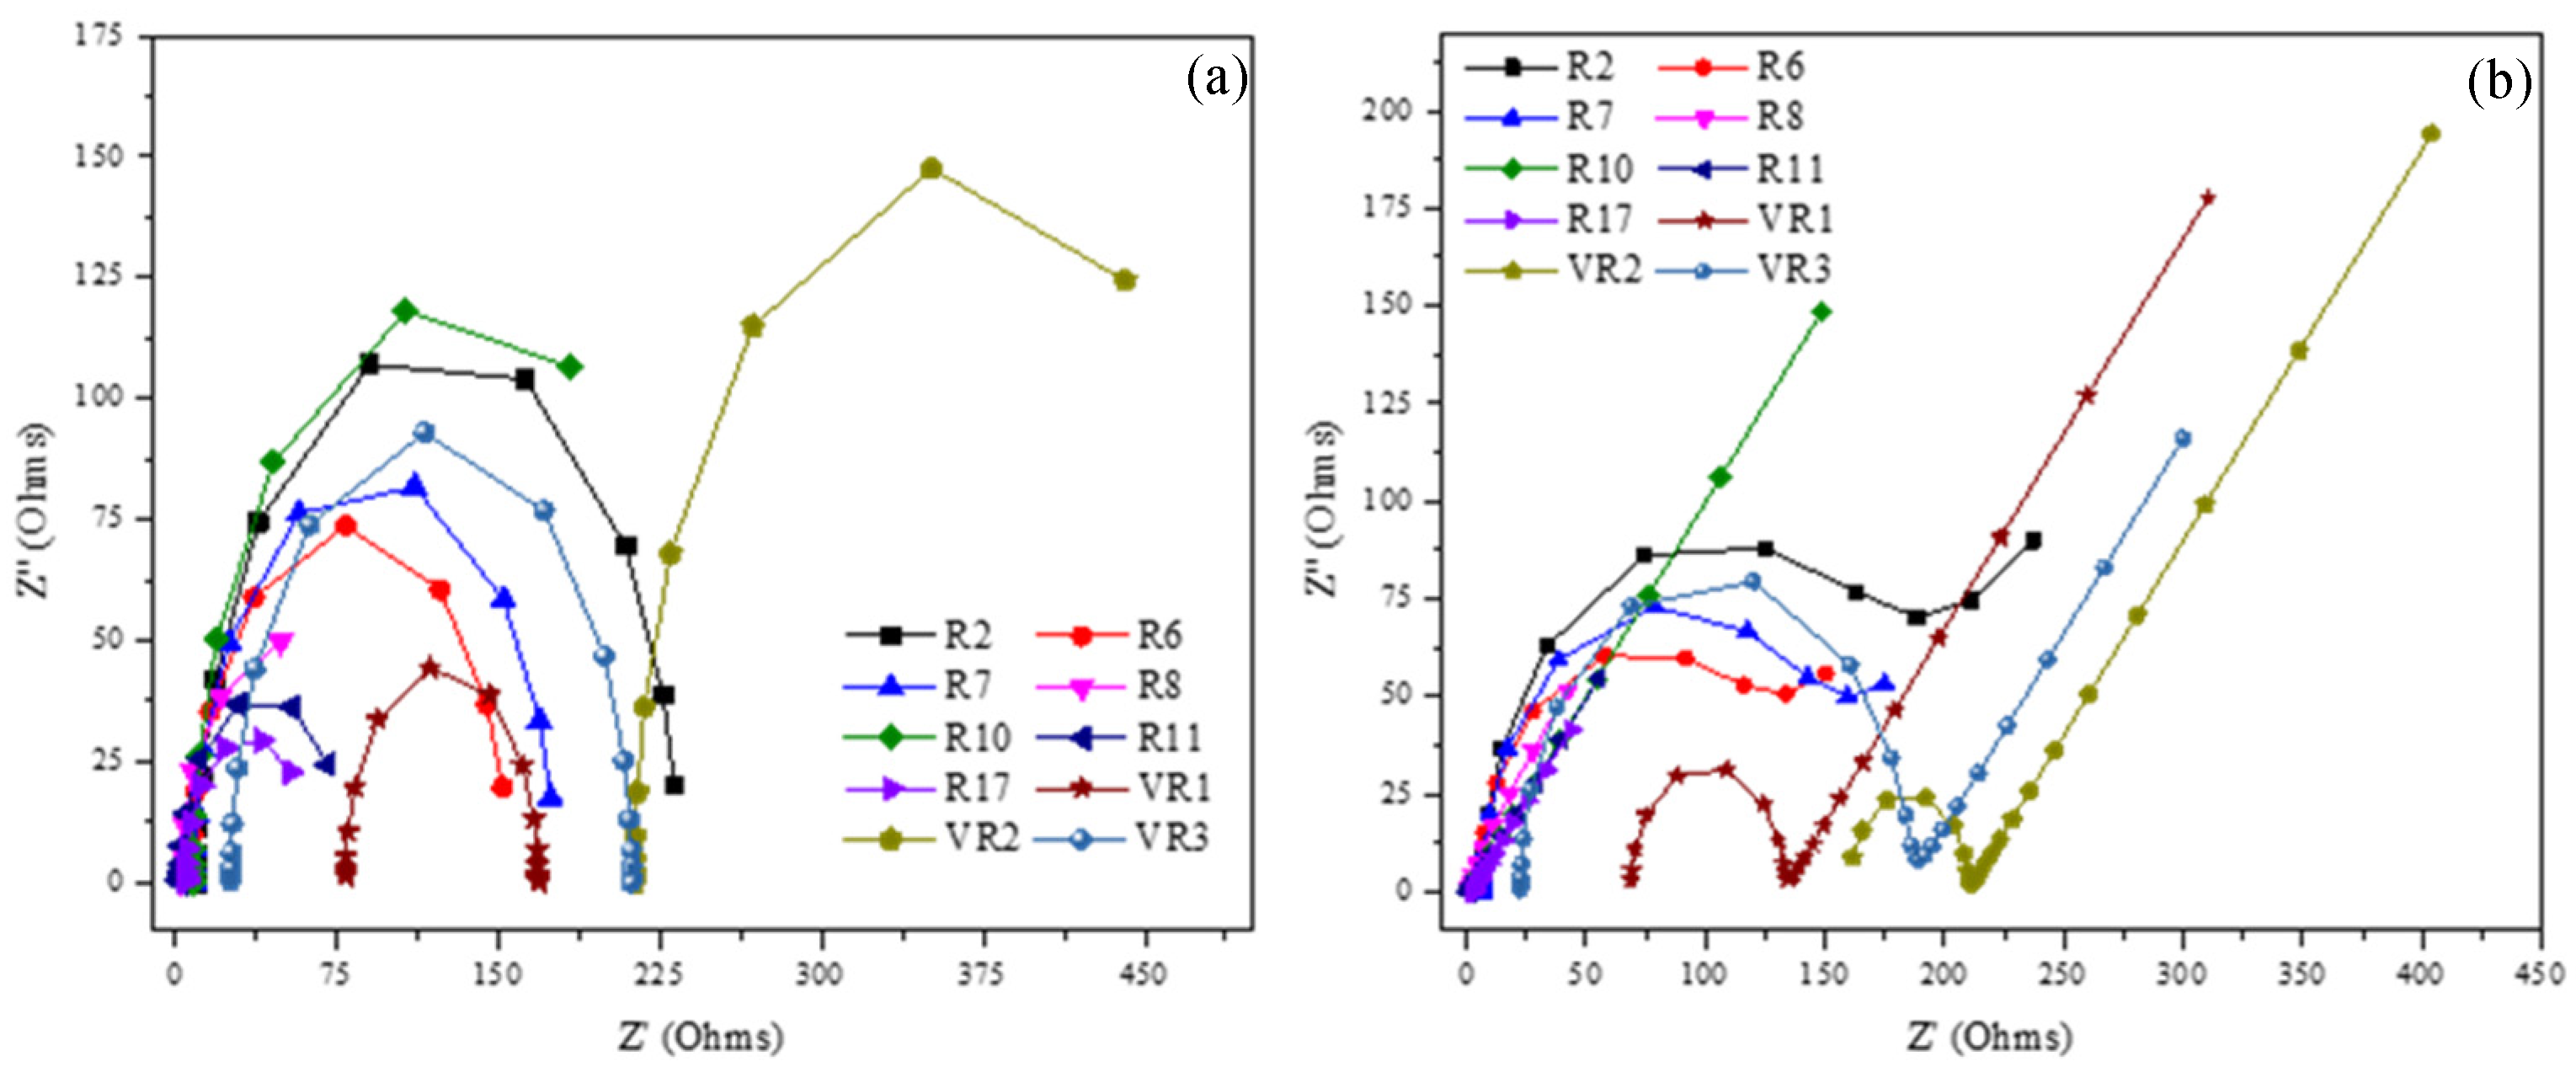
Figure 3 illustrates the graphs for cyclic voltammetry for selected runs. For low leachate concentration (0.98 g/L, R7), the oxidation current is low at 0.250 mA, while 0.433 mA was reported for the highest leachate strength (3.51 g/L, R16). This conduct of MFC systems can be due to substrate inhibition. From the above discussion, the system tends to develop multiple metabolic pathways by subjecting MFCs to high organic concentration and HRT; hence, the oxidation current would have fallen. On equating with 12 h HRT, the 20 h HRT produced an oxidation current of only 0.186 and 0.386 mA for R1 and R3 while 2.502 and 2.539 mA for R8 and R10, respectively. Therefore, in reducing HRTs, the substrate availability of readily degradable compounds is in abundance. Whereas, for high HRT with similar leachate strength, compared to 12 h HRT, the facilitation of complex substrate degradation limits current production. Moreover, the increase in AESA from 16 cm2 to 32 cm2 for runs having low HRT shows no significant improvement in oxidation current. However, on stepping up the AESA thrice, from 10.55 cm2 to 37.45 cm2, the oxidation current increased to 1.612 mA from 0.297 mA.

3.6. Impedance

The impedance studies for different operating conditions are presented in Figure 4. On increasing leachate strength, the ohmic resistance and charge transfer resistance dropped from 8.21 Ω to 3.32 Ω and 167.8 Ω to 0.303 Ω, respectively. Meanwhile, the Warburg element representing diffusion increased from 10.03 Ω to 16.59 Ω. This increment is apparent, as more organics were supplied for R16 (3.51 g/L) than R7 (0.99 g/L). Similar trends were for R2 and R8 (12 h), but the difference in R3 and R5 (20 h) resistance was not significant even for full cell studies. Nearly the same resistance of both the runs (R3 and R5) may be due to high HRT, which promotes complex compound degradation. More resistance was observed in R14 than in R13 for charge transfer and diffusion element because of complex substrates degradation during 22.7 h HRT than 9.3 h. In addition, when HRT was 12 h, the R6 produced lower Warburg element and internal resistance than R9 (20 h) at leachate strength of 1.5 g/L and 16 cm2 AESA due to abundant substrate availability for R6.
Further, when observed for R10 and R1, the internal resistance, charge transfer, and Warburg element were lower for R1 (20 h) than R10 (12 h), with a leachate strength of 3.0 g/L at 16 cm2 AESA. The frequent shocks the system went through during its operational period because of hydraulic abrasion of biofilm, substrate washout, and maturity of biofilm might be the reason for such response. The idea of limited diffusion through the biofilm can be supported by comparing the Warburg element for R10, i.e., 37.23 Ω, with a run (R8, 13.19 Ω) having more AESA (32 cm2). Similarly, the AESA plays a crucial role by complementing the OLR to maintain lower resistance in CMFC. Likewise, a trade-off between keeping a high HRT and a lower AESA or vice versa is required to reduce additional resistance to CMFC. Overall, the low capacitance ensured better charge separation between the electrolyte interface and electrode.

3.7. ANOVA Analysis

The ANOVA has proved to be an excellent tool for establishing a correlation between independent variables and responses. For COD removal, a linear relationship was obtained. All the factors considered were significant as per the model. The p-value of the model was obtained to be <0.0001 (significant), which is below the p-value required, i.e., 0.05 [39]. The p-value for the lack of fit was observed to be 0.20 and thus making it nonsignificant. A negative effect of COD concentration while other parameters, viz., HRT and AESA, positively affected the COD removal. Other measures such as R2, Adj-R2, adequate precision (AP), and CV are administered to check the model’s suitability. The R2 and Adj-R2 values were obtained at 0.89 and 0.87, respectively. The AP value was 18.42, greater than the required value of 4. This ratio measures the signal-to-noise ratio, and by means of this adequate signal, navigation in the design space is possible. The model equation (Equation (2)) developed for COD removal efficiency is [41]:
COD R E % = 65.75 0.0136 COD + 1.096 HRT + 0.501 AESA
The responses are illustrated by response surface graphs. Figure 5a–c show 3D response surface graphs plotted between two factors, COD concentration, and HRT, with a constant AESA of 24 cm2. For COD removal efficiency, PD and CE, respectively. Figure 5a shows the response surface graph for COD removal and illustrates trends similar to the one observed from the experimental runs. The response suggests a surge in organic removal efficiency on stepping up the HRT and AESA, but the increase in COD concentration suppressed the removal efficiency. In Figure 5b, the response variable, PD, is observed to complement the rise in organic concentration and AESA with a reduction in HRT. The lower HRT allowed abundant quantities of the substrate to be present for consumption while it indulged in promoting non-exoelectrogenic pathways at higher HRT. The model equation (Equation (3)) for PD is shown below [41]:
P D   mW m 3 = 0.0168 + 0.00011 × COD + 0.00325 × HRT + 0.00166 × AESA 0.000000022 COD 2
This model depends on the three operating parameters selected for the current studies. The model p-value was significant (<0.0001). The R2, Adj-R2, adequate precision, and CV values were obtained at 0.96, 0.91, 16.45, and 4.80%, respectively.
Finally, the model was quadratic with no transformation for the response variable, CE. The significant p-value for the model was 0.0002. The R2 and Adj-R2 values were 0.97 and 0.93, respectively. The adequate precision value was 16.29, and a CV value of 7.22%. The response reveals the main effect of COD and HRT with their interaction is significant. The equation for the model (Equation (4)) is shown below [41]:
CE   % = 1.497 0.0013 COD + 0.140 HRT 0.0000328 COD HRT + 0.00000033 COD 2

3.8. Validation Runs

Three experimental runs were conducted with distinct parameters to observe the model acceptability. The combinations of these runs are shown in Table 1, and performance is illustrated in Figure 6 for all optimized conditions. All the validation runs had almost similar OLR values of 1.65 kg/m3.d and AESA (37.45 cm2). The only variations were in the leachate strength and HRT. The order of the COD removal efficiency was VR2 > VR3 > VR1, which were 83.66 ± 3.55%, 78.8 ± 3.23%, and 75.62 ± 4.30%, respectively. The model prediction value for organic removals of all the validation runs was around 5% of their experimental values.
Unlike some runs having HRTs (<12 h), all the VRs proceeded gradually to attain performance stability. Also, the VFA removals were 58.64 ± 5.98%, 60.98 ± 3.26%, and 57.47 ± 3.11% for VR1, VR2, and VR3, respectively. The effluent of VR runs comprises AA and PR while favoring BA removal by its complete degradation. However, effluent recirculation can be performed to reduce the VFA concentration further, thereby improving the effluent characteristic for safe disposal in the nearby vicinity.
At last, the optimized parameters showed improvement in all the other response variables, viz., ORE, PD, and CE, with the best performance obtained by VR2 for organics while VR3 for CE and PD. The higher anode potential of CMFC aided superior electrical performance. The PD values for VR1, VR2, and VR3 were 0.204.08 ± 0.03 W/m3, 0.196 ± 0.03 W/m3, and 0.224 ± 0.03 W/m3, respectively. The CE values for the runs VR1, VR2, and VR3 were, respectively, 2.50 ± 0.26%, 2.09 ± 0.21%, and 2.62 ± 0.33%.
These improved values of CE and PD are due to lesser values of the system’s Warburg element (for the anode) for VR3 to VR1 and VR2. In contrast, the internal and charge transfer resistance shrank in VR1 due to high substrate concentration facilitating better microbial growth and availability. The same experience was stated above when the charge transfer resistance increased with less substrate being subjected to the CMFC. Finally, the catalytic current was highest for the system subjected to higher strength leachate with 1.95, 1.64, and 2.09 mA for VR1, 2, and 3, respectively.
The VR1 underperformed on many aspects, such as organic removal and electrical performance. This behavior establishes the limitations of keeping high HRTs, as they allow complex substrate degradation and cause a suppressed system response. The anode potential of the system improves the CMFC performance under validation runs. The anode potential regulates energy transfer and kinetics of electron transfer, biocatalyst to anode surface [42]. The low substrate leads to a lower anode potential, near zero. This low potential causes low energy transfers for cell growth and maintenance with low electron discharge and vice versa, which is the same for higher anode potential, near −400 mV. Sleutels et al. [43] reported that a drop in anode potential below −250 mV causes a reduction in both PD and CE. Therefore, compared to the anode potential for all the other runs in the experimental study, the potential was slightly higher in the validation runs because of the limiting substrate conditions.

4. Conclusions

The system during leachate treatment showed high organic removal for low strength substrate compared to high strength substrate but had a positive effect on PD while negatively affecting CE. In contrast, the decreasing HRT suppressed the organics removal ability of the system because of substrate washout, abrasion of biofilm, and lower contact period between microbes and substrate. Nevertheless, the decreasing HRT improved the OLR of the system, which in turn assisted PD with higher AESA. Besides, the HRT was an essential parameter for VFA degradation. First, it encouraged the consumption of readily degradable compounds in the leachate at low HRT. In addition, it led to the degradation of complex substances at high HRT with reduced power generation by facilitating different metabolic pathways. On the contrary, the low HRT promoted the consumption of only readily degradable compounds, thus giving a free pass to a complex fraction in the effluent. However, the anodic recirculation or cathodic treatment of effluent requires extensive investigation in the future. Also, the mixed microbial community showed a preference order of BA>PR>AA for VFA consumption. The third parameter, AESA, aided organics removal and PD but had a negligible effect on CE. The AESA plays an essential role in complementing the changes in OLR by varying organic concentration and HRT. The variation in AESA affected microbial growth, reaction kinetics, and system resistance, as discussed in Section 3.6, impedance study.
From ANOVA analysis, the COD removal response was modeled linearly, while the models for PD and CE were quadratic. At last, the optimized parameters showed improvement with all the other response variables, viz., ORE, PD, and CE. All the parameters at higher values favored non-electrogenic activity from the above discussions. Therefore, a systematic trade-off between the magnitudes of the operating conditions must be made depending on the treatment goals to treat high-strength wastewater that is analogous to leachate characteristics. Nevertheless, the change in the inoculum and start-up strategy of the CMFC needs further scrutiny to increase the power output of the CMFC. Moreover, studies establishing better relationships to understand CE are required, along with growth kinetics.

Author Contributions

Conceptualization, Methodology, Data curation, Writing—Original draft preparation, R.G.; Writing—Review & Editing, Supervision, Project administration, Funding acquisition, M.B. All authors have read and agreed to the published version of the manuscript.

Funding

This research was funded by the Science and Engineering Research Board, Department of Science and Technology, Govt. of India, grant number [ECR/2016/002015].

Institutional Review Board Statement

Not applicable.

Informed Consent Statement

Not applicable.

Data Availability Statement

All the data is presented in the manuscript.

Acknowledgments

The grant (ECR/2016/002015) received from the Science and Engineering Research Board, Department of Science and Technology, Govt. of India, is duly acknowledged.

Conflicts of Interest

The authors report there are no competing interest to declare.

References

  1. Kaza, S.; Yao, L.; Bhada-Tata, P.; Van Woerden, F. What a Waste 2.0: A Global Snapshot of Solid Waste Management to 2050; World Bank: Washington, DC, USA, 2018. [Google Scholar]
  2. Dhar, H.; Kumar, S.; Kumar, R. A Review on Organic Waste to Energy Systems in India. Bioresour. Technol. 2017, 245, 1229–1237. [Google Scholar] [CrossRef] [PubMed]
  3. Krishna, D.; Kalamdhad, A.S. Pre-Treatment and Anaerobic Digestion of Food Waste for High Rate Methane Production—A Review. J. Environ. Chem. Eng. 2014, 2, 1821–1830. [Google Scholar] [CrossRef]
  4. Yap, H.Y.; Nixon, J.D. A Multi-Criteria Analysis of Options for Energy Recovery from Municipal Solid Waste in India and the UK. Waste Manag. 2015, 46, 265–271. [Google Scholar] [CrossRef] [PubMed] [Green Version]
  5. Ntaikou, I.; Kourmentza, C.; Koutrouli, E.C.; Stamatelatou, K.; Zampraka, A.; Kornaros, M.; Lyberatos, G. Exploitation of Olive Oil Mill Wastewater for Combined Biohydrogen and Biopolymers Production. Bioresour. Technol. 2009, 100, 3724–3730. [Google Scholar] [CrossRef]
  6. Harnisch, F.; Schro¨der, U.S. From MFC to MXC: Chemical and Biological Cathodes and Their Potential for Microbial Bioelectrochemical Systems. Chem. Soc. Rev 2010, 39, 4433. [Google Scholar] [CrossRef]
  7. Dogan, E.; Dunaev, T.; Erguder, T.H.; Demirer, G.N. Performance of Leaching Bed Reactor Converting the Organic Fraction of Municipal Solid Waste to Organic Acids and Alcohols. Chemosphere 2008, 74, 797–803. [Google Scholar] [CrossRef]
  8. Wang, X.; Li, C.; Lam, C.H.; Subramanian, K.; Qin, Z.H.; Mou, J.H.; Jin, M.; Chopra, S.S.; Singh, V.; Ok, Y.S.; et al. Emerging Waste Valorisation Techniques to Moderate the Hazardous Impacts, and Their Path towards Sustainability. J. Hazard. Mater. 2022, 423, 127023. [Google Scholar] [CrossRef]
  9. Selvasembian, R.; Mal, J.; Rani, R.; Sinha, R.; Agrahari, R.; Joshua, I.; Santhiagu, A.; Pradhan, N. Recent Progress in Microbial Fuel Cells for Industrial Effluent Treatment and Energy Generation: Fundamentals to Scale-up Application and Challenges. Bioresour. Technol. 2022, 346, 126462. [Google Scholar] [CrossRef]
  10. Sriram, S.; Wong, J.W.C.; Pradhan, N. Recent Advances in Electro-Fermentation Technology: A Novel Approach towards Balanced Fermentation. Bioresour. Technol. 2022, 360, 127637. [Google Scholar] [CrossRef]
  11. Ma, C.; Liu, J.; Ye, M.; Zou, L.; Qian, G.; Li, Y.Y. Towards Utmost Bioenergy Conversion Efficiency of Food Waste: Pretreatment, Co-Digestion, and Reactor Type. Renew. Sustain. Energy Rev. 2018, 90, 700–709. [Google Scholar] [CrossRef]
  12. El-Chakhtoura, J.; El-Fadel, M.; Rao, H.A.; Li, D.; Ghanimeh, S.; Saikaly, P.E. Electricity Generation and Microbial Community Structure of Air-Cathode Microbial Fuel Cells Powered with the Organic Fraction of Municipal Solid Waste and Inoculated with Different Seeds. Biomass Bioenergy 2014, 67, 24–31. [Google Scholar] [CrossRef]
  13. Gurjar, R.; Behera, M. Treatment of Organic Fraction of Municipal Solid Waste in Bioelectrochemical Systems: A Review. J.Hazard. Toxic Radioact. Waste 2020, 24, 04020018. [Google Scholar] [CrossRef]
  14. Bridier, A.; Desmond-Le Quemener, E.; Bureau, C.; Champigneux, P.; Renvoise, L.; Audic, J.M.; Blanchet, E.; Bergel, A.; Bouchez, T. Successive Bioanode Regenerations to Maintain Efficient Current Production from Biowaste. Bioelectrochemistry 2015, 106, 133–140. [Google Scholar] [CrossRef] [Green Version]
  15. Xin, X.; Ma, Y.; Liu, Y. Electric Energy Production from Food Waste: Microbial Fuel Cells versus Anaerobic Digestion. Bioresour. Technol. 2018, 255, 281–287. [Google Scholar] [CrossRef]
  16. Yang, Z.; Nie, C.; Hou, Q.; Zhang, L.; Zhang, S.; Yu, Z.; Pei, H. Coupling a Photosynthetic Microbial Fuel Cell (PMFC) with Photobioreactors (PBRs) for Pollutant Removal and Bioenergy Recovery from Anaerobically Digested Effluent. Chem. Eng. J. 2019, 359, 402–408. [Google Scholar] [CrossRef]
  17. Tremouli, A.; Karydogiannis, I.; Pandis, P.K.; Papadopoulou, K.; Argirusis, C.; Stathopoulos, V.N.; Lyberatos, G. Bioelectricity Production from Fermentable Household Waste Extract Using a Single Chamber Microbial Fuel Cell. Energy Procedia 2019, 161, 2–9. [Google Scholar] [CrossRef]
  18. Swiatkiewicz, J.; Slezak, R.; Krzystek, L.; Ledakowicz, S. Production of Volatile Fatty Acids in a Semi-Continuous Dark Fermentation of Kitchen Waste: Impact of Organic Loading Rate and Hydraulic Retention Time. Energies 2021, 14, 2993. [Google Scholar] [CrossRef]
  19. Jung, S.; Regan, J.M. Comparison of Anode Bacterial Communities and Performance in Microbial Fuel Cells with Different Electron Donors. Appl. Microbiol. Biotechnol. 2007, 77, 393–402. [Google Scholar] [CrossRef]
  20. Gurjar, R.; Behera, M. Exploring necessity to pre-treat organic fraction of waste prior to use in an earthen MFC modified with bentonite. Water Sci. Technol. 2022, 86, 656–671. [Google Scholar] [CrossRef]
  21. Cavdar, P.; Yilmaz, E.; Tugtas, A.E.; Calli, B. Acidogenic Fermentation of Municipal Solid Waste and Its Application to Bio-Electricity Production via Microbial Fuel Cells ( MFCs ). Water Sci. Technol. 2011, 64, 789–796. [Google Scholar] [CrossRef]
  22. Li, X.M.; Cheng, K.Y.; Selvam, A.; Wong, J.W.C. Bioelectricity Production from Acidic Food Waste Leachate Using Microbial Fuel Cells: Effect of Microbial Inocula. Process Biochem. 2013, 48, 283–288. [Google Scholar] [CrossRef]
  23. Hussain, A.; Filiatrault, M.; Guiot, S.R. Acidogenic Digestion of Food Waste in a Thermophilic Leach Bed Reactor: Effect of PH and Leachate Recirculation Rate on Hydrolysis and Volatile Fatty Acid Production. Bioresour. Technol. 2017, 245, 1–9. [Google Scholar] [CrossRef]
  24. Rahimnejad, M.; Ghoreyshi, A.A.; Najafpour, G.; Jafary, T. Power Generation from Organic Substrate in Batch and Continuous Flow Microbial Fuel Cell Operations. Appl. Energy 2011, 88, 3999–4004. [Google Scholar] [CrossRef]
  25. American Public Health Association. Standard Methods for Examination of Water and Wastewater; Eaton, A.D., Clesceri, L.S., Franson, M.A.H., Rice, E.W., Greenberg, A.E., Eds.; American Public Health Association: Washington, DC, USA, 2005. [Google Scholar]
  26. Xu, S.Y.; Lam, H.P.; Karthikeyan, O.P.; Wong, J.W.C. Optimization of Food Waste Hydrolysis in Leach Bed Coupled with Methanogenic Reactor: Effect of PH and Bulking Agent. Bioresour. Technol. 2011, 102, 3702–3708. [Google Scholar] [CrossRef]
  27. Logan, B.E. Microbial Fuel Cells; John Wiley & Sons: Hoboken, NJ, USA, 2008; ISBN 9780470239483. [Google Scholar]
  28. Behera, M.; Jana, P.S.; Ghangrekar, M.M. Performance Evaluation of Low Cost Microbial Fuel Cell Fabricated Using Earthen Pot with Biotic and Abiotic Cathode. Bioresour. Technol. 2010, 101, 1183–1189. [Google Scholar] [CrossRef]
  29. Özkaya, B.; Cetinkaya, A.Y.; Cakmakci, M.; Karadaǧ, D.; Sahinkaya, E. Electricity Generation from Young Landfill Leachate in a Microbial Fuel Cell with a New Electrode Material. Bioprocess Biosyst. Eng. 2013, 36, 399–405. [Google Scholar] [CrossRef]
  30. Choi, J.; Ahn, Y. Enhanced Bioelectricity Harvesting in Microbial Fuel Cells Treating Food Waste Leachate Produced from Biohydrogen Fermentation. Bioresour. Technol. 2015, 183, 53–60. [Google Scholar] [CrossRef]
  31. Gurjar, R.; Shende, A.D.; Pophali, G.R. Treatment of Low Strength Wastewater Using Compact Submerged Aerobic Fixed Film (SAFF) Reactor Filled with High Specific Surface Area Synthetic Media. Water Sci. Technol. 2019, 80, 737–746. [Google Scholar] [CrossRef]
  32. Mohan, S.V.; Chandrasekhar, K. Self-Induced Bio-Potential and Graphite Electron Accepting Conditions Enhances Petroleum Sludge Degradation in Bio-Electrochemical System with Simultaneous Power Generation. Bioresour. Technol. 2011, 102, 9532–9541. [Google Scholar] [CrossRef]
  33. Akman, D.; Cirik, K.; Ozdemir, S.; Ozkaya, B.; Cinar, O. Bioelectricity Generation in Continuously-Fed Microbial Fuel Cell: Effects of Anode Electrode Material and Hydraulic Retention Time. Bioresour. Technol. 2013, 149, 459–464. [Google Scholar] [CrossRef]
  34. Pocaznoi, D.; Calmet, A.; Etcheverry, L.; Erable, B.; Bergel, A. Stainless Steel Is a Promising Electrode Material for Anodes of Microbial Fuel Cells. Energy Environ. Sci. 2012, 5, 9645–9652. [Google Scholar] [CrossRef] [Green Version]
  35. Muthudineshkumar, R.; Anand, R. Anaerobic Digestion of Various Feedstocks for Second-Generation Biofuel Production. In Advances in Eco-Fuels for a Sustainable Environment; Woodhead Publishing: Sawston, UK, 2019; pp. 157–185. [Google Scholar] [CrossRef]
  36. Aelterman, P.; Freguia, S.; Keller, J.; Verstraete, W.; Rabaey, K. The Anode Potential Regulates Bacterial Activity in Microbial Fuel Cells. Appl. Microbiol. Biotechnol. 2008, 78, 409–418. [Google Scholar] [CrossRef] [PubMed]
  37. Aelterman, P.; Rabaey, K.; Pham, H.T.; Boon, N.; Verstraete, W. Continuous Electricity Generation at High Voltages and Currents Using Stacked Microbial Fuel Cells. Environ. Sci. Technol. 2006, 40, 3388–3394. [Google Scholar] [CrossRef]
  38. Durruty, I.; Bonanni, P.S.; González, J.F.; Busalmen, J.P. Evaluation of Potato-Processing Wastewater Treatment in a Microbial Fuel Cell. Bioresour. Technol. 2011, 105, 81–87. [Google Scholar] [CrossRef] [PubMed]
  39. Myers, R.; Montgomery, D.C. Response Surface Methodology; John Wiley & Sons: New York, NY, USA, 2002. [Google Scholar]
  40. You, S.J.; Zhao, Q.L.; Jiang, J.Q.; Zhang, J.N.; Zhao, S.Q. Sustainable Approach for Leachate Treatment: Electricity Generation in Microbial Fuel Cell. J. Environ. Sci. Health Part A 2006, 41, 2721–2734. [Google Scholar] [CrossRef] [PubMed]
  41. Gurjar, R.; Behera, M. Integrating Operating Conditions to Develop a Neural Network for Predicting Organics Removal and Power Density in an Earthen Microbial Fuel Cell Treating Leachate. Biofuels 2022, 1–10. [Google Scholar] [CrossRef]
  42. Schröder, U. Anodic Electron Transfer Mechanisms in Microbial Fuel Cells and Their Energy Efficiency. Phys. Chem. Chem. Phys. 2007, 9, 2619–2629. [Google Scholar] [CrossRef]
  43. Sleutels, T.H.J.A.; Darus, L.; Hamelers, H.V.M.; Buisman, C.J.N. Effect of Operational Parameters on Coulombic Efficiency in Bioelectrochemical Systems. Bioresour. Technol. 2011, 102, 11172–11176. [Google Scholar] [CrossRef]
Figure 1. The VFA consumption profiles for (a) R7, (b) R16, (c) R3, and (d) R5 with individual VFA concentration in influent and effluent samples.
Fermentation 08 00544 g001aFermentation 08 00544 g001b
Figure 2. The VFA consumption profile for (a) R10, (b) R13, (c) R14, and (d) R6, with individual VFA concentration in influent and effluent samples.
Fermentation 08 00544 g002
Figure 3. Cyclic voltammetry graphs for selected runs.
Fermentation 08 00544 g003
Figure 4. The impedance studies for selected experimental runs along with validation runs (a) Randles and (b) Randles + Warburg circuits.
Fermentation 08 00544 g004
Figure 5. The 3D response surface curves for COD removal (a), PD (b), and CE (c) for two factors, COD and HRT with respect to AESA (24 cm2).
Fermentation 08 00544 g005
Figure 6. The performance of optimized runs for COD, TC and VFA removal.
Fermentation 08 00544 g006
Table 1. An optimization run for MFC.
Run NoCOD (g/L)HRT (h)AESA 1 (cm2)OLR (Kg/m3·d)CODRE 3 (%)VFARE 2 (%)PD (W/m3)CE (%)
R13.020163.6056.1 ± 3.175.5 ± 4.80.197 ± 0.031.48 ± 0.18
R21.512323.0069.4 ± 4.954.7 ± 4.30.214 ± 0.041.72 ± 0.27
R33.020323.6059.5 ± 3.4 52.4 ± 8.70.252 ± 0.061.61 ± 0.26
R42.31637.53.3867.7 ± 3.663.8 ± 3.60.232 ± 0.041.46 ± 0.18
R51.520321.8079.5 ± 3.868.7 ± 3.50.169 ± 0.052.04 ± 0.23
R61.512163.0062.9 ± 4.850.9 ± 3.10.181 ± 0.041.24 ± 0.24
R71.016321.4881.3 ± 4.144.8 ± 3.20.134 ± 0.042.59 ± 0.36
R83.012326.0057.4 ± 4.674.1 ± 6.30.251 ± 0.011.18 ± 0.04
R91.520161.8072.4 ± 4.966.5 ± 4.30.210 ± 0.032.38 ± 0.13
R103.012166.0043.8 ± 4.668.6 ± 5.70.178 ± 0.050.96 ± 0.16
R112.316243.3863.7 ± 3.675.3 ± 4.60.217 ± 0.041.34 ± 0.12
R122.316243.3868.6 ± 3.677.4 ± 6.40.227 ± 0.041.12 ± 0.18
R132.322.7242.3873.3 ± 3.973.8 ± 4.80.222 ± 0.031.79 ± 0.06
R142.39.3245.8269.7 ± 3.270.0 ± 1.60.220 ± 0.050.80 ± 0.15
R152.31610.63.3856.8 ± 2.974.1 ± 4.50.202 ± 0.071.40 ± 0.15
R163.516325.2743.9 ± 4.5 65.5 ± 7.10.246 ± 0.041.66 ± 0.18
R172.316243.3864.8 ± 2.271.5 ± 2.10.206 ± 0.021.43 ± 0.12
VR1 41.622.737.51.6775.6 ± 4.358.6 ± 5.90.204 ± 0.032.50 ± 0.26
VR21.014.637.51.6583.7 ± 3.660.9 ± 3.30.196 ± 0.032.09 ± 0.21
VR31.217.737.51.6778.8 ± 3.257.5 ± 3.10.224 ± 0.022.62 ± 0.33
1 AESA = Anode electrode surface area. 2 VFA = Volatile fatty acid. 3 RE = Removal efficiency. 4 VR = Validation Run.
Publisher’s Note: MDPI stays neutral with regard to jurisdictional claims in published maps and institutional affiliations.

