Article

Mixed Solid-State Fermentation of Okara and Copra Meal by Probiotics with Non-Starch Polysaccharide Enzymes and Its Effects on the Growth Performance and Ileal Microbiota in Broilers

by
Felix Shih-Hsiang Hsiao
1,†,
Clara Ajeng Artdita
2,3,†,
Shih-Yao Lin
1,
Yu-Hsiang Yu
1,* and
Yeong-Hsiang Cheng
1,*
1
Department of Biotechnology and Animal Science, National I-Lan University, No. 1, Sec. 1, Shennong Rd., Yilan City, Yilan County 260007, Taiwan
2
Department of Animal Science and Biotechnology, Tunghai University, No. 1727, Sec. 4, Taiwan Boulevard, Xitun District, Taichung City 407224, Taiwan
3
Department of Bioresources Technology and Veterinary, Vocational College, Universitas Gadjah Mada, Yacaranda Street Sekip Unit II, Depok, Sleman, Yogyakarta 55281, Indonesia
*
Authors to whom correspondence should be addressed.
These authors contributed equally to this work.
Fermentation 2022, 8(10), 478; https://doi.org/10.3390/fermentation8100478
Submission received: 1 August 2022 / Revised: 12 September 2022 / Accepted: 19 September 2022 / Published: 23 September 2022
(This article belongs to the Section Industrial Fermentation)

Abstract

:
With the global shortage of feed ingredients, the use of agricultural by-products has become an alternative to animal feed. Okara, a by-product of soymilk and tofu processing, is high in nutrients but contains non-starch polysaccharides (NSP) and has a high-water content, which are disadvantages in animal feed. Herein, we mixed okara and copra meal (CM) with probiotics (Lactobacillus species and Clostridium butyricum) and NSP enzymes (NSPases) for solid-state fermentation (SSF) to enhance okara feed value; the optimal parameters of fermented okara and CM (FOCM) and their effects on broiler growth performance and ileal microbiota were investigated. The result showed that FOCM in combination with NSPases and probiotics at 55% of the initial moisture content and 60 h fermentation time at 37 °C were able to degrade NSP and reduce sugar content. After fermentation, the total viable counts, lactic acid, and butyric acid contents in the FOCM were 8.6 log CFU/g, 3.7%, and 17.15%, respectively. During the fifth week of the feeding period and over the whole feeding period, broilers fed with 1.25% and 2.5% FOCM had a better feed conversion ratio (p < 0.05); both groups increased the duodenal villus length (p < 0.05). Further microbiome analysis suggested that FOCM significantly increased the abundance of the phylum Firmicutes and reduced the abundance of Escherichia-Shigella in the ileal content (p < 0.05). Collectively, supplementation of probiotics and enzymes during SSF was found to be effective in enhancing the nutritional value of FOCM. Moreover, dietary supplementation of FOCM improved the broiler feed conversion ratio, gut morphology, and ileal microbiota.

1. Introduction

The poultry sector is an industry that depends on maximum efficiency and minimum profit [1]. Significantly, feed is a restrictive factor for the development of the poultry industry, mainly due to the high cost of feeds, which impact industry profits [2]. In addition, the conventional feed ingredients corn and soybeans are now used for human food and bioenergy, leading to feed–food–fuel competition [2,3]. This situation has led most farmers to try raising their own grazing animals to reduce feed cost [4,5,6] or to supplemented feed by enriching or manipulating nutrients to improve feed deficiencies [6,7]. Nowadays, studies are being carried out to assess the potential of alternative feedstuffs from low-cost but highly nutritious agricultural waste required for poultry [5,8,9,10,11].
Okara, or soybean curd residue, is an agro-industrial by-product from soybean extract produced during the processing of soy milk and tofu [12,13]. Due to the high moisture content (about 80%), okara is highly perishable and moldy in normal environments [14,15], it is often discarded and turned into waste. Although studies have shown that okara is high in crude fiber (35–55%), protein (30%), fat (10–11%) [9,16], polyunsaturated fatty acid (56% of total fat), and enriched isoflavone [9], the application of okara in poultry feed is still limited due to several anti-nutritional factors, including phytates, tannins, trypsin inhibitors, and oligosaccharides [17]. In addition, the carbohydrates contained in okara are considered to be generally unavailable non-starch polysaccharide (NSP) fiber, which are mainly composed of mannan, galactomannan, and cellulose [18,19,20]; intact NSP present in the poultry digestive tract is known to inhibit the digestive process and interfere with intestinal balance, leading to problems associated with wet dropping (wet feces) and even intestinal diseases [21].
Copra meal (CM), another readily available agro-industrial by-product derived from coconut oil meals [10], has similar nutritional characteristics to okara (rich in protein (15–25%) and carbohydrate (60%)). With proper feed technology, CM can be used to reduce the cost of poultry feed [8,22]. However, due to the low content of amino acids (lysine and methionine), the use of CM in poultry diets is still rare [23]. Similar to okara, CM contains a high-water content and harbors indigestible NSP [19]. However, the addition of CM for broiler feed has some benefits since it contains beta-mannan as prebiotics and as mycotoxin binder [24].
Many studies have attempted to improve the utilization rate and feed value of agro-industrial by-products through the addition of amino acids [5,25], enzymes [26], physical modification [27], and microbial biotransformation; solid-state fermentation (SSF) is one of the strategies. SSF refers to a fermentation process in which microbial growth and metabolic activities take place in a moist solid substrate with little flowing water [28,29]. The most commonly used solid substrates are cereals (such as rice, wheat, barley, and corn), legume seeds, wheat bran, lignocellulosic raw materials, and various animal or plant materials. These grains are insoluble or sparingly soluble in water, but most are inexpensive and readily available [30,31]. In the past, the main microorganisms used in SSF were fungi, which were considered to have optimal activity in a matrix with low moisture substrates. More recently, many bacteria and yeasts that require liquid media have also been used for SSF, showing the advantages of SSF over liquid-state fermentation [32,33]. Specifically, bacterial fermentation results in improved nutritional factors, including increasing the number of small-sized peptides and increasing the content of essential and non-essential amino acids [34].
The gut microbiota of broilers plays an important role in the development and function of the digestive system, including the ability to ferment and utilize dietary fiber to enhance the immune system [35]. As broilers grow, the competition for gut microbial colonization gradually slows and the bacterial transition phase stabilizes, thereby affecting the abundance of gut microbiota [36,37]. In addition, the development of intestinal epithelial cells, nutrient digestion, and improvement of intestinal mucosal integrity enable poultry to improve the transformation efficiency and growth performance after energy harvesting [37]. Lactobacillus species (Lactobacillus acidophilus, Lactobacillus delbrueckii, and Lactobacillus salivarius) [38,39] and Clostridium butyricum [40] are known to ferment okara and improve the nutritional status and growth performance of animals. Specifically, Lactobacillus species are capable of producing bacteriocin and short-chain fatty acids (lactate and butyrate), which help lower pH and maintain acidity in the animal gut [41]. Such bacteria are bile-resistant because they have the bile salt hydrolase (BSH) enzyme that helps hydrolyze bound bile and reduce its toxic effects [42]. Although there are no reports of using Clostridium butyricum alone to ferment okara, Clostridium butyricum is commonly used in soybean meal fermentation along with Lactobacillus [43,44,45]. Compared to other probiotics, Clostridium butyricum is heat-resistant and can be stored in dry form at room temperature through the pelleting process of feed products [46]. In addition, Clostridium butyricum is resistant to low pH and high bile concentrations; hence, it can reach and colonize the small intestine after ingestion in broilers.
Previous studies have investigated whether SSF can improve the nutritional quality of animal feed by increasing nutrient bioavailability and reducing anti-nutritional factors in single-feed ingredients [47], such as palm kernel cake [48] and rapeseed meal [49]. The present study was conducted to investigate the ability of SSF in mixed ingredients, okara, and CM. The combination of three homologous Lactobacillus species (L. acidophilus, L. delbrueckii, and L. salivarius) and C. butyricum were used to ferment okara and CM, and NSPases were used to reduce the NSP and anti-nutritional factors in the fermentation matrix to help the digestion and absorption of broilers. Therefore, this study investigated the optimal parameters of fermented okara and CM (FOCM) with probiotics and NSPases and evaluated its effect on broilers. The results provide valuable information regarding the fermentation conditions of mixed okara and CM by probiotics and enzymes. These conditions are suitable for use on an industrial scale to mass-produce functional fermented products.

2. Materials and Methods

2.1. Microorganisms and Culture Conditions

Clostridium butyricum (C. butyricum; MIYAIRI 588) was purchased from Miyarisan Pharmaceutical (Tokyo, Japan). Lactobacillus acidophilus (L. acidophilus; BCRC 10695), Lactobacillus delbrueckii (L. delbrueckii; BCRC 10696), and Lactobacillus salivarius (L. salivarius; BCRC12574) were purchased from the Food Industry Research and Development Institute (Hsinchu, Taiwan). After thawing, C. butyricum was inoculated into an Erlenmeyer flask containing brain-heart-infusion broth (BHI; Sigma-Aldrich, St. Louis, MO, USA) and incubated at 37 °C for 48 h with shaking. Lactobacillus acidophilus, L. delbrueckii, and L. salivarius were inoculated into an Erlenmeyer flask containing de Man, Rogosa, and Sharpe broth (MRS; Sigma-Aldrich) at 37 °C for 24 h with shaking.

2.2. Solid-State Fermentation (SSF)

Okara was provided by Taiwan Jiaziyuan Stinky Tofu Factory and CM is imported from the Philippines. The procured substrates, including okara and CM, were mixed with water to the required relative moisture content in a space bag. The substrate mixtures were then inoculated with 3% (v/w) inoculums containing L. acidophilus, L. delbrueckii, L. salivarius, and C. butyricum (so that each bacterial solution was quantified beforehand as 1.0 × 10⁸ CFU/mL), and carefully mixed under sterile conditions and incubated in 37 °C. To investigate the effects of initial moisture content and fermentation duration on SSF of mixed okara and CM, fermentations were performed with different initial moisture contents (50, 55 and 60%; w/w) and different fermentation durations (48, 60 and 72 h) at 37 °C.
The optimal initial moisture content (55%) and fermentation duration (60 h) of mixed okara and CM with the SSF method were further employed to reveal the effects of exogenous NSPases (VemoZyme®) on FOCM. The experimental groups were divided into (1) mixed okara and copra meal (control, CTRL), (2) mixed okara and copra meal plus exogenous NSPases (NSP enzyme), (3) mixed okara and copra meal plus probiotics (Probiotics), (4) mixed okara and copra meal plus probiotics and NSPases (mixed). All experiments were incubated at 37 °C and performed in triplicate. The FOCM were then dried at 50 °C for 24 h, homogenized through mechanical agitation, and stored at 4 °C prior to further analysis.

2.3. Determination of Total Viable Count

To determine total viable count of bacteria, 1 g of FOCM was diluted with 9 mL of 0.85% NaCl, shaken for 30 min, and then placed in a selective media for microbial enumeration. The MRS agar was used to measure all the Lactobacillus species; BHI agar was used to measure C. butyricum. The diluent was spread-plated and placed in an anaerobic bag in a 37 °C incubator for 24 h. The count of bacterial colonies was statistically analyzed and expressed as colony-forming units per gram (CFU/g).

2.4. Determination of Moisture, Neutral Detergent Fiber, Residual Reducing Sugars, Lactic Acid, and Butyric Acid Content

The moisture content of the FOCM was measured with the aid of a crucible under sequent drying conditions of 65 °C for 16 h and 105 °C for an hour. The content of neutral detergent fiber (NDF) was measured using neutral detergent. The content of reducing sugar was analyzed by incubating 1 g of FOCM in a 50 °C water bath for 30 min, and the reducing sugars in the supernatant were analyzed using the dinitrosalicylic acid method. The content of lactic acid and butyric acid was determined by high-performance liquid chromatography (HPLC). The FOCM was incubated at 50 °C in a water bath and ultrasonically shaken for 20 min. The homogenate was mixed in water and then filtered with a 0.22 μm filter membrane. The extract was then analyzed for lactic acid and butyric acid content using HPLC and compared with a standard. Lactic acid (Sigma-Aldrich) and butyric acid (Sigma-Aldrich) standards were prepared and analyzed a minimum of three times. By using a C18 column, which had the dimensions of 5 μm inner diameter 4.6 mm × 25 cm long, the lactic acid mobile phase was 0.01 mol/L phosphoric acid solution, and the butyric acid mobile phase was 80% acetonitrile and 0.02% phosphoric acid. HPLC analysis of lactic acid and butyric acid was performed at the same flow rate of 1.0 mL/min and wavelengths of 210 nm and 206 nm. The concentration of lactic acid and butyric acid were determined based on the slope of the standard curve.

2.5. Sodium Dodecyl Sulfate-Polyacrylamide Gel Electrophoresis

The extracted crude protein from FOCM was quantified using the Bradford method, with bovine serum albumin used as the protein standard. For the determination of soy globulin contents, total proteins from pre-fermented and FOCM treated with sodium dodecyl sulfate (SDS) were separated using polyacrylamide gel electrophoresis (PAGE), and the soy globulins in the gel were visualized using Coomassie Brilliant Blue R-250 (Sigma-Aldrich) staining.

2.6. Animal Study

The FOCM was prepared as aforementioned above, and the optimal initial moisture content was 55% and fermentation duration was 60 h. The animal protocol was approved by the Institutional Animal Care and Use Committee of the National Ilan University (110-8). A total of 96 1-day-old unsexed broiler chicks (Arbor Acres) obtained from a local commercial hatchery were randomly assigned to one of four treatments in a completely randomized design. Each treatment was assigned to six replicate cages with four birds per cage. Broilers were reared in stainless-steel cages (89 cm × 56.5 cm × 60 cm). The experimental diets were (1) a basal diet without FOCM as control (control, CTRL), (2) a basal diet plus 1.25% FOCM (FOCM1.25), (3) a basal diet plus 2.5% FOCM (FOCM2.5), (4) a basal diet plus 5% FOCM (FOCM5.0). Broilers received the test diet from 1 to 35 days of age. The feeding program had two phases, spanning days 1–20 (starter diet) and 21–35 (finisher diet). No coccidiostats and antibiotics were included in the diets. The diets were formulated to meet or exceed the requirements of the birds according to the National Research Council recommendations (NRC, Nutrient Requirements for Poultry, 1994, Table 1). Broilers were fed and watered ad libitum throughout the experiment. The mortality of broilers was monitored daily. On days 4 and 14 of the experiment, Newcastle disease (ND) and infectious bronchitis (IB) vaccines were administered through the eyes and nose. Broiler growth performance, including average daily gain (ADG), average daily feed intake (ADFI), feed conversion ratio (FCR), body weight, and feed intake were measured weekly. One broiler per replicate was sacrificed on days 21 and 35, and their blood and ileal contents were collected for subsequent analysis.

2.7. Blood Chemistry and Antibody Titer Analysis

The blood chemistry and antibody titer analysis were followed as described by previous studies [50,51]. For blood chemistry analysis, blood samples from broilers (one bird per replicate, six replicates were used per group (n = 6)) were collected through heart puncture on the 21st and 35th day of age and separated by centrifugation at 1500 g for 10 min. An automatic biochemical analyzer (TOSHIBA TBA-80FR NEO2, Tokyo, Japan) to perform a total of 6 serum biochemical analyses, including alanine aminotransferase (ALT), aspartate aminotransferase (AST), total protein (TP), albumin (ALB), and glucose (GLU).
To analyze the antibody titer, blood samples were collected through cardiac puncture and centrifuged at 1500 g for 10 min. Serum was collected and stored at 20 °C. To evaluate the effect of feeding FOCM on the host’s immune response to ND and IB vaccines, we also cooperated with the Poultry Health Center of the Central Animal Husbandry Association to detect ND and IB titer antibody. The detection method of ND titer antibody used the hemagglutinin inhibition (HI) test; as has been noted, the HI test is a highly accurate measure of a herd’s immunological health and resistance to ND, particularly for evaluating the protective response to ND vaccination [52]. The IB titer antibody was detected by enzyme-linked immunosorbent assay (ELISA) kit (BioChek, Gouda, The Netherlands).

2.8. Intestinal Morphology Analysis

On the 21st and 35th day of age, one bird per replicate was randomly chosen (six replicates were used per group (n = 6)) and sacrificed with carbon dioxide, and three sections of duodenum, jejunum, and ileum were taken, as previously described [53]. After washing the chyme on the intestinal mucosal surface with ice-cold PBS solution, this sample was put it in 10% formalin solution and fixed at room temperature for a week. Subsequently, using paraffin embedding procedures, fixed intestine samples (duodenum, jejunum, and ileum) were prepared. Three cross-sections from each sample were sectioned at a thickness of 5 μm, mounted on a glass slide, and stained with hematoxylin and eosin. Villus height and crypt depth were measured randomly for 20 villi per bird using a micrometer using an optical microscope (Olympus CKX41, Tokyo, Japan).

2.9. Bacterial Diversity Analysis

A 21-day-old broiler was randomly chosen from every two cages based on the average of the cage then euthanized by carbon dioxide inhalation, and a five-centimeter ileum fragment was taken for microbiota analysis (three replicates were used per group (n = 3)). The bacterial deoxyribonucleic acid (DNA) was extracted using the QIAmp Fast DNA Stool Mini kit (QIAGEN, Hilden, Germany), according to manufacturer’s instructions. The v3-v4 hypervariable regions of the bacterial 16S rRNA gene was performed by polymerase chain reaction (PCR) using specific 341F-805R primer (5′-CCTACGGGNGGCWGCAG-3′ and 5′-GACTACHVGGGTATCTAATCC-3′). Sequencing was conducted at a read length of 300 nucleotides by next-generation sequencing platform (Illumina, San Diego, CA, USA). For data sequence processing, the QIIME 2 software package (version 2017.4, GitHub, San Francisco, CA, USA) was used. High-quality reads were selected, and all of the effective reads from all samples were clustered into operational taxonomic units (OTUs) based on 97% sequence similarity using the UCHIME (version 4.2, GitHub) and mothur software (version 1.39.5, GitHub). In addition, the QIIME 2 software (version 2017.4, GitHub) and the naïve Bayesian classification approach were used to access alpha diversity (richness and evenness) and phylogenetic assignment, respectively. Furthermore, the R packages were used to display the differences in microbiota between groups using principal component analysis (PCA) and principal coordinate analysis (PCoA) based on the unweighted and weighted UniFrac distance matrices (version 3.5.0 and version 1.7.13, GitHub).

2.10. Statistical Analysis

All experimental data were analyzed by ANOVA using the General Linear Model (GLM) program of SAS (SAS Institute, Cary, NC, USA). Significant differences between each treatment were measured using Duncan’s new multiple range test. Values of p < 0.05 were considered statistically significant.

3. Results

3.1. Effect of Different Initial Moisture Content on Lactobacillus Species and C. butyricum Growth in Solid-State Fermentation of Okara and Copra Meal

In the SSF method, moisture is a critical point for bacterial growth [53]. We first investigated the effect of different initial moisture contents (50%, 55%, and 60%) on the growth of the probiotics Lactobacillus species (L. acidophilus, L. delbrueckii, L. salivarius) and C. butyricum in the SSF of mixed okara and CM fermentation; the fermentation time duration was at 48, 60, and 72 h. Although the highest Lactobacillus growth was found at 50% initial moisture for 60 h of fermentation, bacterial growth under this condition was not significantly different compared with 55% initial moisture. Similarly, the effect of these three initial moisture contents and the fermentation time on C. butyricum growth with the SSF method was also observed (Figure 1b). Compared with the 60% and 50% initial moisture content groups, the 55% group had a trend of higher C. butyricum growth at 60 h of fermentation time. The numbers of both bacteria decreased slightly after 72 h. Since 55% initial moisture and 60 h fermentation duration conditions were shown as beneficial for Lactobacillus species and C. butyricum growth, these conditions were used in subsequent experiments to further investigate the effect of okara and CM fermentation by the SSF method.

3.2. Effect of NSPases Supplementation with Mixed Probiotics on the Growth of Lactobacillus, Water Contents, and Neutral Detergent Fiber Contents in Solid-State Fermentation of Okara and Copra Meal

We further tested whether the exogenous NSPases supplementation with mixed probiotics had an impact on FOCM. Figure 2a shows the total viable bacteria count between FOCM plus probiotics without NSPases (the probiotics group) and FOCM plus both probiotics and NSPases (the mix group). Compared to the probiotics group, the supplementation of NSPases (the mix group) did not significantly affect the growth of bacteria. A similar result was found for the effect of NSPases supplementation on the water content of SSF; the NSPases supplementation had no impact amongst groups (Figure 2b). Moreover, on investigation of NDF (Figure 2c), this exogenous enzyme was revealed to reduce the amount of NDF in the NSP enzyme group compared to the CTRL group and significantly decreased NDF in the mix group compared to the others (p < 0.05). The NDF of FOCM was further decreased when probiotics and exogenous NSP enzymes were added to the SSF simultaneously (Figure 2c).

3.3. Effect of NSPases Supplementation with Mixed Probiotics on the Reducing Sugar Contents and Lactic and Butyric Acid Contents in Solid-State Fermentation of Okara and Copra Meal

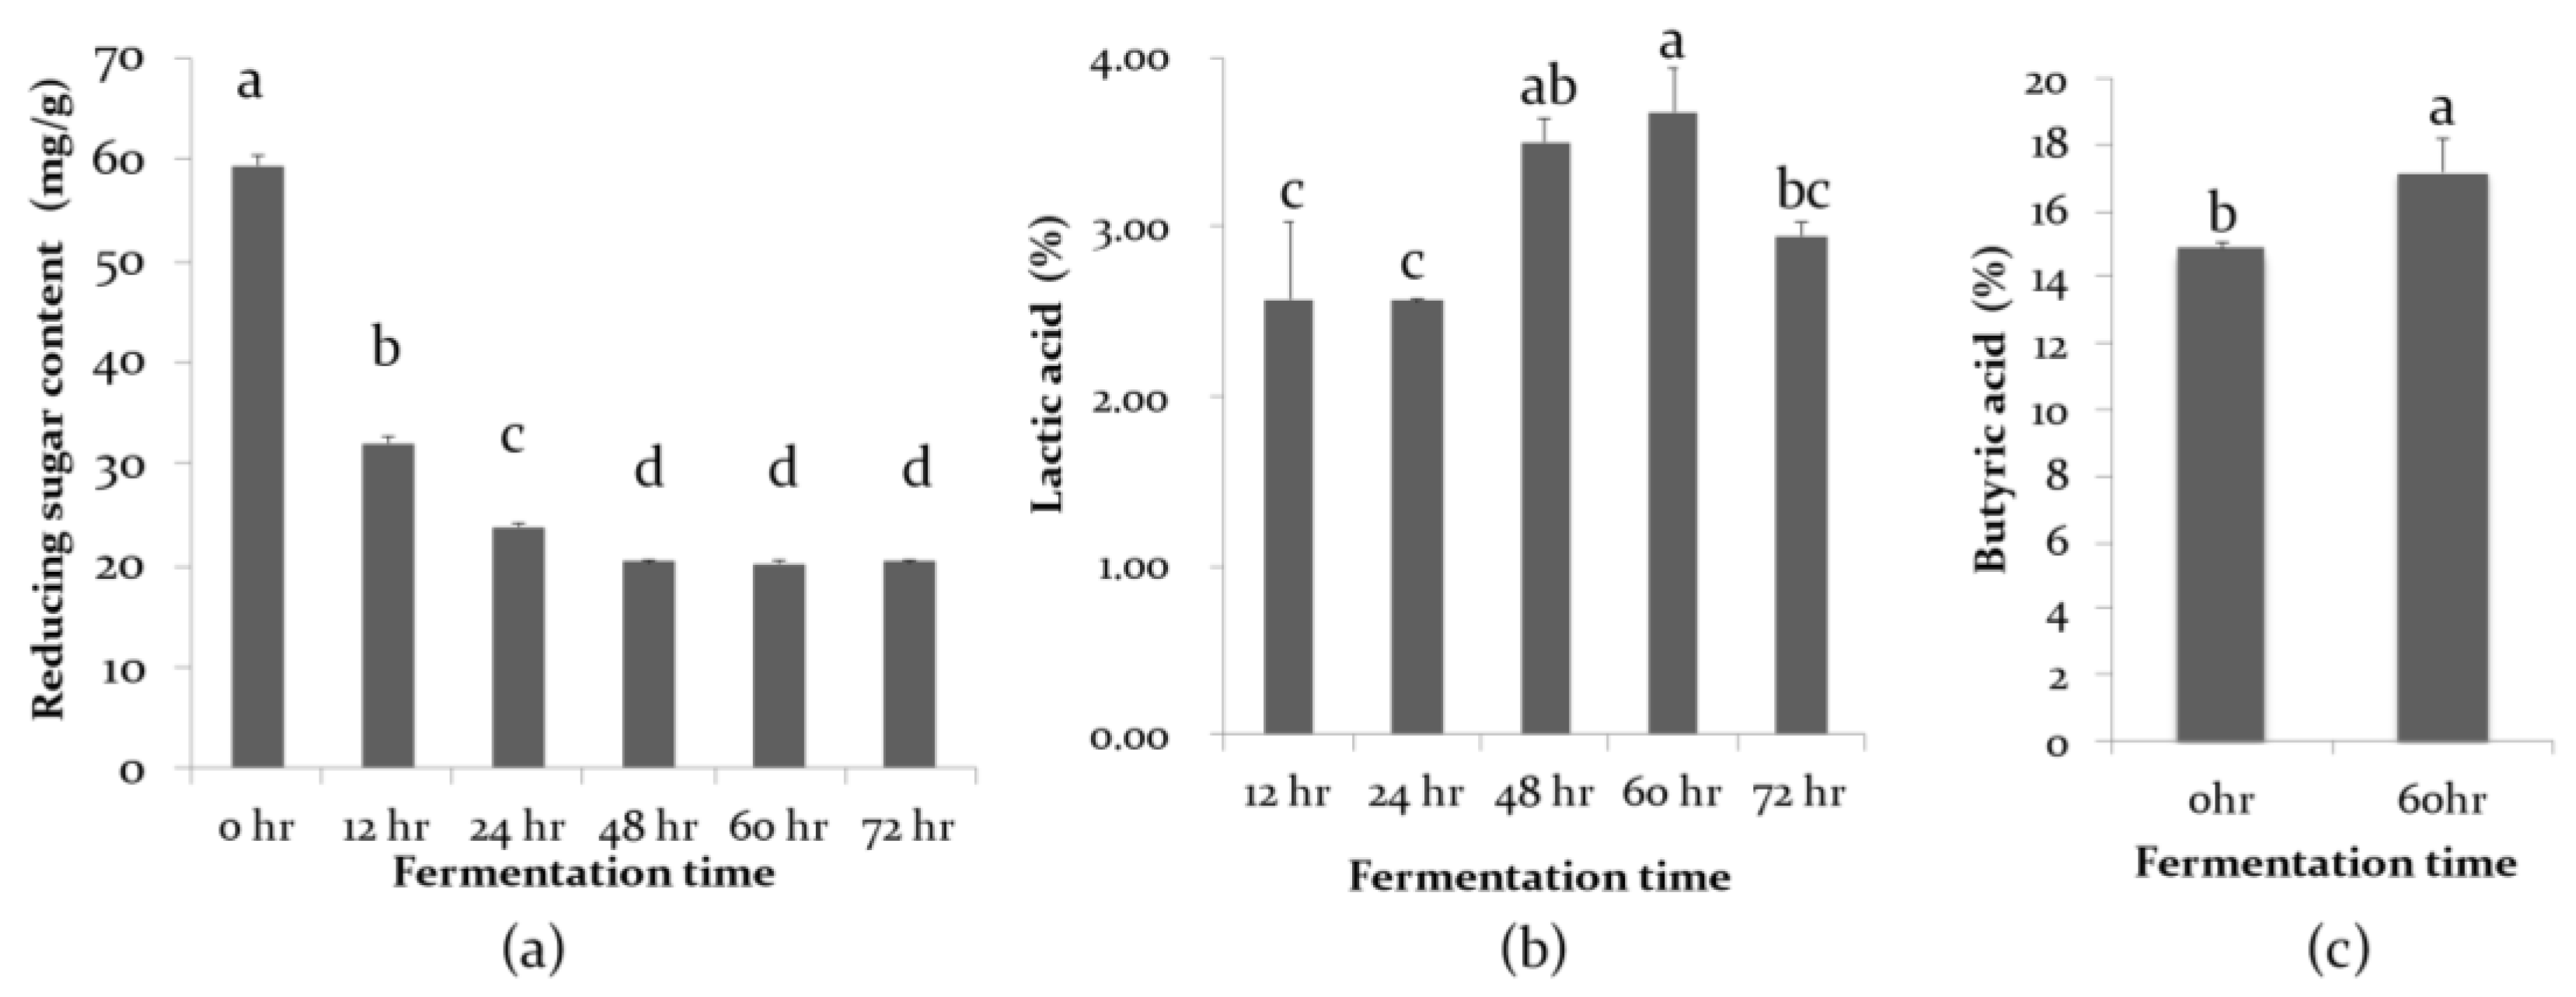
The NSP enzyme supplementation, in combination with mixed probiotics, with an optimal moisture content of 55% and the additional increase in fermentation time, significantly reduced the FOCM sugar content from 59 mg/g to the lowest level of 20 mg/g at the 48th hour of fermentation (Figure 3a). In addition, the lactic acid level of FOCM was significantly increased with the supplementation of NSPases in the SSF method and reached a peak of 3.7% at 60 h of fermentation (Figure 3b). Consistently, the butyric acid levels of FOCM were positively correlated with the supplementation of NSPases, which reached 17.15% at 60 h of fermentation (Figure 3c).
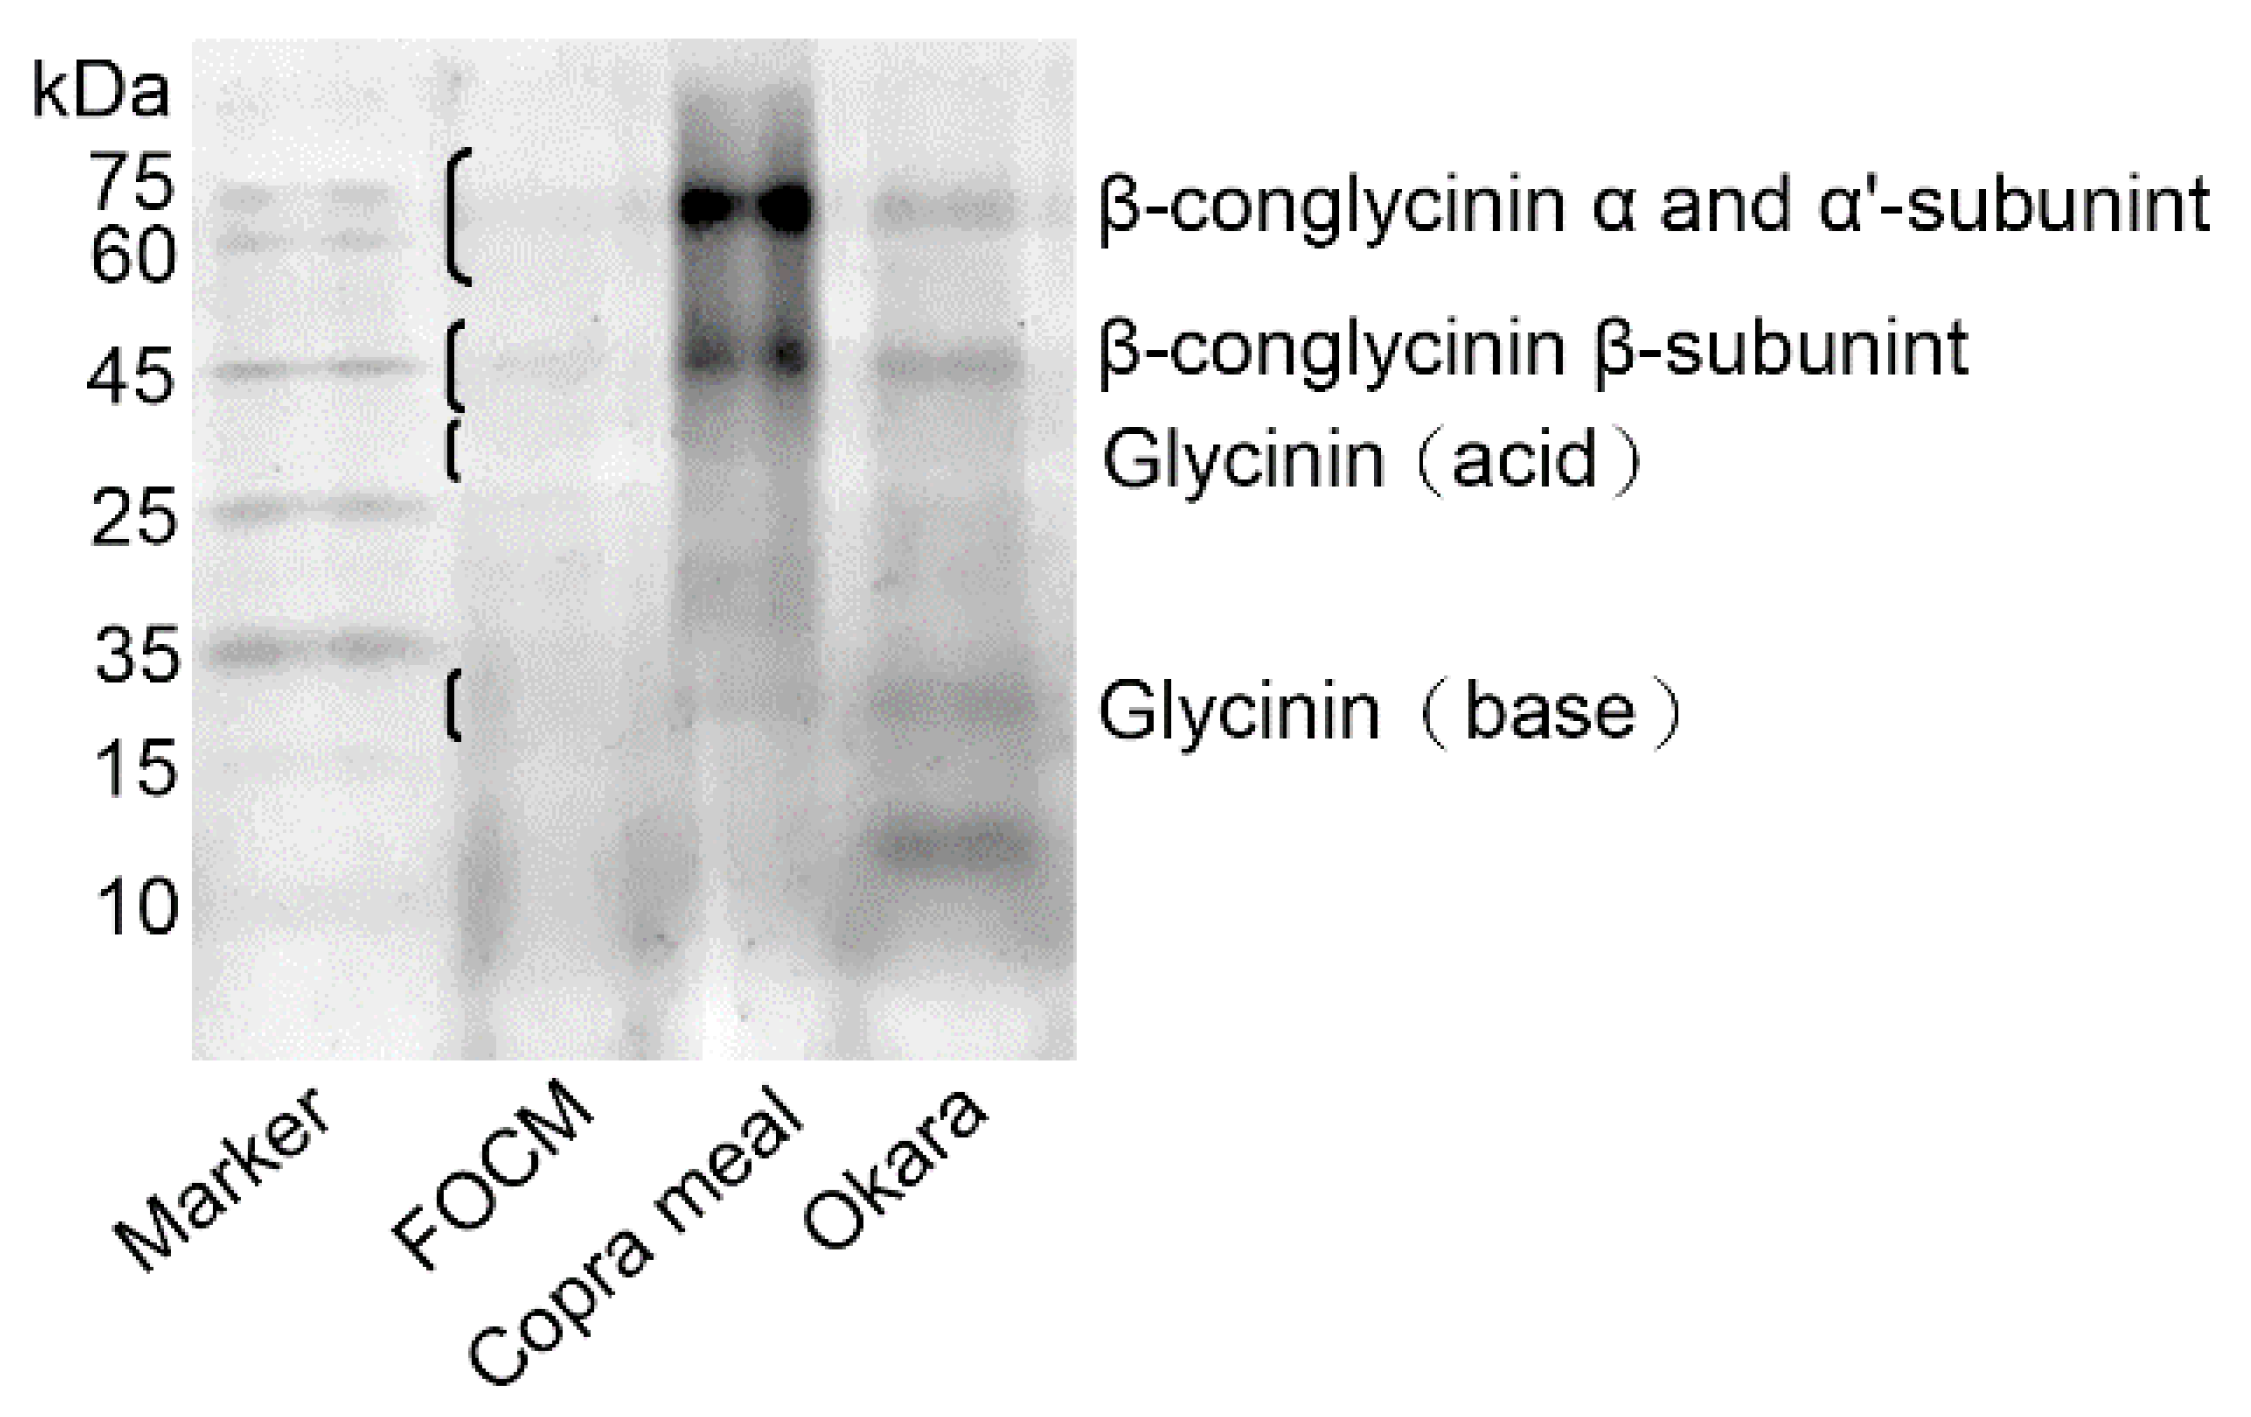
We then examined whether NSPases supplementation in combination with probiotics could affect the degradation of soybean globulins in SSF (FOCM). The results showed that this combination could further degrade the β-conglycinin content of mixed okara and CM fermentation in SSF (Figure 4).

3.4. Effects of Fermented Okara and Copra Meal on the Growth Performance and Blood Biochemical Parameters of Broilers

The broilers were healthy during the experimental period. No significant difference was observed in body weight and average daily weight gain amongst the groups (Table 2). At 14–21 days, as shown in Table 3, the FOCM1.25 increased the feed intake of the broilers compared to the CTRL group (p < 0.05). Furthermore, the FOCM1.25 and FOCM2.5 groups had a better feed conversion ratio than the CTRL group at the fifth week of the feeding period (p < 0.05) and during the whole feeding stage period (p < 0.05).

3.5. Effects of Fermented Okara and Copra Meal on Blood Biochemical Parameters and Antibody Titers of Broilers

Since the fermented product could influence the blood protein, we then examined the FOCM effect on selected biochemical parameters from the broiler blood samples (Table 4). At 21 days of age, no significant difference was observed in the blood biochemical parameters amongst the groups (Table 4). However, at 35 days of age, total protein (TP) and albumin (ALB) were significantly higher in the FOCM5.0 group than in the FOCM1.25 group (p < 0.05), while there was no significant difference in blood glucose (GLU), aspartate aminotransferase (AST) and alanine aminotransferase (ALT).
Table 5 showed the effects of different experimental diets on ND and IB antibody titers in the broiler’s serum. The results showed that there was no significant difference amongst the groups in the early and late feeding stages. Therefore, FOCM addition to the diet did not affect the host immune response to ND and IB vaccine effectiveness.

3.6. Effects of Fermented Okara and Copra Meal on Intestinal Morphology of Broilers

Table 6 shows the morphological results of the duodenum, jejunum, and ileum at 21-and 35-days of age with the addition of different concentrations of FOCM. At 21-days of age, compared with the CTRL group, the duodenal villus length was significantly higher in the FOCM1.25 group and FOCM2.5 group (p < 0.05). There was no statistical difference in morphology in the jejunum and ileum amongst the groups. Furthermore, at the age of 35 days, the villus length of the jejunum and ileum was increased in the FOCM2.5 group compared with the FOCM5.0 group (p < 0.05). The crypt depth of the FOCM5.0 group in the ileum part was significantly better than that of the CTRL group (p < 0.05). However, during the whole experiment, there was no statistical difference in the ratio of villus length to crypt depth in any of the intestinal parts.

3.7. Effects of Fermented Okara and Copra Meal on Bacterial Diversity in the Ileal Contents of Broilers

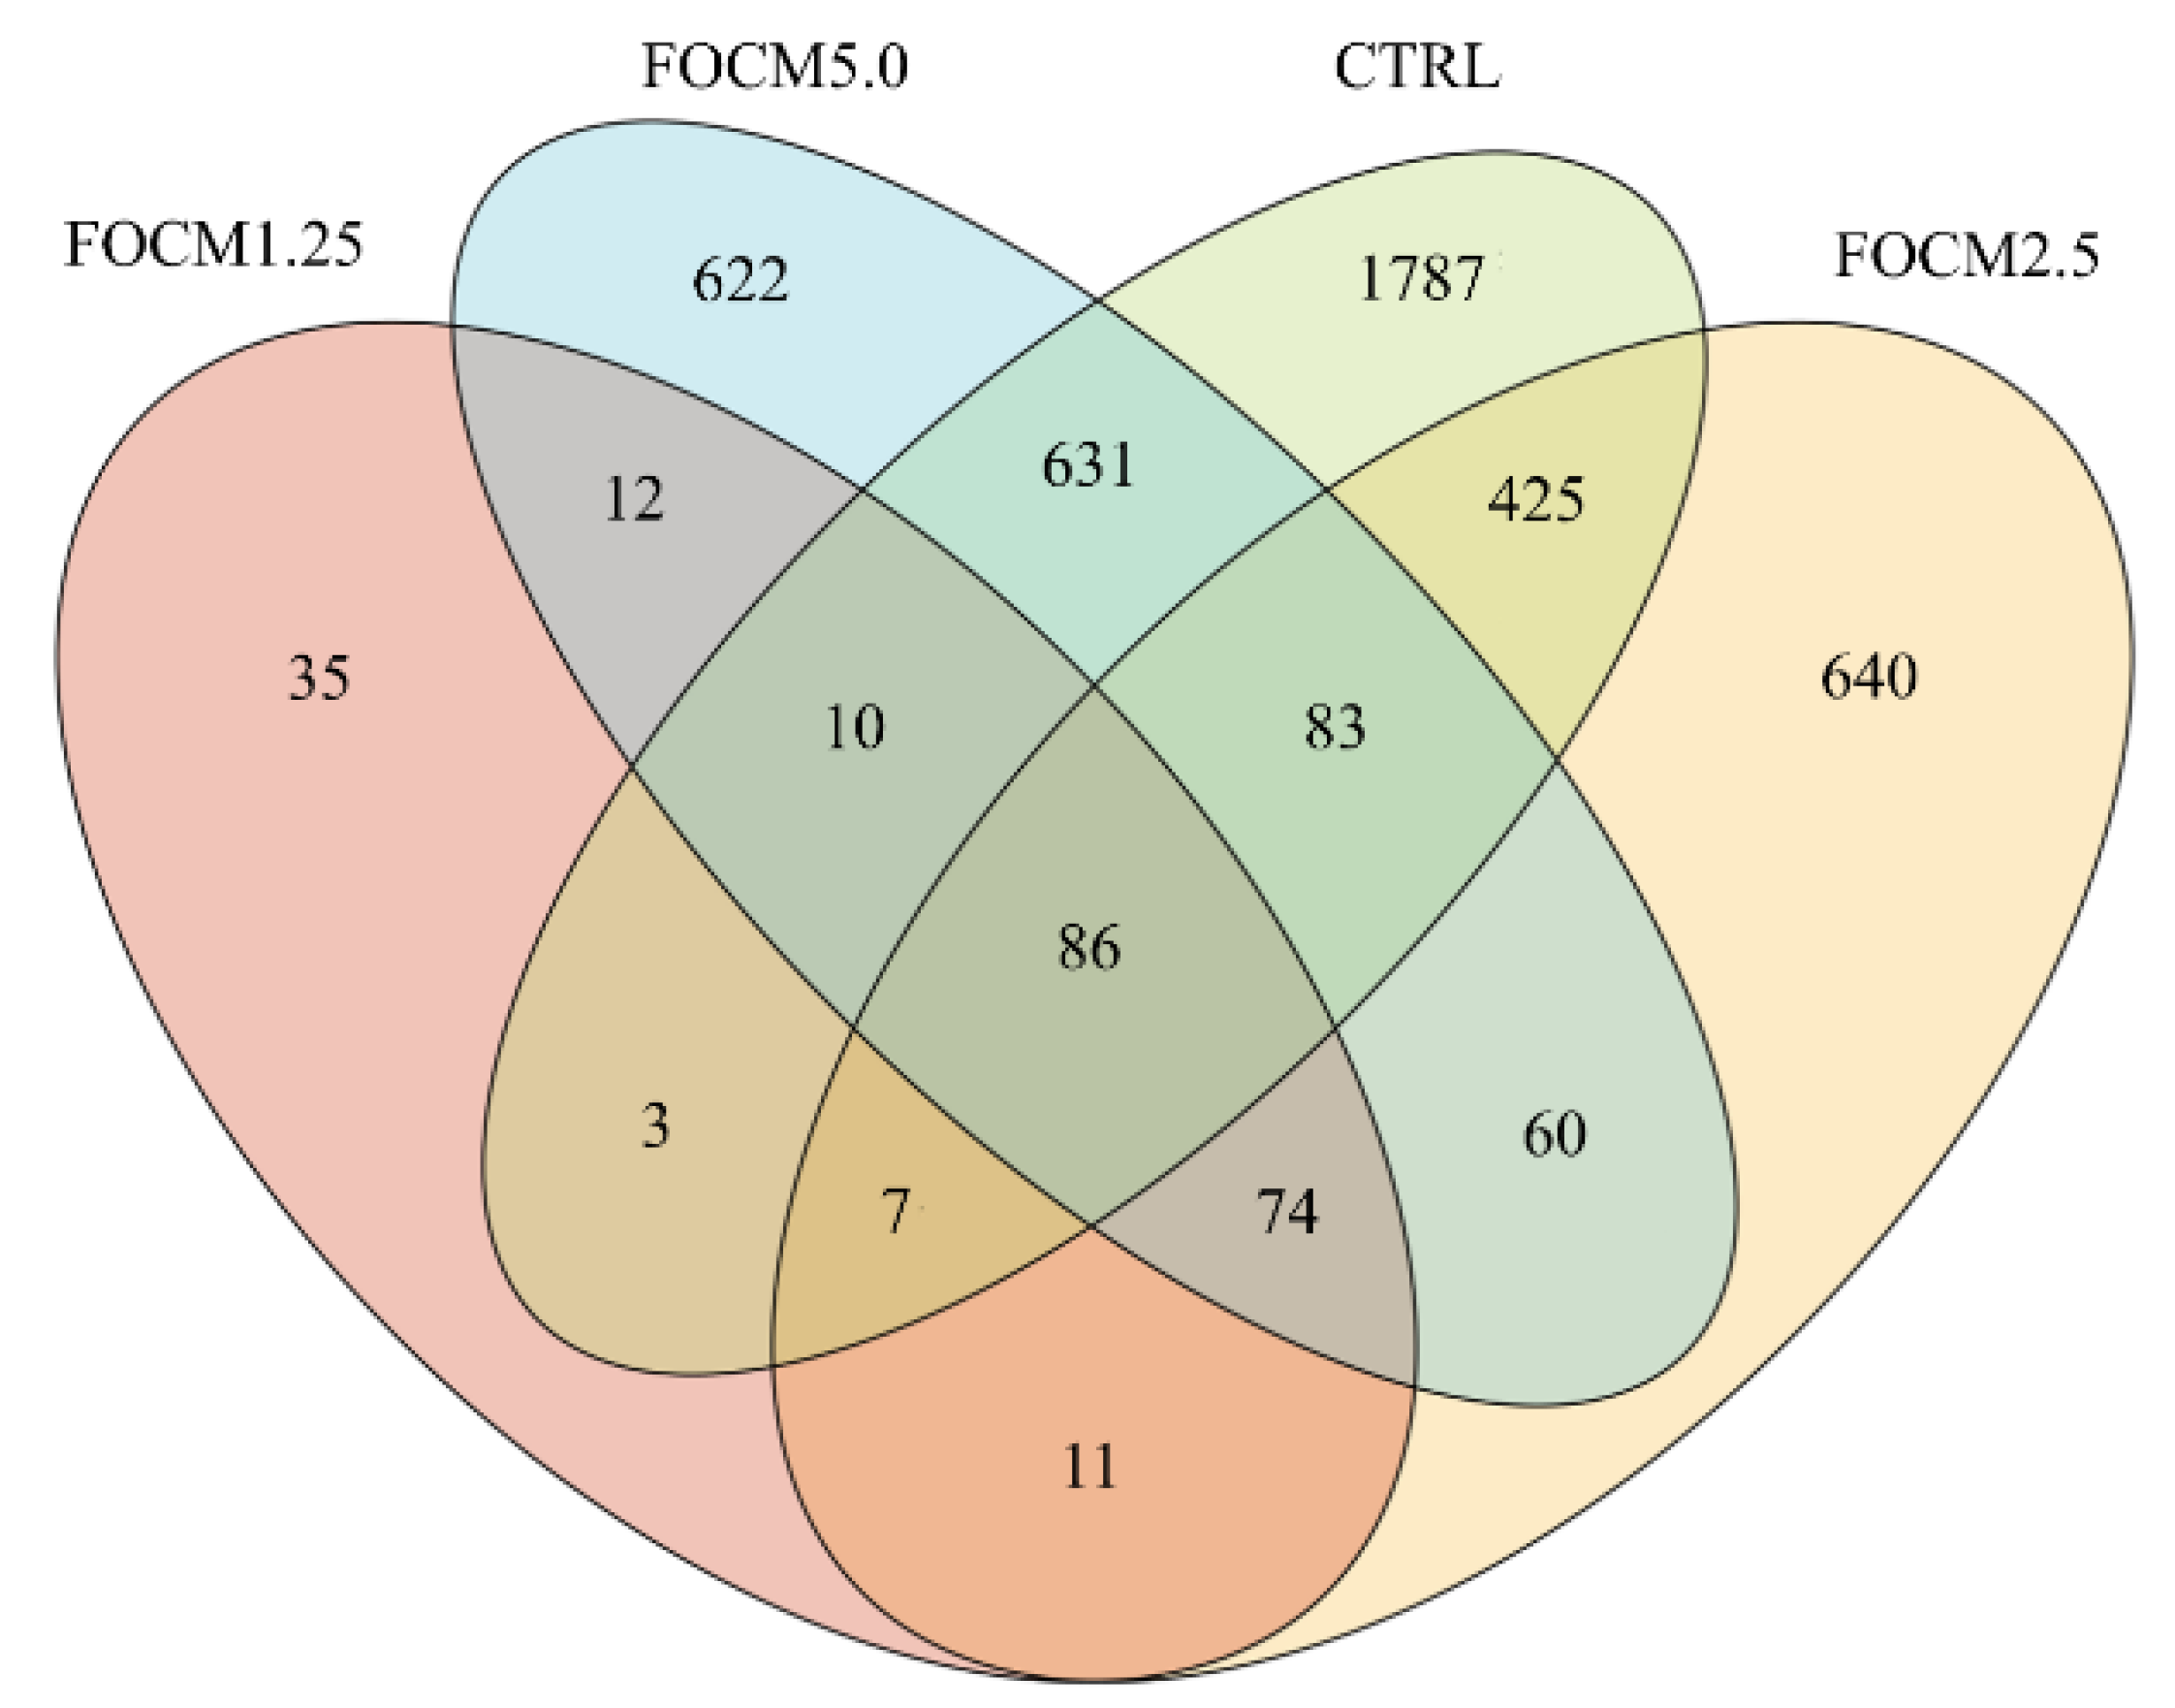
The effect of FOCM on bacterial diversity in the ileal contents of broilers is shown in Figure 5. Venn diagram analysis revealed that 86 identical OTUs were found in the ileal contents among the treatment groups. In addition, there were 1787, 35, 640, and 622 OTUs unique to each group in the CTRL, FOCM1.25, FOCM2.5, and FOCM5.0 groups, respectively. Table 7 shows the effect of FOCM on the ileal microbiota in the 21-day old chickens; no significant differences were observed in Chao1, Simpson reciprocal, or Fisher’s alpha except for the Shannon estimator. Furthermore, the Shannon estimator was reduced in the FOCM1.25 group compared with the CTRL one (p < 0.05).
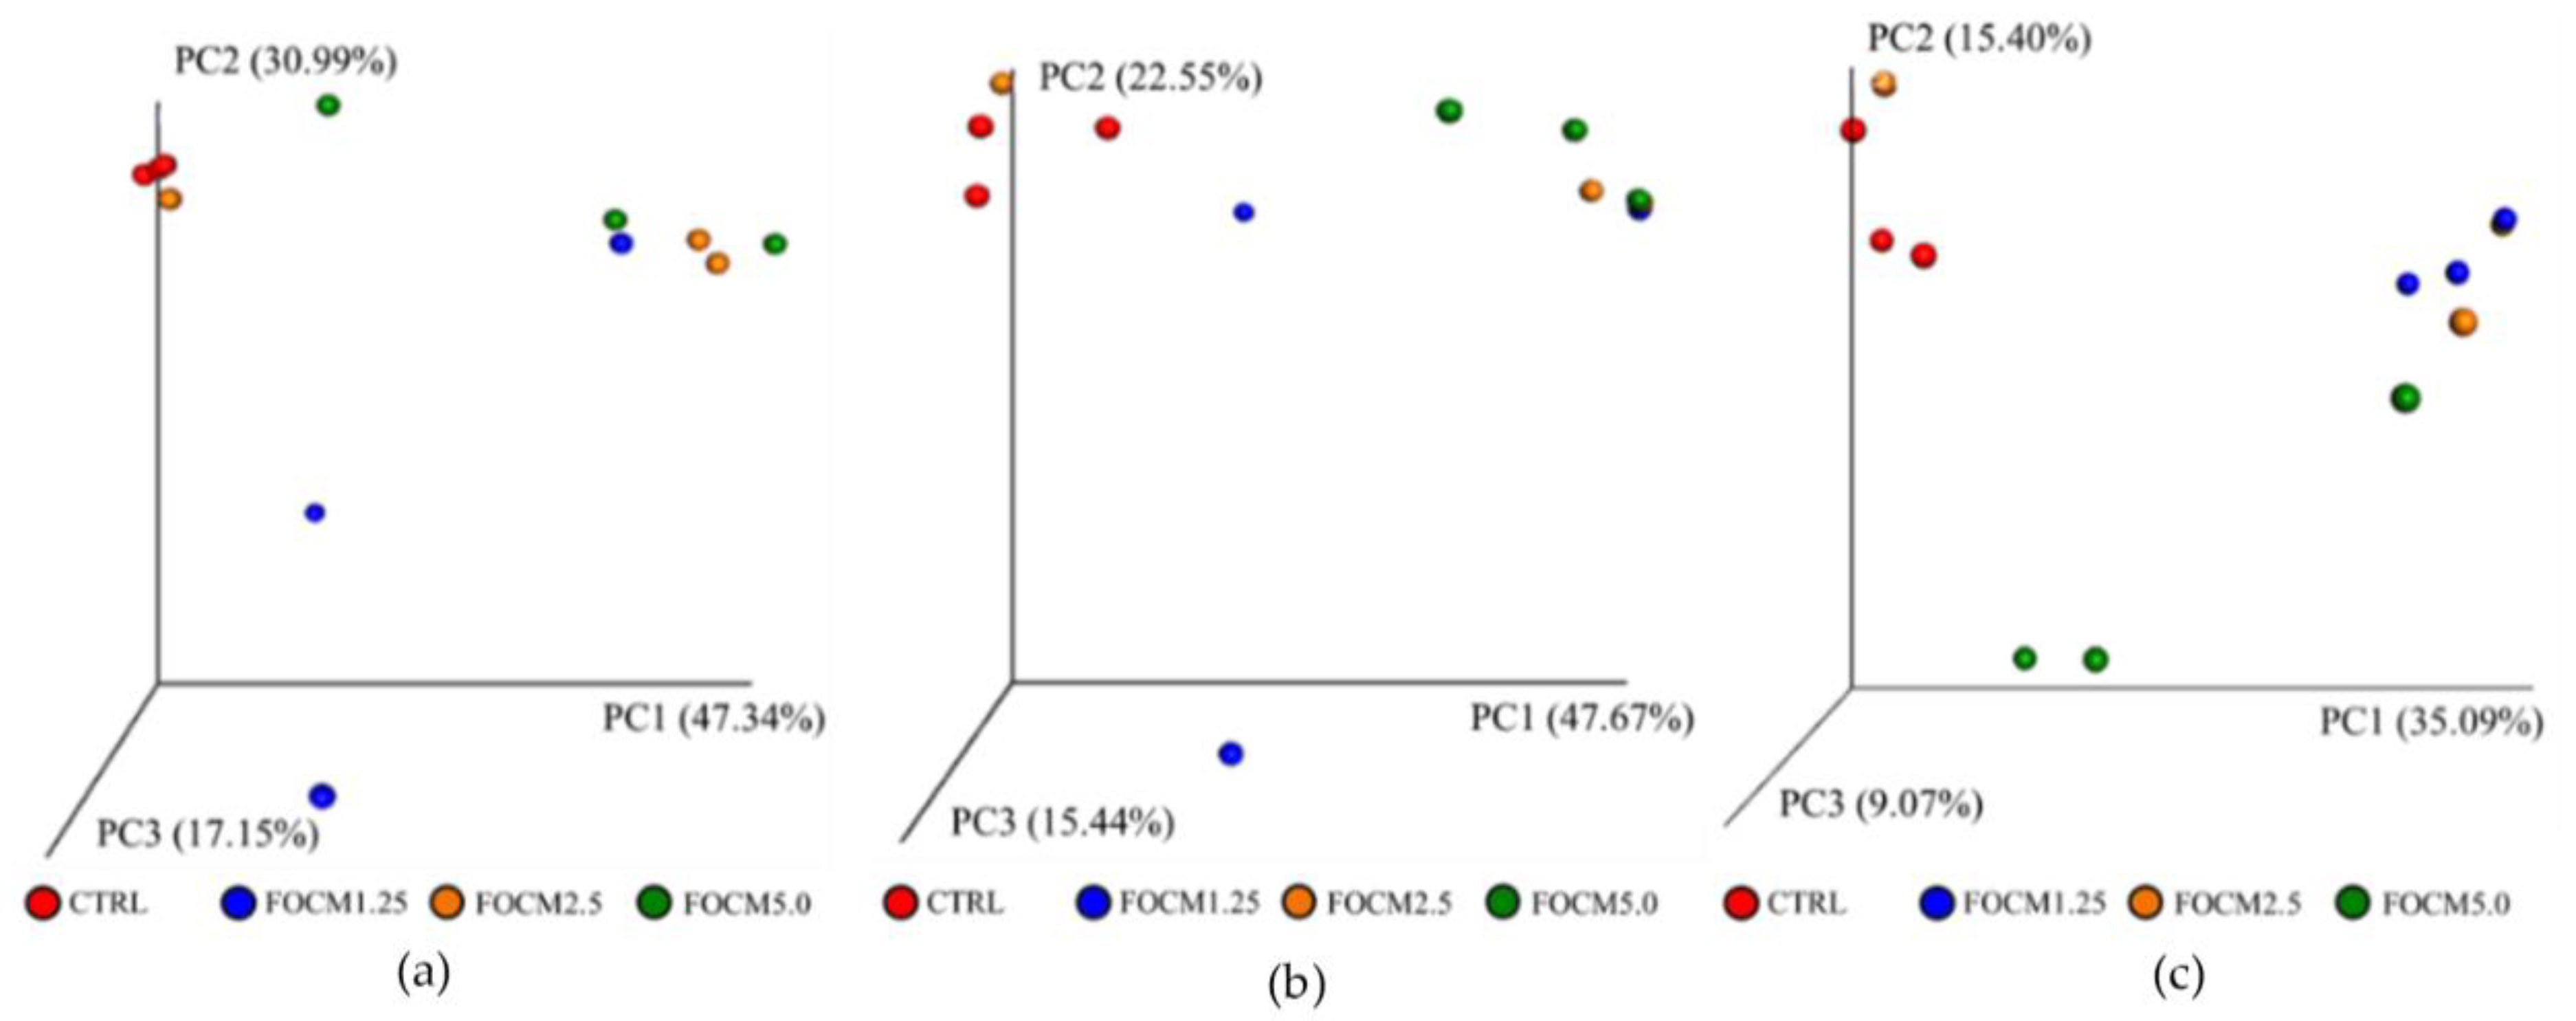
The principal component analysis showed that there were significant differences in the ileal microbial flora amongst the groups (PC1, 47.34%; PC2, 30.99%; PC3, 17.55%; Figure 6a). In addition, the weighted principal coordinate analysis showed that the FOCM1.25 group and the FOCM5.0 group were significantly different from the CTRL group (PC1, 47.67%; PC2, 22.55%; PC3, 15.14%; Figure 6b). Similarly, the principal coordinate analysis of the unweighted UniFrac distance of the ileum bacterial communities was significantly different for all groups except for the FOCM2.5 one (PC1, 35.09%; PC2, 15.4%; PC3, 9.07%; Figure 6c).
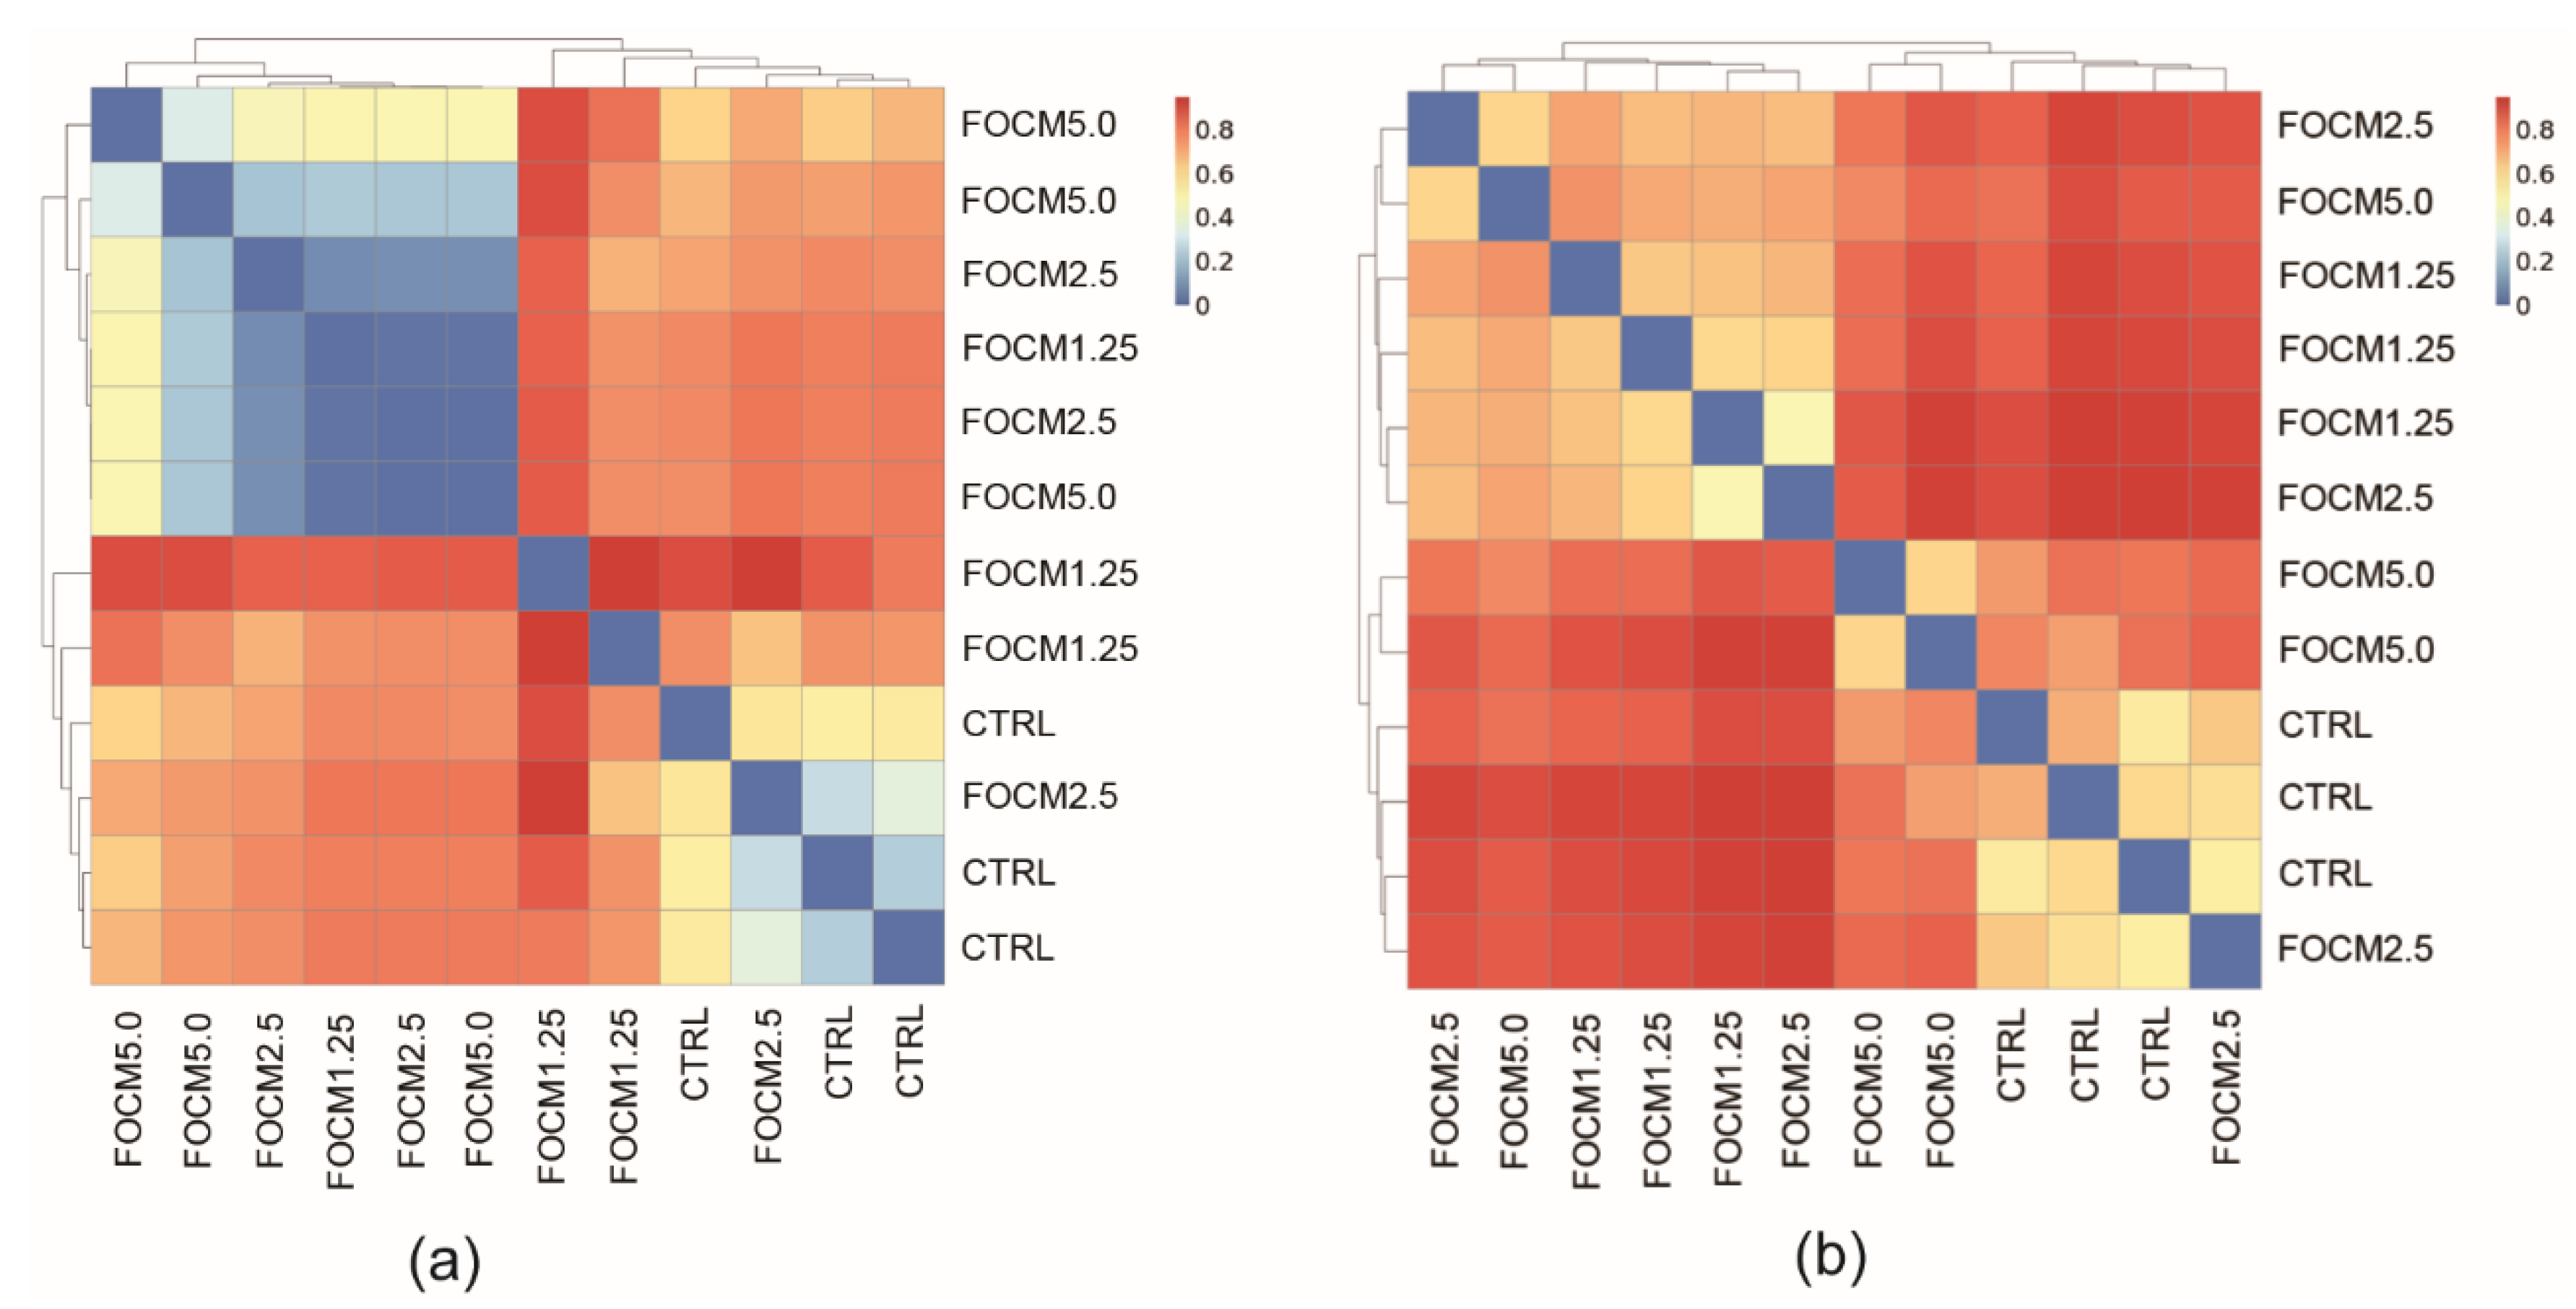
In addition, Figure 7 shows the beta diversity index heat map; the blue color represents higher similarity, and the red one is the lower one. All the treatment groups were different from the CTRL group (based on weighted UniFrac metrics; Figure 7a). Further, the unweighted difference heat map (Figure 7b) showed that the FOCM1.25 group was similar to the FOCM2.5 group, and the CTRL group was more similar to the FOCM5.0 group.

3.8. Effects of FOCM on Ileal Bacterial Richness

As shown in Table 8, the effects of FOCM supplementation in the diet on the microbiota richness of the ileal bacteria in broilers were summarized. At the phylum level, the relative abundance of phyla Firmicutes was sharply increased compared to the CTRL group when FOCM was supplemented to the diet with different concentrations (p < 0.05). At the genus level, the relative abundance of Escherichia-Shigella in all the FOCM groups (FOCM1.25, FOCM2.5 and FOCM5.0) was significantly decreased compared to the CTRL group (p < 0.05).

4. Discussion

4.1. Effect of Different Initial Moisture Content on Lactobacillus Species and C. butyricum Growth on SSF of Okara and CM

The moisture content of the substrate plays a key role in microbial fermentation. Water can help the microorganisms transfer nutrients, but too much moisture causes the substrate to form agglomerates, making it difficult to dissipate heat [53]. As shown in Figure 1a, a value of 55% of the initial moisture had higher Lactobacillus growth at 60 and 72 h of fermentation in SSF. In addition, Figure 1b demonstrates that the initial moisture contents of 50% and 55% had higher C. butyricum growth at 60 and 72 h of fermentation. A previous study revealed that when the initial moisture of okara reached more than 60%, it harmed the growth of some microorganisms such as Yarrowia lipolytica [54]. Another study demonstrated the optimum initial moisture for the growth of lactic acid bacteria and C. butyricum in the solid-state fermentation of soybean meal is about 50% [44], and the optimum initial moisture for the growth of Bacillus licheniformis is about 45–50% [55]. In addition, a previous study pointed out that when L. reuteri and B. subtilis were used for fermentation in the feed, the highest bacterial count was obtained at an initial moisture content of 50–60% [56]. Therefore, it can be concluded that, in solid-state fermentation, most microorganisms are more suitable for growth at 45–60%, and the results of this experiment showed that the initial moisture content sof 50% and 55% in the mixed matrix of okara and CM was the optimal growth conditions for microorganisms. Moreover, the matrix cost was lower at 55% starting moisture, so subsequent experiments were performed with a starting moisture content at 55%. Accordingly, in this current study, a one-way ventilated anaerobic fermentation bag was used for fermentation. Yeast was used for aerobic fermentation in the early stage of fermentation. The oxygen in the bag could have been converted into carbon dioxide, which facilitated the subsequent proliferation of C. butyricum and lactic acid bacteria in an anaerobic environment. It needed the genes for lactate utilization under anaerobic conditions [57,58]. In previous studies, L. reuteri and B. subtilis were fermented for different times (24, 48, 72, and 96 h) in the feed, and the results showed that the number of lactic acid bacteria at 48 h fermentation group reached its peak at a high level and decreased slightly at 72 h [56]. Meanwhile, lactic acid bacteria and C. butyricum were used to ferment soybean meal, and the results showed that the number of bacteria reached a balance after the second day of fermentation, which was similar with this experiment. It was assumed that the microorganisms would reach equilibrium at 60 h of fermentation.

4.2. Analysis of Reducing Sugars and Metabolites in Microbial SSF by Adding Exogenous Non-Starch Polysaccharide Enzymes

According to the results, the most suitable mixed matrix of okara and CM for microbial growth was at an initial moisture content of 55%. Since the addition of exogenous non-starch polysaccharide enzymes may affect the optimal fermentation time (Figure 1a,b), the reducing sugar (Figure 3a) and lactic acid content (Figure 3b) in this experiment were used as the fermentation indicators. Sugar here means all monosaccharides such as glucose, fructose, and glyceraldehyde, and disaccharides such as lactose and maltose. In the fermentation process, sugars can be regarded as a carbon source to provide nutrients for the growth of microorganisms. By analyzing the reducing sugar content of the fermentation product, we can understand the growth of microorganisms during the fermentation process and infer the yield of metabolites during the fermentation process. This study had a similar result to Su [44], which investigated whether the microbial fermentation process can effectively utilize the carbon source and use the carbon source within 48 h of fermentation. In addition, the lactic acid content continued to increase after 48 h of fermentation and did not decrease until 60 h after fermentation. The low pH of lactic acid in animal intestines is suitable for the proliferation and growth of probiotics while inhibiting pathogenic bacteria. In a recent study, anaerobic fermentation was used with the addition of 10% molasses. In the late stage of fermentation, lactic acid bacteria became the dominant strain and metabolized sugars into lactic acid [59]. In particular, the lactic acid concentration will vary depending on the strain and fermentation substrate. In a previous study, mannanase was added to palm kernel cake at 5% and 10%, and the results showed that the addition of 10% further reduced the sugars [60]. In addition to the intestinal digestion of broilers fed a wheat-based diet, a large amount of starch is coated with intact cell walls, and most of this starch is released after supplementation with NSP enzymes [61]. It is well known that NSP enzymes can decompose plant cell walls to increase the reduction of sugars in the matrix. Based on these benefits, the activity of this NSP-degrading enzyme has great potential to reduce the value of NSP and encapsulated nutrients from broiler feed such as corn, wheat, and SBM so that these essential nutrients from NSP can be used more efficiently [21]. In our results, after 48 h of fermentation, the reduction of sugar was increased through the action of NSP, which provided the microorganisms to continue producing lactic acid until 60 h of fermentation.

4.3. Animal Study

4.3.1. Effects of FOCM on the Growth Performance of Broilers

Since fermentation is a pre-digestion process, macromolecular proteins are first decomposed into peptides or amino acids to improve the nutritional quality and to help young animals increase nutrient utilization [62]. The FOCM produced in this study not only had a large amount of amino acid but also contained a large amount of lactic acid bacteria. This is an important condition because the supplementation of lactic acid bacteria in the feed will be helpful in improving the growth performance of broilers due to its lactic acid products [63]. As lactic acid bacteria were enriched in the FOCM, this could significantly improve the feed efficiency of broilers without affecting their body weight gain and at the same time could save on feed costs (Table 3). Since okara and CM are fermented by microorganisms, a large amount of protein is decomposed into amino acids, and lactic acid fermentation produces a sour flavor. In addition to lactic acid, this study also showed an increase in butyric acid (Figure 3c). A previous study revealed that lactic acid (along with other organic acids: fumaric acid and citric acid) could decrease the gastric pH, thus, it could indirectly eliminate the proliferation of acid-sensitive bacteria. Likewise, butyric acid (and other organic acids such as formic acid, acetic acid, propionic acid, and sorbic acid) could reduce the pH in the GIT by directly acting upon the cell wall of gram-negative bacteria [64,65]. Moreover, specifically in butyric acid, another study has demonstrated that this butyric acid could increase the digestion and nutrition absorption of broilers [66,67], which aims to improve broiler growth performance. In addition, the energy usage of different groups may also affect feed intake. The FOCM that was produced in this study contained high amounts of fiber, and the feed metabolizable energy was lower than that of the control group. It was indicated that the addition of FOCM helped to increase the appetite of broilers. Accordingly, along with the lower energy value, the broilers consume more feed, which was effectively represented in higher feed intake and lower FCR in the FOCM1.25 group without any reduction in body weight. This was different from the FOCM5.0 group where the FCR content was close to the CTRL group. Since the NSP content is closely related to the ability of the poultry digestive tract to absorb feed nutrients [21], we assumed that the FOCM5.0 group had a higher NSP content due to having more fermented okara and CM.

4.3.2. Effects of FOCM on Blood Biochemistry and Serum Antibody Titers of Broilers

During the experiment, the FOCM5.0 group produced higher amounts of albumin than the other groups (Table 4). The total protein in serum is composed of albumin and globulin, wherein the globulin includes immunoglobulin such as IgA. Hence, feeding lactic acid bacteria can ameliorate the integrity of the intestinal barrier by upregulating the tight-junction-related genes (Zone occludens-1 (ZO-1) and occludin) and increasing the production of IgA in Peyer’s patch [68]. In addition, these lactic acid bacteria are needed for the mucosa to compete with pathogens (toxins, viruses, and bacteria) for the binding site on the intestinal epithelial cell surface [69]. Moreover, IgA is needed for the mucosa to prevent the attachment of antigens (toxins, viruses, and bacteria) by direct neutralization [70]. In a similar study in pigs, the addition of LAB to swine diets has more benefits; it can not only inhibit pathogens in the gastrointestinal tract but also improve the microbial balance in the intestine, as well as improve the function of the intestinal barrier and upregulate intestinal mucosal immunity [69]. Celi [71] showed that the intestinal mucosal immune system is made up of a system of lymphoid tissues called the gut-associated lymphoid tissue (GALT). In the GALT, lymphocytes can be found in three separate places: (1) Peyer’s patches, which are lymphoid follicles (T and B lymphocytes, mainly B-cells in adults) located in the mucosa and extending to the submucosa in the ileum; (2) the lamina propria lymphocytes, which are mainly IgA secretory B lymphocytes; and (3) the intra-epithelial lymphocytes, which are located in the epithelium at the basolateral spaces between the epithelial cells beneath the tight junctions. Other cells, such as M-cells, are in the intestinal epithelium. The role of M-cells is to endocytose antigens and transport them to antigen-presenting cells (APCs; macrophages and dendritic cells), which are located in the underlying tissue, for further digesting of antigens and presenting them to T-cells [71].
Chickens have maternal immunity against ND and IB viruses, which begin to decrease in titer at 5–10 days old [72,73]. Therefore, our study carried out ND and IB vaccination with active vaccines at 4-days of age and revaccination at 14-days of age. Furthermore, antibody titers were investigated when the broilers were 21 and 35 days old. At the time of vaccination, antibody titers had not yet appeared, so it took time to detect them. In general, antibody titers can be detected at least 14 days after vaccination [72]. Previous studies have shown that natural products (natural resin), probiotics, and fermented products as feed additives induce antibody responses in vaccinated chickens against ND and IB viruses [74,75,76,77,78]. However, to the best of our knowledge, there have been no studies revealing the response of the combination of probiotics and fermented products produced by the SSF method. The supplementation of probiotics as a feed additive to chickens vaccinated against ND can increase the antibody response to the ND virus but has no significant difference in antibody titers between the treatment and control groups [75], and the result of this study was similar to our current study (Table 5). On the other hand, feed supplemented with fermented yeast given to chickens showed an increase in the antibody titer of the ND vaccine against the ND virus by investigating the availability of mannan-binding lectin (MBL). In addition, Kjærup [79] also investigated MBL in IB-vaccinated chickens. Accordingly, compared with previous studies, it is necessary to investigate the immune response between vaccinated and unvaccinated chickens (or before and after vaccination) and to conduct some tests to check the MBL specifically. MBL is a plasma protein involved in the innate immune defense against various microorganisms, including viruses. MBL binds to mannose and N-acetylglucosamine oligosaccharides, and their derivatives are presented on the surface of microorganisms [78] and play an important role in humans and chickens to protect the host from viral infection [79]. We assumed that, by offering probiotics and fermented products orally, with the short chicken-rearing period of broilers and the formation of antibody responses that takes several weeks from vaccination until antibody titer measurements can be observed, it will certainly cause local (not systemic yet) effects.

4.3.3. Effects of FOCM on Intestinal Morphology of Broilers

The gut is a major site of nutrient absorption, and the health of the villi is an important factor affecting nutrient absorption. Longer villi have more mature epithelial cells and a larger surface area to increase the absorption capacity; deeper crypts indicate a stronger gut response leading to repair following host injury [71]. In this study, compared to the control group, the villi length of the FOCM2.5 group was significantly higher in the duodenum after 21-days of age and in the jejunum and ileum after 35-days of age. In previous studies, administration of L. salivarius and C. butyricum to mice could significantly improve intestinal villi, crypt depth, and intestinal mucosal thickness, and the combination of the two bacteria had a better improvement effect [80]. In addition, a study on swine has pointed out that giving L. plantarum to weaning piglets can significantly increase the length of the jejunum and ileum villi [81]. The FOCM in this study also contained Lactobacillus and C. butyricum, which could improve the length of intestinal villi. In this study, although the FOCM was enzymatically hydrolyzed by exogenous NSP enzyme for 60 h, there was still a fiber content of up to 25.56% compared to the control group, NSP enzyme only, and probiotic only (Figure 2c). On the other hand, the FOCM5.0 group contained more fermented okara and CM, so the NSP content in the feed was higher, resulting in a decrease in the villi length of the gut, especially at 35-days of age (Table 6). It could be seen that the FOCM contained lactic acid bacteria (Lactobacillus and C. butyricum), which are beneficial to the development of intestinal villi. Only a small amount FOCM, such as 1.25% or 2.5%, could improve intestinal morphology. Since birds do not have adequate endogenous enzymes to digest NSP components [82], excessive FOCM can cause an excess of NSP content that hinders the development of intestinal villi.

4.3.4. Bacterial Richness Analysis of Chicken Ileum

At the phylum level (Table 8), the supplemented diet could sharply improve the relative abundance of Firmicutes in the ileal chickens (p < 0.05). A previous study investigated the correlation between FCR and intestinal microbiota; the higher FCR group could increase the proportions of Firmicutes and reduce the Bacteroidetes in broilers compared to the lower FCR groups [83]. Similarly, according to the FCR result, the FOCM1.25 group was significantly lower than control group, and the relative abundance of Firmicutes was significantly higher (p < 0.05). Moreover, at the genus level, the FOCM treatments tended to increase the levels of genus Lactobacillus compared to the CTRL group, while the relative abundance of Escherichia-Shigella decreased significantly (p < 0.05). The differences in microbiota will vary according to the location of the gastrointestinal tract of chickens, with Lactobacillus accounting for the highest portion [37,84]. The FCR, which is defined as the ratio between feed inputs and product outputs during the rearing period, is extensively used to determine feed efficiency (yield per unit feed) [85,86]. In chickens, the FCR is calculated as a ratio of feed eaten to body weight gained. As a result, chickens with a low FCR require less feed per kilogram gained and are the most efficient at converting feed to mass [87]. In broilers, the genus Lactobacillus has been shown to be linked to FCR [88,89]. In addition, the presence of Lactobacillus caused a low FCR in chickens [87]. In the current study, the FOCM2.5 group had the most abundant Lactobacillus (64.84%, Table 8) content amongst the groups, and the FCR at day 35 and the whole experiment period had the lowest FCR (Table 3).
Escherichia coli and Shigella, species of Enterobacter, are known to overgrow in the gut to cause damage to the intestinal mucosa and erosion of villi and intestinal cells, thereby reducing the ability of animals to absorb nutrients [90,91,92]. Therefore, the reduced relative abundance of Escherichia-Shigella was possible due to the lessened damage of the intestinal villi (day 21) in the diet supplemented with FOCM. As for its effect on growth performance, a previous study revealed that reduced Escherichia coli in the intestine could help improve the growth performance of broilers [89]. In addition, it would be even better if the reduced level of Escherichia coli was accompanied by an increased level of Lactobacillus [89,93]. Previous studies have indicated that fecal microbial composition was related to the growth performance of broilers [83,94,95]. The fecal microbiome is mainly derived from the gut, and the fecal microbiome is mainly derived from the ileal content. Therefore, this experiment can confirm that ileal bacteria can be used as a correlation indicator of the growth performance of broilers.

5. Conclusions

The optimal initial moisture content and fermentation duration for the mixed SSF of okara and CM were 55% and 60 h, respectively. Exogenous NSPases supplementation in the SSF of okara and CM was able to improve the nutritional value of FOCM. The FOCM could be used as an alternative feedstuff to replace corn and soybean meal, with the efficacy of improving the FCR, gut morphology, and ileal microbiota in broilers.

Author Contributions

Conceptualization, Y.-H.Y. and Y.-H.C.; methodology, Y.-H.Y. and Y.-H.C.; validation, F.S.-H.H., C.A.A., S.-Y.L., Y.-H.Y. and Y.-H.C.; formal analysis, F.S.-H.H., C.A.A. and S.-Y.L.; investigation, S.-Y.L., Y.-H.Y. and Y.-H.C.; resources, Y.-H.Y. and Y.-H.C.; data curation, Y.-H.Y. and Y.-H.C.; writing—original draft preparation, F.S.-H.H. and C.A.A.; writing—review and editing, Y.-H.Y. and Y.-H.C.; supervision, Y.-H.Y. and Y.-H.C.; project administration, Y.-H.Y. and Y.-H.C.; funding acquisition, Y.-H.C. All authors have read and agreed to the published version of the manuscript.

Funding

This research was funded by Ministry of Science and Technology, grant number MOST 110-2313-B-19-004-MY2.

Institutional Review Board Statement

The study was conducted according to the guidelines of the national ethical guidelines and approved by the Institutional Animal Care and Use Committee of National Ilan University (protocol code 110-8).

Informed Consent Statement

Not applicable.

Data Availability Statement

The data that support the findings of this study are available from the corresponding author upon reasonable request.

Conflicts of Interest

The authors declare no conflict of interest.

References

  1. Upton, M. Proceedings of the International Conference Poultry in the Twenty-first Century: Avian influenza and beyond. In Scale and Structures of the Poultry Sector and Factors inducing Change: Intercountry Differences and Expected Trends; The Food and Agriculture Organization (FAO) of the United Nations: Bangkok, Thailand, 2008; pp. 1–36. [Google Scholar]
  2. Thirumalaisamy, G.; Muralidharan, J.; Senthilkumar, S.; Sayee, R.H.; Priyadharsini, M. Cost-effective feeding of poultry. Int. J. Environ. Sci. Technol. 2019, 5, 3997–4005. [Google Scholar]
  3. Popp, J.; Lakner, Z.; Harangi-Rákos, M.; Fári, M. The effect of bioenergy expansion: Food, energy, and environment. Renew. Sustain. Energy Rev. 2014, 32, 559–578. [Google Scholar] [CrossRef]
  4. Muscat, A.; De Olde, E.; Boer, I.J.M.; Ripoll-Bosch, R. The battle for biomass: A systematic review of food-feed-fuel competition. Glob. Food Secur. 2019, 25, 100330. [Google Scholar] [CrossRef]
  5. Iji, P.; Toghyani, M.; Ahiwe, E.; Omede, A.A. Alternative sources of protein for poultry nutrition. In. Edn. 2017, 22, 37–269. [Google Scholar]
  6. Mengesha, M. The Issue of Feed-Food Competition and Chicken Production for the Demands of Foods of Animal Origin. Asian J. Poult. Sci. 2012, 6, 31–43. [Google Scholar] [CrossRef]
  7. Beski, S.S.M.; Swick, R.A.; Iji, P.A. Specialized protein products in broiler chicken nutrition: A review. Anim. Nutr. 2015, 1, 47–53. [Google Scholar] [CrossRef]
  8. Babatunde, O.O.; Park, C.S.; Adeola, O. Nutritional Potentials of Atypical Feed Ingredients for Broiler Chickens and Pigs. Anim. Open Access J. MDPI 2021, 11, 1196. [Google Scholar] [CrossRef]
  9. Voss, G.B.; Rodríguez-Alcalá, L.M.; Valente, L.M.P.; Pintado, M.M. Impact of different thermal treatments and storage conditions on the stability of soybean byproduct (okara). J. Food Meas. Charact. 2018, 12, 1981–1996. [Google Scholar] [CrossRef]
  10. Stein, H.H.; Casas, G.A.; Abelilla, J.J.; Liu, Y.; Sulabo, R.C. Nutritional value of high fiber co-products from the copra, palm kernel, and rice industries in diets fed to pigs. J. Anim. Sci. Biotechnol. 2015, 6, 56. [Google Scholar] [CrossRef]
  11. Adeyemi, O.A.; Jimoh, B.; Olufade, O.O. Soybean meal replacement with cassava leaf: Blood meal mix with or without enzyme in broiler diets. Arch. De Zootec. 2013, 62, 275–285. [Google Scholar] [CrossRef]
  12. Kamble, D.B.; Rani, S. Bioactive components, in vitro digestibility, microstructure and application of soybean residue (okara): A review. Legume Sci. 2020, 2, e32. [Google Scholar] [CrossRef]
  13. Kamble, D.B.; Singh, R.; Rani, S.; Pratap, D. Physicochemical properties, in vitro digestibility and structural attributes of okara-enriched functional pasta. J. Food Processing Preserv. 2019, 43, e14232. [Google Scholar] [CrossRef]
  14. Colletti, A.; Attrovio, A.; Boffa, L.; Mantegna, S.; Cravotto, G. Valorisation of By-Products from Soybean (Glycine max (L.) Merr.) Processing. Molecules 2020, 25, 2129. [Google Scholar] [CrossRef] [PubMed]
  15. Rinaldi, V.E.A.; Ng, P.K.W.; Bennink, M.R. Effects of Extrusion on Dietary Fiber and Isoflavone Contents of Wheat Extrudates Enriched with Wet Okara. Cereal Chem. 2000, 77, 237–240. [Google Scholar] [CrossRef]
  16. Redondo-Cuenca, A.; Villanueva-Suárez, M.J.; Mateos-Aparicio, I. Soybean seeds and its by-product okara as sources of dietary fibre. Measurement by AOAC and Englyst methods. Food Chem. 2008, 108, 1099–1105. [Google Scholar] [CrossRef]
  17. Adeyemo, S.M.; Onilude, A.A. Enzymatic Reduction of Anti-nutritional Factors in Fermenting Soybeans by Lactobacillus plantarum Isolates from Fermenting Cereals. Niger. Food J. 2013, 31, 84–90. [Google Scholar] [CrossRef]
  18. Balasubramaniam, K. Polysaccharides of the kernel of maturing and matured coconuts. J. Food Sci. 1976, 41, 1370–1373. [Google Scholar] [CrossRef]
  19. Knudsen, K.E.B. Carbohydrate and lignin contents of plant materials used in animal feeding. Anim. Feed. Sci. Technol. 1997, 67, 319–338. [Google Scholar] [CrossRef]
  20. Düsterhöft, E.M.; Posthumus, M.A.; Voragen, A.G.J. Non-starch polysaccharides from sunflower (Helianthus annuus) meal and palm-kernel (Elaeis guineensis) meal—Investigation of the structure of major polysaccharides. J. Sci. Food Agric. 1992, 59, 151–160. [Google Scholar] [CrossRef]
  21. Keyser, K.D.; Dierick, N.; Kuterna, L.; Maigret, O.; Kaczmarek, S.; Rutkowski, A.; Vanderbeke EJJoas, A.T. Non-starch Polysaccharide Degrading Enzymes in Corn and Wheat-Based Broiler Diets: Dual Activity for Major Substrates. J. Agric. Sci. Technol. A 2018, 8, 76–88. [Google Scholar]
  22. Kim, H.J.; Nam, S.O.; Jeong, J.H.; Fang, L.H.; Yoo, H.B.; Yoo, S.H.; Hong, J.S.; Son, S.W.; Ha, S.H.; Kim, Y.Y. Various levels of copra meal supplementation with β-Mannanase on growth performance, blood profile, nutrient digestibility, pork quality and economical analysis in growing-finishing pigs. J. Anim. Sci. Technol. 2017, 59, 19. [Google Scholar] [CrossRef] [PubMed]
  23. Sundu, B.; Kumar, A.; Dingle, J. Feeding value of copra meal for broilers. World’s Poult. Sci. J. 2009, 65, 481–492. [Google Scholar] [CrossRef]
  24. Sundu, B.; Hutta, U.; Chaudhry, A. Potential use of beta mannan from copra meal as a feed additive for broilers. World’s Poult. Sci. J. 2012, 68, 707–716. [Google Scholar] [CrossRef]
  25. Panigrahi, S. Effects of different copra meals and amino acid supplementation on broiler chick growth. Br. Poult. Sci. 1992, 33, 683–687. [Google Scholar] [CrossRef] [PubMed]
  26. Alagawany, M.; Elnesr, S.S.; Farag, M.R. The role of exogenous enzymes in promoting growth and improving nutrient digestibility in poultry. Iran. J. Vet. Res. 2018, 19, 157–164. [Google Scholar] [PubMed]
  27. Sundu, B.; Kumar, A.; Dingle, J. Comparison of feeding values of palm kernel meal and copra meal for broilers. Recent Adv. Anim. Nutr. Aust. 2005, 15, 16A. [Google Scholar]
  28. Thomas, L.; Larroche, C.; Pandey, A. Current developments in solid-state fermentation. Biochem. Eng. J. 2013, 81, 146–161. [Google Scholar] [CrossRef]
  29. Singhania, R.R.; Sukumaran, R.K.; Patel, A.K.; Larroche, C.; Pandey, A. Advancement and comparative profiles in the production technologies using solid-state and submerged fermentation for microbial cellulases. Enzym. Microb. Technol. 2010, 46, 541–549. [Google Scholar] [CrossRef]
  30. Sadh, P.K.; Duhan, S.; Duhan, J.S. Agro-industrial wastes and their utilization using solid state fermentation: A review. Bioresour. Bioprocess. 2018, 5, 1. [Google Scholar] [CrossRef]
  31. Bhargav, S.; Panda, B.P.; Ali, M.; Javed, S. Solid-state fermentation: An overview. Chem. Biochem. Eng. Q. 2008, 22, 49–70. [Google Scholar]
  32. Lizardi-Jiménez, M.A.; Hernández-Martínez, R. Solid state fermentation (SSF): Diversity of applications to valorize waste and biomass. 3 Biotech 2017, 7, 44. [Google Scholar] [CrossRef] [PubMed]
  33. Hölker, U.; Höfer MFau-Lenz, J.; Lenz, J. Biotechnological advantages of laboratory-scale solid-state fermentation with fungi. Appl. Microbiol. Biotechnol. 2004, 64, 175–186. [Google Scholar] [CrossRef] [PubMed]
  34. Mukherjee, R.; Chakraborty, R.; Dutta, A. Role of Fermentation in Improving Nutritional Quality of Soybean Meal—A Review. Asian-Australas J. Anim. Sci. 2016, 29, 1523–1529. [Google Scholar] [CrossRef]
  35. Pan, D.; Yu, Z. Intestinal microbiome of poultry and its interaction with host and diet. Gut Microbes 2013, 5, 108–119. [Google Scholar] [CrossRef] [PubMed]
  36. Zhou, Q.; Lan, F.; Li, X.; Yan, W.; Sun, C.; Li, J.; Yang, N.; Wen, C. The Spatial and Temporal Characterization of Gut Microbiota in Broilers. Front. Veter-Sci. 2021, 8. [Google Scholar] [CrossRef] [PubMed]
  37. Stamilla, A.; Ruiz-Ruiz, S.; Artacho, A.; Pons, J.; Messina, A.; Randazzo, C.L.; Caggia, C.; Lanza, M.; Moya, A. Analysis of the Microbial Intestinal Tract in Broiler Chickens during the Rearing Period. Biology 2021, 10, 942. [Google Scholar] [CrossRef]
  38. Gupta, S.; Lee, J.J.L.; Chen, W.N. Analysis of Improved Nutritional Composition of Potential Functional Food (Okara) after Probiotic Solid-State Fermentation. J. Agric. Food Chem. 2018, 66, 5373–5381. [Google Scholar] [CrossRef]
  39. Suda, Y.; Sasaki, N.; Kagawa, K.; Elean, M.; Binghui, Z.; Tomokiyo, M.; Islam, M.A.; Riaz Rajoka, M.S.; Shimazu, T.; Egusa, S.; et al. Immunobiotic Feed Developed with Lactobacillus delbrueckii subsp. delbrueckii TUA4408L and the Soymilk By-Product Okara Improves Health and Growth Performance in Pigs. Microorganisms 2021, 9, 921. [Google Scholar] [CrossRef]
  40. Yang, C.M.; Cao, G.T.; Ferket, P.R.; Liu, T.T.; Zhou, L.; Zhang, L.; Xiao, Y.P.; Chen, A.G. Effects of probiotic, Clostridium butyricum, on growth performance, immune function, and cecal microflora in broiler chickens. Poult. Sci. 2012, 91, 2121–2129. [Google Scholar] [CrossRef]
  41. Wyszynska, A.K.; Godlewska, R. Lactic Acid Bacteria—A Promising Tool for Controlling Chicken Campylobacter Infection. Front. Microbiol. 2021, 12, 703441. [Google Scholar] [CrossRef]
  42. Menconi, A.; Kallapura, G.; Latorre, J.; Morgan, M.; Pumford, N.; Hargis, B.; Tellez, G. Identification and Characterization of Lactic Acid Bacteria in a Commercial Probiotic Culture. Biosci. Microbiota Food Health 2014, 33, 25–30. [Google Scholar] [CrossRef] [PubMed]
  43. Cheng, Y.-H.; Hsiao, F.; Wen, C.-M.; Wu, C.-Y.; Dybus, A.; Yu, Y.-H. Mixed fermentation of soybean meal by protease and probiotics and its effects on the growth performance and immune response in broilers. J. Appl. Anim. Res. 2019, 47, 339–348. [Google Scholar] [CrossRef]
  44. Su, L.-W.; Cheng, Y.-H.; Hsiao, F.S.-H.; Han, J.-C.; Yu, Y.-H. Optimization of Mixed Solid-state Fermentation of Soybean Meal by Lactobacillus Species and Clostridium butyricum. Pol. J. Microbiol. 2018, 67, 297–305. [Google Scholar] [CrossRef] [PubMed]
  45. Cheng, Y.-H.; Su, L.-W.; Horng, Y.-B.; Yu, Y.-H. Effects of Soybean Meal Fermented by Species and on Growth Performance, Diarrhea Incidence, and Fecal Bacteria in Weaning Piglets. Ann. Anim. Sci. 2019, 19, 1051–1062. [Google Scholar] [CrossRef]
  46. Kong, Q.; He, G.-Q.; Jia, J.-L.; Zhu, Q.-L.; Ruan, H. Oral Administration of Clostridium butyricum for Modulating Gastrointestinal Microflora in Mice. Curr. Microbiol. 2011, 62, 512–517. [Google Scholar] [CrossRef]
  47. Olukomaiya, O.; Fernando, C.; Mereddy, R.; Li, X.; Sultanbawa, Y. Solid-state fermented plant protein sources in the diets of broiler chickens: A review. Anim. Nutr. 2019, 5, 319–330. [Google Scholar] [CrossRef]
  48. Alshemani, M.I.; Loh, T.C.; Foo, H.L.; Sazili, A.Q.; Lau, W.H. Effect of solid state fermentation on nutrient content and ileal amino acids digestibility of palm kernel cake in broiler chickens. Indian J. Anim. Sci. 2017, 87, 1135–1140. [Google Scholar]
  49. Xu, F.Z.; Zeng, X.G.; Ding, X.L. Effects of Replacing Soybean Meal with Fermented Rapeseed Meal on Performance, Serum Biochemical Variables and Intestinal Morphology of Broilers. Asian-Australas J. Anim. Sci. 2012, 25, 1734–1741. [Google Scholar] [CrossRef]
  50. Chen, Y.-C.; Yu, Y.-H. Bacillus licheniformis–fermented products improve growth performance and the fecal microbiota community in broilers. Poult. Sci. 2019, 99, 1432–1443. [Google Scholar] [CrossRef]
  51. Cheng, Y.-H.; Hsieh, Y.-C.; Yu, Y.-H. Effect of Cordyceps militaris Hot Water Extract on Immunomodulation-associated Gene Expression in Broilers, Gallus gallus. J. Poult. Sci. 2019, 56, 128–139. [Google Scholar] [CrossRef]
  52. Miller, P.J.; Koch, G. Newcastle Disease, Avian Paramyxoviruses and Avian Metapneumovirus in Diseases of Poultry; Swayne, D.E., Glisson, J.R., McDougald, L.R., Nolan, L.K., Suarez, D.L., Nair, V.L., Eds.; John Wiley&Sons Inc.: Hoboken, NJ, USA, 2013; pp. 89–138. [Google Scholar]
  53. Sharma, K.M.; Kumar, R.; Panwar, S.; Kumar, A. Microbial alkaline proteases: Optimization of production parameters and their properties. J. Genet. Eng. Biotechnol. 2017, 15, 115–126. [Google Scholar] [CrossRef] [PubMed]
  54. Liu, X.; Yu, X.; Zhang, T.; Wang, Z.; Xu, J.; Xia, J.; He, A.; Yan, Y.; Xu, J. Novel two-stage solid-state fermentation for erythritol production on okara–buckwheat husk medium. Bioresour. Technol. 2018, 266, 439–446. [Google Scholar] [CrossRef] [PubMed]
  55. Lin, E.-R.; Cheng, Y.-H.; Hsiao, F.; Proskura, W.; Dybus, A.; Yu, Y.-H. Optimization of solid-state fermentation conditions of Bacillus licheniformis and its effects on Clostridium perfringens-induced necrotic enteritis in broilers. Rev. Bras. De Zootec. 2019, 48, e20170298. [Google Scholar] [CrossRef]
  56. Zhang, Y.-R.; Xiong, H.-R.; Guo, X.-H. Enhanced viability of Lactobacillus reuteri for probiotics production in mixed solid-state fermentation in the presence of Bacillus subtilis. Folia Microbiol. 2014, 59, 31–36. [Google Scholar] [CrossRef] [PubMed]
  57. Weghoff, M.C.; Bertsch, J.; Müller, V. A novel mode of lactate metabolism in strictly anaerobic bacteria. Environ. Microbiol. 2015, 17, 670–677. [Google Scholar] [CrossRef]
  58. Detman, A.; Mielecki, D.; Pleśniak, Ł.; Bucha, M.; Janiga, M.; Matyasik, I.; Chojnacka, A.; Jędrysek, M.-O.; Błaszczyk, M.K.; Sikora, A. Methane-yielding microbial communities processing lactate-rich substrates: A piece of the anaerobic digestion puzzle. Biotechnol. Biofuels 2018, 11, 116. [Google Scholar] [CrossRef]
  59. Bintsis, T. Lactic acid bacteria as starter cultures: An update in their metabolism and genetics. AIMS Microbiol. 2018, 4, 665–684. [Google Scholar] [CrossRef]
  60. Al-Tabib, A.I.; Al-Shorgani, N.K.; Abu Hassan, H.; Hamid, A.A.; Kalil, M.S. Production of Acetone, Butanol, and Ethanol (ABE) by Clostridium acetobutylicum YM1 from Pretreated Palm Kernel Cake in Batch Culture Fermentation. BioResources 2017, 12, 2. [Google Scholar] [CrossRef]
  61. Kouzounis, D.; Hageman, J.A.; Soares, N.; Michiels, J.; Schols, H.A. Impact of Xylanase and Glucanase on Oligosaccharide Formation, Carbohydrate Fermentation Patterns, and Nutrient Utilization in the Gastrointestinal Tract of Broilers. Animals 2021, 11, 1285. [Google Scholar] [CrossRef]
  62. Kiers, J.L.; Van laeken, A.E.A.; Rombouts, F.M.; Nout, M.J.R. In vitro digestibility of Bacillus fermented soya bean. Int. J. Food Microbiol. 2000, 60, 163–169. [Google Scholar] [CrossRef]
  63. Kupryś-Caruk, M.; ChabŁOwska, B.; Michalczuk, M.; Stefańska, I. Comparison of the effect of lactic acid bacteria added to feed or water on growth performance, health status and gut microbiota of chickens broilers. Ann. Wars. Univ. Life Sci. SGGW Anim. Sci. 2019, 58, 55–67. [Google Scholar] [CrossRef]
  64. Papatsiros, V.; Katsoulos, P.; Koutoulis, K.; Karatzia, M.; Dedousi, A.; Christodoulopoulos, G. Alternatives to antibiotics for farm animals. CAB Rev. Perspect. Agric. Vet. Sci. Nutr. Nat. Resour. 2013, 8, 1–15. [Google Scholar] [CrossRef]
  65. Diener, M.; Helmle-Kolb, C.; Murer, H.; Scharrer, E. Effect of short-chain fatty acids on cell volume and intracellular pH in rat distal colon. Pflügers Archiv. 1993, 424, 216–223. [Google Scholar] [CrossRef] [PubMed]
  66. Kaczmarek, S.A.; Barri, A.; Hejdysz, M.; Rutkowski, A. Effect of different doses of coated butyric acid on growth performance and energy utilization in broilers. Poult. Sci. 2016, 95, 851–859. [Google Scholar] [CrossRef] [PubMed]
  67. Kumarasamy, D. Butyric Acid as an Antibiotic Substitute for Broiler Chicken–A Review. Adv. Anim. Vet. Sci. 2018, 6, 63–69. [Google Scholar]
  68. Sung Hwan, K.; Woonhee, J.; Il-Dong, C.; Ji-Woong, J.; Dong Eun, L.; Chul-Sung, H.; Geun-Bae, K.; Seong Soo, H.; Jae-Jung, S.; Jung Lyoul, L.; et al. Lactic Acid Bacteria Improves Peyer’s Patch Cell-Mediated Immunoglobulin A and Tight-Junction Expression in a Destructed Gut Microbial Environment. J. Microbiol. Biotechnol. 2016, 26, 1035–1045. [Google Scholar]
  69. Yang, F.; Hou, C.; Zeng, X.; Qiao, S. The use of lactic Acid bacteria as a probiotic in Swine diets. Pathogens 2015, 4, 34–45. [Google Scholar] [CrossRef] [PubMed]
  70. Schroeder, H.W., Jr.; Cavacini, L. Structure and function of immunoglobulins. J. Allergy Clin. Immunol. 2010, 125 (Suppl. S2), S41–S52. [Google Scholar] [CrossRef] [PubMed] [Green Version]
  71. Celi, P.; Cowieson, A.J.; Fru-Nji, F.; Steinert, R.E.; Kluenter, A.M.; Verlhac, V. Gastrointestinal functionality in animal nutrition and health: New opportunities for sustainable animal production. Anim. Feed. Sci. Technol. 2017, 234, 88–100. [Google Scholar] [CrossRef]
  72. Mondal, S.P.; Naqi, S.A. Maternal antibody to infectious bronchitis virus: Its role in protection against infection and development of active immunity to vaccine. Vet. Immunol. Immunopathol. 2001, 79, 31–40. [Google Scholar] [CrossRef]
  73. Gharaibeh, S.; Mahmoud, K. Decay of maternal antibodies in broiler chickens. Poult. Sci. 2013, 92, 2333–2336. [Google Scholar] [CrossRef] [PubMed]
  74. Hsiao, F.S.-H.; Artdita, C.A.; Hua, K.-F.; Tsai, C.-J.; Chien, Y.-H.; Chen, Y.-W.; Cheng, Y.-H.; Yu, Y.-H. Optimization of Emulsification Conditions on Ethanol Extract of Taiwanese Green Propolis Using Polysorbate and Its Immunomodulatory Effects in Broilers. Animals 2022, 12, 446. [Google Scholar] [CrossRef]
  75. Talebi, A.; Amirzadeh, B.; Mokhtari, B.; Gahri, H. Effects of a multi-strain probiotic (PrimaLac) on performance and antibody responses to Newcastle disease virus and infectious bursal disease virus vaccination in broiler chickens. Avian. Pathol. 2008, 37, 509–512. [Google Scholar] [CrossRef]
  76. Talebi, A.; Amani, A.; Pourmahmod, M.; Saghaei, P.; Rezaie, R. Synbiotic enhances immune responses against infectious bronchitis, infectious bursal disease, Newcastle disease and avian influenza in broiler chickens. Vet. Res. Forum. 2015, 6, 191–197. [Google Scholar] [PubMed]
  77. Khalifa, E. Effect of probiotics and Escherichia coli infection on performance of some viral vaccination in broiler chicks. Anim. Health Res. J. 2014, 2, 69–78. [Google Scholar]
  78. Cortés-Coronado, R.; Gomez-Rosales, S.; Angeles, M.; Casaubon-Huguenin, M.; Dalgaard, T. Influence of a yeast fermented product on the serum levels of the mannan-binding lectin and the antibodies against the Newcastle disease virus in Ross broilers. J. Appl. Poult. Res. 2016, 26, pfw044. [Google Scholar] [CrossRef]
  79. Kjærup, R.M.; Dalgaard, T.S.; Norup, L.R.; Bergman, I.-M.; Sørensen, P.; Juul-Madsen, H.R. Adjuvant effects of mannose-binding lectin ligands on the immune response to infectious bronchitis vaccine in chickens with high or low serum mannose-binding lectin concentrations. Immunobiology 2014, 219, 263–274. [Google Scholar] [CrossRef]
  80. Long, M.; Yang, S.; Li, P.; Song, X.; Pan, J.; He, J.; Zhang, Y.; Wu, R. Combined Use of C. butyricum Sx-01 and L. salivarius C-1-3 Improves Intestinal Health and Reduces the Amount of Lipids in Serum via Modulation of Gut Microbiota in Mice. Nutrients 2018, 10, 810. [Google Scholar] [CrossRef]
  81. Wang, T.; Teng, K.; Liu, Y.; Shi, W.; Zhang, J.; Dong, E.; Zhang, X.; Tao, Y.; Zhong, J. Lactobacillus plantarum PFM 105 Promotes Intestinal Development Through Modulation of Gut Microbiota in Weaning Piglets. Front. Microbiol. 2019, 10, 90. [Google Scholar] [CrossRef]
  82. Yaghobfar, A.; Kalantar, M.J.B.J.o.P.S. Effect of Non-Starch Polysaccharide (NSP) of Wheat and Barley Supplemented with Exogenous Enzyme Blend on Growth Performance, Gut Microbial, Pancreatic Enzyme Activities, Expression of Glucose Transporter (SGLT1) and Mucin Producer (MUC2) Genes of Broiler Chickens. Braz. J. Poult. Sci. 2017, 19, 629–638. [Google Scholar]
  83. Singh, K.M.; Shah, T.; Deshpande, S.; Jakhesara, S.J.; Koringa, P.G.; Rank, D.N.; Joshi, C.G. High through put 16S rRNA gene-based pyrosequencing analysis of the fecal microbiota of high FCR and low FCR broiler growers. Mol. Biol. Rep. 2012, 39, 10595–10602. [Google Scholar] [CrossRef] [PubMed]
  84. Wang, L.; Fang, M.; Hu, Y.; Yang, Y.; Yang, M.; Chen, Y. Characterization of the most abundant Lactobacillus species in chicken gastrointestinal tract and potential use as probiotics for genetic engineering. Acta Biochim. et Biophys. Sin. 2014, 46, 612–619. [Google Scholar] [CrossRef] [PubMed]
  85. Lima, J.; Auffret, M.D.; Stewart, R.D.; Dewhurst, R.J.; Duthie, C.-A.; Snelling, T.J.; Walker, A.W.; Freeman, T.C.; Watson, M.; Roehe, R. Identification of Rumen Microbial Genes Involved in Pathways Linked to Appetite, Growth, and Feed Conversion Efficiency in Cattle. Front. Genet. 2019, 10, 701. [Google Scholar] [CrossRef]
  86. Sell-Kubiak, E.; Wimmers, K.; Reyer, H.; Szwaczkowski, T. Genetic aspects of feed efficiency and reduction of environmental footprint in broilers: A review. J. Appl. Genet. 2017, 58, 487–498. [Google Scholar] [CrossRef] [PubMed]
  87. Stanley, D.; Hughes, R.J.; Geier, M.S.; Moore, R.J. Bacteria within the Gastrointestinal Tract Microbiota Correlated with Improved Growth and Feed Conversion: Challenges Presented for the Identification of Performance Enhancing Probiotic Bacteria. Front. Microbiol. 2016, 7, 187. [Google Scholar] [CrossRef]
  88. Torok, V.A.; Hughes, R.J.; Mikkelsen, L.L.; Perez-Maldonado, R.; Balding, K.; MacAlpine, R.; Percy, N.J.; Ophel-Keller, K. Identification and characterization of potential performance-related gut microbiotas in broiler chickens across various feeding trials. Appl. Environ. Microbiol. 2011, 77, 5868–5878. [Google Scholar] [CrossRef]
  89. Peng, Q.; Zeng, X.F.; Zhu, J.L.; Wang, S.; Liu, X.T.; Hou, C.L.; Thacker, P.A.; Qiao, S.Y. Effects of dietary Lactobacillus plantarum B1 on growth performance, intestinal microbiota, and short chain fatty acid profiles in broiler chickens. Poult. Sci. 2016, 95, 893–900. [Google Scholar] [CrossRef]
  90. He, L.; Wang, C.; Simujide, H.; Aricha, H.; Zhang, J.; Liu, B.; Zhang, C.; Cui, Y.; Aorigele, C. Effect of Early Pathogenic Escherichia coli Infection on the Intestinal Barrier and Immune Function in Newborn Calves. Front. Cell. Infect. Microbiol. 2022, 12, 818276. [Google Scholar] [CrossRef]
  91. Duarte, M.E.; Tyus, J.; Kim, S.W. Synbiotic Effects of Enzyme and Probiotics on Intestinal Health and Growth of Newly Weaned Pigs Challenged With Enterotoxigenic F18+Escherichia coli. Front. Vet. Sci. 2020, 7, 573. [Google Scholar] [CrossRef]
  92. Mattock, E.; Blocker, A.J. How Do the Virulence Factors of Shigella Work Together to Cause Disease? Front. Cell. Infect. Microbiol. 2017, 7, 64. [Google Scholar] [CrossRef] [Green Version]
  93. Kim, G.B.; Seo, Y.M.; Kim, C.H.; Paik, I.K. Effect of dietary prebiotic supplementation on the performance, intestinal microflora, and immune response of broilers. Poult. Sci. 2011, 90, 75–82. [Google Scholar] [CrossRef] [PubMed]
  94. Hou, Q.; Kwok, L.-Y.; Zheng, Y.; Wang, L.; Guo, Z.; Zhang, J.; Huang, W.; Wang, Y.; Leng, L.; Li, H.; et al. Differential fecal microbiota are retained in broiler chicken lines divergently selected for fatness traits. Sci. Rep. 2016, 6, 37376. [Google Scholar] [CrossRef] [PubMed]
  95. Díaz-Sánchez, S.; Perrotta, A.R.; Rockafellow, I.; Alm, E.J.; Okimoto, R.; Hawken, R.; Hanning, I. Using fecal microbiota as biomarkers for predictions of performance in the selective breeding process of pedigree broiler breeders. PLoS ONE 2019, 14, e0216080. [Google Scholar] [CrossRef] [PubMed] [Green Version]
Figure 1. Effect of different initial moisture content on Lactobacillus species (a) and C. butyricum (b) growth in mixed SSF of okara and CM. Values are expressed as mean ± SD (n = 3). Means of different fermentation during time treatment with different superscript letters are significantly different at p < 0.05.
Fermentation 08 00478 g001
Figure 2. Effect of the NSPase supplementation on total Lactobacillus viable count (a); water contents (b); and neutral detergent fiber contents (c) of okara and CM fermentation under various fermentation product contents. Mixed okara and copra meal (control, CTRL), mixed okara and copra meal plus exogenous NSPases (NSP enzyme), mixed okara and copra meal plus probiotics (Probiotics), mixed okara and copra meal plus probiotics and NSPases (mixed). Values are expressed as mean ± SD (n = 3). a–c Means of different fermentation during time treatment with different superscript letters are significantly different at p < 0.05.
Fermentation 08 00478 g002
Figure 3. Effect of 55% initial moisture of fermentation okara and CM with the combination of mixed probiotics and NSPases supplementation on reducing sugar content (a); lactic acid contents (b); and butyric acid contents (c) with different fermentation durations. Values are expressed as mean ± SD (n = 3). a–d Means of different fermentation during time treatment with different superscript letters are significantly different at p < 0.05.
Fermentation 08 00478 g003
Figure 4. Effect of SSF on the soy globulins contents of okara and CM.
Fermentation 08 00478 g004
Figure 5. Venn diagram of observed OTU distribution at 97% similarity in each sample group. CTRL: basal diet; FOCM1.25: basal diet plus 1.25% of FOCM; FOCM2.5: basal diet plus 2.5% of FOCM; FOCM5.0: basal diet plus 5.0% of FOCM. Data are mean values of three replicates per treatment.
Fermentation 08 00478 g005
Figure 6. Comparison of the bacteria communities of the ileal contents by advanced analysis. Principal component analysis (a) plots of basal diet as the control (CTRL), basal diet plus 1.25% of FOCM (FOCM1.25), basal diet plus 2.5% of FOCM (FOCM2.5), and basal diet plus 5.0% of FOCM (FOCM5.0) (n = 3). Principal coordinate analysis of weighted UniFrac (b) and unweighted UniFrac (c) distance of the ileum bacterial communities from CTRL, FOCM1.25, FOCM2.5, and FOCM5.0 (n = 3).
Fermentation 08 00478 g006
Figure 7. Comparative analysis of the ileal contents across the samples. The beta diversity index of the ileal contents from the basal diet as control (CTRL), basal diet plus 1.25% of FOCM (FOCM1.25), basal diet plus 2.5% of FOCM (FOCM2.5), and basal diet plus 5.0% of FOCM (FOCM5.0) based on weighted UniFrac metrics (n = 3) (a) and unweighted UniFrac metrics (n = 3) (b).
Fermentation 08 00478 g007
Table 1. Nutrient composition of experiment diets (starter and finisher diets).
CTRLFOCM1.25FOCM2.5FOCM5.0
Ingredients %starterfinishingstarterfinishingstarterfinishingstarterfinishing
Corn, yellow4758.4346.3657.6445.7156.8544.4255.26
Soybean meal (44.0% CP)44.1833.7543.5733.2942.9732.8341.7631.92
Fish meal54545454
FOCM001.251.252.52.555
CaCO3, 38%22222222
CaHPO411111111
Salt0.40.40.40.40.40.40.40.4
Choline, 50%0.020.020.020.020.020.020.020.02
Vitamin premix 10.10.10.10.10.10.10.10.1
Mineral premix 20.10.10.10.10.10.10.10.1
Methionine 99.5%0.20.20.20.20.20.20.20.2
Calculated composition
Crude protein % 26.2521.9626.0121.825.7821.6425.3521.31
ME, kcal/kg 3361.963345.63338.403321.183314.0232973265.283248.78
Fat % 2.632.572.652.592.682.612.722.65
Fiber % 4.654.084.784.214.94.345.164.61
Ca % 1.41.321.371.301.361.281.321.25
P % 0.740.680.730.670.720.660.70.64
Lysine % 1.341.341.321.321.311.311.2731.27
Methionine + Cystine % 11111111
Moisture % 131313.5213.5314.0514.0515.115.1
1 Premix supplied per kg of diet: 6000 IU of vitamin A, 900 IU of vitamin D, 30 IU of vitamin E, 3 mg of vitamin K, 6 mg of vitamin B2, 18 mg of pantothenic acid, 60 mg of niacin, 30 μg of vitamin B12; 2 Premix supplied per kg of diet: 20 mg of Cu, 100 mg of Zn, 140 mg of Fe, 4 mg of Mn, 0.1 mg of Se, 0.2 mg of I.
Table 2. Effect of FOCM supplemented in diet on body weight and average daily gain in broilers.
CTRL 1FOCM1.25FOCM2.5FOCM5.0
ItemsMeanSDMeanSDMeanSDMeanSDp-Value
Body weight (g/bird)
1 d46.440.1746.460.1046.460.1946.440.150.99
7 d168.925.88177.256.74177.256.37176.315.790.09
14 d417.2322.14435.8521.92433.3831.43424.3811.400.49
21 d808.0650.06864.2160.67847.0252.49818.6733.710.23
28 d1274.39101.051409.97164.421342.58142.231312.0861.340.31
35 d1819.78185.972013.17230.311966.03230.311880.92230.310.30
Average daily gain (g/d/bird)
1~7 d17.500.8318.680.9718.680.8718.550.820.10
7~14 d35.472.8236.942.3136.593.9335.441.340.71
14~21 d55.834.3661.196.2159.093.5756.333.950.19
21~28 d66.6210.9477.9715.6370.7915.1070.495.590.48
28~35 d77.9113.0286.1710.8289.067.1881.2611.870.32
1~35 d50.675.3156.196.5854.844.9652.413.950.30
1 CTRL: basal diet; FOCM1.25: basal diet plus 1.25% of fermented okara and CM; FOCM2.5: basal diet plus 2.5% of fermented okara and CM; FOCM5.0: basal diet plus 5.0% of fermented okara and CM. Data are mean values of six replicates per treatment.
Table 3. Effect of FOCM supplemented in diet on average daily feed intake and feed conversion rate in broilers.
CTRL 1FOCM1.25FOCM2.5FOCM5.0
ItemsMeanSDMeanSDMeanSDMeanSDp-Value
Average daily feed intake (g/d/bird)
1~7 d20.821.4020.380.1220.400.0220.400.000.64
7~14 d40.091.5242.222.4844.025.6943.761.770.18
14~21 d77.35 b5.0285.70 a7.3281.36 ab8.3282.62 ab6.550.24
21~28 d115.1913.07127.0114.27116.6421.37123.638.910.49
28~35 d135.7617.48135.4325.45139.0715.91139.0413.000.98
1~35 d77.846.9182.158.7980.308.5981.895.240.74
FCR (daily feed intake/daily gain)
1~7 d1.200.141.090.051.100.051.100.050.13
7~14 d1.130.071.140.051.210.151.240.030.17
14~21 d1.390.091.410.121.380.131.470.020.43
21~28 d1.750.161.660.181.660.161.760.070.54
28~35 d1.75 a0.101.56 b0.161.56 b0.081.72 a0.120.01
1~35 d1.54 a0.051.46 b0.021.46 b0.041.56 a0.030.01
1 CTRL: basal diet; FOCM1.25: basal diet plus 1.25% of fermented okara and CM; FOCM2.5: basal diet plus 2.5% of fermented okara and CM; FOCM5.0: basal diet plus 5.0% of fermented okara and CM. Data are mean values of six replicates per treatment. a,b Means within a row that have no common superscript are significantly different (p < 0.05).
Table 4. Effect of FOCM supplemented in diet on blood biochemistry determined in broilers.
CTRL 1FOCM1.25FOCM2.5FOCM5.0
Items 2MeanSDMeanSDMeanSDMeanSD
ALB (g/dL)
21 d1.100.131.280.231.070.251.120.20
35 d1.10 ab0.170.90 b0.181.00 ab0.381.25 a0.21
GLU (mg/dL)
21 d324.5037.10335.5054.40296.1749.47319.5059.29
35 d310.8356.71280.8323.68264.8324.06296.8327.64
AST (U/L)
21 d194.8336.61206.3335.52194.8342.32211.0049.90
35 d293.6754.07364.67161.76313.83117.60315.33178.44
ALT (U/L)
21 d0.670.521.330.821.330.520.670.52
35 d1.501.051.170.411.000.891.831.47
TP (g/dL)
21 d2.520.272.780.382.380.482.380.48
35 d2.43 ab0.291.98 b0.662.3 ab0.682.73 a0.39
1 CTRL: basal diet; FOCM1.25: basal diet plus 1.25% of fermented okara and CM; FOCM2.5: basal diet plus 2.5% of fermented okara and CM; FOCM5.0: basal diet plus 5.0% of fermented okara and CM; 2 ALB: albumin; GLU: glucose; AST: aspartate aminotransferase; ALT: alanine aminotransferase; TP: total protein. Data are mean values of six replicates per treatment. a,b Means within a row that have no common superscript are significantly different (p < 0.05).
Table 5. Effect of FOCM supplemented in diet on antibody titration of serum in broilers.
CTRL 1FOCM1.25FOCM2.5FOCM5.0
Items 2MeanSDMeanSDMeanSDMeanSDp-Value
ND
21 d42.6724.0937.8323.6524.0019.6022.6710.630.26
35 d14.679.3524.0021.4726.678.2641.3343.650.36
IB
21 d157.3383.37313.33299.87167.3391.48184.5081.580.35
35 d322.50167.18181.1763.77249.0094.91410.00302.190.19
1 CTRL: basal diet; FOCM1.25: basal diet plus 1.25% of fermented okara and CM; FOCM2.5: basal diet plus 2.5% of fermented okara and CM; FOCM5.0: basal diet plus 5.0% of fermented okara and CM; 2 ND: Newcastle disease; IB: infectious bronchitis. Data are mean values of six replicates per treatment.
Table 6. Effect of FOCM supplemented in diet on broiler intestinal morphology.
CTRL 1FOCM1.25FOCM2.5FOCM5.0
ItemsMeanSDMeanSDMeanSDMeanSDp-Value
21-days oldDuodenumVillus height (μm)1431.83 c148.781831.20 a122.861741.17 ab129.751564.57 bc213.230.01
Crypt depth (μm)222.5066.37214.3154.07213.6765.74180.7636.760.60
Villus height/Crypt depth6.932.149.012.428.772.698.921.950.37
JejunumVillus height (μm)1344.00300.311438.83118.141363.9784.731388.27122.240.81
Crypt depth (μm)188.6769.88187.1724.00194.3328.39213.4344.990.74
Villus height/Crypt depth8.153.767.851.567.171.286.650.880.63
IleumVillus height (μm)890.17157.49989.97179.29977.44316.00975.50279.240.88
Crypt depth (μm)180.5029.62160.5032.29206.2093.90163.1753.950.52
Villus height/Crypt depth4.990.926.251.085.322.306.241.710.42
35-days oldDuodenumVillus height (μm)1825.83188.521816.67277.581818.83220.301767.83256.190.97
Crypt depth (μm)181.6715.98151.8321.08160.0029.40177.8336.280.20
Villus height/Crypt depth10.101.2012.212.7811.632.0110.413.010.38
JejunumVillus height (μm)1571.17 ab187.471637.50 ab162.121736.17 a163.761451.83 b161.300.05
Crypt depth (μm)178.8351.71201.5061.56186.1747.40203.1757.920.84
Villus height/Crypt depth9.533.369.375.3410.134.087.461.510.66
IleumVillus height (μm)940.83 bc79.381043.83 ab148.931095.67 a137.58828.17 c111.260.01
Crypt depth (μm)209.5 a54.25168.67 ab31.30179.50 ab33.57138.33 b10.150.02
Villus height/Crypt depth4.811.586.381.476.231.146.020.960.18
1 CTRL: basal diet; FOCM1.25: basal diet plus 1.25% of fermented okara and CM; FOCM2.5: basal diet plus 2.5% of fermented okara and CM; FOCM5.0: basal diet plus 5.0% of fermented okara and CM. Data are mean values of six replicates per treatment. a–c Means within a row that have no common superscript are significantly different (p < 0.05).
Table 7. The alpha diversity indices of ileal microbiota in 21-day-old broilers.
CTRL 1FOCM1.25FOCM2.5FOCM5.0
ItemsMeanSDMeanSDMeanSDMeanSDp-Value
Chao11274.33431.58127.3364.84523.67650.71596451.740.08
Shannon7.48 a1.121.98 b0.564.31 ab3.164.18 ab1.980.05
Simpson
reciprocal
71.0751.252.630.4128.1543.456.454.820.12
Fisher’s alpha249.53108.4515.699.0797.19136.9296.9585.580.09
1 CTRL: basal diet; FOCM1.25: basal diet plus 1.25% of FOCM; FOCM2.5: basal diet plus 2.5% of FOCM; FOCM5.0: basal diet plus 5.0% of FOCM. Data are mean values of three replicates per treatment. a,b Means within a row that have no common superscript are significantly different (p < 0.05).
Table 8. Effect of FOCM supplemented in diet on ileal microbiota relative abundance in 21-day-old broilers.
CTRL 1FOCM1.25FOCM2.5FOCM5.0p-Value
Relative Abundance (%)MeanSDMeanSDMeanSDMeanSD
Phylum
Firmicutes52.87 b5.7496.66 a2.0585.41 a18.8492.70 a3.300.02
Proteobacteria10.936.000.450.342.152.281.671.350.06
Bacteroidetes14.322.390.660.448.0611.734.864.180.14
Genus
Bifidobacterium8.236.430.010.011.422.421.061.690.08
Lactobacillus3.862.6659.3025.5764.8437.4162.3132.650.08
Lachnospiraceae_unclassified5.152.680.030.021.782.940.740.940.06
Escherichia-Shigella2.26 a0.190.31 b0.071.01 b0.800.50 b0.430.01
1 CTRL: basal diet; FOCM1.25: basal diet plus 1.25% of FOCM; FOCM2.5: basal diet plus 2.5% of FOCM; FOCM5.0: basal diet plus 5.0% of FOCM. Data are mean values of three replicates per treatment; a,b Means of same row without common superscript are significantly different (p < 0.05) (n = 3).
Publisher’s Note: MDPI stays neutral with regard to jurisdictional claims in published maps and institutional affiliations.