Article

Screening and Identification of Yeasts from Fruits and Their Coculture for Cider Production

1
Department of Seafood Science, National Kaohsiung University of Science and Technology, 142, Haizhuan Rd., Kaohsiung City 811, Taiwan
2
Institute of Food Science and Technology, College of Bioresources and Agriculture, National Taiwan University, 1, Sec 4, Roosevelt Rd., Taipei 10617, Taiwan
3
Institute of Biotechnology, College of Bioresources and Agriculture, National Taiwan University, 1, Sec 4, Roosevelt Rd., Taipei 10617, Taiwan
4
School of Food Safety, Taipei Medical University, 250, Wu-Xing Street, Taipei 11031, Taiwan
5
Department of Food Science and Technology, Central Taiwan University of Science and Technology, 666, Buzi Rd., Beitun District, Taichung 40601, Taiwan
6
Department of Optometry, Asia University, 500, Lioufeng Rd., Wufeng, Taichung 41354, Taiwan
7
Department of Food Science and Biotechnology, National Chung Hsing University, Taichung 40604, Taiwan
8
Department of Medical Research, China Medical University Hospital, China Medical University, 91, Hsueh-Shih Road, Taichung 40402, Taiwan
*
Authors to whom correspondence should be addressed.
Chih-Yao Hou and Pei-Hsiu Huang contributed equally to this work.
Fermentation 2022, 8(1), 1; https://doi.org/10.3390/fermentation8010001
Submission received: 18 November 2021 / Revised: 15 December 2021 / Accepted: 18 December 2021 / Published: 21 December 2021
(This article belongs to the Special Issue Advances in Beverages, Food, Yeast and Brewing Research)

Abstract

:
Coculturing non-Saccharomyces yeasts with Saccharomyces cerevisiae could enrich the aromatic complexity of alcoholic beverages during cider brewing. Therefore, the present study performed rapid strain screening via selective culture medium and aroma analysis and adopted a response surface methodology to optimize fermentation conditions to produce 2-phenylethyl acetate (PEA), which presents a rose and honey scent. The effects of coculturing yeasts on cider quality were evaluated through hedonic sensory analysis and the check-all-that-apply (CATA) method. Hanseniaspora vineae P5 and S. cerevisiae P1 produced ciders with high levels of PEA and 2-phenylethanol, respectively. The optimal fermentation process consisted of sequential inoculation with a 31 h delay between inoculations, followed by fermentation for 14.5 d at 18.7 °C, yielding 17.41 ± 0.51 mg/L of PEA, which was 4.6-fold higher than that obtained through the unoptimized fermentation process. Additionally, the CATA results revealed that the cider produced through coculturing was associated with descriptors such as “smooth taste”, “honey”, “pineapple”, and “fruity”, which can be attributed to the high ethyl acetate and PEA levels in the cider.

1. Introduction

Cider is a traditional alcoholic beverage brewed by fermenting apple juice with yeast. During fermentation, microbes produce compounds such as ethanol, higher alcohols, ethyl acetate (EA), and ethyl formate, which give cider its unique flavor [1,2]. Several recent studies have demonstrated that coculturing non-Saccharomyces yeasts with Saccharomyces cerevisiae could improve the complexity of the alcohol aromas. Saccharomyces cerevisiae is the primary microorganism responsible for alcoholic fermentation [3]. Fermentation involves the transformation of sugar into ethanol and carbon dioxide together with the production of metabolites that contribute to the sensorial properties of the product, such as aroma. Different biosynthetic pathways interact during the formation of the aroma of alcoholic beverages [3,4]. Moreover, aromatic complexity strongly relates to yeast strain [5,6,7,8]. In the past, spontaneous fermentation was practiced and characterized by non-Saccharomyces yeasts during the early stages of fermentation [4]. Anne Gschaedler et al. (2021) reported the potential use of different non-Saccharomyces species to carry out the fermentation of apple juice and discussed the importance of certain nutrients in enabling an efficient alcoholic fermentation process and the generation of desirable volatile compounds for cider production [9]. Consequently, yeast strain selection has become increasingly crucial in the cider industry.
Yeasts are widespread in nature and form symbiotic relationships with various plants and insects. For example, the volatile compounds produced by flower and fruit yeasts (e.g., ethanol, EA, isoamyl acetate, and 2-phenylethyl acetate (PEA)) attract insects and therefore play a critical role in plant propagation [10,11]. PEA is often described as presenting rose- and honey-like aromas; its precursor, 2-phenylethanol (PE), is responsible for rose-like aromas. Both PE and PEA are generally recognized as safe (GRAS) additives and are widely used in food and cosmeceutical industries [12,13].
In this study, we applied selective cultivation and aroma analysis to identify new yeast strains with brewing potential and then adopted a response surface methodology (RSM) to optimize fermentation conditions. The effects of yeast strains on cider quality were evaluated using instrumental analysis (i.e., changes in the sugar, alcohol, glycerol, and aroma contents of the cider), hedonic sensory analysis, and the check-all-that apply (CATA) method.

2. Material and Methods

2.1. Strain Screening and Identification

Strain screening and identification were performed using the methods of Lai et al. [14]. Apples, cantaloupes, grapes, guavas, kiwis, mangoes, passion fruits, pitayas, plums, and blueberries were obtained from local markets and supermarkets in New Taipei City, Taiwan. The stalk and skin of the fruits were added to yeast extract peptone dextrose (YPD) agars with 0.1 g/L chloramphenicol and cultured statically at 28 °C for 48 h. The yeast pellets at the bottom were subsequently separated and purified. The yeast pellets were taken and diluted by 0.1% peptone water. The yeast solution was quadrant-streaked on YPD agar and cultured at 25 °C for 36 h. The single colony was picked for another quadrant streak culture. This step was repeated at least three times before being separated and purified. Thereafter, 100 mL of YPD broth supplemented with 20% glucose was added to a conical flask, which was inoculated with 1 mL of a 5% (w/v) inoculum of the separated and purified yeast strain. Each yeast strain was cultured at 25 °C for 120 h at 100 rpm. Subsequently, the primary aroma compounds of the fermentation broths were analyzed using GC–FID [14,15]. The procedure is briefly described as follows. The fermentation broth (25 mL) was centrifuged at 7197× g for 8 min at 4 °C. Thereafter, 10 mL of ether was added to the supernatant, which was subsequently vortexed for 30 s. The procedure was repeated twice. Anhydrous sodium sulfate was added to the supernatant and the dehydrated product was decanted into a vacuum concentrator. The supernatant was evaporated to 1–2 mL followed by filtration using a 0.22 µm filter membrane. Thereafter, a GC–FID system (GC-System 7890B, Agilent Technologies, Santa Clara, CA, USA) was used to analyze the EA, isoamyl acetate, PEA, and PE content of the samples, utilizing the analytical parameters summarized in Supplementary Table S2 [16].
The strains with winemaking potential were identified by sequencing their internal transcribed spacer (ITS) region using the methods of Lai et al. (2019). The selected strains were cultured at 25 °C for 120 h at 100 rpm in a simulated apple juice medium (100% apple juice; Tree Top Inc., Washington, USA). Colony morphologies of H. vineae P5 and S. cerevisiae P1 strains were analyzed using YPD agar and Wallerstein Laboratory (WL) nutrient agar (Bilife, Milan, Italy). The sexual and asexual reproduction phases of the yeast strains were observed using a microscope [17].

2.2. Analysis of Yeast Flora

The fermentation broths were serially diluted with 0.1% peptone and subsequently plated on WL agar in 0.1 mL aliquots. Colony morphologies were observed after 3 d of incubation at 3 °C. H. vineae P5 formed green colonies with slightly raised centers, whereas S. cerevisiae P1 formed smooth, white-to-milky-white colonies with flat or slightly raised centers.

2.3. Sugar, Ethanol, and Glycerol Content of the Cider Samples

After fermentation, 1 mL of fermented broth was centrifuged at 7197× g for 8 min. Subsequently, 0.2 mL of the supernatant was homogenized with 0.8 mL of double-distilled water, followed by filtration through a 0.22 μm filter membrane. The filtrate was analyzed for its sugar, ethanol, and glycerol content using a high-performance liquid chromatography (HPLC) system (LC-10ADvp, SHIMADZU, Kyoto, Japan) equipped with a refractive index detector (Shodex, Tokyo, Japan). HPLC analysis was performed in isocratic elution mode at a flow rate of 0.5 mL/min with HPLC grade water (Thermo Scientific and Fisher Chemical) and using a Repro-Gel Ca++ column (9 µm, 300mm × 8 mm, Dr. Maisch GmbH, Ammerbuch-Entringen, Germany). The temperature of the column oven was set to 35 °C, and the analysis time was 40 min [18].

2.4. Optimization of Cider-Brewing Conditions

Fuji apples (Boston, WA, USA) were cleaned and juiced using a slow juicer (MJ-L500, Panasonic, Shenzhen, China). The apple juice was centrifugated at 17,664× g for 20 min at 4 °C to obtain the supernatant, which was adjusted to 20 °Bx by adding glucose. To make cider, inoculum solution (1 mL) was added to apple juice (100 mL), following the predetermined conditions of each experiment. The primary aroma compounds of the ciders were analyzed using GC–FID.

2.5. Inoculation Order for the Coculture System

For each experiment, the fermentation broth was fermented at 25 °C for 5 d before sampling. The experimental groups were as follows: (1) S: single inoculation with S. cerevisiae P1; (2) S0H2: initially inoculated with S. cerevisiae P1, followed by inoculation with H. vineae P5 after 2 d; (3) S0H1: initially inoculated with S. cerevisiae P1, followed by inoculation with H. vineae P5 after 1 d; (4) S0H0.5: initially inoculated with S. cerevisiae P1, followed by inoculation with H. vineae P5 after 12 h; (5) S0H2: simultaneously inoculated with S. cerevisiae P1 and H. vineae P5; (6) S0.5H0: initially inoculated with H. vineae P5, followed by inoculation with S. cerevisiae P1 after 12 h; (7) S1H0: initially inoculated with H. vineae P5, followed by inoculation with S. cerevisiae P1 after 1 d; (8) S2H0: initially inoculated with H. vineae P5, followed by inoculation with S. cerevisiae P1 after 2 d; and (9) H: single inoculation with H. vineae P5. In all treatments, the inoculation size of S. cerevisiae P1 or H. vineae P5 were both 5 × 10⁶ CFU/mL. This meant the initial yeast population of the H0S0 treatments was two times higher than in the treatments H and S.

2.6. Fermentation Duration Experiments

Inoculation was performed following the S0.5H0 protocol. Subsequent fermentation was performed at 25 °C followed by sampling after 1, 3, 5, 7, 9, and 11 d of fermentation for aroma analysis.

2.7. Fermentation Temperature Experiments

The fermentation process was conducted at different temperatures (15, 20, 25, 30, and 35 °C), following the S0.5H0 protocol, with samples collected after 7 d of fermentation for aroma analysis.

2.8. Initial Sugar Content Experiments

Inoculation was performed following the S0.5H0 protocol, and samples were collected after 7 d of fermentation at 25 °C. The initial fermentation sugar content was 15, 20, 25, 30, and 35 °Bx.

2.9. RSM Experiments

RSM was performed using the Box–Behnken design and the following factors and values: inoculation time (X1): S0H0, S1H0, and S2H0; fermentation time (X2): 7, 11, and 15 d; and fermentation temperature (X3): 15, 20, and 25 °C. Fermented samples were taken for PEA analysis (Table 1). Design Expert 12 software (Stat-Ease Inc., Minneapolis, MN, USA) was used to predict the optimal values of the three variables according to the following second-order polynomial Equation (1):
Y = B 0 + B i X i + B ii X i 2 + B ij X i X j
where Y is the dependent variable and represents the predicted response for PEA production; B0 represents the fitted response at the design’s center point; Bi, Bii, and Bij are the coefficients for linear, quadratic, and cross-product regression, respectively; and Xi and Xj (where j = i + 1) are the coded independent variables (X1 = inoculation time, X2 = fermentation time, and X3 = fermentation temperature).

2.10. Sensory Evaluation

Sensory evaluation was performed using the experimental and analytical methods of Liou [19]. Tasting samples included two experimental ciders and two commercially available ciders. The experimental group consisted of a pure culture cider and coculture cider, both of which were brewed from 1000 mL of apple juice in food-grade wide-mouth serum bottles. All samples were decanted into clean glass containers and pasteurized in a water bath at 65 °C for 1 h. Pasteurized samples were stored at 4 °C until further use. The commercial products used in this study, namely, Somersby Apple Cider and Strongbow Gold Apple Cider, were purchased from Family Mart and Pxmart (Taipei, Taiwan), respectively, and were stored at 4 °C. The pure culture cider, coculture cider, Somersby Apple Cider, and Strongbow Gold Apple Cider were denoted as samples 263, 377, 138, and 924, respectively.
Forty volunteer tasters were recruited from National Taiwan University. Transparent glass tasting cups filled with 15 mL of each sample were distributed to the tasters according to a Latin square design. Prior to tasting, the tasters were asked to consume a saltine cracker and rinse their mouths until no residual taste or odor remained, to minimize the transfer effect. The tasting forms comprised two parts: (1) hedonic analysis, where the tasters used a 9-point hedonic scale to rate each product in terms of overall liking, appearance, aroma, flavor, taste, and aftertaste; and (2) CATA analysis. The descriptors selected by Sommer et al. [20] for the sensory qualities of cider, which included 13 appearance characteristics, 69 aroma characteristics, 10 flavor characteristics, 12 taste characteristics, 10 aftertaste characteristics, four conceptual characteristics, and eight perception characteristics, were employed for the CATA analysis (Supplementary Table S1). The tasters were asked to check all applicable descriptors.

2.11. Statistical Analysis

Each experiment was performed in triplicate and the results were expressed as the mean and standard deviation. Data were organized and analyzed using Microsoft Excel (Microsoft, Redmond, WA, USA), and GraphPad Prism 8 (GraphPad Software Inc., San Diego, CA, USA) was used to perform statistical calculations and analysis of variance (ANOVA). Statistical significance (α) was defined as 0.05. RSM analysis was performed using Minitab (Minitab Inc., University City, PA, USA) and Design Expert 12 (Stat-Ease, Inc. Minneapolis, MN, USA). Sensory evaluation results (i.e., the data from the tasting forms) were organized in Microsoft Excel. GraphPad Prism 8 was adopted for ANOVA of the hedonic analysis results to identify statistically significant differences (p < 0.05) between the analyzed ciders in terms of overall liking, appearance, aroma, flavor, taste, and aftertaste. Cochran’s Q test was performed on the CATA results using NCSS 2020 (NCSS LLC., Kaysville, UT, USA) to identify significant differences among the descriptors for each product (p < 0.05). Correspondence analysis of the descriptors selected by more than 20% of the tasters (i.e., selected more than eight times) was performed using the Pareto principle to determine how the descriptors related to each cider.

3. Results and Discussion

3.1. Strain Selection and Identification

The fermentation broths were subjected to aroma screening. The strains with aroma-generating potential were: A7 from apples (21.31 mg/L PE); C3 (23.47 mg/L PE), C4 (95.92 mg/L EA), and C5 (109.42 mg/L EA) from canteloupes; G1 (4.74 mg/L isoamyl acetate and 39.13 mg/L PE), G3 (63.77 mg/L EA), and G5 (98.65 mg/L EA) from grapes; K3 (115.07 mg/L EA, 18.16 mg/L PEA, and 29.18 mg/L PE) and K5 (41.03 mg/L EA, 22.00 mg/L PEA, and 48.01 mg/L PE) from kiwis; M4 (67.66 mg/L EA) from mangoes; PS5 (128.81 mg/L EA) from passion fruit; PT4 (100.33 mg/L EA and 2.19 mg/L isoamyl acetate) from pitaya; and P1 (39.66 mg/L PE), P3 (6.04 mg/L PEA and 43.78 mg/L PE), and P5 (52.58 mg/L EA, 21.00 mg/L PEA, and 50.59 mg/L PE) from plums (Supplementary Figure S1). These 15 strains were subsequently identified by sequencing their ITS regions.
Supplementary Table S3 shows the sequencing results. C3 and C5 strains were Candida tropicalis and Pichia kudriavzevii, respectively; A7, G3, G5, C4, M4, PS5, PT4, K3, K5, and P5 strains were Hanseniaspora spp.; and G1, P1, and P3 strains were S. cerevisiae. Both H. vineae and S. cerevisiae are used to brew fruit wines and are GRAS yeasts with a long history in food preparation [21]. Hanseniaspora spp. plays a critical role in the initial spontaneous fermentation of grape wine and cider, and the enzymes and metabolites it produces are beneficial for aroma, flavor, and color. Lleixà et al. [7] reported that coculturing H. vineae and S. cerevisiae produced 2.322 mg/L of PEA, which was 50 times higher than the PEA concentration produced using only S. cerevisiae cultures. Viana et al. [22] studied the effects of the inoculation sequence on the production of PEA and determined that sequential inoculation doubled PEA production (from 0.81 ± 0.06 to 1.70 ± 0.32 mg/L). Liu et al. (2016) also reported that the final concentrations of some volatiles differed significantly between single-culture and coculture fermentations [23]. Therefore, the H. vineae and S. cerevisiae strains were selected to evaluate the effects of coculturing on apple cider quality.
After brewing with 100% TreeTop apple juice, H. vineae K3 produced 756.85 ± 31.14, 2.39 ± 0.10, 1.42 ± 0.23, and 2.38 ± 0.04 mg/L of EA, isoamyl acetate, PEA, and PE, respectively; H. vineae K5 produced 830.74 ± 88.08, 2.73 ± 0.12, 1.13 ± 0.12, and 2.26 ± 0.26 mg/L of EA, isoamyl acetate, PEA, and PE, respectively; and H. vineae P5 produced 867.85 ± 169.72, 2.67 ± 0.42, 1.33 ± 0.40, and 2.43 ± 0.36 mg/L of EA (Supplementary Figure S1), isoamyl acetate, PEA, and PE, respectively.
Statistical analysis indicated that the H. vineae K3, K5, and P5 strains did not differ significantly in production of EA, isoamyl acetate, PEA, and PE (p > 0.05). We selected H. vineae P5 as the experimental strain for the remainder of the study, because it produced slightly higher PEA than did the other two strains (p > 0.05). The S. cerevisiae strains only produced PE, with S. cerevisiae P1 being the most productive one (17.60 ± 0.62 mg/L PE) among all strains (p < 0.05). S. cerevisiae G1 was slightly less productive (13.32 ± 0.36 mg/L PE). In addition, biochemical characterization tests revealed that S. cerevisiae G1 could consume glycerol. Glycerol is an alcohol with a slightly sweet taste, which can give alcoholic beverages a smooth taste while enhancing their flavor and aroma [24]. To avoid the metabolization of glycerol by S. cerevisiae G1, which might negatively affect beverage quality, we selected S. cerevisiae P1 for the remainder of the study. The yeast strains used in this study presented different morphologies, which are summarized in Supplementary Figure S2.

3.2. Optimization of Fermentation Conditions

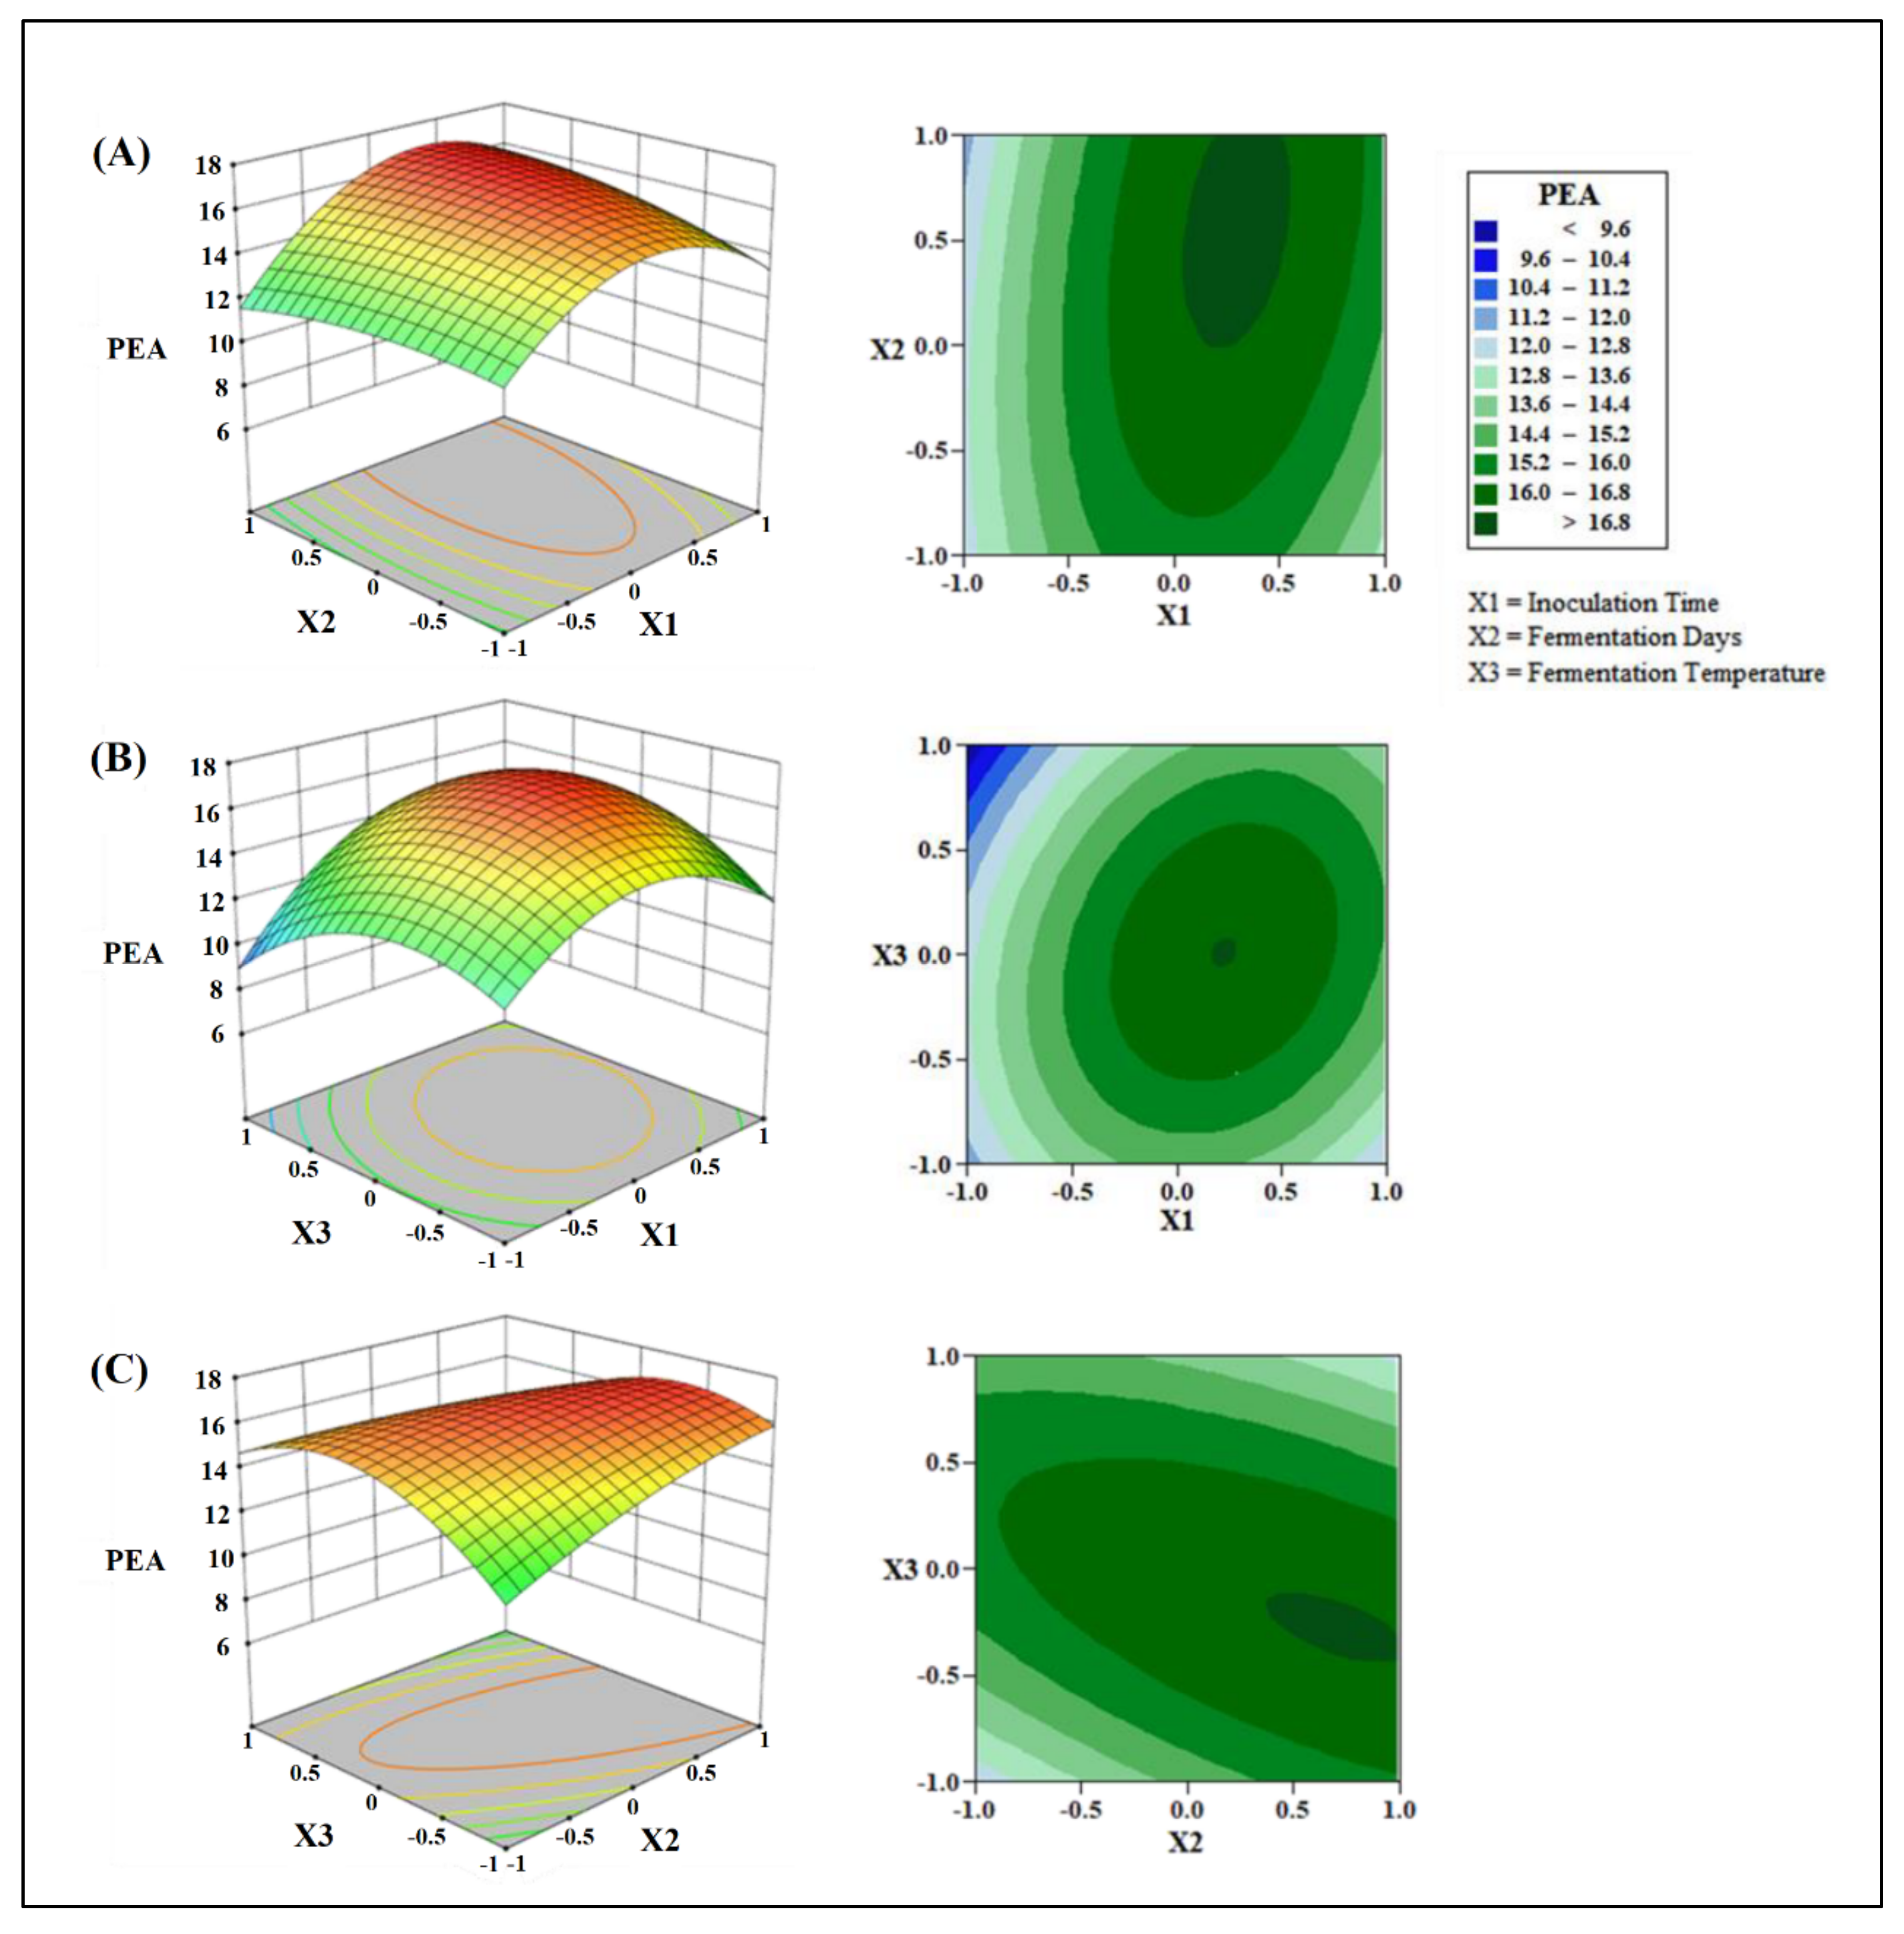
Effects of Inoculation Time, Fermentation Time, and Fermentation Temperature on PEA Production

The group that was singly inoculated with S. cerevisiae P1 did not generate PEA (Figure 1A). However, singly inoculated H. vineae P5 did generate PEA, likely due to the differences between the genetic sequences of these yeast strains. Giorello et al. [25] noted that all Hanseniaspora strains can produce high levels of EA [25]. They determined that H. vineae presented six sequences with alcohol acetyltransferase domains, and three sequences were SLI1 paralogs. This might be highly specific for aromatic alcohols and could explain why H. vineae produces high levels of PEA. Furthermore, the group that was initially inoculated with S. cerevisiae P1 did not produce PEA. S. cerevisiae P1 could inhibit the growth of H. vineae P5 through cell-to-cell contact or the generation of killer toxins, thereby preventing the generation of aroma compounds, such as PEA [26]. The groups that were initially inoculated with H. vineae P5 produced 5.68 ± 0.28 to 6.43 ± 0.64 mg/L of PEA, and the group simultaneously inoculated with both strains produced 3.75 ± 0.70 mg/L of PEA. Therefore, sequential inoculation increased the PEA yield 1.51–1.71 times. Similarly, sequential fermentation resulted in significantly higher PEA yields than simultaneous fermentation, with previous studies postulating that H. vineae and S. cerevisiae are synergistic in this regard [22,27]. The concentration of PEA peaked on day 7 and gradually decreased thereafter (Figure 1B). We hypothesized that the yeasts produced esterases that hydrolyzed esters. Esterase production is controlled by the IAH1 gene, and IAH1 overexpression is known to significantly reduce ester content. Esterase is an α/β hydrolase with a Ser–Asp–His catalytic triad (in which Ser is the active-site nucleophile), which is embedded within a Gly–x–Ser–x–Gly consensus sequence. In addition to esterase, thioester hydrolases, proteases, haloperoxidases, haloalkane dehalogenases, epoxide hydrolases, and C–C bond-breaking enzymes contain similar structures that can participate in ester degradation [28,29,30]. The optimal temperature for PEA production was 20 °C; moreover, yeast growth and fermentation capacity were temperature-dependent (Figure 1C). Studies have demonstrated that low-temperature fermentation prolongs the survival of non-Saccharomyces species and that increasing the fermentation temperature accelerates the growth of S. cerevisiae, which inhibits the growth of non-Saccharomyces species [31,32]. The concentration of PEA increased proportionally with the sugar content (Figure 1D). We hypothesized that this behavior was related to the generation of aroma compounds after the formation of α-ketoacids via the central carbon metabolism (CCM). Studies have demonstrated that more than 90% of acids, higher alcohols, and acetate esters in wine are produced via CCM [33,34]. Sugar content also increases alcohol (ethanol) content. In some countries, additional duties are charged for alcoholic beverages with high alcohol content. Furthermore, alcohol consumption can be harmful for health. A high alcohol content could also mask subtle aromas and cause a burning sensation in the mouth. Consequently, there has been a growing demand for decreasing the alcohol concentration of commercialized alcoholic beverages [24]. Therefore, our experiments to maximize the PEA yield were performed using apple juice with a sugar content of 20 °Bx.

3.3. Construction and Validation of the RSM Model

Table 1 lists the results of the RSM experiment. The linear, square, and cross terms significantly affected the PEA yield (p < 0.05), except for X3 (p = 0.071). In addition, the data in Table 2 shows that the p-value of the lack-of-fit test is 0.684 (greater than 0.05), revealing that the model agreed well with the experimental results and was credible. Subsequently, we constructed the corresponding model equation, 3D surface plots, and contour maps (Figure 2). The model Equation (2) is expressed as follows:
Y   P E A = 16.667 + 1.2749 x 1 + 0.3964 x 2 0.2127 x 3 2.831 x 1 2 0.559 x 2 2 2.248 x 3 2 + 0.764 x 1 x 2 + 1.118 x 1 x 3 1.438 x 2 x 3
According to the model, the optimal fermentation conditions were as follows: initial inoculation with H. vineae P5 followed by inoculation with S. cerevisiae P1 after 31 h and fermentation for 14.5 d at 18.7 °C. This protocol was expected to produce 17.06 mg/L PEA. The model was validated in triplicate, confirming a PEA yield of 17.41 ± 0.51 mg. According to the one-sample t-test, the experimental results did not differ significantly from the predicted value (p < 0.05). Amandeep and Gurvinder reported on the development of Jamun wine using RSM, and they also found S. cumini fermentation statistically optimized with supplementary seed and pulp powder [35]. Notably, the interaction of X1 × X2, X1 × X3, and X2 × X3 showed significant p-values, indicating that the interaction between factors did affect PEA produciton. Traditionally, the one-factor-at-a-time approach is performed to optimize the fermentation process; however, this method is both time-consuming and costly in terms of human resources and materials. In worst-case scenarios, interactions among parameters are overlooked, resulting in misleading conclusions.

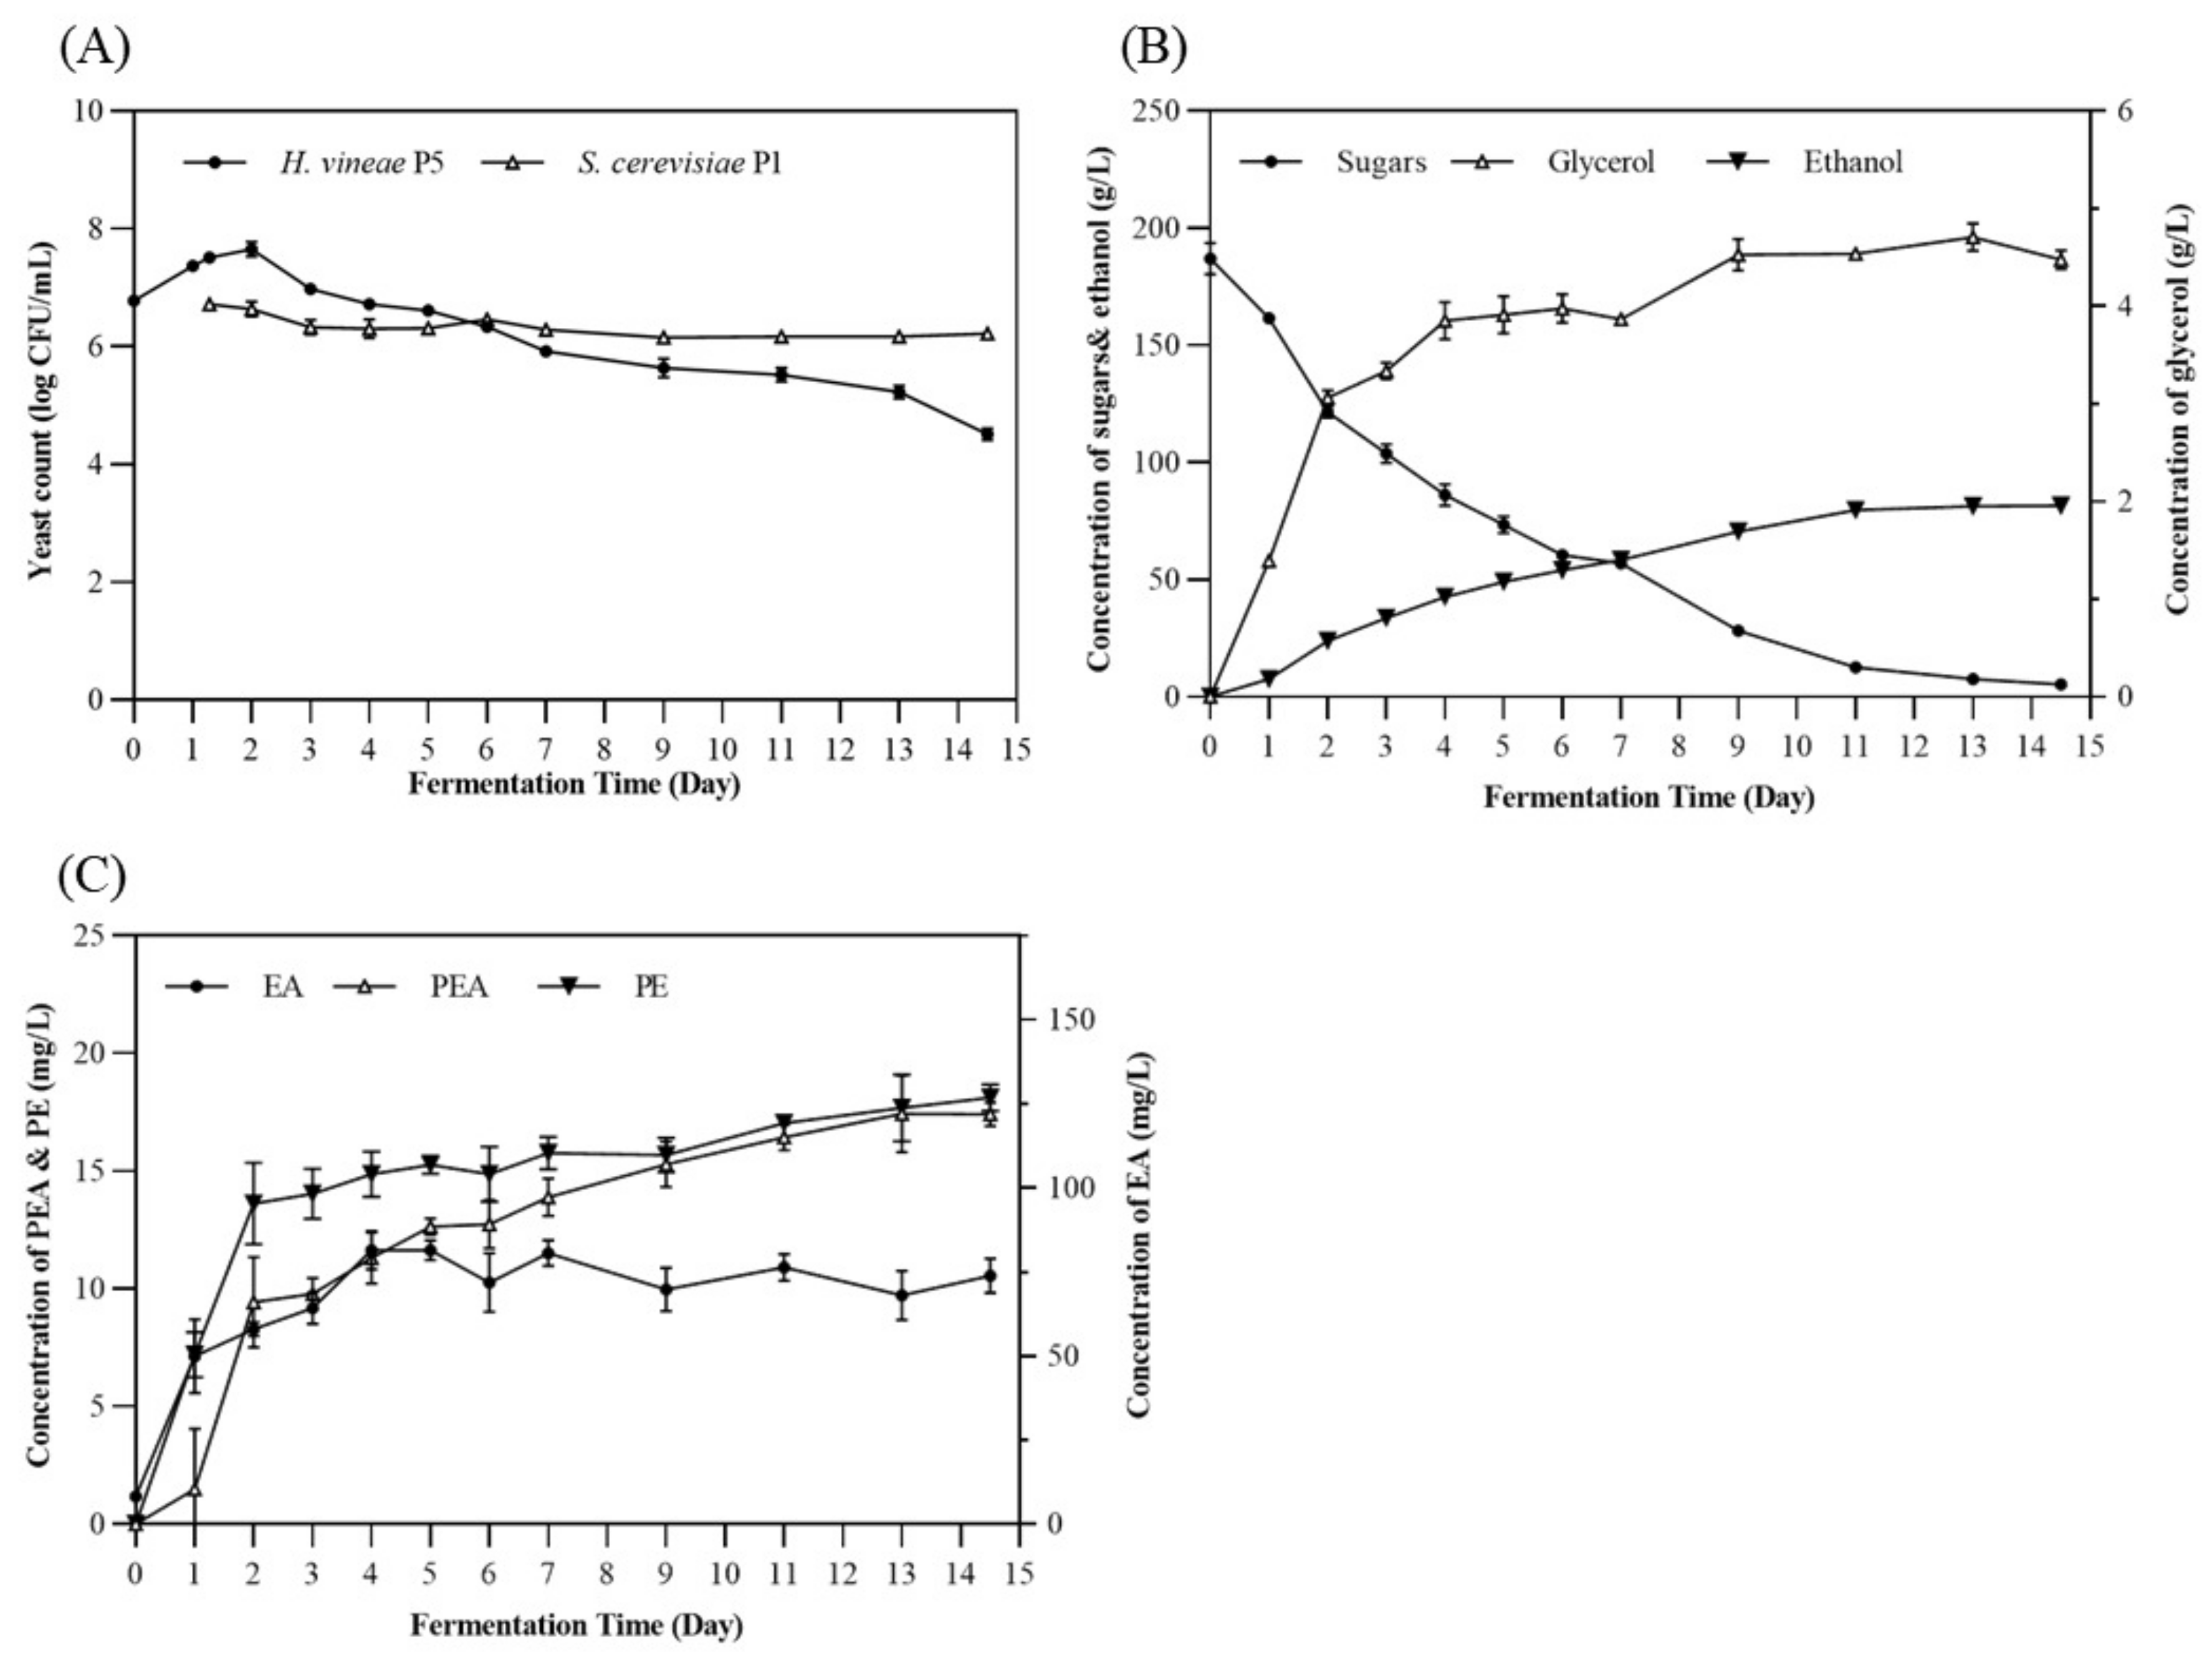
3.4. Changes in Chemical Composition and Yeast Flora during Fermentation

In this study, we investigated the increase and decrease in H. vineae P5 and S. cerevisiae P1 yeast strain counts as well as changes in the chemical composition of cider samples during fermentation. The fermentation conditions used in this experiment were the optimal conditions determined via RSM (inoculation of H. vineae P5 followed by inoculation of S. cerevisiae P1 after 31 h and fermentation for 14.5 d at 18.7 °C). The initial inoculum size of H. vineae P5 was approximately 6.03 × 10⁶ CFU/mL (Figure 3A). After 31 h, 5.30 × 10⁶ CFU/mL of S. cerevisiae P1 was inoculated, and the H. vineae P5 count was 3.27 × 10⁷ CFU/mL at this time. The H. vineae P5 count peaked on day 2 (4.43 × 10⁷ CFU/mL) and gradually decreased thereafter. Starting on day 6, the S. cerevisiae P1 count (2.87 × 10⁶ CFU/mL) exceeded the H. vineae P5 count (2.20 × 10⁶ CFU/mL). The growing dominance of S. cerevisiae P1 during the later stages of fermentation could be caused by the increasing alcohol levels in the cider and the exhaustion of nutrients. After 14.5 d (i.e., at the end of the fermentation process), the H. vineae P5 and S. cerevisiae P1 counts were 3.20 × 10⁴ and 1.66 × 10⁶ CFU/mL, respectively. The S. cerevisiae P1 count did not change significantly during fermentation (Figure 3A). Based on previous studies, the growth of S. cerevisiae P1 may have been inhibited by the competition for nutrients between the two yeast strains and the low-temperature environment [31,32]. Sugar levels gradually decreased with the fermentation time, owing to their conversion into metabolites, such as ethanol and glycerol (Figure 3B). During the first two days, fermentation occurred rapidly, the residual sugar level decreased from 186.90 ± 6.76 to 12.53 ± 1.07 g/L, and the ethanol content increased to 79.63 ± 0.87 g/L. The fermentation rate decreased after day 11, and the residual sugar level at the end of the fermentation process was 5.21 ± 1.66 g/L. Furthermore, the ethanol and glycerol content increased to 81.66 ± 2.58 and 4.48 ± 0.10 g/L, respectively. Figure 3C illustrates the changes in the concentrations of the aroma compounds (EA, PEA, and PE) during fermentation. Llorente et al. also reported that when the starch index decreased, because of starch hydrolysis, several aromas were accumulated [36]. Due to the fact that the concentration of EA was always lower than 150–200 mg/L, the cider did not present an unpleasant “solvent” taste. The PEA yield increased with the fermentation time, and the maximum yield (17.41 ± 0.51 mg/L) was reached after 14.5 d. At the end of the fermentation process, the PE concentration was 18.11 ± 0.56 mg/L, which was higher than the 10 mg/L threshold required to give the cider a rose-like aroma [37].

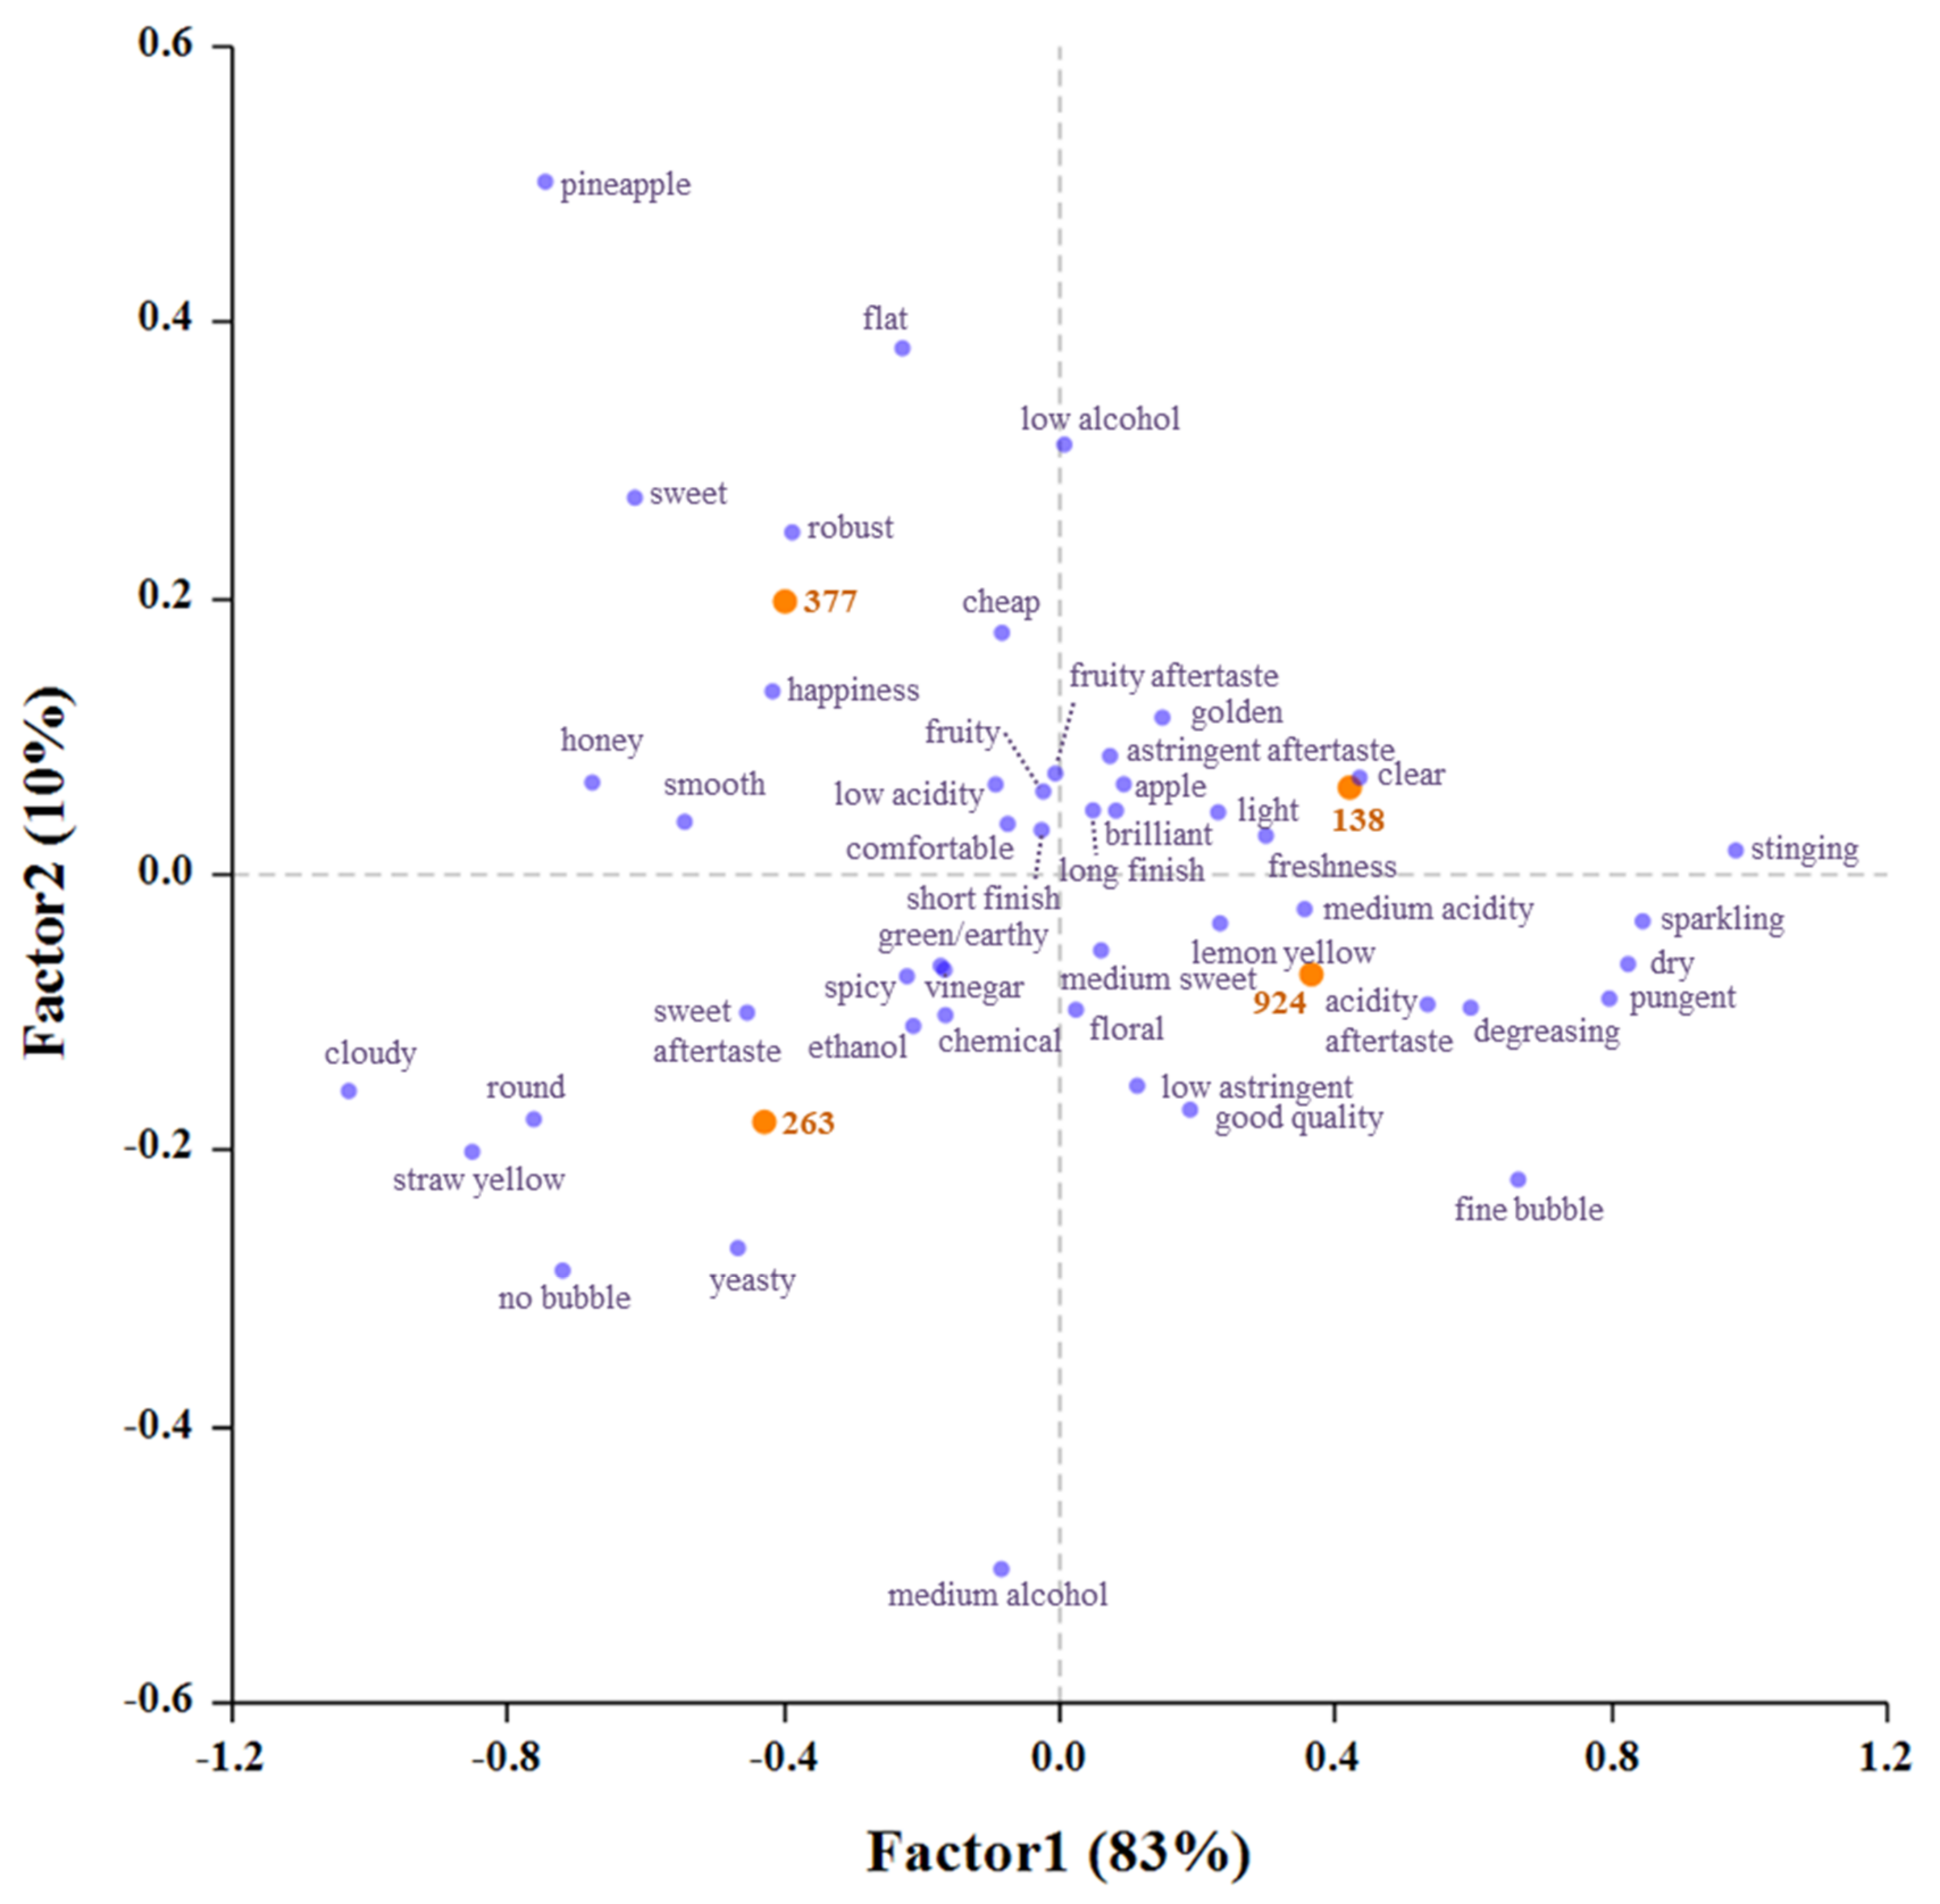
3.5. Sensory Evaluation

From the CATA data analysis, the frequency with which each characteristic was observed by the tasters in the different samples during the sensory evaluation was recorded, giving rise to a contingency table [38]. Table 3 summarizes the results of the hedonic analysis; that is, the tasters’ ratings for each cider product in terms of overall liking, appearance, aroma, flavor, taste, and aftertaste. The appearance ratings for Samples 138 and 924 ranged from “liked” to “liked very much”, whereas the ratings for Samples 263 and 377 ranged from “liked a little” to “liked slightly.” The aroma ratings for Samples 138, 924, and 377 ranged from “liked a little” to “liked slightly”, whereas the ratings for Sample 263 ranged from “neither like nor dislike” or “dislike to liked a little”. The flavor, taste, aftertaste, and overall liking ratings for all samples ranged from “liked a little” to “liked slightly”.
The CATA method used 126 descriptors (Supplementary Table S1). The tasters did not report perceiving any pink, brown, lavender, coffee, soy sauce, chocolate, animal, green bean, bell pepper, mint, mushroom, meat, or high alcohol in the cider samples. Supplementary Table S4 presents the selection frequency of the remaining descriptors and their Cochran’s Q test results. In total, 47 descriptors were check-marked by more than 20% of the tasters (these descriptors are marked with “*” in Supplementary Table S4). Correspondence analysis was performed for the 47 descriptors and the products (Figure 4). Factor 1 (X-axis) accounted for 83% of the variance, and all the analyzed cider samples (263, 377, 138, and 924) could be distinguished using Factor 1. The descriptors for Samples 138 and 924 were clear, sparkling, fine bubble, stinging, and brilliant. This could be ascribed to the addition of CO2 to these samples, which increased their bubbliness. Furthermore, commercial ciders are typically filtered after fermentation, and clarifying agents, such as bentonite, are added to remove impurities, such as proteins, in order to maintain clarity and increase brilliance (Proulx & Nichols, 2003). Conversely, Samples 263 and 377 were considered to present a smooth taste but were neither sparkling nor stinging. On account of the experimental cider samples being centrifuged and pasteurized after fermentation, the container may not have been sufficiently airtight during these processes, leading to a loss of bubbliness [39]. Factor 2 (Y-axis) accounted for 10% of the variance and allowed the association of descriptors to individual products. Sample 138 was “light” and “fresh”, while Sample 924 presented an “astringent aftertaste” and “degreasing” characteristics. Sample 263 was associated with the “hot feeling”, “green/earthy”, “chemical”, “spicy”, and “medium alcohol” descriptors. Conversely, Sample 377 was associated with the “honey”, “pineapple”, “fruity”, “fruity aftertaste”, “sweet”, “happiness”, and “low alcohol” descriptors. Ye et al. reported that cofermentation showed higher scores than cider fermentation by pure S. cerevisiae [40], which may be related to cider fermentation by S. cerevisiae generating alcoholic and yeasty characteristics. In the present study, we demonstrated that cocultured cider has enhanced global aromatic intensity and showed that the CATA method, which involves a questionnaire, can be helpful to collect information regarding consumers’ perceptions of foods and to depict the profile of a cider.

4. Conclusions

In this study, selective culture media, aroma analysis, and ITS region sequencing were employed to analyze yeast strains with brewing potential. The H. vineae and S. cerevisiae strains, which are associated with the production of PEA (honey and rose aromas) and PE (rose aroma), respectively, were isolated from various fruits. H. vineae P5 and S. cerevisiae P1 were selected because they produce high levels of PE. After the optimal cider brewing process was determined, a cider with 17.41 mg/L PEA was obtained. For the hedonic analysis, the CATA results demonstrated that each commercial and experimental cider sample was associated with different descriptors. The cocultured cider was associated with the “smooth”, “honey”, “pineapple”, “fruity”, “fruity aftertaste”, “sweet”, “happiness”, and “low alcohol” descriptors. Yeast selection and coculturing are crucial processes in the brewing industry, and recent studies have demonstrated that non-Saccharomyces yeasts and coculturing can improve the complexity of (alcoholic) beverage aromas. We believe that the findings of this study will increase the applicability of non-Saccharomyces yeasts and coculture fermentation in the brewing industry.

Supplementary Materials

The following are available online at https://www.mdpi.com/article/10.3390/fermentation8010001/s1. Figure S1. Screening yeasts by the (A) EA, (B) IAA, (C) PEA and (D) PE of fermented broth, Figure S2. Morphological characterization of yeasts, Table S1. Descriptive terms of check-all-that-apply analysis for cider, Table S2. The analysis condition of GC-FID for main aroma compounds, Table S3. Yeast identification based on sequencing of the ITS region, Table S4. Selection frequencies of descriptive terms for cider and the results of Cochran’s Q test based on the check-all-that-apply (CATA) method.

Author Contributions

All the authors agreed with the manuscript for publication. C.-Y.H., C.-W.H. and K.-C.C. conceived and designed the experiments. C.-Y.H., P.-H.H. and Y.-T.L. conducted experiments. P.-H.H., S.-P.L., B.-K.L. and C.-Y.H. collected and analyzed the data. C.-Y.H., P.-H.H. and H.-W.L. drafted the manuscript. C.-W.H., S.-P.L. and K.-C.C. reviewed and approved the final version of manuscript. All authors have read and agreed to the published version of the manuscript.

Funding

This study was funded by the Ministry of Science and Technology, Taiwan, under contract numbers MOST 105-2221-E-002-212-MY3 and MOST 106-2628-E-002-009-MY3.

Institutional Review Board Statement

Not applicable.

Informed Consent Statement

Not applicable.

Data Availability Statement

All relevant data are within the paper.

Acknowledgments

This study was funded by the Ministry of Science and Technology, Taiwan, under contract numbers MOST 105-2221-E-002-212-MY3 and MOST 106-2628-E-002-009-MY3. The authors gratefully acknowledge the proofreading of the article by Iris YS Wu, who is a native speaker from the University of California, Berkeley (Berkeley, CA, USA).

Conflicts of Interest

The authors declare no conflict of interest.

List of Abbreviations

ANOVAAnalysis of variance;
CATACheck-all-that-apply;
CCMCentral carbon metabolism;
EAEthyl acetate;
GC–FIDGas chromatography with flame-ionization detection;
GRASGeneralized recognized as safe;
HPLCHigh-performance liquid chromatography;
ITSInternal transcribed spacer;
PE2-phenylethanol;
PEA2-phenylethyl acetate;
RSMResponse surface methodology;
WLWallerstein Laboratory;
YPDYeast extract peptone dextrose

References

  1. Cousin, F.; Schlusselhuber, M.; Dalmasso, M.; Laplace, J.-M.; Cretenet, M. Microorganisms in Fermented Apple Beverages: Current Knowledge and Future Directions. Microorganisms 2017, 5, 39. [Google Scholar] [CrossRef] [PubMed] [Green Version]
  2. Lea, A.G.H.; Drilleau, J.-F. Cidermaking. In Fermented Beverage Production; Lea, A.G.H., Piggott, J.R., Eds.; Springer: Boston, MA, USA, 2003; pp. 59–87. ISBN 978-1-4615-0187-9. [Google Scholar]
  3. Swiegers, J.H.; Pretorius, I.S. Yeast modulation of wine flavor. Adv. Appl. Microbiol. 2005, 57, 131–175. [Google Scholar] [CrossRef]
  4. Rainieri, S.; Pretorius, I.S. Selection and improvement of wine yeasts. Ann. Microbiol. 2000, 50, 15–32. [Google Scholar]
  5. González Flores, M.; Rodríguez, M.E.; Origone, A.C.; Oteiza, J.M.; Querol, A.; Lopes, C.A. Saccharomyces uvarum isolated from patagonian ciders shows excellent fermentative performance for low temperature cidermaking. Food Res. Int. 2019, 126, 108656. [Google Scholar] [CrossRef]
  6. Guichard, H.; Poupard, P.; Legoahec, L.; Millet, M.; Bauduin, R.; Le Quéré, J.-M. Brettanomyces anomalus, a double drawback for cider aroma. LWT 2019, 102, 214–222. [Google Scholar] [CrossRef]
  7. Lleixà, J.; Martín, V.; Portillo, M.D.C.; Carrau, F.; Beltran, G.; Mas, A. Comparison of Fermentation and Wines Produced by Inoculation of Hanseniaspora vineae and Saccharomyces cerevisiae. Front. Microbiol. 2016, 7, 338. [Google Scholar] [CrossRef] [PubMed] [Green Version]
  8. Shi, W.-K.; Wang, J.; Chen, F.-S.; Zhang, X.-Y. Effect of Issatchenkia terricola and Pichia kudriavzevii on wine flavor and quality through simultaneous and sequential co-fermentation with Saccharomyces cerevisiae. LWT 2019, 116, 108477. [Google Scholar] [CrossRef]
  9. Gschaedler, A.; Iñiguez-Muñoz, L.E.; Flores-Flores, N.Y.; Kirchmayr, M.; Arellano-Plaza, M. Use of non-Saccharomyces yeasts in cider fermentation: Importance of the nutrients addition to obtain an efficient fermentation. Int. J. Food Microbiol. 2021, 347, 109169. [Google Scholar] [CrossRef] [PubMed]
  10. Dzialo, M.C.; Park, R.; Steensels, J.; Lievens, B.; Verstrepen, K.J. Physiology, ecology and industrial applications of aroma formation in yeast. FEMS Microbiol. Rev. 2017, 41, S95–S128. [Google Scholar] [CrossRef] [Green Version]
  11. Madden, A.A.; Epps, M.J.; Fukami, T.; Irwin, R.E.; Sheppard, J.; Sorger, D.M.; Dunn, R.R. The ecology of insect–yeast relationships and its relevance to human industry. Proc. R. Soc. B Biol. Sci. 2018, 285, 20172733. [Google Scholar] [CrossRef] [PubMed] [Green Version]
  12. Martínez-Avila, O.; Sánchez, A.; Font, X.; Barrena, R. Bioprocesses for 2-phenylethanol and 2-phenylethyl acetate production: Current state and perspectives. Appl. Microbiol. Biotechnol. 2018, 102, 9991–10004. [Google Scholar] [CrossRef]
  13. Qian, X.; Yan, W.; Zhang, W.; Dong, W.; Ma, J.; Ochsenreither, K.; Jiang, M.; Xin, F. Current status and perspectives of 2-phenylethanol production through biological processes. Crit. Rev. Biotechnol. 2019, 39, 235–248. [Google Scholar] [CrossRef]
  14. Lai, Y.-T.; Cheng, K.-C.; Lai, C.-N.; Lai, Y.-J. Isolation and identification of aroma producing strain with esterification capacity from yellow water. PLoS ONE 2019, 14, e0211356. [Google Scholar] [CrossRef]
  15. Viana, F.; Gil, J.V.; Genovés, S.; Vallés, S.; Manzanares, P. Rational selection of non-Saccharomyces wine yeasts for mixed starters based on ester formation and enological traits. Food Microbiol. 2008, 25, 778–785. [Google Scholar] [CrossRef]
  16. Xu, Y.; Fan, W.; Qian, M.C. Characterization of Aroma Compounds in Apple Cider Using Solvent-Assisted Flavor Evaporation and Headspace Solid-Phase Microextraction. J. Agric. Food Chem. 2007, 55, 3051–3057. [Google Scholar] [CrossRef]
  17. Kurtzman, C.P.; Fell, J.W.; Boekhout, T.B. (Eds.) Copyright. In The Yeasts, 5th ed.; Elsevier: London, UK, 2011; p. iv. ISBN 978-0-444-52149-1. [Google Scholar]
  18. Duarte-coelho, A.C.; Dumoulin, E.D.; Guerain, J.T. High-Performance Liquid Chromato-Graphic Determination of Sucrose, Glucose, Fructose in Complex Products of Distilleries. J. Liq. Chromatogr. 1985, 8, 59–73. [Google Scholar] [CrossRef]
  19. Liou, B.-K.; Jaw, Y.-M.; Chuang, G.C.-C.; Yau, N.N.J.; Zhuang, Z.-Y.; Wang, L.-F. Important Sensory, Association, and Postprandial Perception Attributes Influencing Young Taiwanese Consumers’ Acceptance for Taiwanese Specialty Teas. Foods 2020, 9, 100. [Google Scholar] [CrossRef] [Green Version]
  20. Sommer, S.; Sommer, S.J.; Cohen, S.D. Proposal of the head-heart-base technique as an innovative method to describe and evaluate the aroma profile of wine and cider. J. Wine Res. 2018, 29, 204–219. [Google Scholar] [CrossRef]
  21. Masneuf-Pomarede, I.; Bely, M.; Marullo, P.; Albertin, W. The Genetics of Non-conventional Wine Yeasts: Current Knowledge and Future Challenges. Front. Microbiol. 2016, 6, 1563. [Google Scholar] [CrossRef]
  22. Viana, F.; Belloch, C.; Vallés, S.; Manzanares, P. Monitoring a mixed starter of Hanseniaspora vineae-Saccharomyces cerevisiae in natural must: Impact on 2-phenylethyl acetate production. Int. J. Food Microbiol. 2011, 151, 235–240. [Google Scholar] [CrossRef]
  23. Liu, S.-Q.; Aung, M.T.; Lee, P.-R.; Yu, B. Yeast and volatile evolution in cider co-fermentation with Saccharomyces cerevisiae and Williopsis saturnus. Ann. Microbiol. 2016, 66, 307–315. [Google Scholar] [CrossRef]
  24. Goold, H.D.; Kroukamp, H.; Williams, T.C.; Paulsen, I.T.; Varela, C.; Pretorius, I.S. Yeast’s balancing act between ethanol and glycerol production in low-alcohol wines. Microb. Biotechnol. 2017, 10, 264–278. [Google Scholar] [CrossRef]
  25. Giorello, F.; Valera, M.J.; Martin, V.; Parada, A.; Salzman, V.; Camesasca, L.; Fariña, L.; Boido, E.; Medina, K.; Dellacassa, E.; et al. Genomic and Transcriptomic Basis of Hanseniaspora vineae’s Impact on Flavor Diversity and Wine Quality. Appl. Environ. Microbiol. 2019, 85, e01959-18. [Google Scholar] [CrossRef] [Green Version]
  26. Ciani, M.; Comitini, F. Yeast interactions in multi-starter wine fermentation. Curr. Opin. Food Sci. 2015, 1, 1–6. [Google Scholar] [CrossRef]
  27. Zhang, B.; Xu, D.; Duan, C.; Yan, G. Synergistic effect enhances 2-phenylethyl acetate production in the mixed fermentation of Hanseniaspora vineae and Saccharomyces cerevisiae. Process Biochem. 2020, 90, 44–49. [Google Scholar] [CrossRef]
  28. Bornscheuer, U.T. Microbial carboxyl esterases: Classification, properties and application in biocatalysis. FEMS Microbiol. Rev. 2002, 26, 73–81. [Google Scholar] [CrossRef] [PubMed]
  29. Lilly, M.; Bauer, F.F.; Lambrechts, M.G.; Swiegers, J.H.; Cozzolino, D.; Pretorius, I.S. The effect of increased yeast alcohol acetyltransferase and esterase activity on the flavour profiles of wine and distillates. Yeast 2006, 23, 641–659. [Google Scholar] [CrossRef] [Green Version]
  30. Saerens, S.M.G.; Delvaux, F.R.; Verstrepen, K.J.; Thevelein, J.M. Production and biological function of volatile esters in Saccharomyces cerevisiae. Microb. Biotechnol. 2010, 3, 165–177. [Google Scholar] [CrossRef] [Green Version]
  31. Bagheri, B.; Bauer, F.F.; Cardinali, G.; Setati, M.E. Ecological interactions are a primary driver of population dynamics in wine yeast microbiota during fermentation. Sci. Rep. 2020, 10, 4911. [Google Scholar] [CrossRef] [Green Version]
  32. Salvadó, Z.; Arroyo-López, F.N.; Barrio, E.; Querol, A.; Guillamón, J.M. Quantifying the individual effects of ethanol and temperature on the fitness advantage of Saccharomyces cerevisiae. Food Microbiol. 2011, 28, 1155–1161. [Google Scholar] [CrossRef]
  33. Crépin, L.; Truong, N.M.; Bloem, A.; Sanchez, I.; Dequin, S.; Camarasa, C.; Cullen, D. Management of Multiple Nitrogen Sources during Wine Fermentation by Saccharomyces cerevisiae. Appl. Environ. Microbiol. 2017, 83, e02617-16. [Google Scholar] [CrossRef] [Green Version]
  34. Rollero, S.; Mouret, J.-R.; Bloem, A.; Sanchez, I.; Ortiz-Julien, A.; Sablayrolles, J.-M.; Dequin, S.; Camarasa, C. Quantitative (13) C-isotope labelling-based analysis to elucidate the influence of environmental parameters on the production of fermentative aromas during wine fermentation. Microb. Biotechnol. 2017, 10, 1649–1662. [Google Scholar] [CrossRef]
  35. Singh, A.; Kocher, G.S. Standardization of seed and peel infused Syzygium cumini -wine fermentation using response surface methodology. LWT 2020, 134, 109994. [Google Scholar] [CrossRef]
  36. Llorente, D.D.; Abrodo, P.A.; González-Álvarez, J.; de la Fuente, E.D.; Alonso, J.J.M.; Álvarez, M.D.G.; Gomis, D.B. A New Analytical Method to Volatile Compounds in Cider Apples: Application to Evaluate the Starch Index. Food Bioprocess Technol. 2013, 6, 2447–2454. [Google Scholar] [CrossRef]
  37. Gamero, A.; Ferreira, V.; Pretorius, I.S.; Querol, A. Wine, Beer and Cider: Unravelling the Aroma Profile. In Molecular Mechanisms in Yeast Carbon Metabolism; Springer: Berlin/Heidelberg, Germany, 2014; pp. 261–297, ISBN 978-3-642-55012-6 (Print) 978-3-642-55013-3 (Online). [Google Scholar]
  38. de Barros, H.E.A.; Natarelli, C.V.L.; de Carvalho Tavares, I.M.; de Oliveira, A.L.M.; Araújo, A.B.S.; Pereira, J.; Carvalho, E.E.N.; de Barros Vilas Boas, E.V.; Franco, M. Nutritional Clustering of Cookies Developed with Cocoa Shell, Soy, and Green Banana Flours Using Exploratory Methods. Food Bioprocess Technol. 2020, 13, 1566–1578. [Google Scholar] [CrossRef]
  39. Brennan, J.G.; Grandison, A.S.; Lewis, M.J. Separations in Food Processing. In Food Processing Handbook; Wiley-VCH Verlag GmbH & Co. KGaA: Weinheim, Germany, 2006; pp. 429–511. ISBN 9783527307197. [Google Scholar]
  40. Ye, M.; Yue, T.; Yuan, Y. Effects of sequential mixed cultures of Wickerhamomyces anomalus and Saccharomyces cerevisiae on apple cider fermentation. FEMS Yeast Res. 2014, 14, 873–882. [Google Scholar] [CrossRef] [Green Version]
Figure 1. Effects of (A) inoculation time, (B) fermentation time, (C) fermentation temperature, and (D) initial sugar content on PEA. Each data with different letters marked above were significantly different (p < 0.05).
Fermentation 08 00001 g001
Figure 2. Three-dimensional surface (left column) and contour (right column) plots of PEA production at different (A) inoculation times (X1), (B) fermentation times (X2), and (C) fermentation temperatures (X3).
Fermentation 08 00001 g002
Figure 3. Changes in (A) yeast populations, (B) sugar, glycerol, and ethanol concentrations, and (C) ethyl acetate (EA, PEA, and PE concentrations during fermentation.
Fermentation 08 00001 g003
Figure 4. Correspondence analysis biplot of cider samples using 47 descriptive terms; here 263, 377, 138, and 924 denote Somersby Apple Cider, Strongbow Gold Apple Cider, pure culture cider, and cocultured cider, respectively.
Fermentation 08 00001 g004
Table 1. Box–Behnken experimental design results.
Independent VariablesDependent Variables (PEA)
Actual ValueCode ValuePredictedActual
X1X2
(d)
X3
(°C)
X1X2
(d)
X3
(°C)
Ypre.
(mg/L)
Yact.
(mg/L)
1S2H0152011015.7115.62
2S2H07201−1013.3913.29
3S0H01520−11011.6311.74
4S0H0720−1−1012.3712.46
5S2H0112510113.7713.76
6S2H0111510−111.9612.16
7S0H01125−1018.988.78
8S0H01115−10−111.6411.65
9S1H0152501112.6112.70
10S1H0151501−115.9115.80
11S1H07250−1114.6914.80
12S1H07150−1−112.2412.14
13S1H0112000016.6717.00
14S1H0112000016.6716.41
15S1H0112000016.6716.59
X1, X2, and X3 denote the inoculation time, fermentation time, and fermentation temperature, respectively, and Ypre. and Yact. denote the predicted and actual PEA concentrations, respectively.
Table 2. ANOVA results for the RSM quadratic model.
SourceDfAdj SSAdj MSF Valuep-Value
Model975.29568.3662121.010.000
Linear314.62214.874070.500.000
X1113.002713.0027188.080.000
X211.25741.257418.190.008
X310.36200.36205.240.071
Square345.062215.0207217.270.000
X12129.602629.6026428.190.000
X2211.15431.154316.700.009
X32118.666518.6665270.000.000
Interaction315.61135.203875.270.000
X1 × X212.33392.333933.760.002
X1 × X315.00265.002672.360.000
X2 × X318.27488.2748119.690.000
Error50.34570.0691
Lack of fit30.16020.05340.580.684
Pure error20.18550.0927
Total1475.6413
Df, Adj SS, and Adj MS denote total degrees of freedom, adjusted sums of squares, and adjusted mean squares, respectively.
Table 3. Hedonic analysis results.
Sample Designation 1138 2263377924
Appearance7.30 ± 0.88 a6.33 ± 1.62 b6.63 ± 1.31 b7.33 ± 0.92 a
Aroma6.73 ± 1.22 a5.95 ± 1.44 b6.35 ± 1.41 ab6.20 ± 1.36 ab
Flavor6.30 ± 1.34 a6.58 ± 1.39 a6.50 ± 1.60 a6.00 ± 1.26 a
Texture6.23 ± 0.83 a6.65 ± 1.27 a6.35 ± 1.66 a6.28 ± 1.06 a
Aftertaste6.00 ± 1.24 a6.48 ± 1.43 a6.00 ± 1.75 a6.10 ± 1.08 a
Overall liking6.38 ± 1.00 a6.48 ± 1.45 a6.30 ± 1.67 a6.33 ± 1.02 a
1 Different letters in the same row represent significant differences according to a Fisher’s LSD test (p < 0.05). 2 The numbers 138, 263, 377, and 924 denote Somersby Apple Cider, Strongbow Gold Apple Cider, pure culture cider and coculture.
Publisher’s Note: MDPI stays neutral with regard to jurisdictional claims in published maps and institutional affiliations.

