
Monitoring of Biopolymer Production Process Using Soft Sensors Based on Off-Gas Composition Analysis and Capacitance Measurement †

Abstract
:1. Introduction
- “gray box” type of soft sensor, alternatively referred to as “model-driven”—using a first-principle mathematical model of the monitored process based on physical, chemical, or biological relationships with experimental identification of unknown parameters from historical process data;
- “black box” type of soft sensor, alternatively referred to as a “data-driven”—where the mathematical model describing the relationship between the inputs and outputs of the soft sensor is not known in advance, and hence the mathematical description of this relationship must be designed on the basis of historical process data using suitable computational tools, e.g., regression analysis, neural networks, etc.
- high sensitivity of the production microbial culture to changes in cultivation conditions such as pH, temperature, etc.;
- during the cultivation itself, the microbial culture passes through various physiological states, which usually result in different types of culture behavior;
- key parameters of bioprocess models typically change during cultivation, whereas on-line measurement, or at least estimation, of these changes is rather complicated.
2. Materials and Methods
2.1. Process Description
2.2. Process Data Measurement and Analytical Methods
2.3. Soft Sensors Based on Off-Gas Analysis
2.4. Soft Sensors Based on Capacitance Measurement
3. Results and Discussion
3.1. Regression Analysis of the Relationship between the On-Line Process Data and Off-Line Concentrations Measurements
- Case 1: biomass and biopolymer concentrations, respectively, are assumed to be linearly dependent on oxygen uptake rate OUR;
- Case 2: biomass and biopolymer concentrations, respectively, are assumed to be linearly dependent on carbon dioxide production rate CPR;
- Case 3: biomass and biopolymer concentrations, respectively, are assumed to be linearly dependent on cumulative oxygen consumption COC;
- Case 4: biomass and biopolymer concentrations, respectively, are assumed to be linearly dependent on cumulative carbon dioxide production CCP.
3.2. Design of Soft Sensors for Biomass and Biopolymer Concentration Estimation
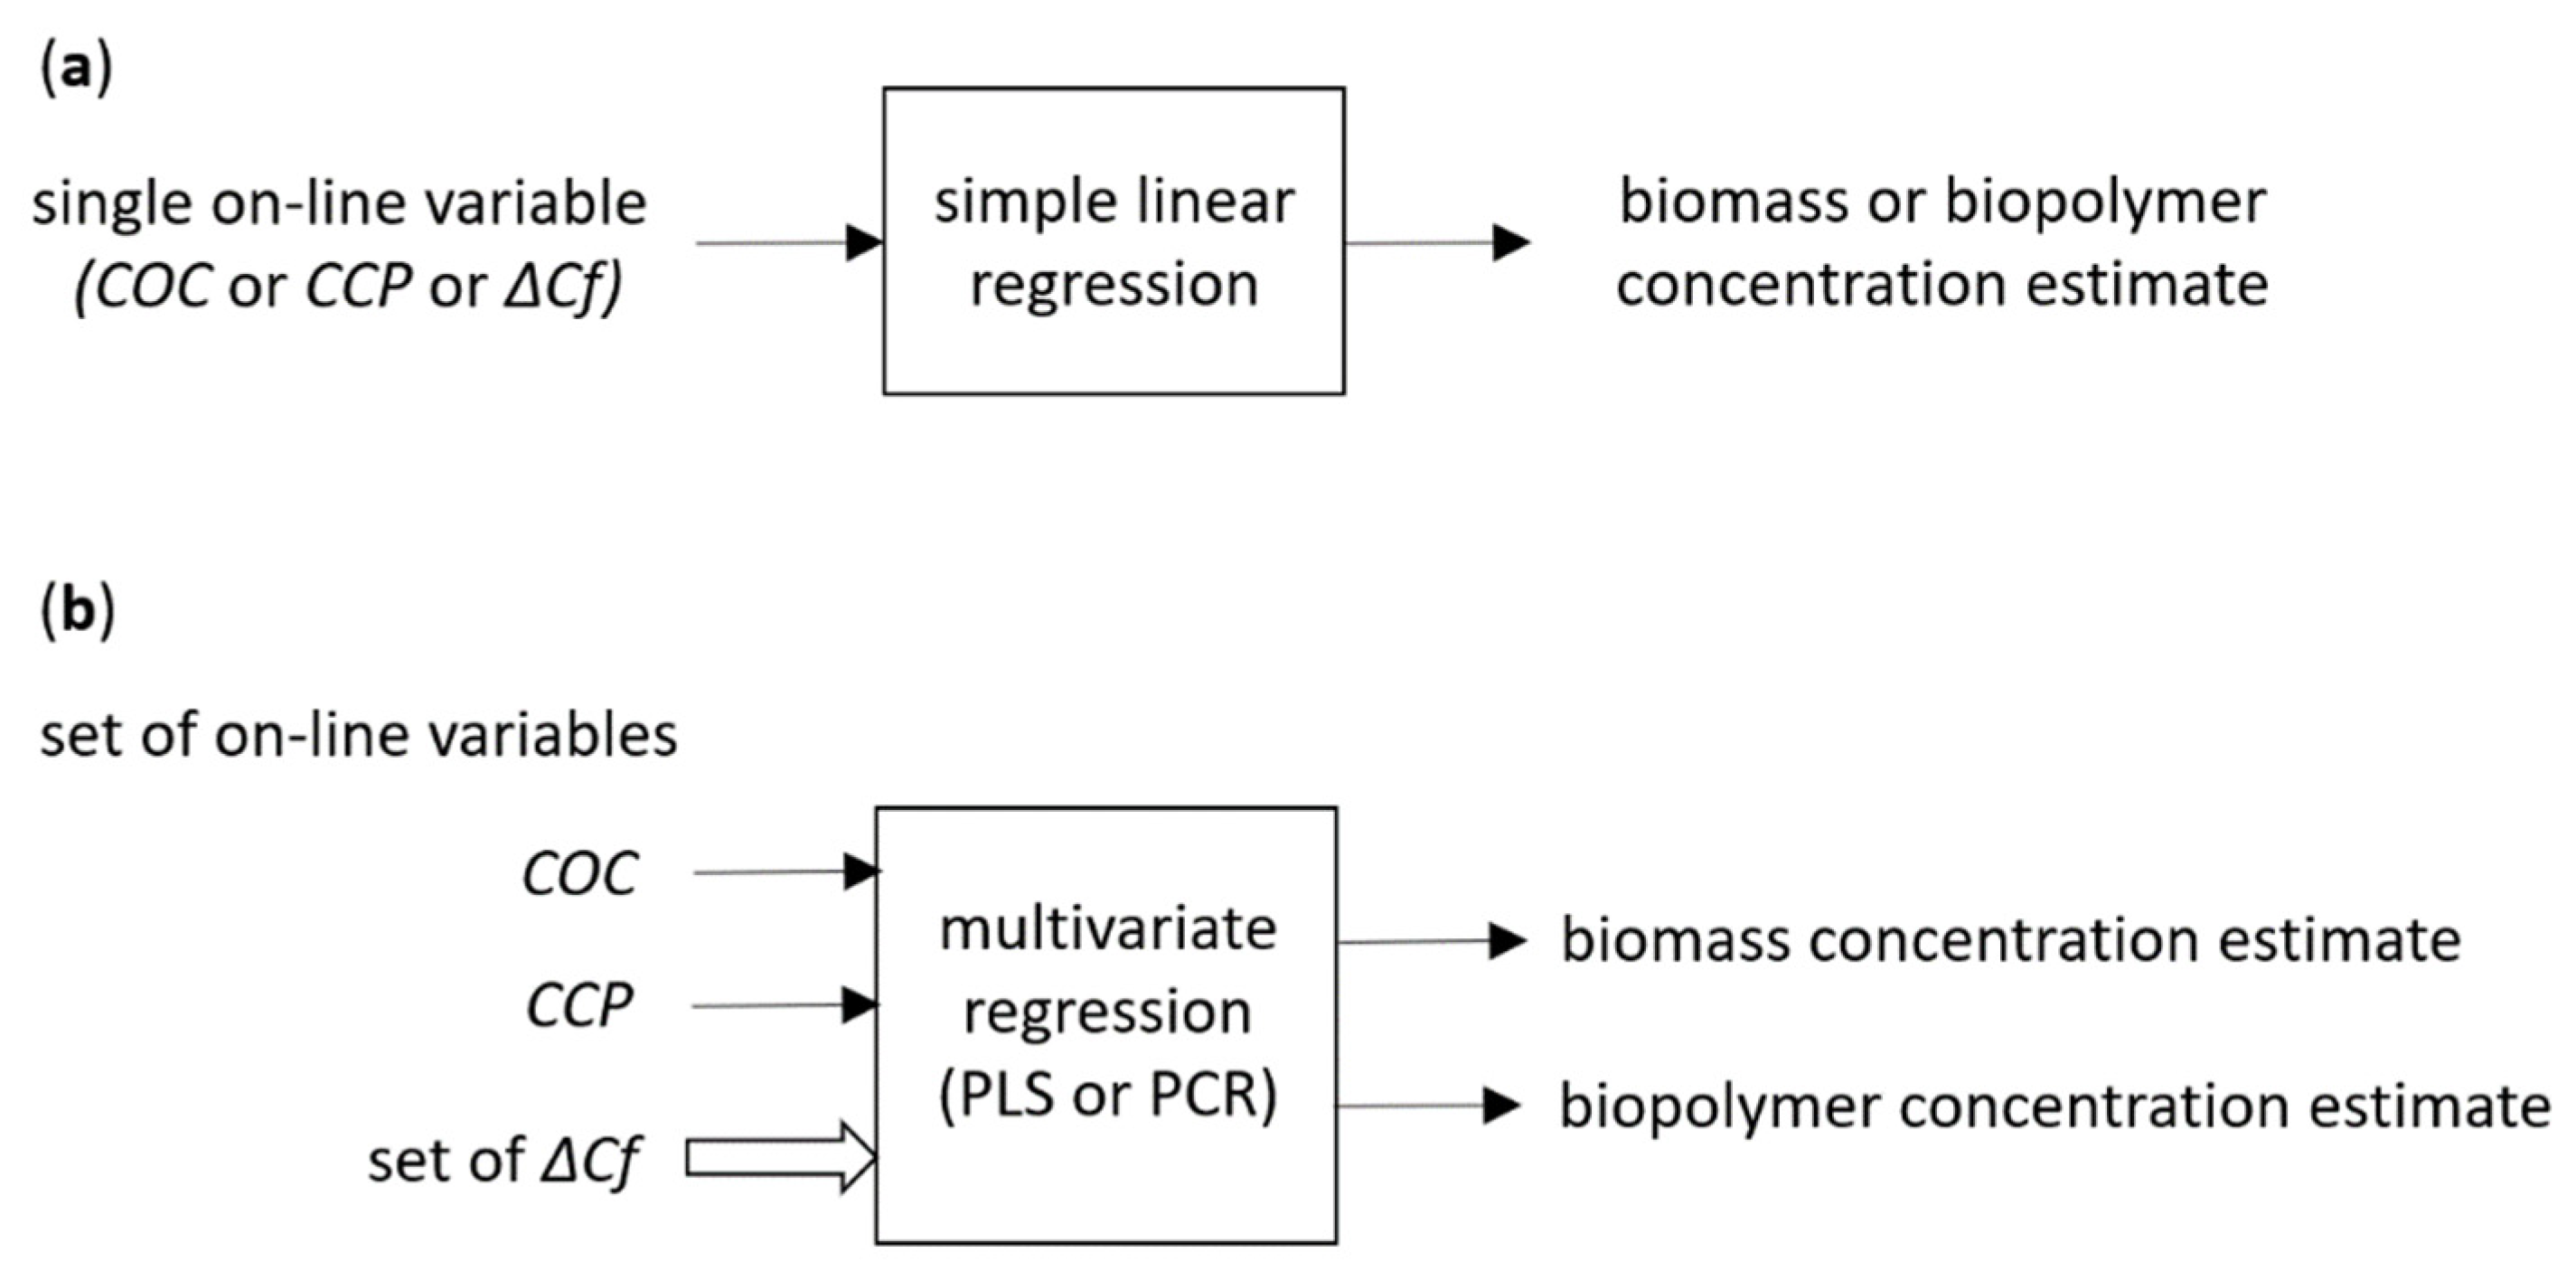
- Type 1: simply structured soft sensors based on simple linear regression, where biomass and biopolymer concentrations are estimated using only single input on-line process variable—COC or CCP or single ΔCf, see Equation (8) and Figure 4a.
- Type 2: comprehensively structured soft sensors based on multivariate statistical methods—partial least squares regression (PLS) or principal component regression (PCR), respectively, see Figure 4b. For a detailed description of both well-known methods, see, e.g., [25,26]. In both of these cases, the input of the soft sensors consisted of both mutually correlated cumulative quantities based on off-gas composition measurement (COC, CCP) combined with a selected set of ΔCf. The output of the sensors included both estimated concentrations (biomass and biopolymer). Specifically, the selected set of ΔCf comprised 12 capacitance measurement differences (ΔC0.12, ΔC0.16, ΔC0.19,…, ΔC1.40), i.e., capacitance measurement differences corresponding to the range of main frequencies fL from 0.12 to 1.40 MHz, for which high values of R2 were attained in relation to off-line concentrations in the regression analyzes described in Section 3.1. Thus, there were a total of 14 on-line variables at the input of these type 2 soft sensors–COC, CCP, and 12 ΔCf.
4. Conclusions
Funding
Data Availability Statement
Acknowledgments
Conflicts of Interest
References
- Faergestad, E.M.; Oyaas, J.; Kohler, A.; Berg, T.; Naes, T. The use of spectroscopic measurements from full scale industrial production to achieve stable end product quality. J. Food Sci. Technol. 2011, 44, 2266–2272. [Google Scholar] [CrossRef]
- Gao, Y.; Yuan, Y.J. Comprehensive quality evaluation of corn steep liquor in 2-keto-L-gulonic acid fermentation. J. Agric. Food Chem. 2011, 59, 9845–9853. [Google Scholar] [CrossRef]
- Cunha, C.C.F.; Glassey, J.; Montague, G.A.; Albert, S.; Mohan, P. An assessment of seed quality and its influence on productivity estimation in an industrial antibiotic fermentation. Biotechnol. Bioeng. 2002, 78, 658–669. [Google Scholar] [CrossRef]
- Luttmann, R.; Bracewell, D.G.; Cornelissen, G.; Gernaey, K.V.; Glassey, J.; Hass, V.; Kaiser, C.; Preusse, C.; Striedner, G.; Mandenius, C.F. Soft sensors in bioprocessing: A status report and recommendations. Biotechnol. J. 2012, 7, 1040–1048. [Google Scholar] [CrossRef]
- Sharma, S.; Tambe, S.S. Softsensor development for biochemical systems using genetic programming. Biochem. Eng. J. 2014, 85, 89–100. [Google Scholar] [CrossRef]
- Kadlec, P.; Gabrys, B.; Strandt, S. Data-driven soft sensors in the process industry. Comput. Chem. Eng. 2009, 33, 795–814. [Google Scholar] [CrossRef] [Green Version]
- Glassey, J.; Montague, G.A.; Ward, A.C.; Kara, B. Enhanced supervision of recombinant E. coli fermentations via artificial neural networks. Proc. Biochem. 1994, 29, 387–398. [Google Scholar] [CrossRef]
- Ödman, P.; Johansen, C.L.; Olsson, L.; Gernaey, K.V.; Eliasson Lantz, A. On-line estimation of biomass, glucose and ethanol in Saccharomyces cerevisiae cultivations using in-situ multi-wavelength fluorescence and software sensors. J. Biotechnol. 2009, 144, 102–112. [Google Scholar] [CrossRef] [PubMed]
- Aehle, M.; Kuprijanov, A.; Schaepe, S.; Simutis, R.; Luebbert, A. Simplified off-gas analyses in animal cell cultures for process monitoring and control purposes. Biotechnol. Lett. 2011, 33, 2103–2110. [Google Scholar] [CrossRef]
- Chéruy, A. Software sensors in bioprocess engineering. J. Biotechnol. 1997, 52, 193–199. [Google Scholar] [CrossRef]
- Montague, G.A.; Morris, A.J.; Tham, M.T. Enhancing bioprocess operability with generic software sensors. J. Biotechnol. 1992, 25, 183–201. [Google Scholar] [CrossRef]
- Ignova, M.; Glassey, J.; Ward, A.C.; Montague, G.A. Multivariate statistical methods in bioprocess fault detection and performance forecasting. Trans. Inst. Meas. Control 1997, 19, 271–279. [Google Scholar] [CrossRef]
- Albiol, J.; Robustr, J.; Casas, C.; Poch, M. Biomass estimation in plant cell cultures using an extended Kalman filter. Biotechnol. Prog. 1993, 9, 174–178. [Google Scholar] [CrossRef]
- Arnold, S.A.; Crowley, J.; Woods, N.; Harvey, M.L. In-situ near infrared spectroscopy to monitor key analytes in mammalian cell cultivation. Biotechnol. Bioeng. 2003, 84, 13–19. [Google Scholar] [CrossRef]
- Hrnčiřík, P. Software sensors for Monitoring of Biopolymer Production. In Proceedings of the 23rd International Conference on Process Control (PC), Virtual Event, Štrbské Pleso, Slovakia, 1–4 June 2021; pp. 308–312. [Google Scholar]
- Maskow, T.; Röllich, A.; Fetzer, I.; Ackermann, J.U.; Harms, H. On-line monitoring of lipid storage in yeasts using impedance spectroscopy. J. Biotechnol. 2008, 135, 64–70. [Google Scholar] [CrossRef] [PubMed]
- Maskow, T.; Röllich, A.; Fetzer, I.; Yao, J.; Harms, H. Observation of non-linear biomass-capacitance correlations: Reasons and implications for bioprocess control. Biosens. Bioelectron. 2008, 24, 123–128. [Google Scholar] [CrossRef]
- Kedia, G.; Passanha, P.; Dinsdale, R.M.; Guwya, A.J.; Lee, M.; Esteves, S.R. Addressing the challenge of optimum polyhydroxyalkanoate harvesting: Monitoring real time process kinetics and biopolymer accumulation using dielectric spectroscopy. Bioresour. Technol. 2013, 134, 143–150. [Google Scholar] [CrossRef] [PubMed]
- Li, L.; Wang, Z.J.; Chen, X.J.; Chu, J.; Zhuang, Y.P.; Zhang, S.L. Optimization of polyhydroxyalkanoates fermentations with on-line capacitance measurement. Bioresour. Technol. 2014, 156, 216–221. [Google Scholar] [CrossRef]
- Jenzsch, M.; Simutis, R.; Eisbrenner, G.; Stückrath, I.; Lübbert, A. Estimation of biomass concentrations in fermentation processes for recombinant protein production. Bioprocess Biosyst. Eng. 2006, 29, 19–27. [Google Scholar] [CrossRef]
- Sundström, H.; Enfors, S. Software sensors for fermentation processes. Bioprocess Biosyst. Eng. 2005, 31, 145–152. [Google Scholar] [CrossRef]
- Rønnest, N.P.; Stocks, S.M.; Eliasson Lantz, A.; Gernaey, K.V. Introducing process analytical technology (PAT) in filamentous cultivation process development: Comparison of advanced online sensors for biomass measurement. J. Ind. Microbiol. Biotechnol. 2011, 38, 1679–1690. [Google Scholar] [CrossRef] [PubMed]
- Liu, D.; Zhang, X.T.; Zhang, D.J.; Zeng, S.W.; Lu, P.L. Polyhydroxyalkanoate (PHA) Synthesis by Glycerol-Based Mixed Culture and Its Relation with Oxygen Uptake Rate (OUR). Huan Jing Ke Xue 2016, 37, 3518–3523. [Google Scholar] [PubMed]
- Zeng, S.W.; Wang, Z.Y.; Gao, J.; Liu, D.; Zhang, D.J.; Lu, P.L. On-Line Estimation for the Amount of Stored PHA in Activated Sludge Based on OUR-HPR Measurements. Huan Jing Ke Xue 2015, 36, 1713–1719. [Google Scholar] [PubMed]
- Jolliffe, I.T. A Note on the Use of Principal Components in Regression. J. R. Stat. Soc. Ser. C Appl. Stat. 1982, 31, 300–303. [Google Scholar] [CrossRef]
- Wold, S.; Sjöström, M.; Eriksson, L. PLS-regression: A basic tool of chemometrics. Chemom. Intell. Lab. Syst. 2001, 58, 109–130. [Google Scholar] [CrossRef]


| Variants | Coefficients of Determination (R2) | |
|---|---|---|
| Biomass Concentration (CDW) | Biopolymer Concentration (PHA) | |
| Case 1 | 0.46 | 0.40 |
| Case 2 | 0.59 | 0.53 |
| Case 3 | 0.98 | 0.98 |
| Case 4 | 0.97 | 0.98 |
| Sensor Types | RMSE-CV (% of Measurement Range) | |
|---|---|---|
| Biomass Concentration Estimation | Biopolymer Concentration Estimation | |
| Type 1 (COC as input) | 3.64% | 4.63% |
| Type 1 (CCP as input) | 4.15% | 4.64% |
| Type 1 (ΔC0.24 as input) | – | 5.53% |
| Type 1 (ΔC0.58 as input) | 3.42% | – |
| Type 2 (PLS-based) | 2.78% | 4.46% |
| Type 2 (PCR-based) | 2.85% | 4.47% |
Publisher’s Note: MDPI stays neutral with regard to jurisdictional claims in published maps and institutional affiliations. |
© 2021 by the author. Licensee MDPI, Basel, Switzerland. This article is an open access article distributed under the terms and conditions of the Creative Commons Attribution (CC BY) license (https://creativecommons.org/licenses/by/4.0/).
Share and Cite
Hrnčiřík, P. Monitoring of Biopolymer Production Process Using Soft Sensors Based on Off-Gas Composition Analysis and Capacitance Measurement. Fermentation 2021, 7, 318. https://doi.org/10.3390/fermentation7040318
Hrnčiřík P. Monitoring of Biopolymer Production Process Using Soft Sensors Based on Off-Gas Composition Analysis and Capacitance Measurement. Fermentation. 2021; 7(4):318. https://doi.org/10.3390/fermentation7040318
Chicago/Turabian StyleHrnčiřík, Pavel. 2021. "Monitoring of Biopolymer Production Process Using Soft Sensors Based on Off-Gas Composition Analysis and Capacitance Measurement" Fermentation 7, no. 4: 318. https://doi.org/10.3390/fermentation7040318
APA StyleHrnčiřík, P. (2021). Monitoring of Biopolymer Production Process Using Soft Sensors Based on Off-Gas Composition Analysis and Capacitance Measurement. Fermentation, 7(4), 318. https://doi.org/10.3390/fermentation7040318