Abstract
Ten unstructured models of Monod, Mink, Tessier, Moser, Aiba, Andrews, Haldane, Luong, Edward, and Han-Levenspiel are considered in this paper to explain the kinetics of cell growth for batch cultivation of the yeast Kluyweromyces marxianus var. lactis MC 5. For the first time, two independent kinetic models are used to model the process for the two basic substrates—lactose and oxygen. The selection of the most appropriate growth rate models has been made through a new multi-criteria decision-making approach called the Inter-Criteria Decision Analysis (ICDA) method. The application of ICDA to the growth rate of lactose and oxygen alone has shown that there have been many correlations between the studied models. Thus, the models for the growth rate, depending only on lactose, are reduced to one—Monod model and there are two models—Monod and Mink—depending on oxygen only. Separate kinetic process models have been developed for the combination of Monod–Monod and Monod–Mink models. For the first time, in addition to the multiplicative form, the additive form of a specific growth rate has been studied. The comparison of the obtained results has shown that the additive form has shown better results than the multiplicative one. For this reason, the additive form of the Monod–Monod model will be used to model the process.
1. Introduction
Cheese is a unique product with a high caloricity and physiological sufficiency. It is conditioned from the high proteins and greases, from the presence of well-assimilated human organism peptides and free amino acids, vitamins, and microelements. The white brine cheese is a rich source of calcium, vitamins A, D, E, and vitamins from the B group, lipids, sodium, and lactose [].
Strains belonging to the yeast species Kluyveromyces marxianus have been isolated from a great variety of habitats, which results in a high metabolic diversity and a substantial degree of intraspecific polymorphism. As a consequence, several different biotechnological applications have been investigated with this yeast: production of enzymes, of single-cell protein, of aroma compounds, and of ethanol (including high-temperature and simultaneous saccharification-fermentation processes); reduction of lactose content in food products; production of bioingredients from cheese-whey; bioremediation as an anticholesterolemic agent and as a host for heterologous protein production [,,,,].
There are many methods [] for multi-criteria decision-making (MCDM). The most commonly used are analytical hierarchy processes [], elimination and choice expressing reality (ELECTRE) [], multi-attribute utility theory (MAUT) [], and the preference ranking organization method (PROMETHEE) []. Recently, methods such as intuitionistic fuzzy MCDM [] and Type-2 neutrosophic number-based multi-attributive [] have also gained popularity.
In this work, we use a new Inter-criteria Decision Analysis (ICDA) method based on the belief functions to identify and assess the possible degree of agreement (i.e., excess) between some criteria derived from the data (point values). This allows us to remove any redundant criteria or objects of the original MCDM problem and thus solve a simplified (almost) and equivalent MCDM problem faster and at lower computational costs. The ICDA was originally developed by Atanassov et al. [] based on intuitionistic fuzzy sets [,,,] and indexed matrices [,,]. The approach uses the concept of index matrix (IM), using, in particular, some of the operations introduced on them, and the concept of intuitionistic blurring, thus giving us the tools to construct an IM of intuitionistic fuzzy pairs [].
The method is applied for the analysis and modeling of biotechnological processes [,,,,] and for evaluating the index of pollution of Struma and Mesta rivers [,], etc.
There is no general mathematical model of microbial synthesis due to the extreme complexity and great variety of vital activity of microorganisms, although there are different models of the biotechnological process. Recently, efforts have been made to develop generalized models in the field of biotechnology [].
An unstructured kinetic model was developed [] for the serial production of bioethanol from the yeast Kluyveromyces marxianus DSM 5422, as well as from renewable sources and agricultural and food products. The experimental data have been collected from multiple fermentations in bioreactors with three different initial concentrations for each substrate. This data has been used to evaluate the parameters and to validate a Monod model of the Haldane type in combination with the term Jerusalimsky for non-competitive inhibition of the product.
In our publications, attention has been focused on modeling the bath process of cultivation of yeast Kluyveromyces marxianus var. lactis MC 5 taking into account the mass exchange processes [,,] in [] a mathematical model of batch cultivation of yeast Kluyveromyces marxianus var. lactis MC 5. In the model of the process, the mass-transfer in the bioreactor for oxygen concentration in the gas phase (GP) and the liquid phase (LP) is based on the dispersion model of the GP. In addition, perfect mixing in LP is included. Nine growth rate models for lactose and oxygen have been studied: Monod, Mink, Tessier, Aiba, Andrews, Haldane, Luong, Edward, and Han-Levenspiel. The models are compared using criteria for identification of kinetics parameters in the models, relative error, and statistic λ. Based on the study (the comparison was made according to the above criteria), it was found that the models of Mink and Haldane, Mink and Luong, and Mink and Han-Levenspiel fit best. The main disadvantage of this study is that the selected combinations of models are made by simply comparing the accepted criteria. Some of the MCDM methods have not been used.
To address this shortcoming in the selection of models in [], the ICDA was used to evaluate the same models. The application of ICDA has shown that the most suitable for lactose are the models of Monod and Mink. As far as it concerns the growth rate from oxygen, the most suitable ones are the models of Mink, Tessier, and Haldane. In this way, the application of the ICDA has permitted us to investigate the combination of only groups of models—Monod for lactose and Mink, Tessier, and Haldane for oxygen, and Mink with the same models for oxygen. In [], the Moser model was added to the nine models studied. Additional criteria such as the Fisher function and the correlation coefficient were added to the model evaluation criteria. The results obtained after the application of ICDA have shown that the models were reduced at the growth rate from lactose to only three—Mink, Tessier, and Haldane. For the growth rate from oxygen, there were only two—Mink and Haldane. The application of the ICDA has permitted us to investigate only the combination of the models Mink, Tessier, and Haldane for lactose, and Mink and Haldane for oxygen.
We have discrepancies in the preferred models considering the presented results for model selection when applying the ICDA method. This is due to the fact that the research was conducted under different conditions. In the first case [,], we have nine models and eight comparison criteria: criteria of evaluation of the model parameters, statistic λ, correlation coefficient, and Fisher coefficient. In the second case, we have ten models and eleven comparison criteria. A relative error has been added to the above criteria for comparing models. In both cases, the model of yeast Kluyveromyces marxianus var. lactis MC 5 is composed of three kinetic variables—concentration of biomass, lactose, and oxygen. The models also include an important indicator of mass transfer—gas hold-up.
In the present work, we aim to make a comparison between the ten growth rate models—Monod, Mink, Tessier, Moser, Aiba, Andrews, Haldane, Luong, Edward, and Han-Levenspiel. The models are developed separately for the two main substrates—lactose and oxygen with perfect mixing in the bioreactor. Mass-transfer and gas hold-up are not reported. The selection of the most suitable models will be made through the application of ICDA. Then, a simulation of the general model of a batch process in the cultivation of Kluyveromyces marxianus var. lactis MC 5 will be made. So far, no additive form of specific growth rate has been used in any study of this process. At the end of the manuscript, multiplicative and additive forms of specific growth rates will be compared.
2. Materials and Methods
2.1. Experimental Investigation
The cultivation conditions [] of the yeast Kluyveromyces marxianus var. lactis MC 5 are shown in Table 1.

Table 1.
Cultivation conditions of yeast Kluyveromyces marxianus lactis var. lactis MC 5.
Six fermentations were performed by an aerobic batch cultivation of Kluyweromyces Marxianus lactis MC 5. Experimental studies have been performed on a computer-controlled laboratory bioreactor 2L-M with a magnetic drive [].
2.2. Kinetic Models
The conventional model includes a cell concentration in the dependence between concentrations of the basic energetic substrates: lactose and oxygen. The models are synthesized independently for the lactose and the oxygen:
2.2.1. Biomass Production from Lactose Only
2.2.2. Biomass Production from Oxygen Only
The initial conditions of both models (1)–(4) are [,,]: X(0) = 0.2 g/L, S(0) = 44 g/L, C(0) = 6.65 × 10⁻³ g/L, and C* = C(0).
2.2.3. System Constraints of Both Processes
Nearly all engineering processes have physical constraints. The lactose and oxygen concentration must be positive all the time for the processes, otherwise, an unrealistic solution in the identification problem will be obtained:
In addition, here are the following constraints for stochiometry of the processes:
where x = vector of estimated parameters, for model (1)–(2), and for model (3)–(4).
2.2.4. Specific Growth Rate Models
This work compares ten unstructured models []: M1 = Monod, M2 = Mink, M3 = Tessier, M4 = Moser, M5 = Aiba, M6 = Andrews, M7 = Haldane, M8 = Luong, M9 = Edward, and M10 = Han-Levenspiel in order to explain the kinetics of the cell growth.
2.2.5. Criteria for Evaluation of the Model Parameters
The least-squares error is commonly employed as a criterion to inspect how close the computed profiles of the state variables come to the experimental observations []:
where Q1 and Q2 = sums of the squares of weighted residuals only from lactose or oxygen; N = number of the experiments, N = 12; ti = time partitions, h; and = experimental and simulated values of kinetics variables, respectively, g/L; = maximal values of every kinetic variable, g/L.
The constraints are included in the parameter estimation problem (9)–(10), in order to avoid unrealistic predicted values:
where x = vector of the estimated parameters; C1(S) and C1(C) = criteria of minimization for lactose-only and for oxygen-only; tf = final time, h; gi(t, x)—system constraints, i = 1,…, 4; wi = the weight of each constraints, wi = 102. Such a large weight of each constrain is chosen to make it easier to identify models. If the constraints are satisfied then gi(t, x) = 0.
2.2.6. Criteria for Model Validations
The criteria for evaluating the parameters in the models have been used to validate and verify the adequacy of the models. Statistical criteria: relative error (SL) that shows the error between the experimental and simulated results and the correlation coefficient (R2), which is one of the most commonly used to assess the adequacy of the regression models.
Two criteria have been used to test the null hypothesis: statistics λ is the criteria for testing the hypothesis of zero mean deviation of the model and experimental data. This criterion has been used in Giridhar and Srivastava []. Bard is cited in this publication, who recommends that this criterion be used to assess the reliability of biotechnological process models. In addition to this criterion for testing the null hypothesis, the standard Fisher coefficient is included.
The formulas for calculating statistic λ, relative error (SL), Fisher coefficient (F), and correlation coefficient (R2) are fully presented in [].
The criteria for model validation have the following designations:
- C1(S) or C1(C)—criteria for evaluation of model parameters (11)–(12);
- C2(S) or C2(C)—statistics λ. The criterion C2 was compared to the tabular Fisher coefficient () with a degree of freedom ;
- Relative error (SL) for kinetics variables: and for lactose only or and for oxygen only;
- Fisher coefficient (F) for the kinetics variables: and for lactose only or and for oxygen only. Similarly, the obtained values of , C6(S), , and C6(C) have been compared with the tabular Fischer coefficient, but for degrees of freedom FT(11, 2);
- Experimental correlation coefficient (R2) for kinetics variables: and for lactose only or and and . The obtained values of , C8(S), , and C8(C) have been compared to the tabular correlation coefficient with a degree of freedom .
2.3. Software for Identification of Kinetics Parameters and Computing Criteria
An algorithm and program of COMPAQ Visual FORTRAN 90 [] have been developed in order to identify the parameters in the models (1)–(10) for the batch cultivation process of yeast Kluyweromyces marxianus var. lactis MC 5. We have used the average values of the kinetic variables of the six fermentations for modeling the process. For solving the nonlinear problem (11)–(12), we have used a direct search method, a subroutine BCPOL with a double-precision from IMSL Math/Library []. All computations have been performed using HexaCore AMD Phenom II X6 1075T, 3 GHz, 8 GB RAM, Windows XP operating system (32 bit).
2.4. Background of the ICDA Method
Following [,,,], from an Intuitionistic Fuzzy Pair (IFP) [] we have obtained an estimation of the degrees of “agreement” and “disagreement” between two criteria applied to different objects. An IFP is an ordered pair of real non-negative numbers such that .
Consider an IM [,,] whose index sets consist of the criteria (for rows) and objects (for columns). The elements of this IM are further assumed to be real numbers. An IM with index sets consisting of the criteria (for rows and for columns) with elements IFPs corresponding to the degrees of “agreement” and “disagreement” between the respective criteria is then constructed.
Let O denote the set of all objects being evaluated, and be the set of values assigned to the objects by a given criterion C, i.e.,
Then, let .
In order to find the “agreement” between two criteria, the vector of all internal comparisons of each criterion, which fulfills exactly one of the following three relations: , , and is constructed. In other words, it is required that for a fixed criterion and any ordered pair it is true that:
Only a subset of needs to be considered for the effective calculation of the vector of internal comparisons (further denoted by ) since from (13)–(15) it follows that if the relation between and is known, then so is the relation between y and x. Thus, of interest are only the lexicographically ordered pairs Denote for brevity . Then, for a fixed criterion C, the vector with elements is obtained:
Let be replaced by , where for the k-th component ():
When comparing two criteria, the degree of “agreement” is determined as the number of matching components of the respective vectors, divided by the length of the vector for normalization purposes. The degree of “disagreement” is the number of components of opposing signs in the two vectors, again normalized by the length. The ordered pair is an IFP. In most of the obtained pairs, the sum is equal to 1. However, there may be some pairs, for which this sum is less than 1. The difference is considered as a degree of “uncertainty”.
Let be given, so that . The criteria C and are in:
- —Positive consonance (PC), if and ;
- —Negative consonance (NC), if and ;
- —Dissonance (D), otherwise.
The method is described in detail in the publications of colleagues [,,,].
Research implies a more detailed description of the membership function and non-membership function (Table 2).
Table 2.
Intuitionistic fuzzy threshold values for membership and non-membership function.
3. Results and Discussions
3.1. Results for Independent Process Models
Table 3 and Table 4 show the results for the criteria by which the models (M1–M10) are validated from lactose only (1)–(2) and from oxygen only (3)–(4).
Table 3.
Criteria for the model validation from lactose only.
Table 4.
Criteria for the model validation from oxygen only.
The minimal (Cimin) and maximal (Cimax) values of every criterion for lactose only and oxygen only are shown in Table 5.
Table 5.
Intervals of change of lactose only and oxygen only criteria.
The criteria C2, C5, and C6 are the criteria for testing the zero hypothesis. These criteria have tabular values to which they are compared to. The tabular values of C2 and C5–C8 are given from statistical tables []. Fisher coefficient for C2 (statistic λ) is . For Fisher coefficients (C5 and C6) it is FT(11, 2) = 19.40, and for correlation coefficients (C7 and C8) the tabular value is , for level of significance α = 0.01. The criteria , the experimental Fisher coefficients, criteria (C5 and C6) < FT(11, 2), and the experimental correlation coefficients criteria (C7 and C8) > . The presented results show that in terms of the criteria for validation (C2, C5–C8) all growth rate models depending on lactose only or oxygen only are adequate.
Figure 1 shows the results for the biomass formation depending on lactose only or oxygen only.
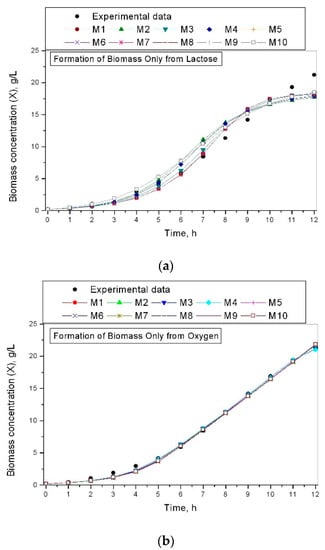
Figure 1.
Formation of biomass from investigated models: (a) formation of biomass only from lactose; (b) formation of biomass only from oxygen.
Figure 1a for the biomass concentration dependent on lactose-only presents that there is a discrepancy between the experimental and simulated data for the kinetic variable.
Figure 1b for the biomass concentration dependent on oxygen-only presents that there is a different situation. All investigated growth rate models describe very well the experimental values of the kinetic variables of the process.
Figure 2 shows the results of lactose or oxygen concentration for models (1)–(2) and (3)–(4).
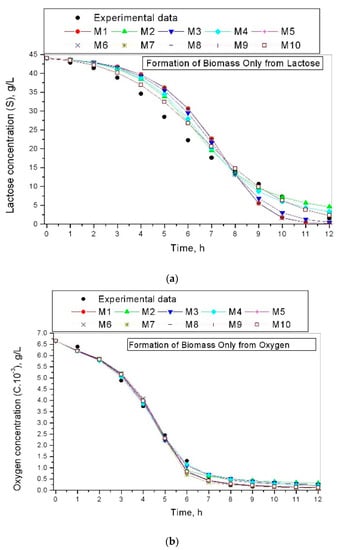
Figure 2.
Lactose and oxygen concentration for investigated models: (a) lactose concentration for models (1)–(2); (b) oxygen concentration for models (3)–(4).
Figure 2a,b shows a similar situation to the reasoning made for Figure 1a,b. The modeling of the lactose concentration model (1)–(2) shows a relatively lower correspondence between the experimental and simulated results compared to the results obtained by models (3)–(4), shown in Figure 2b. These results show that the influence of oxygen on the cell growth kinetics is more than that of lactose.
The application of the ICDA method will show which models will drop out.
3.2. Application of ICDA Method
In ICDA, the method is included in the criteria C1–C8. The objects (alternative) in the ICDA are the investigated growth rate models. The method is used for the selection of the growth rate for independent models (1)–(2) and (3)–(4). For selecting growth rate models, we have to have many high values of the membership function (μ) because we have accepted α = 0.95 and β = 0.05.
The values of the membership function (μ) and non-membership function (ν) have been calculated with the help of the software (ICrAData) developed by our colleagues [] for the realization of the method. ICrAData applies five different algorithms for calculating inter-criteria relationships, namely: µ-biased, Unbiased, ν-biased, Balanced, and Weighted. The ICrAData software displays results in two panels—matrix and graphical. The results can be exported in different formats: matrices, vectors, and graphs. In the matrix view, the data from the columns can be sorted in ascending or descending order. The graphical view has options for resizing the intuitionistic fuzzy triangle, displaying a grid, and assigning different colors to the dots.
Table 6.
Index matrix B1µ for lactose only.
We are not interested in models that have dissonance. From Table 6 it can be seen that we have many models that have a strict PC (µ = 1.00) and a strong PC (Table 1).
The strict PC is obtained by models: M1(S) ↔ M3(S) ↔ M5(S) ↔ M6(S) ↔ M7(S) ↔ M8(S) ↔ M9(S); M2(S) ↔ M10(S), and the strong PC—by models:
M1(S) ↔ M2(S) ↔ M3(S) ↔ M4(S) ↔ M5(S) ↔ M6(S) ↔ M7(S) ↔ M8(S) ↔ M9(S) ↔ M10(S).
After applying the ICDA method for analysis and evaluation of growth rate models depending on lactose only, it turns out that the most suitable model is the M1(S) Monod model.
Table 7.
Index matrix B2µ for oxygen only.
We are not interested in models that have dissonance (Table 7). From Table 7, it can be seen that we have many models that have a strict PC (µ = 1.00) and a strong PC (Table 1).
A strict PC and a strong PC is possessed by the models: M1(C) ↔ M4(C) and M2(C) ↔ M5(C) ↔ M6(C) ↔ M7(C) ↔ M8(C) ↔ M9(C) ↔ M10(C).
The analysis of the results (Table 7) shows that for oxygen only, we have two models with a strict PC—M1(C) and with a strong PC—M2(C).
The results obtained after the application of ICDA (Table 6 and Table 7) show that the most suitable model for the growth rate for lactose only is the Monod model, and for oxygen only we have two models—Monod and Mink.
Therefore, for a specific growth rate of the process we have two cases:
Case 1:
Case 2:
The kinetic model of the process for both cases has the form:
where j = 1—Case 1, and j = 2—Case 2.
For the first time, the additive form of a specific growth rate will be studied to model this process:
Case 3:
Case 4:
The formation of biomass over time from the two main substrates, lactose and oxygen, has the form:
The concentration of lactose over time depends only on the growth rate of lactose:
The concentration of oxygen over time depends only on the growth rate of oxygen:
where for Case 3 → j = 3, and k = 3, 4, and for Case 4 → j = 4, and k = 5, 6.
The next part of the work will present the modeling and comparison between the considered variants of specific growth rates.
3.3. Results after Modeling of Processes for Four Different forms for the Specific Growth Rate
Another algorithm and program of COMPAQ Visual FORTRAN 90 [] have been developed in order to identify the parameters in models (13)–(20). All computations have been performed using HexaCore AMD Phenom II X6 1075T, 3 GHz, 8 GB RAM, Windows XP operating system (32 bit).
Table 8 shows the calculated values of the kinetic parameters, after identification of models (16)–(23).
Table 8.
Values of parameters in models, where i = 1, 4, and j = 1, 6.
The simulation results for biomass, lactose, and oxygen concentration for the investigated model of specific growth rates are shown in Figure 3.
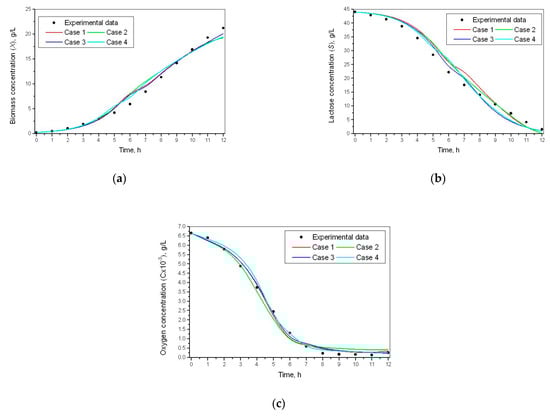
Figure 3.
Simulation results for kinetics variables of the process. (a) Biomass concentration; (b) lactose concentration; (c) oxygen concentration.
The criteria for comparing the models (16)–(23) are different from the criteria used in models (1)–(4). In this case, instead of eight criteria, we have eleven. This is due to the fact that we already have three kinetic variables of the process—X, S, and C:
- -
- C1(j) = criteria for evaluation of kinetic parameters in four models of specific growth rate, j = 1,…, 4;
- -
- C2(j) = statistic λ for the kinetics variables of four models of specific growth rate, j = 1,…, 4;
- -
- C3(X), C4(S), C5(C) = relative error (SL) for the kinetics variables of four models of specific growth rate;
- -
- C6(X), C7(S), C8(C) = experimental Fisher coefficient for the kinetics variables of four models of specific growth rate;
- -
- C9(X), C10(S), C11(C) = experimental correlation coefficient R2 for kinetics variables of four models of specific growth rate.
Criteria C1(j) for evaluation of kinetics parameters in models (16)–(23) are determined by the following dependence:
where C1(j)—sums of the squares of weighted residuals for four models, j = 1,…, 4.
Table 9 shows the calculated values of the criteria for different cases.
Table 9.
Values for the criteria by a different case.
Here is the moment to specify that for criteria C1–C8 we are looking for a minimum, and for criteria C9–C11 we are looking for a maximum (Table 9). The better values of criteria C1–C11 are marked in green. The maximum values for criteria C1–C8, and the minimum values for criteria C9–C11 are marked in red.
Table 10.
Values for the criteria by a different case.
Table 10 shows that we have a strict PC for Case 1 ↔ Case 3 ↔ Case 4. These results show that models (16) and (19)–(20) are completely identical. Model (17) is dropped out because µ = 0.8909 < 0.95.
The presented results (Figure 3, Table 9) show that the additive form of Mono, the Monod model (Case 3) has better indicators of the criteria. Case 3 has better results than the other two choices. Criteria C1–C4 and C7 have a minimum, and criteria C9 and C11 have a maximum. Therefore, this case has been chosen as a model for the specific growth rate.
4. Conclusions
This work has studied ten unstructured models for the growth rate of batch cultivation of yeast Kluyweromyces marxianus var. lactis MC 5 depending on the lactose and oxygen, which are the two main substrates of the processes. Two independent kinetic models have been used for the first time in the modeling for lactose and oxygen. The comparison of the results has been achieved by using all criteria. Statistic λ, Fisher function, and correlation coefficient have shown that all ten models are adequate and can be used for the modeling of the process. The studies made show that there are better results in the kinetic model dependent only on oxygen. This shows that the kinetics of biomass growth is influenced more by oxygen than by lactose.
The application of the ICDA method shows that the most appropriate pair of models is the Monod model for lactose. For oxygen, there are two models—Monod and Mink. The application of the method for the establishment of the correlation connections between the different models for the growth rate for modeling of these processes is very useful not only for assessment and eliminating of equivalence models but also for determination (by dissonance) of how much each of the patterns is closer to the actual experimental data. In establishing correlations between these types of models using ICDA we cannot talk about negative consonance; this would mean that the models do not reflect the real situation of the process and the purpose should have a completely different description of the growth kinetics.
This work also studies for the first time the additive form of a specific growth rate for the modeling of this process, not only the multiplicative form. The idea for studying this form comes from the fact that two independent kinetic models have been used–for lactose and oxygen. The process has been modeled for the four cases of specific growth rates. Both options of the multiplicative form of the combinations of models Monod–Monod and Monod–Mink have been studied, as well as their two options for their additive forms.
The comparison between the multiplicative and additive forms shows that the additive form of the specific growth rate has better results. The additive form of the Monod–Monod model has been selected for modeling of the specific growth rate.
The ICDA method has one drawback. The method does not take into account what the criterion is, whether a minimum or a maximum is sought. The ICDA has another limitation—the objects and criteria cannot be less than two, i.e., the minimum dimension of the indexed matrix is 2 × 2.
In our future work, we will perform a multi-objective parameter estimation for the six fermentations and a sensitivity analysis in a batch cultivation of Kluyveromyces marxianus var. lactis MC 5. In this way, the maximum values of the model parameters will be determined, and they can be used for optimization and optimal control of the process.
The approach can be used in the cultivation of stem cells, mammalian cell cultures, and other processes that consume oxygen. The application of the ICDA method in various fields of biotechnology is quite possible.
Funding
This research received no external funding.
Conflicts of Interest
The author declares no conflict of interest.
References
- Food-Info.Net. Available online: http://www.food-info.net/uk/dairy/cheese-production.htm (accessed on 1 July 2017).
- Fonseca, G.G.; Heinzle, E.; Wittmann, C.; Gombert, A.K. The yeast Kluyveromyces marxianus and its biotechnological potential. Appl. Microbiol. Biotechnol. 2008, 79, 339–354. [Google Scholar] [CrossRef]
- Llorente, B.; Malpertuy, A.; Blandin, G.; Artiguenave, F.; Wincker, P.; Dujon, B. Genomic exploration of the hemiascomycetous yeasts: 12. Kluyveromyces marxianus var. Marxianus. FEBS Lett. 2000, 487, 71–75. [Google Scholar] [CrossRef] [Green Version]
- Varela, J.A.; Gethins, L.; Stanton, C.; Ross, P.; Morrissey, J.P. Applications of Kluyveromyces marxianus in Biotechnology. In Yeast Diversity in Human Welfare; Satyanarayana, T., Kunze, G., Eds.; Springer: Singapore, 2017; pp. 439–453. [Google Scholar]
- Barone, E.; Ponticello, G.; Giaramida, P.; Squadrito, M.; Fasciana, T.; Gandolfo, V.; Ardizzone, F.; Monteleone, M.; Corona, O.; Francesca, N.; et al. Use of Kluyveromyces marxianus to increase free monoterpenes and aliphatic esters in white wines. Fermentation 2021, 7, 79. [Google Scholar] [CrossRef]
- Karim, A.; Gerliani, N.; Aïder, M. Kluyveromyces marxianus: An emerging yeast cell factory for applications in food and biotechnology. Int. J. Food Microbiol. 2020, 333, 108818. [Google Scholar] [CrossRef] [PubMed]
- Taha, R.A.; Daim, A.T. Multi-Criteria Applications in Renewable Energy Analysis, a Literature Review. In Research and Technology Management in the Electricity Industry. Green Energy and Technology; Daim, T., Oliver, T., Kim, J., Eds.; Springer: London, UK, 2013; pp. 17–30. [Google Scholar] [CrossRef]
- Saaty, R.W. The analytic hierarchy process–What it is and how it is used. Math. Model. 1987, 9, 161–176. [Google Scholar] [CrossRef] [Green Version]
- Figueira, J.; Mousseau, V.; Roy, B. ELECTRE Methods, Multiple Criteria: State of the Art Surveys. In International Series in Operations Research & Management Science; Greco, S., Ed.; Springer: New York, NY, USA, 2005; Volume 78, pp. 133–153. [Google Scholar]
- Dyer, J. MAUT—Multiatribute Utility Theory. In Multiple Criteria: State of the Art Surveys, International Series in Operations Research & Management Science; Greco, S., Ed.; Springer: London, UK, 2005; Volume 78, pp. 265–292. [Google Scholar]
- Brans, J.-P.; Vinke, P. A preference ranking organisation method (The PROMETHEE method for multiple criteria decision making). Manag. Sci. 1985, 31, 647–656. [Google Scholar] [CrossRef] [Green Version]
- Karagoz, S.; Deveci, M.; Simic, S.; Aydin, N.; Bolukbas, U. A novel intuitionistic fuzzy MCDM-based CODAS approach for locating an authorized dismantling center: A case study of Istanbul. Waste Manag. Res. 2020, 38, 660–672. [Google Scholar] [CrossRef]
- Deveci, M.; Erdogan, N.; Cali, U.; Stekli, J. Type-2 neutrosophic number based multi-attributive border approximation area comparison (MABAC) approach for offshore wind farm site selection in USA. Eng. Appl. Artif. Intell. 2021, 103, 104311. [Google Scholar] [CrossRef]
- Atanassov, K.; Mavrov, D.; Atanassova, V. Intercriteria decision making: A new approach for multicriteria decision making, based on index matrices and intuitionistic fuzzy sets. Issues Intuit. Fuzzy Sets Gen. Nets 2014, 11, 1–8. [Google Scholar]
- Atanassov, K. Intuitionistic fuzzy sets. VII ITKR Session, Sofia, 20–23 June 1983. Reprinted. Int. J. Bioautomation 2016, 20, S1–S6. [Google Scholar]
- Atanassov, K. Intuitionistic fuzzy sets. Fuzzy Sets Syst. 1986, 20, 87–96. [Google Scholar] [CrossRef]
- Atanassov, K. Intuitionistic Fuzzy Sets. In Theory and Applications; Physica-Verlag: Berlin, Germany, 1999. [Google Scholar]
- Atanassov, K. On Intuitionistic Fuzzy Sets Theory; Springer: Berlin, Germany, 2012. [Google Scholar]
- Atanassov, K. Generalized Index Matrices. Comptesrendus De L’academiebulgare Des Sci. 1987, 11, 15–18. [Google Scholar]
- Atanassov, K. On index matrices, Part 1: Standard cases. Adv. Stud. Contemp. Math. 2010, 20, 291–302. [Google Scholar]
- Atanassov, K. On index matrices, Part 2: Intuitionistic fuzzy case. Proc. Jangjeon Math. Soc. 2010, 13, 121–126. [Google Scholar]
- Atanassov, K.; Szmidt, E.; Kacprzyk, J. On intuitionistic fuzzy pairs. Notes Intuit. Fuzzy Sets 2013, 19, 1–13. [Google Scholar]
- Ilkova, T.; Petrov, M. Intercriteria analysis for identification of Escherichia coli fed-batch mathematical model. J. Int. Sci. Publ. Mater. Methods Technol. 2015, 9, 598–608. [Google Scholar]
- Pencheva, T.; Angelova, M.; Vassilev, P.; Roeva, O. Intercriteria analysis approach to parameter identification of a fermentation process model. In Advances in Intelligent Systems and Computing; Atanassov, K., Castillo, O., Kacprzyk, J., Krawczak, M., Melin, P., Sotirov, S., Sotirova, E., Szmidt, E., De Tré, G., Zadrożny, S., Eds.; Springer: Cham, Switzerland, 2016; Volume 401, pp. 385–397. [Google Scholar]
- Pencheva, T.; Angelova, M.; Atanassova, V.; Roeva, O. Intercriteria analysis of genetic algorithm parameters in parameter identification. Notes on Intuitionistic Fuzzy Sets 2015, 21, 99–110. [Google Scholar]
- Roeva, O.; Vassilev, P.; Angelova, M.; Pencheva, T. Intercriteria analysis of parameters relations in fermentation processes models. In Computational Collective Intelligence; Springer: Cham, Switzerland, 2015; pp. 171–181. [Google Scholar]
- Roeva, O.; Fidanova, S.; Vassilev, P.; Gepner, P. Intercriteria analysis of a model parameters identification using genetic algorithm. In Proceedings of the 2015 Federated Conference on Computer Science and Information Systems (FedCSIS), Lodz, Poland, 13–16 September 2015; pp. 501–506. [Google Scholar]
- Ilkova, T.; Petrov, M. Application of intercriteria analysis to the Mesta River pollution Modeling. Notes on Intuitionistic Fuzzy Sets 2015, 21, 118–125. [Google Scholar]
- Ilkova, T.; Petrov, M. Using intercriteria analysis for assessment of the pollution indexes of the Struma River. In Advances in Intelligent System and Computing; Atanassov, K., Castillo, O., Kacprzyk, J., Storiv, S., Sotirova, E., Szmidt, E., De Tré, G., Zadrożny, S., Eds.; Springer: Cham, Switzerland, 2016; Volume 401, pp. 351–364. [Google Scholar]
- Moser, A.; Appl, C.; Brüning, S.; Hass, V.C. Mechanistic Mathematical Models as a Basis for Digital Twins. In Digital Twins. Advances in Biochemical Engineering/Biotechnology; Herwig, C., Pörtner, R., Möller, J., Eds.; Springer: Cham, Switzerland, 2020; Volume 176, pp. 133–180. [Google Scholar] [CrossRef]
- Martynova, J.; Mednis, M.; Vigants, A.; Zikmanis, P. Kinetic modelling of ethanol fermentation by yeast Kluyveromyces marxianus from lactose- and inulin- containing substrates. In Proceedings of the 16th International Scientific Conference Engineering for Rural Development, Jelgava, Latvia, 24–26 May 2017; pp. 88–97. [Google Scholar]
- Petrov, M.; Ilkova, T.; Vanags, J. Modelling of a batch whey Cultivation of Kluyveromyces marxianus var. lactis MC 5 with investigation of mass transfer processes in the bioreactor. Int. J. Bioautomation 2015, 19, S81–S92. [Google Scholar]
- Petrov, M.; Ilkova, T. Application of the intercriteria analysis for selection of growth rate models for cultivation of strain Kluyveromyces marxianus var. lactis MC 5. Notes Intuit. Fuzzy Sets 2015, 21, 49–60. [Google Scholar]
- Petrov, M.; Ilkova, T. Intercriteria decision analysis for choice of growth rate models of batch cultivation by strain Kluyveromyces marxianus var. lactis MC 5. J. Int. Sci. Publ. 2016, 10, 468–486. [Google Scholar]
- Petrov, M. Modelling and multi-criteria decision making for selection of specific growth rate models of batch cultivation by Saccharomyces cerevisiae yeast for ethanol production. Fermentation 2019, 5, 61. [Google Scholar] [CrossRef] [Green Version]
- Chen, Y.; Wang, F.-S. Crisp and fuzzy optimization of a fed-batch fermentation for ethanol production. Ind. Eng. Chem. Res. 2003, 42, 6843–6850. [Google Scholar] [CrossRef]
- Giridhar, R.; Srivastava, A. Model based constant feed fed-batch L-Sorbose production process for improvement in L-Sorbose productivity. Chem. Biochem. Eng. Q. 2002, 14, 133–140. [Google Scholar]
- COMPAQ Visual FORTRAN Programmer’s Guide, v. 6.6; Compaq Computer Corporation: Houston, TX, USA, 2001.
- IMSL Math/Library User’s Manual; IMSL Inc.: Houston, TX, USA, 1991.
- Atanassova, V.; Doukovska, L.; Mavrov, D.; Atanassov, K. Intercriteria decision making approach to EU member states competitiveness analysis: Temporal and threshold analysis. In Intelligent Systems’2014; Angelov, P., Atanassov, K., Doukovska, L., Hadjiski, M., Jotsov, V., Kacprzyk, J., Kasabov, N., Sotirov, S., Szmidt, E., Zadrożny, S., Eds.; Springer: Cham, Switzerland, 2015; Volume 322, pp. 95–106. [Google Scholar] [CrossRef]
- Atanassova, V.; Doukovska, L.; Karastoyanov, D.; Čapkovič, F. IntercCriteria decision making approach to EU member states competitiveness analysis: Trend analysis. In Intelligent Systems’2014; Angelov, P., Atanassov, K., Doukovska, L., Hadjiski, M., Jotsov, V., Kacprzyk, J., Kasabov, N., Sotirov, S., Szmidt, E., Zadrożny, S., Eds.; Springer: Cham, Switzerland, 2015; Volume 322, pp. 107–115. [Google Scholar] [CrossRef]
- Doukovska, L.; Atanassova, V.; Shahpazov, G.; Capkovic, F. Intercriteria analysis applied to various EU enterprises. In Proceedings of the Fifth International Symposium on Business Modeling and Software Design, BMSD, Milan, Italy, 6–8 July 2015; Shishkov, B., Ed.; Volume 1, pp. 284–291. [Google Scholar] [CrossRef]
- Vuchkov, I.; Stoyanov, S. Mathematical Modelling and Optimization of Technological Objects; Technique: Sofia, Bulgaria, 1986; pp. 47–50. (In Bulgarian) [Google Scholar]
- Ikonomov, N.; Vassilev, P.; Roeva, O. ICrAData–Software for intercriteria analysis. Int. J. Bioautomaion 2018, 22, 1–10. [Google Scholar] [CrossRef]
Publisher’s Note: MDPI stays neutral with regard to jurisdictional claims in published maps and institutional affiliations. |
© 2021 by the author. Licensee MDPI, Basel, Switzerland. This article is an open access article distributed under the terms and conditions of the Creative Commons Attribution (CC BY) license (https://creativecommons.org/licenses/by/4.0/).