Article

Utilizing Coffee Pulp and Mucilage for Producing Alcohol-Based Beverage

1
Central Campus of Technology, Tribhuvan University, Dharan 56700, Nepal
2
National Tea and Coffee Development Board, Hile, Dhankuta 56806, Nepal
3
School of Agriculture and Food Sciences, University of Queensland, Brisbane 4072, Australia
4
Department of Environmental Engineering, Kunsan National University, Kunsan 54150, Korea
5
Department of Environmental Engineering, Sejong Campus, Korea University, 2511 Sejong-ro, Sejong City 30019, Korea
6
Nepal Academy of Science and Technology, Khumaltar, Lalitpur 44700, Nepal
7
Minhas Microbrewery, Distillery and Winery, 1314 44 Ave NE, Calgary, AB T2E 6L6, Canada
8
Department of Biotechnology, Kathmandu University, Dhulikhel 45200, Nepal
9
Department of Bioresource Engineering, McGill University, Macdonald Campus, Lakeshore Road, Ste-Anne-de-Bellevue, Montreal, QC 21111, Canada
10
Department of Microbiology, School of Medicine, Kyungpook National University, Daegu 41944, Korea
*
Authors to whom correspondence should be addressed.
Fermentation 2021, 7(2), 53; https://doi.org/10.3390/fermentation7020053
Submission received: 17 March 2021 / Revised: 31 March 2021 / Accepted: 2 April 2021 / Published: 5 April 2021
(This article belongs to the Special Issue Advances in Beverages, Food, Yeast and Brewing Research)

Abstract

:
Coffee pulp, mucilage, and beans with mucilage were used to develop alcoholic beverages. The pulp of 45.3% pulp, 54.7% mucilage with seed, and 9.4% mucilage only were obtained during the wet processing of coffee. Musts were prepared for all to TSS (Total soluble solid) 18 °Bx and fermentation was carried out for 12–16 days until TSS decreased to 5 °Bx at 30 °C. Phenolic characteristics, chromatic structures, chemical parameters, and sensory characteristics were analyzed for the prepared alcoholic beverages. Methanol content, ester content, aldehyde, alcohol, total acidity, caffeine, polyphenols, flavonoids, chromatic structure, and hue of the alcoholic beverage from the pulp was 335 mg/L, 70.58 ppm, 9.15 ppm, 8.86 ABV%, 0.41%, 30.94 ppm, 845.7 mg GAE/g dry extract, 440.7 mg QE/g dry extract, 0.41, and 1.71, respectively. An alcoholic beverage from the pulp was found superior to an alcoholic beverage from mucilage with beans and a beverage from mucilage in sensory analysis. There is the possibility of developing fermented alcoholic beverages from coffee pulp and mucilage. However, further research is necessary for quality of the beans that were obtained from the fermentation with the mucilage.

1. Introduction

Recently, the global demand for ethanol has been steadily increasing. The global ethanol production was about 90 billion liters in 2013 and increased to 115 billion liters in 2019 [1]. The global output of ethanol in 2020 was strongly impacted by the Covid-19 crisis and dropped to 98 billion liters; however, the production is anticipated to a gradual increase by 2021 [2]. Sugarcane is the readily used plant for ethanol production. However, the demand for obtaining ethanol could not be achieved from sugarcane alone due to its cost and because raw materials are restricted to areas with special soil for it [3]. In order to meet the ethanol production demand, alternative materials should be explored to reduce the burden in sugarcane.
Coffee drink, obtained from the coffee plant (Coffea arabica L.), is one of the most commonly consumed beverages in the world. It is the second most traded commodity after oil, and due to the demand for this product, large amounts of waste are generated [3]. The coffee bean is a naturally fruiting cherry mainly composed of hard dicotyledon seed covered by silver-skin, parchment, mucilage, and pulp. Coffee pulp constitutes 29–50% of the dry weight of the cherry, which is obtained during wet processing of coffee [4,5,6,7]. The covering materials are removed during processing [8]. Pulp and mucilage, being relatively rich in sugars, are used for microbial growth. For example, Aspergillus niger was used for solid-state fermentation of coffee pulp [9]. Bacillus cereus, Bacillus megaterium, Bacillus subtilis, Candida parapsilosis, Pichia caribbica, Pichia guilliermondii and Saccharomyces cerevisiae were used as a potential starter culture for enhancing the coffee fermentation process [10].
Coffee pulp has been used for the extraction of caffeine, protein, pectic enzymes, fertilizers, biogas, and coffee pulp molasses [5,11]. Mucilage is rich in both simple and complex sugars [5], which can be used in fermentation. Few studies have been conducted for producing ethanol from a mixture of coffee pulp and mucilage. For example, the ethanol yield was reported to be equivalent to 77.29% of the theoretical yield (an ethanol yield of 25.44 kg/m3, resulting from the 64.40 kg/m3 of total sugars) from a mixture of coffee pulp and mucilage, commercial baker’s yeast, and panela [12], which showed that the production of ethanol is viable in small coffee farms using readily available raw materials. Orrego et al. achieved bioethanol yield of more than 90% of theoretical yield from coffee mucilage [13]. However, alcoholic fermentation of byproducts of coffee, such as coffee pulp and mucilage, has rarely been studied. This study utilizes coffee waste during processing, i.e., coffee pulp and mucilage, for the production of alcohol.
Having high sugar content (2.6–31.26 gL−1), the Ethiopian coffee pulp has found to produce 7.4 gL−1 ethanol [14]. It has been reported that the bioethanol yield was found to be 0.46 g/g of sugar in wet coffee pulp [15]. In addition, coffee pulp is a good source of natural antioxidant and it contains hydroxycinnamic acids (chlorogenic, caffeic, and ferulic acid) [16]. Coffee pulp is one of the food wastes which cause environmental problems. In order to reduce its environmental impacts, several types of studies are focused on the extraction of active ingredient and its utilization as animal feed or compost. A non-fermented drink known as Kisher is produced in Yemen and Somalia from ripe fruit berries. Coffee pulp is also used for the production of a beverage called cascara (also called coffee cherry tea) due to its bioactive components [17]. Mucilage and pulp from processed coffee were used in ethanol production in Rwanda [18]. It has been reported that dry white wine has been produced from coffee pulp in Central America [19]. Even though it contains several beneficial compounds such as minerals, amino acids, polyphenols, and caffeine [16], there are limited works on utilizing coffee pulps and mucilage for human consumption. The alcohol produced from a biological way by fermentation of sugars can be a strong candidate for replacing fossil fuels, and are advantageous for their purity, renewability, have a more complete combustion and less waste [20]. In addition, coffee pulp and mucilage can be the new valuable, cost-efficient, and eco-friendly raw material for the beverage industry. Therefore, this study aims to utilize the pulp and mucilage from wet processing of coffee in preparing a fermented alcoholic beverage instead of leaving them as waste.

2. Materials and Methods

2.1. Raw Material Collection

Ripe coffee cherries (Coffea arabica L.) were collected from the Bhirgaun, Dhankuta, Nepal (27°01′12.8″ N 87°21′48.3″ E, elevation of 1269.0 masl (meters above sea level)). Coffee cherries were harvested from 7:00 AM to 8:00 AM, packaged in porous polyethylene bags, and transported to lab of the Central Campus of Technology, Dharan, Nepal. Five hours after the harvest, pulping and de-mucilizing was carried out. Sugar and wine yeast Saccharomyces cereviseae (ex bayanus), Lalvin EC-1118, Canada) was obtained from the lab of the Central Campus of Technology.

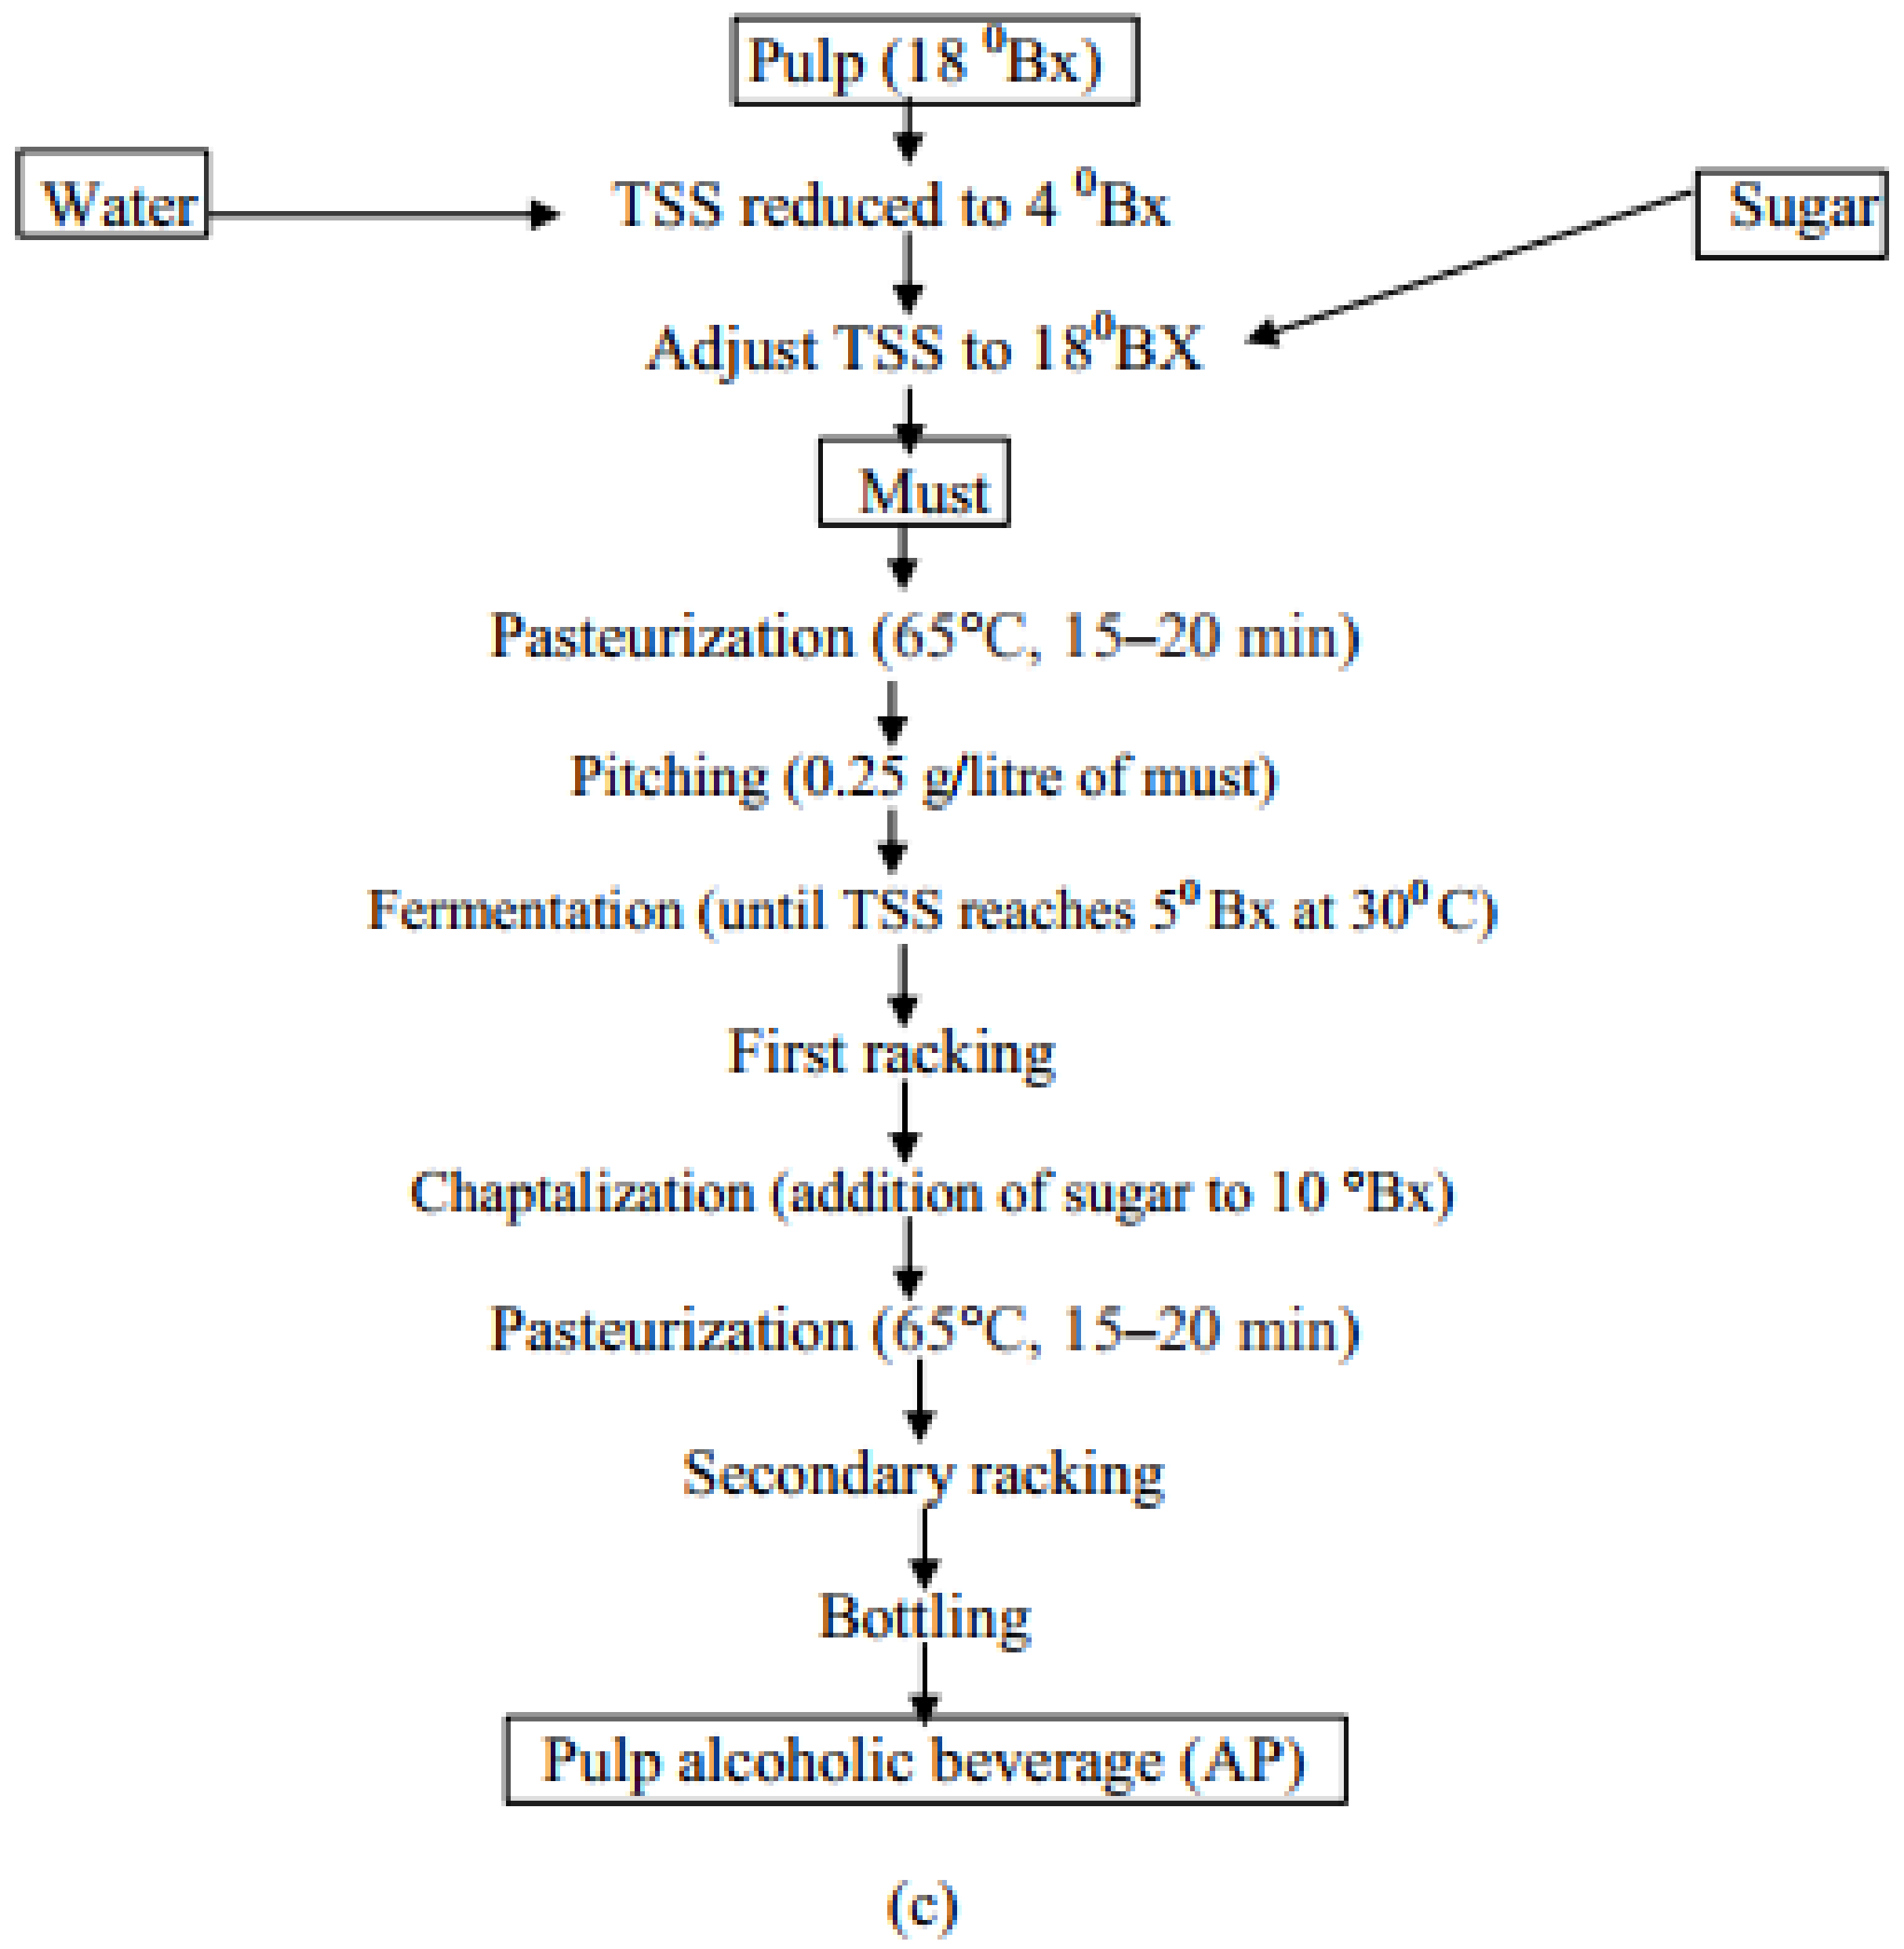
2.2. Preparation for Fermentation

Ripe coffee cherries were processed for preparing the must for fermentation (Figure 1). After rejecting the off standards and degraded coffee by flotation technique, coffee pulping was done by using a coffee pulper (Total Machinery, Teku, 10 kg hand pulper) and byproducts of coffee (pulp and mucilage) were treated for fermentation, coded AP for pulp, AM for mucilage, and AMS for mucilage with beans. In brief, 45.3% of the pulp and beans, along with mucilage 54.7% and 9.4% of the mucilage only was obtained during processing which was similar to experiments of Costa Rica [5].
For fermentation, three types of preparations were done (Figure 1): (i) AP: The pulp with TSS (total soluble solids) 18 °Bx was kept in a fermenting glass. Only 3–4% juice was obtained. So, distilled water was added to cover all the pulp where TSS decreased to 4 °Bx. (ii) AMS: After pulping, the beans with the mucilage (TSS 15 °Bx) were collected in the clean and hygienic bucket. Distilled water at 20 °C was added to beans that were kept in fermenting glass jar. (iii) AM: Rapid rubbing by hand for 15–20 min was done to extract the mucilage (TSS 15 °Bx) from beans. For all three preparations, sterilization was done in a water bath at 65 °C for 15–20 min before maintaining the TSS. Distilled water was added to cover mucilage where TSS decreased to 9 °Bx. The TSS was raised to 18 °Bx for all musts before fermentation. The must (100 mL) was taken and heated to lukewarm temperature (35–40 °C). Wine yeast (Saccharomyces cerevisiae) at the rate of 0.25 g dry yeast/L of must was added. It was stirred until the effervescence of CO2 appeared. Then pitching was carried out. The musts were fermented in separate bottles fitted with air-locked corks until the TSS reached 5 °Bx. After the completion of fermentation, fermented juices for each sample were separated from the residues and table sugar was added to 10 °Bx for flavoring purposes. The beverages were allowed to settle for 2 days, siphoned through sterilized polyethylene pipes in clean sterilized bottles and pasteurized in a water bath at 65 °C for 15–20 min [21]. AP, AM, and AMS were aged at 4 °C for 15 days before analyses of chemical and sensory parameters.

2.3. Extraction of Phytochemicals

Phytochemicals from pulp and mucilage were extracted by using methanol with slight modification as described by Gerumu et. al. [22]. Ten grams of samples was steeped in 100 mL of 80% methanol at 65 °C for 10 min. Then it was cooled to room temperature and homogenized for 3 min using a grinder. Subsequently, it was filtered using Whatman no. 41 filter paper and the residue was re-extracted following the above procedure. The extract was stored in a screw-capped bottle at 4 ± 2 °C until analysis. Ten milliliters of extract were evaporated, dried at 80 °C, and the residue was weighed to know its concentration.

2.4. Analytical Methods

Proximate analysis of raw materials was carried out in triplicate. Standard AOAC methods: (AOAC 935.29) for moisture content, (AOAC 922.06) for crude fat, (AOAC 992.23) for crude protein, (AOAC 923.03) for total ash, and (AOAC 962.09) for crude fiber were used. The TSS was analyzed by a hand refractometer (model WYT-32, Zhongyou, Fujian, China). It was calibrated to give the concentration of total soluble solids in °Brix at a standard temperature of 20 °C. A digital pH meter (Japsin Industrial Instrumentation, New Delhi, India) was used to analyze pH.

2.4.1. Alcohol Content and Total Dry Extract

The distillate of the beverage was taken in the specific gravity bottle and its temperature was measured, then the distillate was completely filled in the bottle and the weight was measured for further calculations as per FSSAI manual for methods of analysis of alcoholic beverages [23]. Briefly, 100 mL of the alcoholic drink was taken in the dried tared beaker and evaporated in a water bath. After wiping the external sides of the beaker, it was kept in a hot-air oven at 100 ± 5 °C for 1–2 h. The weight of the beaker was taken after cooling in the desiccator. The experiment was continued until the constant weight was obtained, and calculation was done as per FSSAI manual for methods of analysis of alcoholic beverages [23].

2.4.2. Methanol Content

Methanol in each sample was determined by the chromotropic acid spectrophotometric method [23]. Stock solution of methanol was prepared by diluting 1.0 g methanol (99.99% pure) to 100 mL with 40% (v/v) ethanol (methanol free). Again, 10 mL of this solution was diluted to 100 mL with 40% ethanol. From the stock solution, methanol concentrations of 20, 40, 60, 80, and 100 ppm were obtained by diluting with 40% ethanol. A distilled sample (1 mL) was diluted to 5 mL with distilled water and shaken well. One mL of this solution, 1 mL of distilled water (for blank), and 1 mL of each of the methanol standards were taken into 50 mL stoppered test tubes and kept in an ice-cold water bath. To each test tube, 2 mL of KMnO4 reagent was added and kept aside for 30 min. A little amount of sodium bisulphite and 1 mL of chromotropic acid solution were added to decolorize the solution. After mixing uniformly, 15 mL of sulphuric acid was added slowly with swirling and placed in hot water bath maintaining 80 °C for 20 min. The color development from violet to red was observed. After cooling the mixture, the absorbance at 575 nm was noted and methanol content was calculated as per FSSAI manual for methods of analysis of alcoholic beverages [23].

2.4.3. Ester Content

Briefly, to the 50 mL of distillate, 10 mL of 0.1 N NaOH was added and refluxed on a steam bath for 1 h. After cooling, back titration for the unspent alkali against standard sulphuric acid was carried out. For blank, 50 mL of distilled water instead of distillate was taken and experiments were conducted in the same way. The difference in titer value in milliliters of standard sulphuric acid gives the equivalent ester and was calculated as per FSSAI manual for methods of analysis of alcoholic beverages [23].

2.4.4. Aldehyde Content

In brief, 50 mL of distillate of liquor was taken in a 250 mL iodine flask and 10 mL of 0.05 N sodium bisulphite solution was added. The flask was kept in a dark place for 30 min with occasional shaking. Then, 25 mL of standard iodine solution was added and back titration of excess iodine against 0.05 N standard sodium thiosulphate solution using starch indicator (1% solution) was conducted to light green end point. The same experiment was carried out for blank, except distilled water was used instead of distillate. The difference in titer value in milliliters, of sodium thiosulphate solution gives the equivalent aldehyde content and was calculated as per FSSAI manual for methods of analysis of alcoholic beverages [23].

2.4.5. Total Acidity and Volatile Acidity

The pH meter was calibrated using the buffer solutions of pH 4.0, 7.0, and 9.2. Approximately 100 mL of distilled water was taken in a beaker and turn magnetic stirrer after placing magnetic bead in it. The electrode of the pH meter was immersed into the water and titration against standard NaOH solution to pH 8.2 was carried out. Again, titration against standard NaOH was carried out to pH 8.2 by adding 50 mL of liquor sample to the pH-adjusted water. Volume of the NaOH was noted for total acidity. To the 50 mL of the distillate, titration against standard NaOH using phenolphthalein indicator was carried out for volatile acidity. Total and volatile acidity were calculated as per FSSAI manual for methods of analysis of alcoholic beverages [23].

2.4.6. Caffeine Content

Caffeine content in the samples was determined by UV-Vis spectrophotometric method [24,25] with slight modifications. Samples (2.5 g) were poured to 200 mL of boiling water and stirred for 10 min. After filtering through a cotton wool, the extract was cooled at a room temperature and volume made to 250 mL with distilled water. This solution was mixed with dichloromethane in ratio 1:1 (25:25 mL). It was stirred for 10 min and caffeine was extracted by dichloromethane from the solution with the help of a separating funnel. Caffeine was extracted 4 times with 25 mL dichloromethane at each round and was stored in volumetric flasks. The absorbance of the extracted solution was measured at 270 nm on UV/visible spectrophotometer. The test results were correlated with standard calibration curve of caffeine (y = 0.035x + 0.1, r2 = 0.996) and it was expressed in percentage (%).

2.4.7. Total Phenolic Content

Total phenolic contents (TPC) were determined using spectrophotometric method with some modifications [26]. The reaction mixture was prepared by mixing 0.5 mL of plant extract, 2.5 mL of 10% Folin-Ciocalteu reagent, and 2.5 mL of 7.5% of Na2CO3 aqueous solution. The mixture was incubated at 45 °C for 45 min in an oven. The absorbance was determined at 765 nm using a UV-visible spectrophotometer. The same procedure was repeated for the standard solutions of gallic acid. A calibration curve was constructed using the standard data. Based on the measured absorbance of test samples, the total phenolic content was determined from calibration curve and expressed as mg of gallic acid equivalent (GAE) per g of dry matter in extract (mg GAE/g).

2.4.8. Total Flavonoid Content

Total flavonoid content (TFC) was determined using a modified aluminum chloride (AlCl3) assay method [27]. Briefly, 2 mL of extract solution was taken in a test tube. 110 Then, 0.2 mL of 5% NaNO3 was added and allowed to stand for 5 min. Later, 0.2 mL of 10% AlCl3 was added and mixed properly and allowed to stand for 5 min. After this, 2 mL of 1 N sodium hydroxide (NaOH) was added in the tube and the final volume was adjusted to 5 mL by adding distilled water. The absorbance was measured after 15 min at 510 nm. The test result was correlated with standard curve of quercetin (20, 40, 60, 80, 100 µg/mL) and the total flavonoid content was expressed as mg of the quercetin equivalent per gram (mg QE/g) of dry matter in extract.

2.4.9. Color Measurement

Spectrophotometry was used to analyze color intensity and hue [28]. The triplicate readings for each sample in three different wavelengths, i.e., 420, 520, and 620 nm were recorded for calculating color intensity and hue (Equations (1) and (2)).
C o l o u r   i n t e n s i t y = A 420 + A 520 + A 620
H u e = A 420 A 520

2.5. Sensory Analysis

Sensory analysis was evaluated with reference to wine [29] by 25 panelists and converting scores of quality parameters in percentage for total quality score of 100. Sensory parameters were analyzed with a quality score of 15%, 30%, 30%, 15%, and 10% for appearance, aroma, taste, aftertaste, and overall acceptability, respectively. A 2 h training session was conducted for 14 days to familiarize panel members with sensory attributes.

2.6. Statistical Analysis

The data of each experimental analysis, performed in triplicate, were analyzed by one-way analysis of variance (ANOVA), and this was carried out by using GenStat Release 12.1 software (Copyright 2009, VSN International Ltd., Hemel Hempstead, UK). Means were separated using Tukey’s HSD post-hoc test (p < 0.05). Values are means of triplicate ± standard deviations.

3. Results

3.1. Chemical Composition of Coffee Pulp and Mucilage

Chemical composition of the coffee pulp was analyzed (Table 1). Protein content for coffee pulp was similar to findings of Braham and Bressani (1979), but slightly different in caffeine content and reducing sugar [5]. The caffeine content was found to be lower, which might be due to the variation of caffeine-extracting solvent. Similarly, reducing sugar was slightly different, which might be due to the difference in harvesting time and geography. In contrast, ash content was slightly lower, which might be due to the difference in geography, harvesting time, and variation of processing technology [30]. The crude fiber content was found to be higher than industrial waste pulp in Kenya [31], but was lower than pulp obtained by the semi-washed process in Brazil [32]. The fat content was similar to the findings of [33] and similar pH value was obtained in the study in Mexico [34]. Crude fat, crude fiber, caffeine content, and TSS of the mucilage were found to be 0.7%, 1.5%, 1.05%, and 15 °Bx, respectively. Belitz et al. (2008) reported 84.2% moisture, 8.9% protein, 4.1% sugar, and 0.7% ash [35], which are similar to our findings (Table 1). Total polyphenols, flavonoids, and tannins differed from [36], which might be due to variation of agronomic practices, climate, geography, and soil conditions.

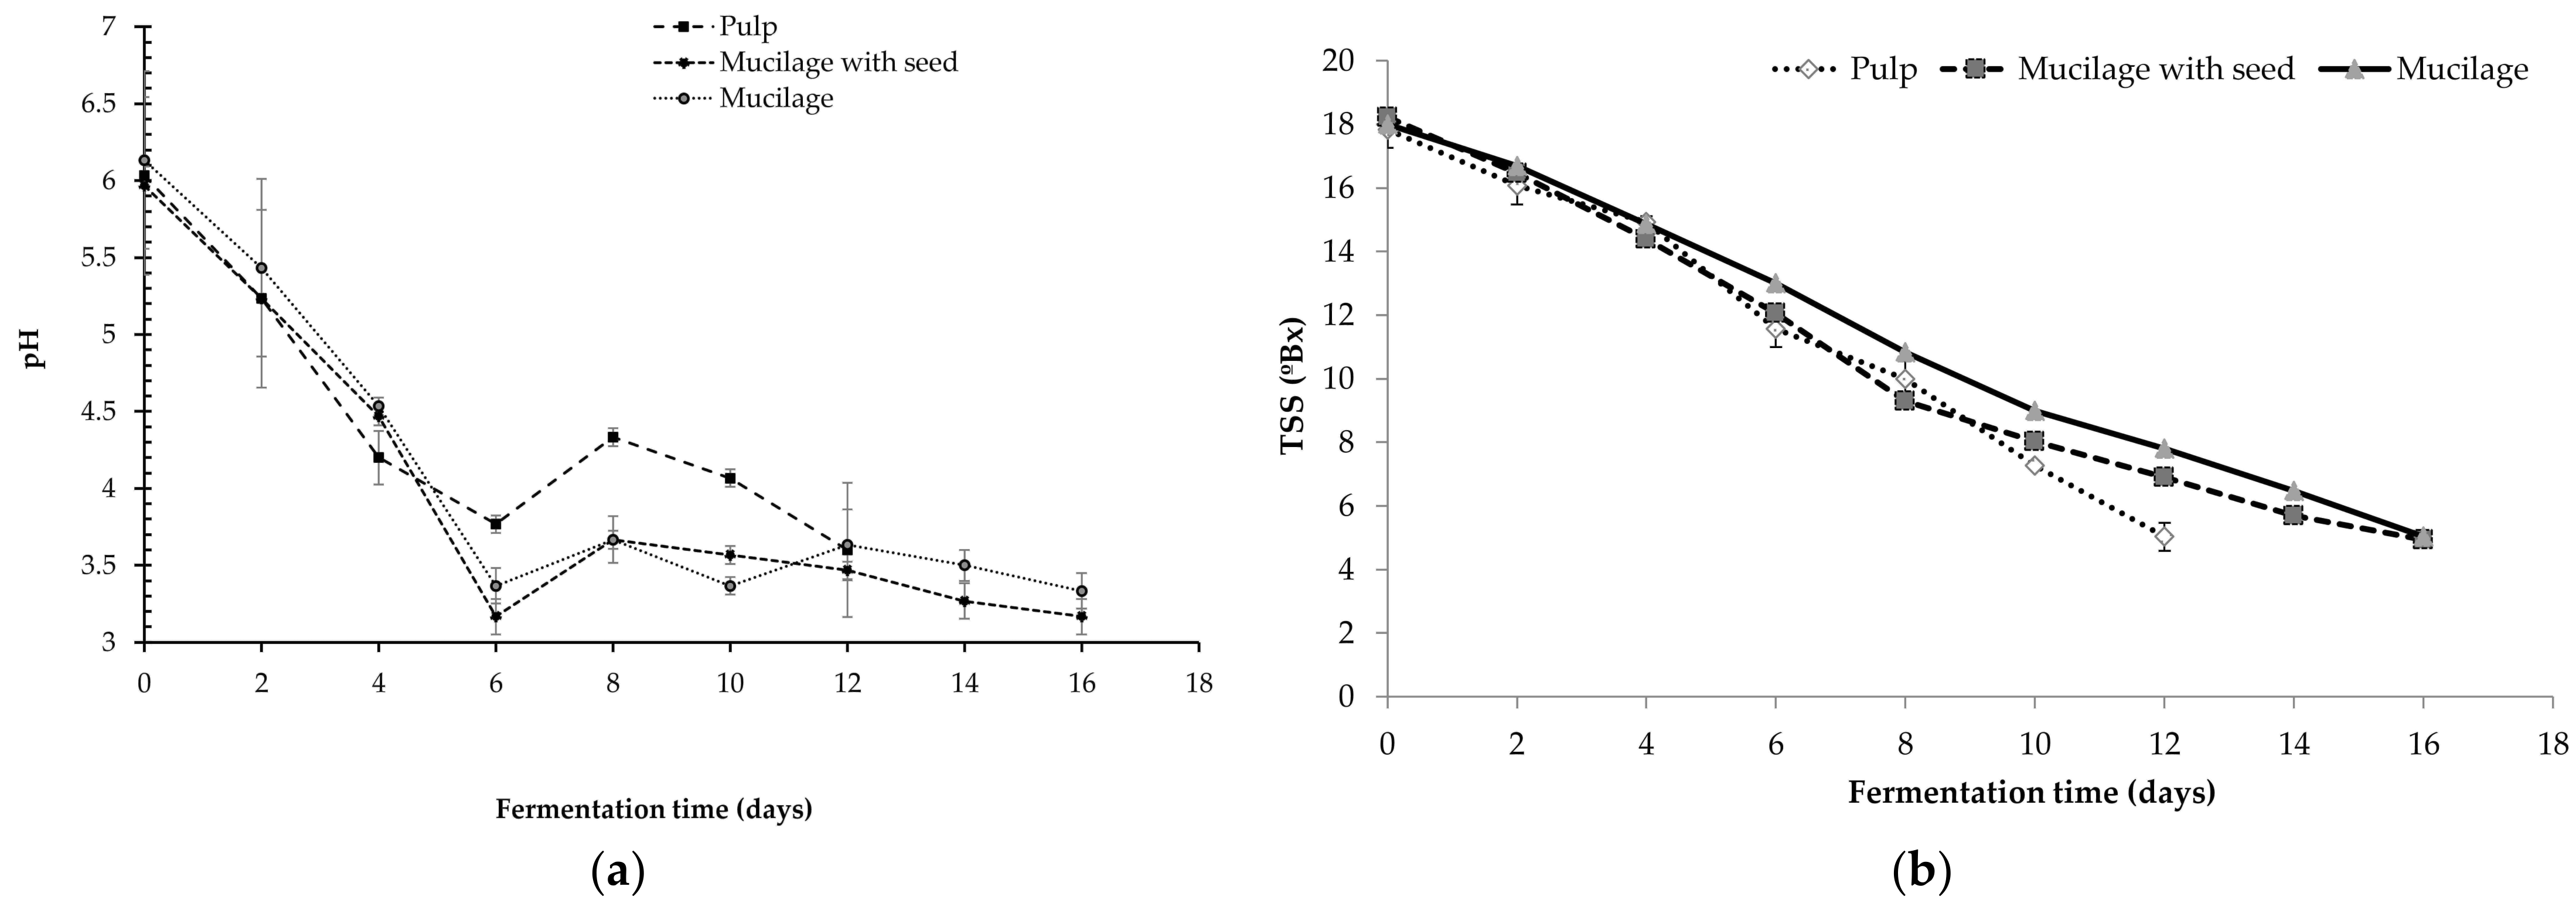
3.2. Fermentation Kinetics with Respect to pH and TSS

There was significant variation (p < 0.05) in the pH content of all the samples with respect to fermentation time. The pH rapidly dropped up to the sixth day, then gradually increased up to the tenth day, and finally decreased slowly and stabilized. The fall of pH up to the fourth day was seen maximum in samples of pulp preparation than the other two samples (Figure 2a). This shows faster conversion of sugar into acids in pulp sample. In terms of pH, fermentation can be categorized into two phases: it decreases during the first and then increases [37]. The drop in pH might be due to the consumption of glucose and production of ethanol and organic acids by yeast. The production of these acids drives the pH down to acidic conditions [38]. After the sixth day of fermentation, there was significant increase in the pH. This might have happened due to the lack of the nutrient, and yeast begins to consume organic acids as the nutrient source. Similarly, nitrogen sources are cleaved off to ammonia by yeast, which attracts protons to form ammonium in the aqueous solution, causing increase in pH [37]. The simultaneous consumption of organic acids [37] and increase in ethanol production (pH of ethanol, 7.33) resulted in alteration of the pH, as both these factors affect pH value during the sugar fermentation process. There was a significant difference between the TSS of each product with respect to fermentation days. The TSS was decreasing in each day. There was rapid decrease of TSS of the pulp sample than the other two samples (Figure 2b). TSS, i.e., 5 °Bx [39] was achieved in the twelfth day by pulp samples, which is earlier than the other two samples. This concludes that the rate of fermentation of pulp is more than the other two samples. The rapid drop in TSS was due to utilization of the supplied glucose by the yeast [40], which is quite obvious.

3.3. Chemical Analysis

Total dry extract in the AP, AM, and AMS was found to be 215 g/L, 190 g/L, and 183 g/L, respectively. Methanol content was significantly different (p < 0.05) in all the samples. Among three fermented beverages (AP, AM, and AMS), AP contained the highest level of methanol content, i.e., 335 mg/L, while AM contained the least, i.e., 298.6 mg/L (Table 2). Coffee pulp is found to be richer (~1.9 times) in pectin than coffee mucilage [41]. The highest level of the methanol content in AP might be due to the methylated pectin that gets transferred in the beverage during fermentation. The methanol level in red wine that can be accepted by the human body is 400 mg/L [42], which concludes that AP, AM, and AMS are within the range with respect to methanol content. The International Organization of Vine and Wine has reported the safety limit of methanol for avoiding the risk to consumers’ health as 150 mg/L for white and rosé and 300 mg/L for red wine. Regarding this, some modifications, like adding phenolic acids, can be done to reduce the methanol content [43].
Among the three samples, alcohol content in AP was found higher (8.86%) and was not significantly different, but AMS differed significantly (p < 0.05). Higher alcohol content in AP was due to maximum utilization of sugar. The difference in ethanol content may be due to the difference in the must formation, and also may be due to the difference in the chemical constituents between pulp and mucilage. Ester content in all samples was found in the range as stated by [44] but was higher compared the findings of [45]. Esters are expressed as ethyl acetate whose concentration ranges from about 30–60 mg/L in “normal” wines to about 150–200 mg/L in defective wines [46]. And our beverages contain esters in the range where AP contained a little higher. Ester content in AM and AMS was not significantly different but AP differed significantly (p < 0.05). Higher alcohol content might be responsible for higher ester content in AP because esters are formed due to the reaction between the fatty acids and alcohol. The difference in the ester content might be contributed by a difference in the carbon and nitrogen content between the samples [47]. Aldehyde content was significantly different (p < 0.05) and AP contained quiet less than AM and AMS. Aldehyde content was less when compared to [45].
Aldehyde content in the fermented beverages is expressed in terms of actaldehyde and immediately after fermentation; table wines generally have acetaldehyde levels below 75 mg/L [46]. Our beverages contain aldehydes less than 50 ppm. Color of the red wine is enhanced by polymerization of anthocyanins and phenolics with the assistance of aldehyde [48]. This might be the reason of minimization of aldehyde content in AP. Higher content of total acidity in AMS might be due to unconsumed fatty acids for the production of esters, while lower values in other samples can be related to the utilization of carboxylic acids in the production of esters. Volatile acidity was found to be relatively lower. This might be due to the difference in the chemical composition between the raw materials. Caffeine content was significantly different (p < 0.05) in all the samples. The minimum value of caffeine content was found in AM and the maximum in AMS, which might be due to fermentation along with beans. Asfew & Dekebo reported that caffeine content of coffee beans ranged from 1.21 to 1.43 % in beans and 0.78 to 0.97 % in coffee pulp [49]. The value of caffeine content in the alcoholic product is much lower as compared to that in raw pulp and beans. The low values can be attributed to the fact that caffeine molecules in coffee beans are complex with chlorogenic acids [50], and the hydrogen bonds between caffeine and chlorogenic acid molecules have to be broken during fermentation. Raw pulp contained 1762.6 mg GAE/g dry extract, which was between the range of 1809.9 to 489.5 mg GAE/g dry extract [51] and flavonoid content of 1418.2 mg QE/g dry extract (Table 1). Among the three samples, AP contained the maximum value of polyphenols, i.e., 845.7 mg GAE/g dry extract. This maximum value was due to the fact that the pulp contained the highest value of polyphenols than other parts of the pericarp [51]. AM contained minimum value of polyphenols, i.e., 554 mg GAE/g dry extract, which might be due to the minimum value of polyphenols in mucilage. The content of flavonoid was also similar to that of phenolic content, i.e., maximum in AP. The polymeric anthocyanin color (%) of the coffee pulp was higher [52], which might be the reason for more flavonoids in AP. Similarly, tannin content was also higher in AP. The effect of pH of the medium during fermentation might have influenced the metabolism of the yeast for the growth and degradation of caffeine and tannins [36].

3.4. Colour of Fermented Alcoholic Beverages

The value of chromatic structure and color density was significantly higher in AP than AM and AMS, causing a redder appearance like red wine. Flavonoid content was significantly higher in AP (Table 2), which might have contributed to anthocyanins [52]. Being directly in contact with the red-colored exocarp is another reason for the red color in AP. AM and AMS were whitish in appearances. Hue is the indication of the aging and oxidation of wine. All wines were aged for a constant time, so difference in hue was due to the difference in red pigments in each sample. Oxidation and polymerization might also be the reason for the decrease in hue [53].

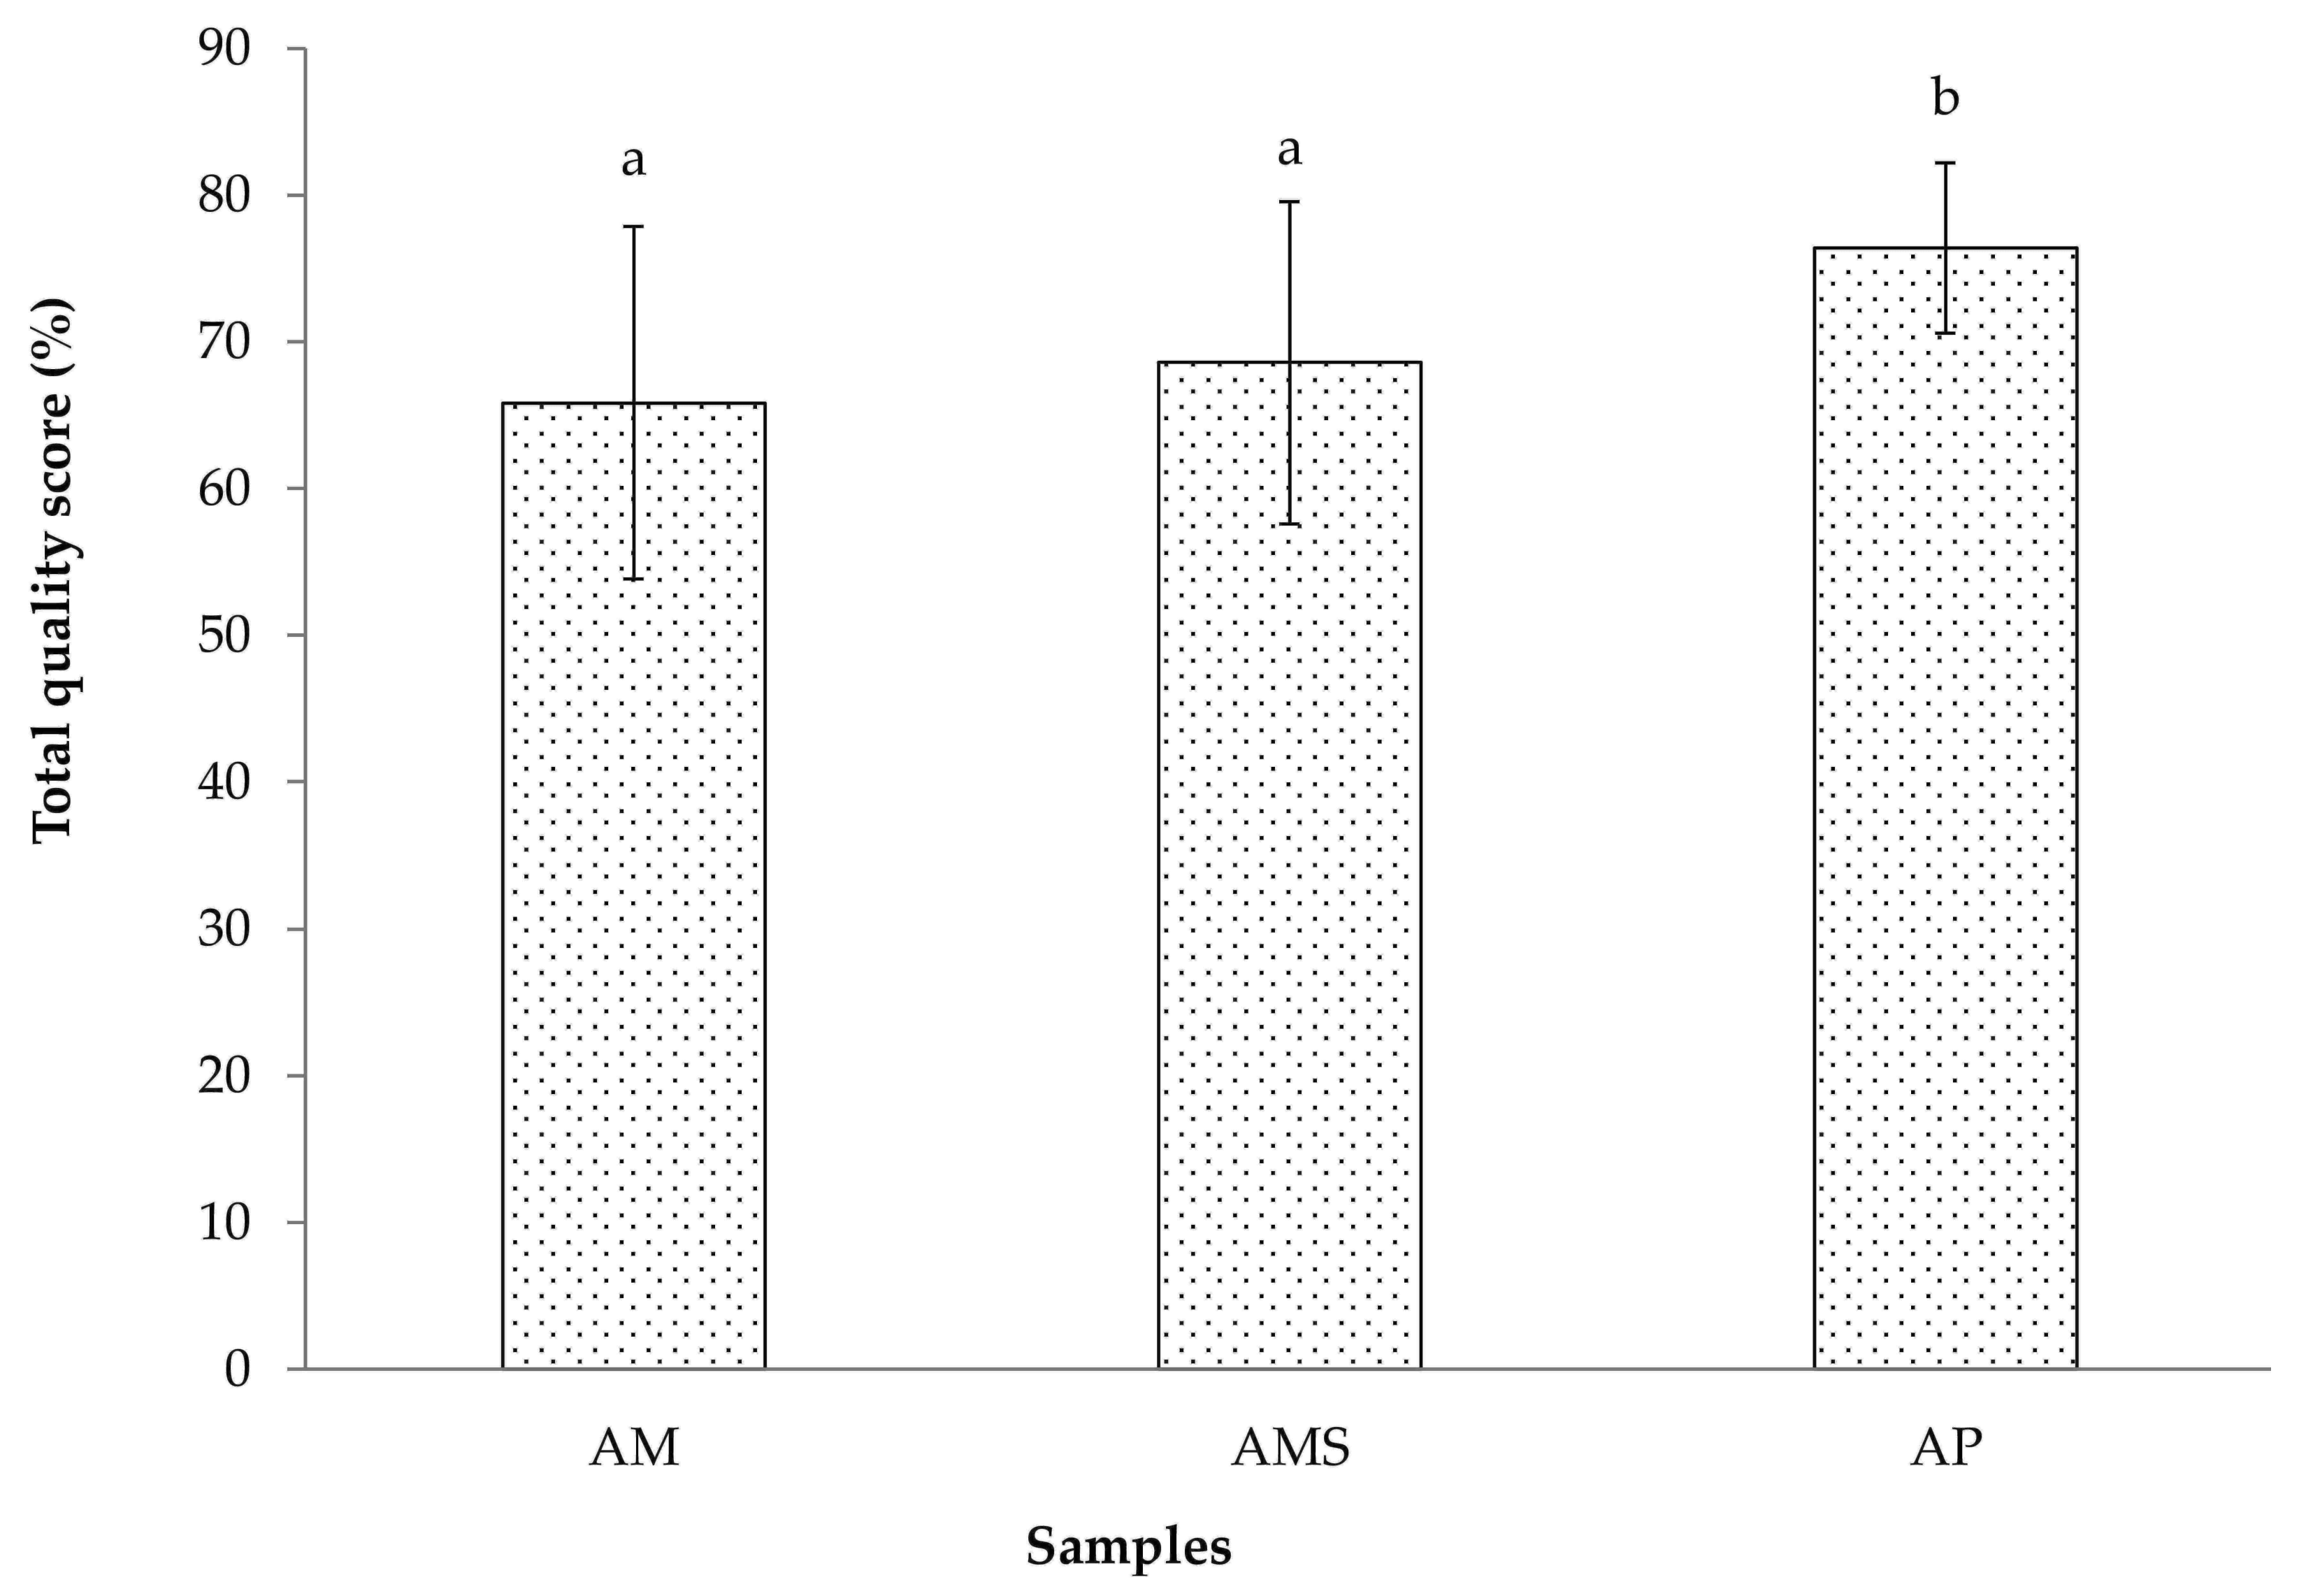
3.5. Sensory Analysis

Haziness and dull appearance in all prepared samples was seen which was due to improper clarification. AP was more reddish than other samples which might be due to leaching of pigments from skin during fermentation. AMS got more reddish and brownish pigment from seed contributed redder than AM. Fruity aroma giving esters, chlorogenic acid, acetic and propionic acids increased throughout the fermentation process [53] causing higher aroma in AMS, AP and AM. Similarly, the production of ethanol and lactic, butyric, acetic, and other higher carboxylic acids during the fermentation of pectinaceous sugars by microorganisms in coffee fermentation [30] and modification of compounds such as proteins, carbohydrates, chlorogenic acids in green coffee beans [53] caused the development of unique aroma and taste at the end of fermentation. According to Sera et al., coffee fragrance and flavor is related to cholorgenic acids [36]. Higher methanol content in AP (Table 2) could extract chlorogenic acid in the fermented beverage causing more score of aroma in AP [54]. Based on taste, the highest mean score of AP, AMS and AM was due to chlorogenic acid, epicatechin and isochlorogenic acid that got extracted from mucilage. Though there is no significance difference in the taste in all samples, AP had highest score which might be influenced by higher amount of tannins and polyphenols (Table 2) which relates to a positive trait, especially mouth feel of the wines [55]. The astringent aftertaste was given by phenolic compound that was isolated from coffee mucilage and pulp [56]. This sensation is felt in the mouth after consumption of some wines, strong tea or un-ripened fruit [56]. AP had significantly higher score of aftertastes (Table 3) which might be due to more tannins and TPC than AM and AMS that has given natural aftertaste (Table 2). The scores of AMS were superior to AM as seed was involved in fermentation contributing more taste, aftertaste, aroma and OA (overall acceptability). The value of overall acceptability was also higher for AP in compared to AM and AMS. Total quality score in this study found that the desirable characteristics, color, pleasant flavor, taste, aftertaste, and overall acceptability were higher in AP compared to AM and AMS (Figure 3).

4. Conclusions

Byproducts of coffee (Coffea arabica L.) pulp and mucilage can be used for the preparation of fermented alcoholic beverages as well as ethanol for energy. This study showed that the coffee pulp and mucilage could be a novel valuable and eco-friendly raw material for the beverage industry and could help to reduce the environmental threat caused by coffee processing. However, further research is necessary for quality assurance of alcoholic beverages produced from coffee waste.

Author Contributions

Conceptualization, Y.K., L.D.S., D.K.C., B.R.P., T.R.B., J.L., S.T., J.U., and R.H.D.; data curation, R.S., L.D.S., R.B., B.R.P., T.R.B., and J.L.; formal analysis, P.K.D.; investigation, D.K.C.; methodology, P.K.D. and R.B.; resources, S.T.; supervision, J.U. and R.H.D.; validation, Y.K. and R.H.D.; writing—original draft, Y.K.; writing—review and editing, J.L. and R.H.D. All authors have read and agreed to the published version of the manuscript.

Funding

This study did not receive any funding.

Institutional Review Board Statement

Not applicable.

Informed Consent Statement

Not applicable.

Data Availability Statement

Not applicable.

Conflicts of Interest

The authors declare no conflict of interest.

References

  1. Reidy, S. Global Ethanol Production Could Drop to 2013 Levels. World Grain. Available online: https://www.world-grain.com/articles/13635-global-ethanol-production-could-drop-to-2013-levels (accessed on 1 May 2020).
  2. IEA. Transport Biofuels—Renewables 2020—Analysis; IEA: Paris, France, 2020. [Google Scholar]
  3. Yadira, P.-S.B.; Sergio, S.-T.; Fernando, S.; Sebastian, P.; Eapen, D. Bioethanol Production from Coffee Mucilage. Energy Procedia 2014, 57, 950–956. [Google Scholar] [CrossRef] [Green Version]
  4. Aristizábal-Marulanda, V.; Chacón-Perez, Y.; Alzate, C.A.C. The biorefinery concept for the industrial valorization of coffee processing by-products. In Handbook of Coffee Processing By-Products: Sustainable Applications; Elsevier Inc.: Amsterdam, The Netherlands, 2017; pp. 63–92. [Google Scholar]
  5. Braham, J.E.; Bressani, R. Coffee Pulp: Composition, Technology, and Utilization; IDRC: Ottawa, ON, Canada, 1979; ISBN 0889361908. [Google Scholar]
  6. NTCDB. Coffee Production Technology (कफी उत्पादन प्रविधि); National Tea and Coffee Development Board: Kirtipur, Nepal, 2018. [Google Scholar]
  7. Roussos, S.; Aquiáhuatl, M.D.L.A.; Trejo-Hernández, M.D.R.; Perraud, I.G.; Favela, E.; Ramakrishna, M.; Raimbault, M.; Viniegra-González, G. Biotechnological management of coffee pulp—Isolation, screening, characterization, selection of caffeine-degrading fungi and natural microflora present in coffee pulp and husk. Appl. Microbiol. Biotechnol. 1995, 42, 756–762. [Google Scholar] [CrossRef]
  8. Blinová, L.; Sirotiak, M.; Bartošová, A.; Soldán, M. Review: Utilization of Waste from Coffee Production. Res. Pap. Fac. Mater. Sci. Technol. Slovak Univ. Technol. 2017, 25, 91–101. [Google Scholar] [CrossRef] [Green Version]
  9. Antier, P.; Minjares, A.; Roussos, S.; Raimbault, M.; Viniegra-Gonzalez, G. Pectinase-hyperproducing mutants of Aspergillus niger C28B25 for solid-state fermentation of coffee pulp. Enzyme Microb. Technol. 1993, 15, 254–260. [Google Scholar] [CrossRef]
  10. Silva, C.F.; Vilela, D.M.; Cordeiro, C.D.S.; Duarte, W.F.; Dias, D.R.; Schwan, R.F. Evaluation of a potential starter culture for enhance quality of coffee fermentation. World J. Microbiol. Biotechnol. 2013, 29, 235–247. [Google Scholar] [CrossRef]
  11. Oliveira, L.S.; Franca, A.S. An Overview of the Potential Uses for Coffee Husks. In Coffee in Health and Disease Prevention; Elsevier Inc.: Amsterdam, The Netherlands, 2015; pp. 283–291. ISBN 9780124167162. [Google Scholar]
  12. Navia, P.D.P.; Velasco, M.R.d.J.; Hoyos, C.J.L. Production and evaluation of ethanol from coffee processing by-products. Vitae 2011, 18, 287–294. [Google Scholar]
  13. Orrego, D.; Zapata-Zapata, A.D.; Kim, D. Optimization and Scale-Up of Coffee Mucilage Fermentation for Ethanol Production. Energies 2018, 11, 786. [Google Scholar] [CrossRef] [Green Version]
  14. Kefale, A. Bioethanol Production and Optimization test from Agricultural Waste: The case of wet coffee processing waste (pulp). Int. J. Renew. Energy Res. 2012, 3, 445–450. [Google Scholar]
  15. Shenoy, D.; Pai, A.; Vikas, R.; Neeraja, H.; Deeksha, J.; Nayak, C.; Rao, C.V. A study on bioethanol production from cashew apple pulp and coffee pulp waste. Biomass Bioenergy 2011, 35, 4107–4111. [Google Scholar] [CrossRef]
  16. Torres-Mancera, M.T.; Córdova-López, J.; Rodríguez-Serrano, G.; Roussos, S.; Ramírez-Coronel, M.A.; Favela-Torres, E.; Saucedo-Castañeda, G. Enzymatic Extraction of Hydroxycinnamic Acids from Coffee Pulp. Food Technol. Biotechnol. 2011, 49, 369–373. [Google Scholar]
  17. Heeger, A.; Kosińska-Cagnazzo, A.; Cantergiani, E.; Andlauer, W. Bioactives of coffee cherry pulp and its utilisation for production of Cascara beverage. Food Chem. 2017, 221, 969–975. [Google Scholar] [CrossRef]
  18. Hirwa, O.; Nyagahungu, I.; Bitwayiki, C. Ethanol prodution from mucilage and pulp of processed coffee. Ukr. Food J. 2016, 5, 523–530. [Google Scholar] [CrossRef]
  19. Clarke, R.J. Technology. In Coffee; Springer: Dordrecht, The Netherlands, 1987; Volume 2. [Google Scholar]
  20. Breisha, G.Z. Production of 16% ethanol from 35% sucrose. Biomass Bioenergy 2010, 34, 1243–1249. [Google Scholar] [CrossRef]
  21. Miyawaki, O.; Gunathilake, M.; Omote, C.; Koyanagi, T.; Sasaki, T.; Take, H.; Matsuda, A.; Ishisaki, K.; Miwa, S.; Kitano, S. Progressive freeze-concentration of apple juice and its application to produce a new type apple wine. J. Food Eng. 2016, 171, 153–158. [Google Scholar] [CrossRef] [Green Version]
  22. Geremu, M.; Tola, Y.B.; Sualeh, A. Extraction and determination of total polyphenols and antioxidant capacity of red coffee (Coffea arabica L.) pulp of wet processing plants. Chem. Biol. Technol. Agric. 2016, 3, 1–6. [Google Scholar] [CrossRef] [Green Version]
  23. FSSAI. Manual of Methods of Analysis of Foods (Alcoholic Beverages); Food Safety and Standards Authority of India: New Delhi, India, 2019; pp. 2–64. [Google Scholar]
  24. Belay, A.; Ture, K.; Redi, M.; Asfaw, A. Measurement of caffeine in coffee beans with UV/vis spectrometer. Food Chem. 2008, 108, 310–315. [Google Scholar] [CrossRef]
  25. Komes, D.; Horžić, D.; Belščak, A.; Ganić, K.K.; Baljak, A. Determination of Caffeine Content in Tea and Maté Tea by using Different Methods. Czech J. Food Sci. 2009, 27, S213–S216. [Google Scholar] [CrossRef] [Green Version]
  26. Jaradat, N.; Hussen, F.; Al Ali, A. Preliminary Phytochemical Screening, Quantitative Estimation of Total Flavonoids, Total Phenols and Antioxidant Activity of Ephedra alata Decne. J. Mater. Environ. Sci. 2015, 6, 1771–1778. [Google Scholar]
  27. Barek, M.; Hasmadi, M.; Zaleha, A.Z.; Fadzelly, A.B.M. Effect of different drying methods on phytochemicals and antioxidant properties of unfermented and fermented teas from Sabah Snake Grass (Clinacanthus nutans Lind.) leaves. Int. Food Res. J. 2015, 22, 661–670. [Google Scholar]
  28. Lawson-Wood, K.; Robertson, I. Determination of Wine Color and Total Phenol Content Using the LAMBDA PDA UV/Vis Spectrophotometers; PerkinElmer, Inc.: Waltham, MA, USA, 2015. [Google Scholar]
  29. Fessler, H.J. Guidelines to Practical Wine making; Oregon Speciality Colins: Portland, OR, USA, 1971. [Google Scholar]
  30. Haile, M.; Kang, W.H. The Harvest and Post-Harvest Management Practices’ Impact on Coffee Quality. Coffee Prod. Res. 2020. [Google Scholar] [CrossRef] [Green Version]
  31. Gathuo, B.; Rantala, P.; Määttä, R. Coffee Industry Wastes. Water Sci. Technol. 1991, 24, 53–60. [Google Scholar] [CrossRef]
  32. Bonilla-Hermosa, V.A.; Duarte, W.F.; Schwan, R.F. Utilization of coffee by-products obtained from semi-washed process for production of value-added compounds. Bioresour. Technol. 2014, 166, 142–150. [Google Scholar] [CrossRef]
  33. Setyobudi, R.H.; Wahono, S.K.; Adinurani, P.G.; Wahyudi, A.; Widodo, W.; Mel, M.; Nugroho, Y.A.; Prabowo, B.; Liwang, T. Characterisation of Arabica Coffee Pulp—Hay from Kintamani—Bali as Prospective Biogas Feedstocks. MATEC Web Conf. 2018, 164, 01039. [Google Scholar] [CrossRef]
  34. Ameca, G.M.; Cerrilla, M.E.O.; Córdoba, P.Z.; Cruz, A.D.; Hernández, M.S.; Haro, J.H. Chemical composition and antioxidant capacity of coffee pulp. Ciência e Agrotecnologia 2018, 42, 307–313. [Google Scholar] [CrossRef]
  35. Belitz, H.-D.; Grosch, W.; Schieberle, P. Coffee, Tea, Cocoa. In Food Chemistry; Springer: Berlin/Heidelberg, Germany, 2008; pp. 938–970. [Google Scholar]
  36. Brand, D.; Pandey, A.; Roussos, S.; Brand, I.; Soccol, C.R. Microbial degradation of caffeine and tannins from coffee husk. In Coffee Biotechnology and Quality; Sera, T., Soccol, C.R., Pandey, A., Roussos, S., Eds.; Springer: Dordrecht, The Netherlands, 2000; pp. 393–400. [Google Scholar]
  37. Akin, H.; Brandam, C.; Meyer, X.-M.; Strehaiano, P. A model for pH determination during alcoholic fermentation of a grape must by Saccharomyces cerevisiae. Chem. Eng. Process. Process. Intensif. 2008, 47, 1986–1993. [Google Scholar] [CrossRef] [Green Version]
  38. Coote, N.; Kirsop, B.H. Factors responsible for the decrease in pH during beer fermentations. J. Inst. Brew. 1976, 82, 149–153. [Google Scholar] [CrossRef]
  39. Akubor, P.I.; Obio, S.O.; Nwadomere, K.A.; Obiomah, E. Production and quality evaluation of banana wine. Plant Foods Hum. Nutr. 2003, 58, 1–6. [Google Scholar] [CrossRef]
  40. Wall, M.M.; Nishijima, K.A.; Sarnoski, P.; Keith, L.; Chang, L.C.; Wei, Y. Postharvest Ripening of Noni Fruit (Morinda citrifolia) and the Microbial and Chemical Properties of Its Fermented Juice. J. Herbs Spices Med. Plants 2014, 21, 294–307. [Google Scholar] [CrossRef]
  41. García, R.; Arriola, D.; Rolz, O. Characterization of coffee pectin. Food Sci. Technol. Leb. Technol. 1991, 24, 125–129. [Google Scholar]
  42. Hodson, G.; Wilkes, E.; Azevedo, S.; Battaglene, T. Methanol in wine. BIO Web Conf. 2017, 9, 02028. [Google Scholar] [CrossRef]
  43. Hou, C.-Y.; Lin, Y.-S.; Wang, Y.; Jiang, C.-M.; Lin, K.; Wu, M.-C. Addition of Phenolic Acids on the Reduction of Methanol Content in Wine. J. Food Sci. 2008, 73, C432–C437. [Google Scholar] [CrossRef] [PubMed]
  44. Postel, W.; Adam, L.; Drawert, F. Gas chromatographic determination of volatile components of fermented beverages. III. Volatile components of wines (Ger.). Chem. Mikrobiol. Technol. Lebensm. 1972, 1, 224–235. [Google Scholar]
  45. Martínez, P.; Valcárcel, M.J.; Piérez, L.; Benítez, T. Metabolism of Saccharomyces cerevisiae flor yeasts during fermentation and biological aging of Fino sherry: By-products and aroma compounds. Am. J. Enol. Vitic. 1998, 49, 240–250. [Google Scholar]
  46. The Australian Wine Research Institute. Wine Flavours, Faults and Taints. Available online: https://www.awri.com.au/industry_support/winemaking_resources/sensory_assessment/recognition-of-wine-faults-and-taints/wine_faults/ (accessed on 30 March 2021).
  47. Saerens, S.M.G.; Delvaux, F.R.; Verstrepen, K.J.; Van Dijck, P.; Thevelein, J.M. Parameters Affecting Ethyl Ester Production by Saccharomyces cerevisiae during Fermentation. Appl. Environ. Microbiol. 2007, 74, 454–461. [Google Scholar] [CrossRef] [Green Version]
  48. Osborne, J.; Morneau, A.D.; De Orduña, R.M. Degradation of free and sulfur-dioxide-bound acetaldehyde by malolactic lactic acid bacteria in white wine. J. Appl. Microbiol. 2006, 101, 474–479. [Google Scholar] [CrossRef] [PubMed]
  49. Asfew, Z.; Dekebo, A. Determination of caffeine content in Wollega Zones, Ethiopian coffee bean, pulp and leaves by high performance liquid chromatography. Trends Phytochem. Res. Trends Phytochem. Res 2019, 3, 261–274. [Google Scholar]
  50. Horman, I.; Viani, R. The nature and conformation of the caffeine-chlorogenate complex of coffee. J. Food Sci. 1972, 37, 925–927. [Google Scholar] [CrossRef]
  51. Murthy, P.S.; Manjunatha, M.R.; Sulochannama, G.; Madhava Naidu, M. Extraction, Characterization and Bioactivity of Coffee Anthocyanins. Eur. J. Biol. Sci. 2012, 4, 13–19. [Google Scholar]
  52. Maroniac, A.; Mihali, C. Comparative color analysis of red, rosé and white wines by spectrophotometric method. Carpathian J. Food Sci. Technol. 2014, 6, 137–144. [Google Scholar]
  53. Bressani, A.P.P.; Martinez, S.J.; Sarmento, A.B.I.; Borém, F.M.; Schwan, R.F. Organic acids produced during fermentation and sensory perception in specialty coffee using yeast starter culture. Food Res. Int. 2020, 128, 108773. [Google Scholar] [CrossRef] [PubMed]
  54. Molina, M.R.; De La Fuente, G.; Batten, M.A.; Bressani, R. Decaffeination. Process to detoxify coffe pulp. J. Agric. Food Chem. 1974, 22, 1055–1059. [Google Scholar] [CrossRef] [PubMed]
  55. Robinson, J. The Oxford Companion to Wine, 3rd ed.; Oxford University Press: Oxford, UK, 2006; ISBN 9780198609902. [Google Scholar]
  56. Ashok, P.K.; Upadhyaya, K. Tannins are Astringent. J. Pharmacogn. Phytochem. 2012, 1, 45–50. [Google Scholar]
Figure 1. Flowchart for (a) mucilage extract alcoholic beverage (AM), (b) mucilage with seed alcoholic beverage (AMS), and (c) pulp alcoholic beverage.
Fermentation 07 00053 g001aFermentation 07 00053 g001b
Figure 2. Changes during fermentation period. (a) pH. (b) TSS.
Fermentation 07 00053 g002
Figure 3. Total quality score for coffee-based alcoholic beverages. Error bars show standard deviation and error bars bearing different superscript differs (p < 0.05) with one-way ANOVA.
Fermentation 07 00053 g003
Table 1. Analysis of coffee pulp and mucilage.
ParticularsCoffee PulpMucilage
Moisture (%)75.7 ± 0.285.3 ± 0.6
Dry matter (%)24.3 ± 0.214.7 ± 0.6
Crude Protein (%)8.1 ± 0.367.2 ± 0.3
Fat (%)1.53 ± 0.050.7 ± 0.00
Ash (%)6.4 ± 0.051.1 ± 0.1
Crude fiber (%)6.3 ± 0.21.5 ± 0.22
Total sugar (%)12.06 ± 0.414.3 ± 0.4
Reducing sugar (%)10.9 ± 0.36-
Caffeine (%)1.11 ± 0.111.05 ± 0.05
TSS (°Bx)18 ± 0.515 ± 0.5
pH4.3 ± 0.153.7± 0.1
Polyphenols (mg GAE/g dry extract)1862.62 ± 4.421618.32 ± 3.2
Tannins (mg GAE/g dry extract)412 ± 4.7370 ± 3.6
Flavonoid (mg QE/g dry extract)697.3 ± 2.1531.54 ± 2.7
Values are means of triplicate ± standard deviations.
Table 2. Chemical and chromatic analysis of alcoholic beverages of coffee.
ParticularsAPAMAMS
Methanol content (mg/L)335 ± 1.21 c298.9 ± 0.28 a313.2 ± 1.81 b
Esters content (ppm)70.58 ± 1.45 b38.21 ± 6.09 a33.86 ± 3.29 a
Aldehydes (ppm)9.15 ± 0.877 a22 ± 0.4 b42.94 ± 1.5 c
Alcohol (ABV%)8.867 ± 0.067 b8.707 ± 0.092 b8.25 ± 0.026 a
Total acidity (%)0.411 ± 0.02 ab0.393 ± 0.005 a0.443 ± 0.011 b
Volatile acidity (%)0.013 ± 0.00 c0.007 ± 0.00 a0.0094 ± 0.00 b
Caffeine content (ppm)30.94 ± 0.674 b21.29 ± 0.643 a42.44 ± 0.737 c
Polyphenols (mg GAE/g dry extract)845.7 ± 14.36 c554 ± 7.93 a709.7± 4.5 b
Tannin (mg GAE/g dry extract)305 ± 4 c235 ± 4 a268.3 ± 3.5 b
Flavonoid (mg QE/g dry extract)440.7 ± 5.03 c349.3 ± 4.5 a395 ± 3 b
Chromatic structure0.41 ± 0.00 c0.27 ± 0.00 a0.28 ± 0.00 b
Hue1.71 ± 0.00 c1.64 ± 0.00 b1.51 ± 0.00 a
Alcoholic beverages made from pulp (AP), mucilage only (AM) and mucilage with beans (AMS). Values are means of triplicate ± standard deviations. Values in the rows bearing the different superscripts (a, b, c, and ab) are significantly different (p < 0.05).
Table 3. Sensory analysis of alcoholic beverages of coffee.
ParticularsAppearanceAromaTasteAftertasteOverall Acceptability
AM9.03 ± 2.53 a18.89 ± 4.9 a21.21 ± 3.73 a10.32 ± 2.32 a6.35 ± 1.25 a
AMS9.07 ± 2 a20.11 ± 5.07 ab21.96 ± 4.17 a11.11 ± 3.17 ab6.32 ± 1.56 a
AP11.07 ± 2.19 b21.86 ± 3.71 b23 ± 2.34 a12.21 ± 1.67 b8.25 ± 0.7 b
Alcoholic beverages were made from pulp (AP), mucilage only (AM), and mucilage with beans (AMS). Values are means of triplicate ± standard deviations. Values in the rows bearing the different superscripts (a, b, ab) are significantly different (p < 0.05).
Publisher’s Note: MDPI stays neutral with regard to jurisdictional claims in published maps and institutional affiliations.

