Article

Response to Sulfur Dioxide Addition by Two Commercial Saccharomyces cerevisiae Strains

1
Department of Biology, The University of British Columbia, Kelowna, BC V1V 2J4, Canada
2
School of Agriculture, Food and Wine, The University of Adelaide, Urrbrae, SA 5064, Australia
3
Australian Research Council Training Centre for Innovative Wine Production, Adelaide, SA 5064, Australia
*
Author to whom correspondence should be addressed.
Fermentation 2019, 5(3), 69; https://doi.org/10.3390/fermentation5030069
Submission received: 27 June 2019 / Revised: 24 July 2019 / Accepted: 26 July 2019 / Published: 27 July 2019
(This article belongs to the Special Issue Wine Fermentation 2.0)

Abstract

:
Sulfur dioxide (SO2) is an antioxidant and antimicrobial agent used in winemaking. Its effects on spoilage microorganisms has been studied extensively, but its effects on commercial Saccharomyces cerevisiae strains, the dominant yeast in winemaking, require further investigation. To our knowledge, no previous studies have investigated both the potential SO2 resistance mechanisms of commercial yeasts as well as their production of aroma-active volatile compounds in response to SO2. To study this, fermentations of two commercial yeast strains were conducted in the presence (50 mg/L) and absence (0 mg/L) of SO2. Strain QA23 was more sensitive to SO2 than Strain BRL97, resulting in delayed cell growth and slower fermentation. BRL97 exhibited a more rapid decrease in free SO2, a higher initial production of hydrogen sulfide, and a higher production of acetaldehyde, suggesting that each strain may utilize different mechanisms of sulfite resistance. SO2 addition did not affect the production of aroma-active volatile compounds in QA23, but significantly altered the volatile profiles of the wines fermented by BRL97.

1. Introduction

Sulfur dioxide (SO2) has been used as an antimicrobial and antioxidant in winemaking for hundreds of years. It is added at different times throughout the winemaking process, including prior to inoculation with commercial yeast strains, in order to suppress any potential spoilage microorganisms from the grape must. Commercial yeasts are usually strains of Saccharomyces cerevisiae, and are expected to be more tolerant to SO2 than noncommercial yeasts and bacteria. However, different yeast strains may respond differently to SO2 addition, and it is important for winemakers to know which yeasts respond in favourable ways so they may select appropriate strains to use as inoculants.
Wine yeasts have four main methods of surviving in the presence of SO2: (1) Entering a viable but nonculturable (VBNC) state; (2) expelling SO2 from the cell via specialized sulfite efflux pumps; (3) reduction of SO2 via incorporation into the sulfur amino acid biosynthesis (SAAB) pathway; and (4) production of acetaldehyde [1]. If the level of SO2 added to the must is too high, wine yeasts, including both spoilage yeasts such as Brettanomyces bruxellensis and fermentative yeasts such as S. cerevisiae, may enter a VBNC state where they are still metabolically active but are not detected by culture-dependent methods [2,3,4]. Such a response is rare for commercial yeasts, because they are selected for their ability to withstand stressful environments, including musts or wines containing SO2 [5]. Additionally, the concentration of SO2 in fermentations is often not high enough to induce such a state in all but the most vulnerable wine microorganisms [6,7,8]. Sulfite efflux is a desirable response to SO2 by commercial wine yeasts because the SO2 is not converted into an undesirable form nor is it bound and rendered inactive, so it is able to resume its antimicrobial activity on more susceptible microorganisms [9]. Sulfite efflux is conducted via the specialized Ssu1p sulfite efflux pump, and is encoded by the SSU1 gene and regulated by the FZF1 transcription factor [9,10,11,12]. Expression of SSU1, or its more resistant allele SSU1-R, can be induced in the presence of SO2, and its expression is often constitutively higher in more SO2-resistant strains [11,13]. When SO2 enters the cell, the higher internal pH converts molecular SO2 to bisulfite (HSO3), which can be incorporated into the SAAB pathway. Once it is in this pathway, bisulfite is reduced to sulfide (S2−) and then either used to produce sulfur-containing amino acids or exported from the cell as hydrogen sulfide (H2S). This response to SO2 is undesirable for winemakers and wine consumers alike, because H2S has a low detection threshold and can lend a rotten egg or cooked cabbage aroma to the wine [14]. Finally, acetaldehyde is produced by yeasts as an intermediate in many metabolic pathways, including alcoholic fermentation. Acetaldehyde has an extremely high affinity for SO2, with one mole of acetaldehyde able to bind approximately one mole of SO2 [1]. Bound SO2 is no longer active as an antimicrobial agent, so this is an effective method of sulfite resistance. However, high levels of acetaldehyde in wine can give the wine a bruised apple or sherry-like aroma [15]. Like the sulfite efflux pump, highly resistant yeast strains tend to have higher constitutive production of acetaldehyde, even in the absence of SO2 [16,17].
Previous studies have been instrumental in determining the mechanisms by which S. cerevisiae strains respond to the presence of SO2 [11,13,17,18,19]. However, most of these studies have focused on one of these mechanisms at a time, and few have investigated the ways that these mechanisms may work together to provide sulfite protection [20]. Furthermore, many SO2 studies used differences in gene expression as the sole method of inferring differences in yeast resistance mechanisms, but changes in gene expression are not always correlated with changes in protein translation or metabolic activity [21,22,23,24]. Additionally, few studies have investigated the effects of SO2 addition on the production of volatile secondary metabolites by S. cerevisiae strains [25,26,27]. Here, we investigate both the potential sulfite resistance responses of two commercial strains of S. cerevisiae, as well as their production of volatile compounds that are important to the sensory profile of wines.
The objective of this study was to observe the responses of two commercial S. cerevisiae strains to the presence (50 mg/L) or absence (0 mg/L) of SO2 in fermentations of pinot gris juice conducted under laboratory conditions. Specifically, fermentation kinetics, yeast abundance, SO2 concentration, H2S production, acetaldehyde production, and secondary metabolite composition as a result of SO2 addition were compared between the two strains. The two yeast strains selected for comparison were Lalvin® QA23 and Lalvin® BRL97, both of which are commonly used to inoculate fermentations at commercial wineries. QA23 was originally isolated in Portugal and is recommended for white wine production, while BRL97 was isolated from Italy and is recommended for red wine production. However, BRL97 was recently shown to be genetically equivalent to Lalvin® ICV-D47 via SNP analysis [28]. Interestingly, ICV-D47 is recommended for white wine production, and the abundance of ICV-D47 was previously found to increase in a dose-dependent manner with increasing SO2 concentration in uninoculated commercial fermentations [29]. Both QA23 and BRL97/ICV-D47 are killer-active [30], and possess unique enological properties, including β-glucosidase production (QA23) and colour stabilization (BRL97) (www.lallemandbrewing.com). Therefore, we predicted that these strains would differ in both their susceptibility to SO2 and in their response mechanisms to SO2. We further predicted that these differences in yeast behaviour would also result in differences in their production of volatile secondary metabolites, both between strains and between SO2 treatments within one strain.

2. Materials and Methods

2.1. Experimental Design

This experiment was conducted in 2017 at the School of Agriculture, Food, and Wine at the University of Adelaide (Waite Campus). Two commercial yeast strains—Lalvin® QA23 and Lalvin® BRL97—were inoculated into sterile-filtered pinot gris juice containing either 0 or 50 mg/L SO2 (n = 4 per treatment). In the 50 mg/L SO2 treatments, SO2 was added as 100 mg/L potassium metabisulfite (K2S2O5). Therefore, 16 single-strain fermentations of 100 mL were conducted at 24 °C. Due to the number of parameters being measured in this experiment and the sample volumes required for some measurements, it was not feasible to measure everything at once. To address this issue, this experiment was conducted twice, with the objective of measuring different aspects of the fermentations during Run 1 and Run 2.
Run 1 was performed in 250 mL GL45 glass Schott bottles (DWK Life Sciences, Wertheim, Germany) sealed with custom 3D-printed airlocks (filled with 3 mL sterile water) containing a central sampling port closed with a silicone septum. Each fermentation flask also contained a small, sterilized magnetic stir bar that was used to maintain an even mixture of the fermentations. These fermentations were conducted in a customized Freedom EVO® automated fermentation unit (Tecan Group, Ltd., Männedorf, Switzerland) with temperature controlled panels, autosampling capabilities, and individual magnetic stir plates for each flask (350 rpm) (described further in [31]). The flasks were randomly arranged within the Freedom EVO®. These fermentations were carried out for 14 days with measurement of yeast abundance (CFU/mL) and residual sugar (g/L glucose + fructose) throughout fermentation, as well as the production of volatile secondary metabolites measured from samples collected at the end of the fermentations.
Run 2 was performed using 250 mL glass Erlenmeyer flasks modified to include a sampling port, which was closed with a silicone septum and sealed with a glass airlock containing no water but fitted with H2S gas detection tubes (see Section 2.6 below). These fermentations were performed in a temperature controlled room on two shaker beds (350 rpm). The flasks were randomly arranged such that two replicates from each treatment were placed on each shaker. These fermentations were carried out for nine days with measurement of free and bound SO2 (mg/L) and H2S (ppm) throughout fermentation, as well as acetaldehyde (g/L) in terminal samples.

2.2. Inoculation, Fermentation, and Sampling

Inoculation, fermentation, and sampling in this experiment followed a general laboratory fermentation protocol used at the wine microbiology lab at the University of Adelaide [32,33,34]. Pinot gris juice, pressed from grapes collected in South Australia (2015 vintage), was filtered consecutively through 0.4 µm and 0.22 µm filters. An aliquot of 100 µL of the sterile filtered juice was plated onto YEPD agar (10 g/L yeast extract (Amyl Media, Dandenong, VC, Australia), 20 g/L bacterial peptone (Amyl Media), 20 g/L dextrose (Chem Supply, Gillman, SA, Australia), and 10 g/L agar (Amyl Media)) and incubated at 28–30 °C to confirm sterility. Prior to inoculation, one colony of each yeast strain was aseptically transferred to separate flasks containing 40 mL liquid YEPD media. These flasks were sealed with parafilm and incubated aerobically overnight at 28–30 °C. A small homogeneous subsample from each of these flasks was diluted 10 times, 5% propidium iodide (1 mg/mL) was added to fluorescently stain any dead cells, and the number of living cells were counted using a hemocytometer to determine the cells/mL of each flask. Approximately 2.5 × 10⁶ cells/mL were inoculated from the YEPD medium into a starter culture containing 45% liquid YEPD, 45% sterile filtered pinot gris juice, and 10% sterile water. This starter culture was incubated overnight at 28–30 °C, after which the cell concentration was determined via hemocytometer, and 2.5 × 10⁶ cells/mL were inoculated into the fermentation flasks containing sterile filtered pinot gris juice. At each step, noninoculated flasks containing the same starter culture medium were incubated to ensure no microbial contamination.

2.3. Residual Sugar Concentration

Samples of fermenting juice (100 µL) were taken every day using a sterilized sampling needle for determination of residual sugar (g/L glucose + fructose) by enzymatic assay. Fermentation samples were diluted and adjusted to a final volume of 200 µL for analysis in 96-well flat bottom cell culture microplates (Corning Costar, Corning, NY, USA) using hexokinase + G6P-DH and phosphoglucose isomerase enzymes (Megazyme Inc., Chicaco, IL, USA) in a microplate reader with microplate stacker attachment (Tecan Group, Ltd., Männedorf, Switzerland). Plate preparation and enzymatic/spectrophotometric analyses were performed robotically.

2.4. Yeast Abundance

Samples for yeast abundance (CFU/mL) were taken on days 1, 3, 5, 7, 10, 12, and 14. Samples were serially diluted and plated using an automated spiral plater (Don Whitley Scientific Ltd., Bingley, UK) before being incubated for 48 h at 28–30 °C. After incubation, yeast colonies were counted using ProtoCOL 3 (Synbiosis©, Cambridge, UK), an automated colony counting and zone measuring software program.

2.5. Sulfur Dioxide Determination and Sulfite Resistance Assay

Free and bound SO2 were determined using an aeration, oxidation, distillation, and titration procedure described previously [35,36]. Samples for SO2 determination were taken prior to the experiment to confirm that the juice did not already contain SO2, as well as on days 1, 2, 4, 5, and 9 of the fermentations. On each sampling, 10 mL samples from each replicate were combined into one 40 mL sample in order to provide the total volume required for the SO2 determination procedure. Therefore, each treatment contained a single data point on each sampling day. Molecular SO2 was calculated from the free SO2 concentration and the pH of the juice using the Henderson–Hasselbach equation [1,35]. Juice pH was measured using a CyberScan 1100 pH meter (Eutech Instruments Pte. Ltd., Singapore).
The relative sensitivity of each yeast to SO2 was determined using a sulfite resistance assay [37]. Autoclaved YEPD agar medium was buffered to pH 3.5 with tartaric acid and 18 mL was poured into 25 mL sterile plastic petri dishes and left to harden. In order to create a gradient of SO2 concentrations, 0.5 M sodium sulfite (Na2SO3) was spread onto the plates in the following volumes: 39.99 µL, 59.98 µL, 79.97 µL, and 99.97 µL, in order to achieve Na2SO3 concentrations of 1.0, 1.5, 2.0, and 2.5 mM, respectively. These plates were left to equilibrate overnight at room temperature. The following day, dilutions of each yeast inoculum containing approximately 100 CFU/100 µL were spread onto plates at each Na2SO3 concentration (n = 3) and incubated for 48 h at 28–30 °C before visual assessment for growth inhibition.

2.6. Hydrogen Sulfide Determination

The production of H2S throughout fermentation was analyzed using Kitagawa Precision Gas Detector Tubes (no. 120SF) (Kawasaki, Japan). Each tube was cut at both ends so that gas would be allowed to travel through the tube. The bottom end of each glass tube was inserted into a 3–4 cm piece of clear rubber tubing, and subsequently inserted into the end of the glass airlock, ensuring no gas could escape the fermentation without passing through the H2S detector tube. The level of H2S produced in each fermentation was monitored on days 1, 2, 3, 4, 5, and 9 of the experiment.

2.7. Acetaldehyde Determination

Acetaldehyde concentration (g/L) was determined at the end of the nine-day fermentations via high-performance liquid chromatography (HPLC) [32]. This was performed on an Agilent 1100 Series HPLC (Agilent Technologies Australia, Mulgrave, VIC, Australia) fitted with an Aminex HPX-87H column (Bio-Rad Laboratories, Hercules, CA, USA), with 2.5 mmol/L H2SO4 as the mobile phase, flowing at a rate of 0.5 mL/min and measured by refractive index (G1362A refractive index detector, Agilent). Before injection, samples were filtered on an AcroPrepTM Advance 96-well filter plate with a 0.2 µm polytetrafluoroethylene (PTFE) membrane (Pall©, Port Washington, NY, USA). Acetaldehyde standards of known concentration were included for quantification. Data analysis was performed using Agilent ChemStation (version B.01.03) software.

2.8. Secondary Metabolite Analysis

Relative quantification of 26 secondary metabolites produced by yeasts during fermentation (Table 1) was performed using a combination of headspace-solid phase microextraction (HS-SPME) and gas chromatography-mass spectrometry (GC-MS). These compounds were chosen because they are produced by wine yeasts during alcoholic fermentation and are aroma-active, meaning they contribute to the aroma profile of the wine. At the end of the 10-day fermentations, the wines were centrifuged and decanted into 22 mL glass vials with screw caps containing a polytetrafluoroethylene (PTFE) lining, leaving no headspace, and were stored in the dark at 4 °C.

2.8.1. Chemical Standards

Stock solutions for all compounds were prepared from high-purity stocks from: Aldrich (Milwaukee, WI, USA) [2-phenylethyl acetate (99%), ethyl decanoate (≥99%), hexyl acetate (99%), ethyl octanoate (≥99%), ethyl hexanoate (≥99%), 2-methyl butyl acetate (99%), ethyl 2-methylbutanoate (99%), ethyl 3-methylbutanoate (99%), ethyl butanoate (99%), benzyl alcohol (98%), 2-methyl butanol (≥99%), methionol (≥98%), ethyl 2-methyl propanoate (99%), ethyl acetate (99.9%), hexanoic acid (≥99.5%), hexanol (≥99%), ethyl dodecanoate (≥98%), ethyl propanoate (99%), 2-methyl butanoic acid (≥99%), 3-methyl butanoic acid (99%)]; Sigma (St. Louis, MO, USA) [2-phenyl ethanol (≥98%), 3-methylbutyl acetate (≥99%), octanoic acid (≥99%)]; Unilab (Mandaluyong City, Philippines) [1-octanol (≥95%)]; Fluka (Buchs, SG, Switzerland) [3-methyl butyl acetate (≥99.7%)]; and Chemsupply (Gilman, SA, Australia) [ethyl 3-methyl butanoate (≥99.7%), 3-methyl butanol (≥99.8%), decanoic acid (≥99.5%) 2-methylpropanol (≥99.5%)].

2.8.2. Quality Assurance and Standard Curves

Concentrated ‘category stock solutions’ of these compounds (see Table 1) were premade and dissolved in ethanol [38]. A stock solution (10 mg/L in 10% ethanol) of the internal standard 1-octanol was also created. Eight dilutions of the stock solution, corresponding to the following percentage concentrations, were used to create standard curves for each of the evaluated compounds: 100% (concentrated stock solution), 40%, 20%, 4%, 1%, 0.2%, 0.04%, and 0.01%.

2.8.3. Sample Preparation

Duplicates of each sample were made following a general SPME procedure: 2.0 g sodium chloride, 1.5 mL sample, 8.4 mL Milli-Q® water (Merck Millipore©, Darmstadt, Germany), and 100 µL internal standard (10 mg/L 1-octanol) were added to a 20 mL SPME crimp cap vial, closed with a magnetic PTFE/silicone crimp cap seal, and mixed thoroughly.

2.8.4. Instrumentation and Parameters

Samples were analyzed in duplicate via GC-MS with HS-SPME extraction on an Agilent Technologies© 7890A GC coupled with a 5975C MS detector (Santa Clara, CA, USA). Prior to analysis, samples were agitated at 250 rpm for 10 min at 50 °C, then extracted with a 65 µm 24-gauge polydimethylsiloxane/divinylbenzene (PDMS/DVB) fiber (Supelco®, Bellefonte, PA, USA) for 10 min. The GC inlet was fitted with a SPME injection sleeve (0.75 mm ID) (Supelco®) and the inlet temperature was set to 250 °C, with pressure at 184.84 kPa and a split ratio of 0.6:1 with a helium carrier gas at 1.02 mL/min. Compound separation was performed on a 60 m × 0.25 mm VF-WAXms column (Agilent Technologies©). The oven program was as follows: 1.5 min at 50 °C, then ramped at a rate of 5 °C/min up to 200 °C, then at a rate of 10 °C/min to 240 °C, which was held for 3.5 min (total run time 39 min). All samples were run under selected ion monitoring (SIM) mode with corresponding dwell times (Table A1). The transfer line was held at 250 °C. Source temperature was held at 230 °C and electron impact ionization was performed at 70 eV. Quadrupole temperature was held at 150 °C. To ensure instrumentation stability, a QC injection of the third standard curve solution was performed at three points during each analysis run.

2.9. Strain-Typing

To confirm that the strains used in this study were genetically distinct, the multilocus genotypes of QA23 and BRL97 were determined via fragment analysis of eight hypervariable microsatellite loci, as described previously [29]. Briefly, multiplex PCR was performed on the eight microsatellite loci (C11, C3, C4, C8, YOR267c, YLR117w, YML091c, YPL009c) to determine the multilocus genotype of the two S. cerevisiae strains [48,49]. PCR, fragment analysis, and multilocus genotyping were performed as outlined previously [50]. These multilocus genotypes can be viewed in Table A2.

2.10. Statistical Analysis

A standard curve for each compound of interest measured via HS-SPME GC-MS was created in Excel 2016, and a linear line of best fit was applied to each volatile compound of interest. R2 values above 0.99 were confirmed for all compounds, except ethyl acetate, which had an R2 value of 0.93 (data not shown). This indicated that no nontarget compounds were being measured along with the compound of interest.
Residual sugar, yeast abundance, H2S production, and acetaldehyde production data were all statistically analyzed using RStudio (version 3.5.1). Two-factor repeated measures ANOVA were performed to test for differences in residual sugar (g/L glucose + fructose) and yeast abundance (CFU/mL) among treatments throughout fermentation. These ANOVA were performed using the “aov” function. When appropriate, Tukey HSD post-hoc tests were performed to conduct pairwise comparisons among treatments using the “lm” function in the nlme package, and the “glht” and “cld” functions in the multcomp package, adjusted for multiple comparisons using the Holm method. The assumption of homogeneity of variance was assessed using the “leveneTest” function from the car package (version 3.0-0), which indicated a significant difference among treatments for yeast abundance (F (3,93) = 10.1, p = <0.001) but not for residual sugar (F (3,220) = 2.04, p = 0.11). Yeast abundance data were normally distributed, but residual sugar data were not. However, because ANOVA are generally robust to violations of assumptions when sample sizes are equal among groups, no data transformations were performed.
The production of H2S (ppm) by yeasts in response to SO2 addition was compared among yeast strains by performing a one-factor repeated measures ANOVA on untransformed data using the “aov” function. As no H2S was produced in the 0 mg/L treatments, these samples were removed from analysis. Levene’s test indicated no violation of the assumption of homogeneity of variance (F (1,34) = 1.31, p = 0.26). A Tukey HSD test (using the “lm”, “glht”, and “cld” functions), adjusted for multiple comparisons using the Holm method, was used to perform pairwise comparisons among strains.
Acetaldehyde production was assessed by performing a two-factor ANOVA on untransformed data using the “aov” function. The assumption of homogeneity of variance was assessed using the Levene test, which indicated no significant difference among treatments (F (3,12) = 0.559, p = 0.65). A Tukey HSD test (using the “lm”, “glht”, and “cld” functions), adjusted for multiple comparisons using the Holm method, was used to perform pairwise comparisons among treatments.
The relative quantity of secondary metabolites among treatments was assessed by performing two-factor ANOVA on untransformed data using the “aov” function. Each compound was analyzed separately. When appropriate, Tukey HSD tests (using the “nlme” and “glht” functions), adjusted for multiple comparisons using the Holm method, performed pairwise comparisons among treatments. The composition of secondary metabolites was analyzed using Primer v.6 software with PERMANOVA+ add-on (Plymouth, MA, USA) [51]. A two-factor permutational analysis of variance (PERMANOVA), using Euclidean distance and Type II sums of squares, was performed in order to test for differences in secondary metabolite composition among treatments. A PERMDISP test, using Euclidean distance and calculating deviation from centroid, indicated no violation of the assumption homogeneity of multivariate dispersion (F (3,12) = 2.86, p = 0.31). Test statistics (F values for PERMDISP and Pseudo-F values for PERMANOVA) were calculated based on 999 permutations of normalized data. A principal coordinate analysis (PCoA) was generated in order to visualize differences in secondary metabolite composition among treatments. Variable vectors were plotted using Pearson’s correlation. Relevant data tables and R-scripts for this publication can be accessed via the following link: https://osf.io/wkx32/.

3. Results

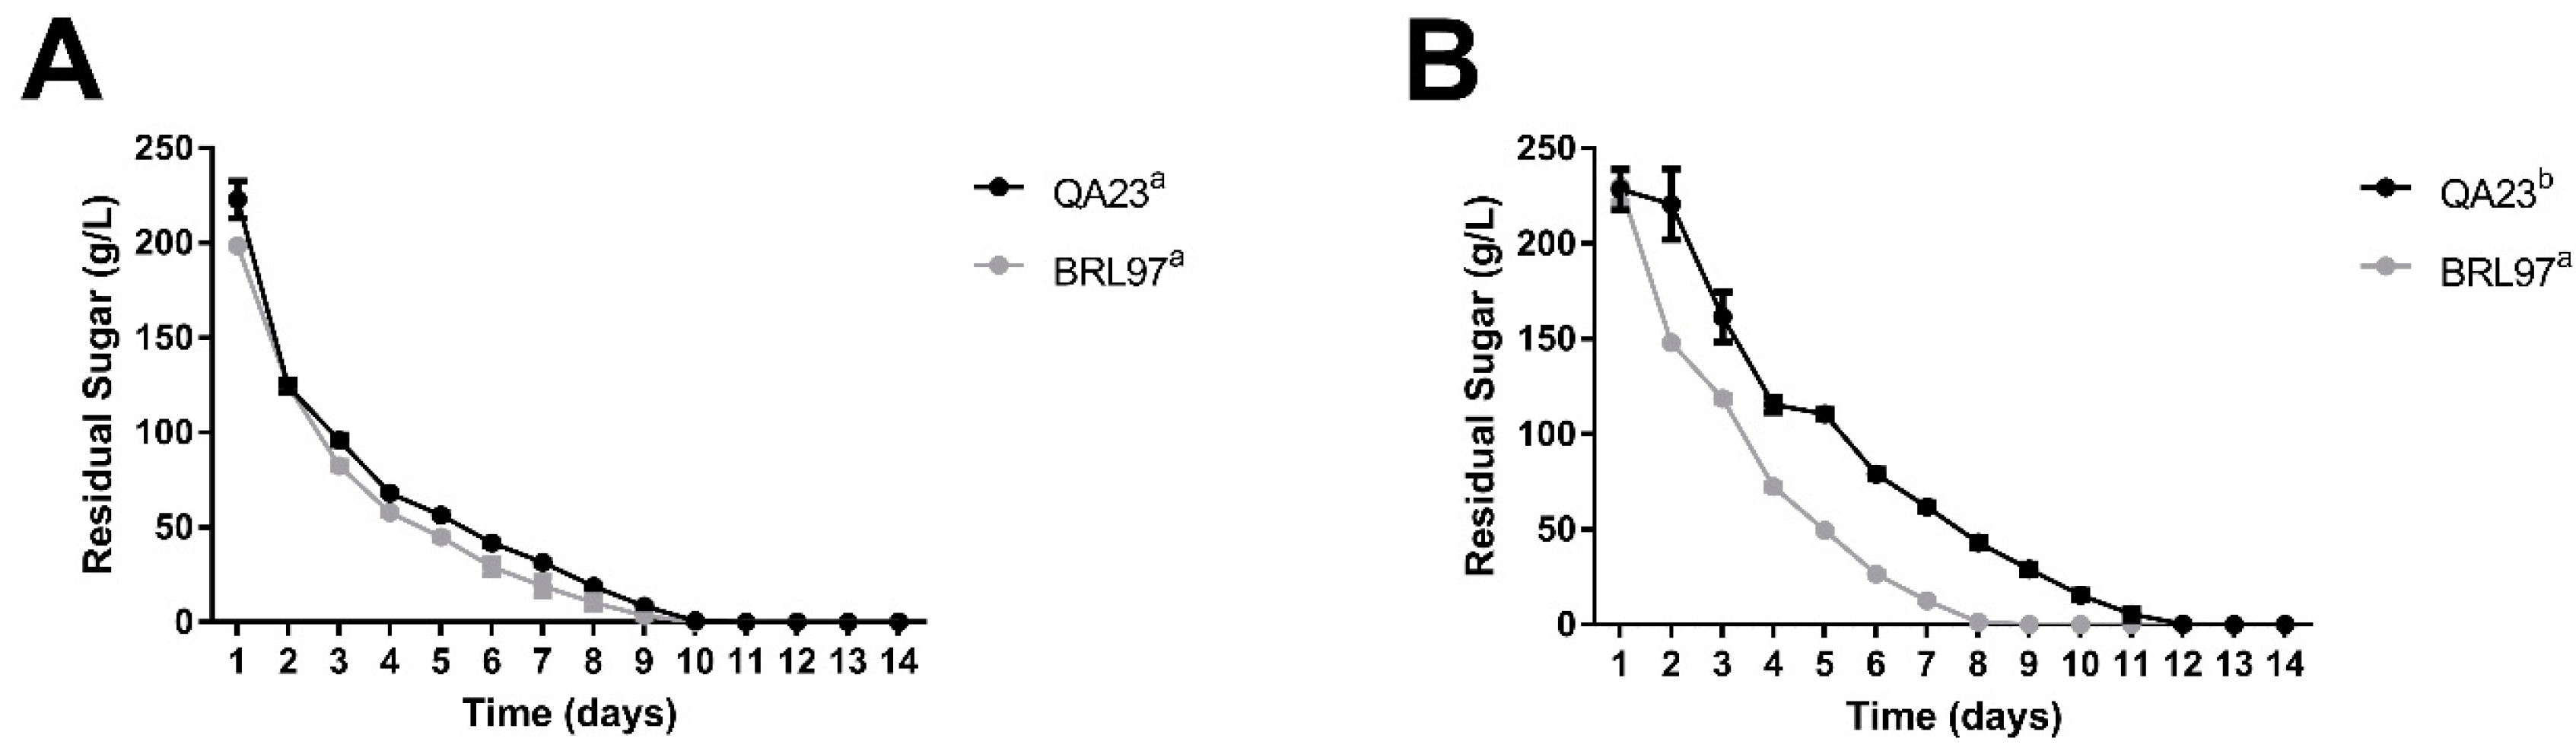
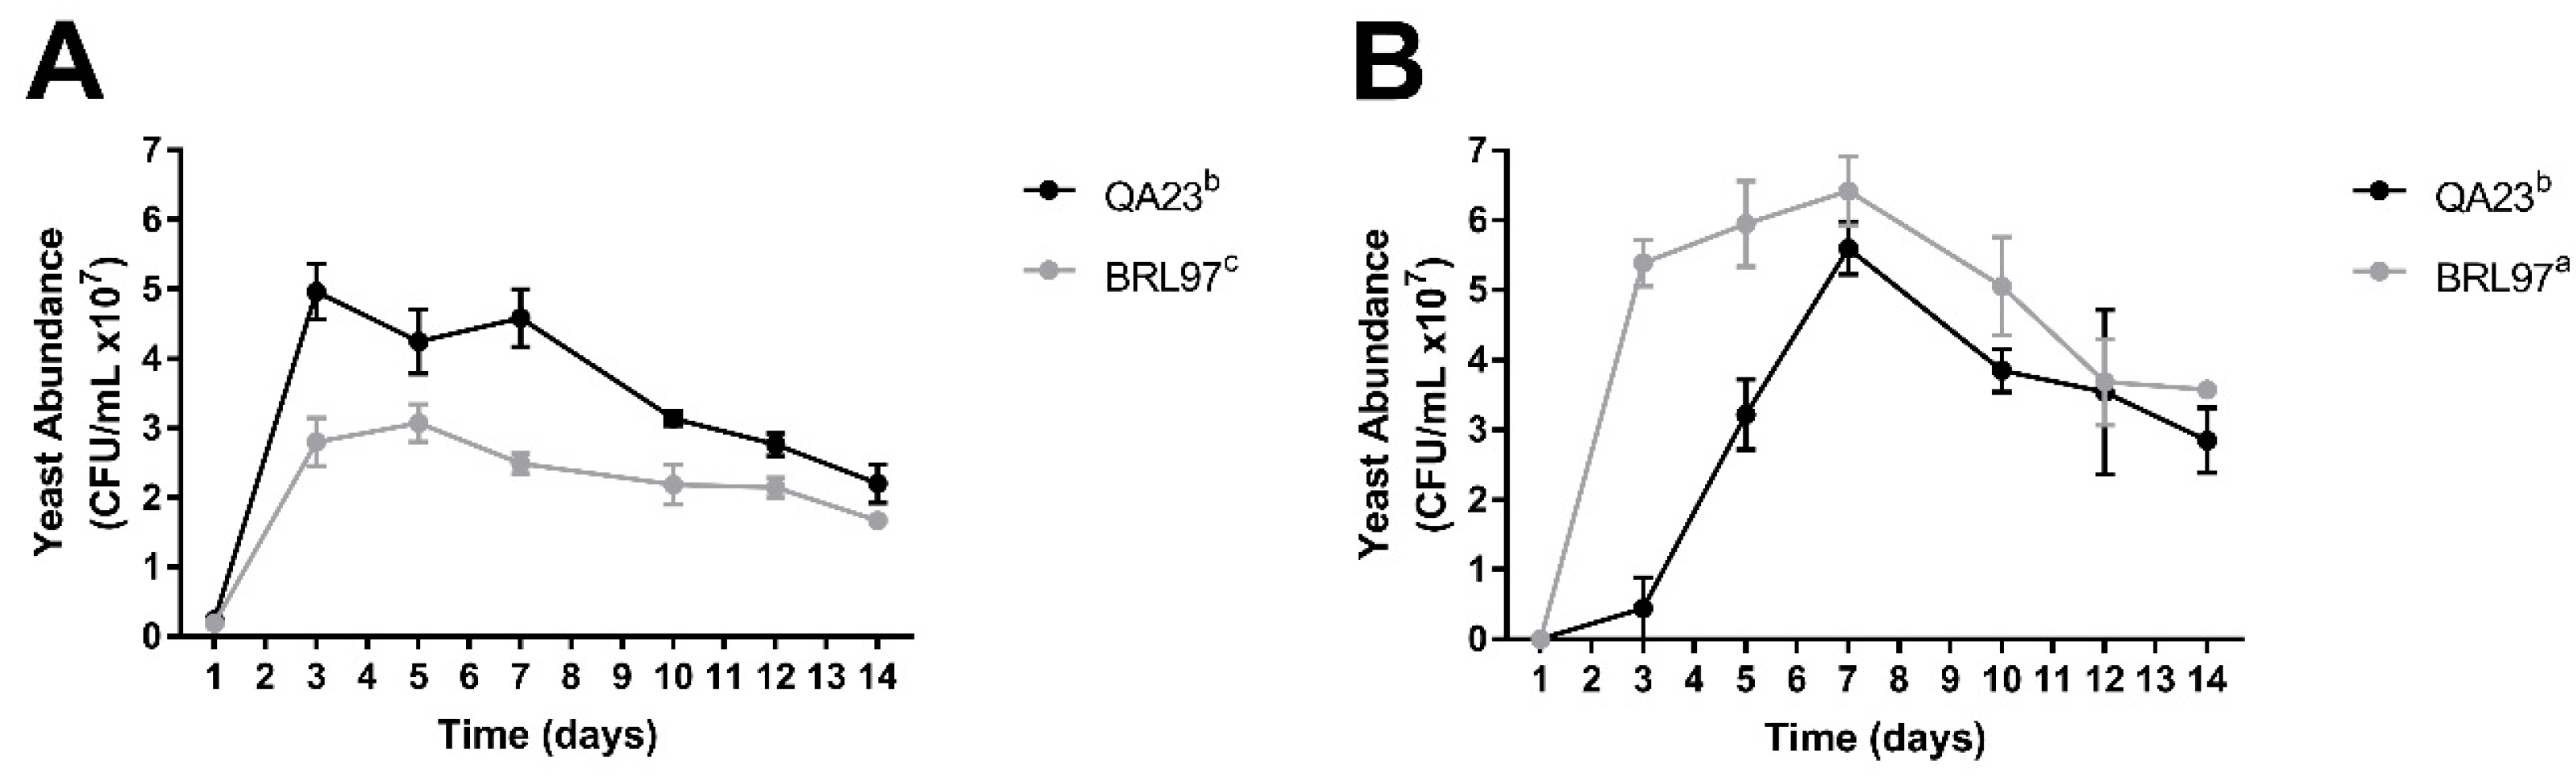
3.1. Fermentation Kinetics and Yeast Abundance

Fermentation kinetics, as measured by residual sugar content (g/L glucose + fructose), differed as a result of both yeast strain and SO2 level (Figure 1). In the control treatment (when no SO2 was added), both QA23 and BRL97 completed fermentation at the same rate (Figure 1A). However, when SO2 was added, QA23 fermented at a slower rate (Figure 1B). BRL97 conducted alcoholic fermentation at the same rate at both SO2 concentrations.
Yeast abundance (CFU/mL) also differed for both yeast strain and SO2 level (Figure 2). Yeast abundance increased at the start of fermentation and remained high until Day 5–7, after which it began to decrease for all treatments. In the control fermentations, QA23 had the highest abundance, but when SO2 was added, BRL97 had the highest abundance. Overall, the yeast abundance kinetics of QA23 did not differ between the two SO2 treatments (as determined by a repeated measures ANOVA), but even so, when SO2 was added, the growth of QA23 was delayed, remaining low until Day 5. BRL97, on the other hand, exhibited increased growth in the presence of SO2, reaching much higher total yeast abundance in the SO2 treatment as compared to the control.

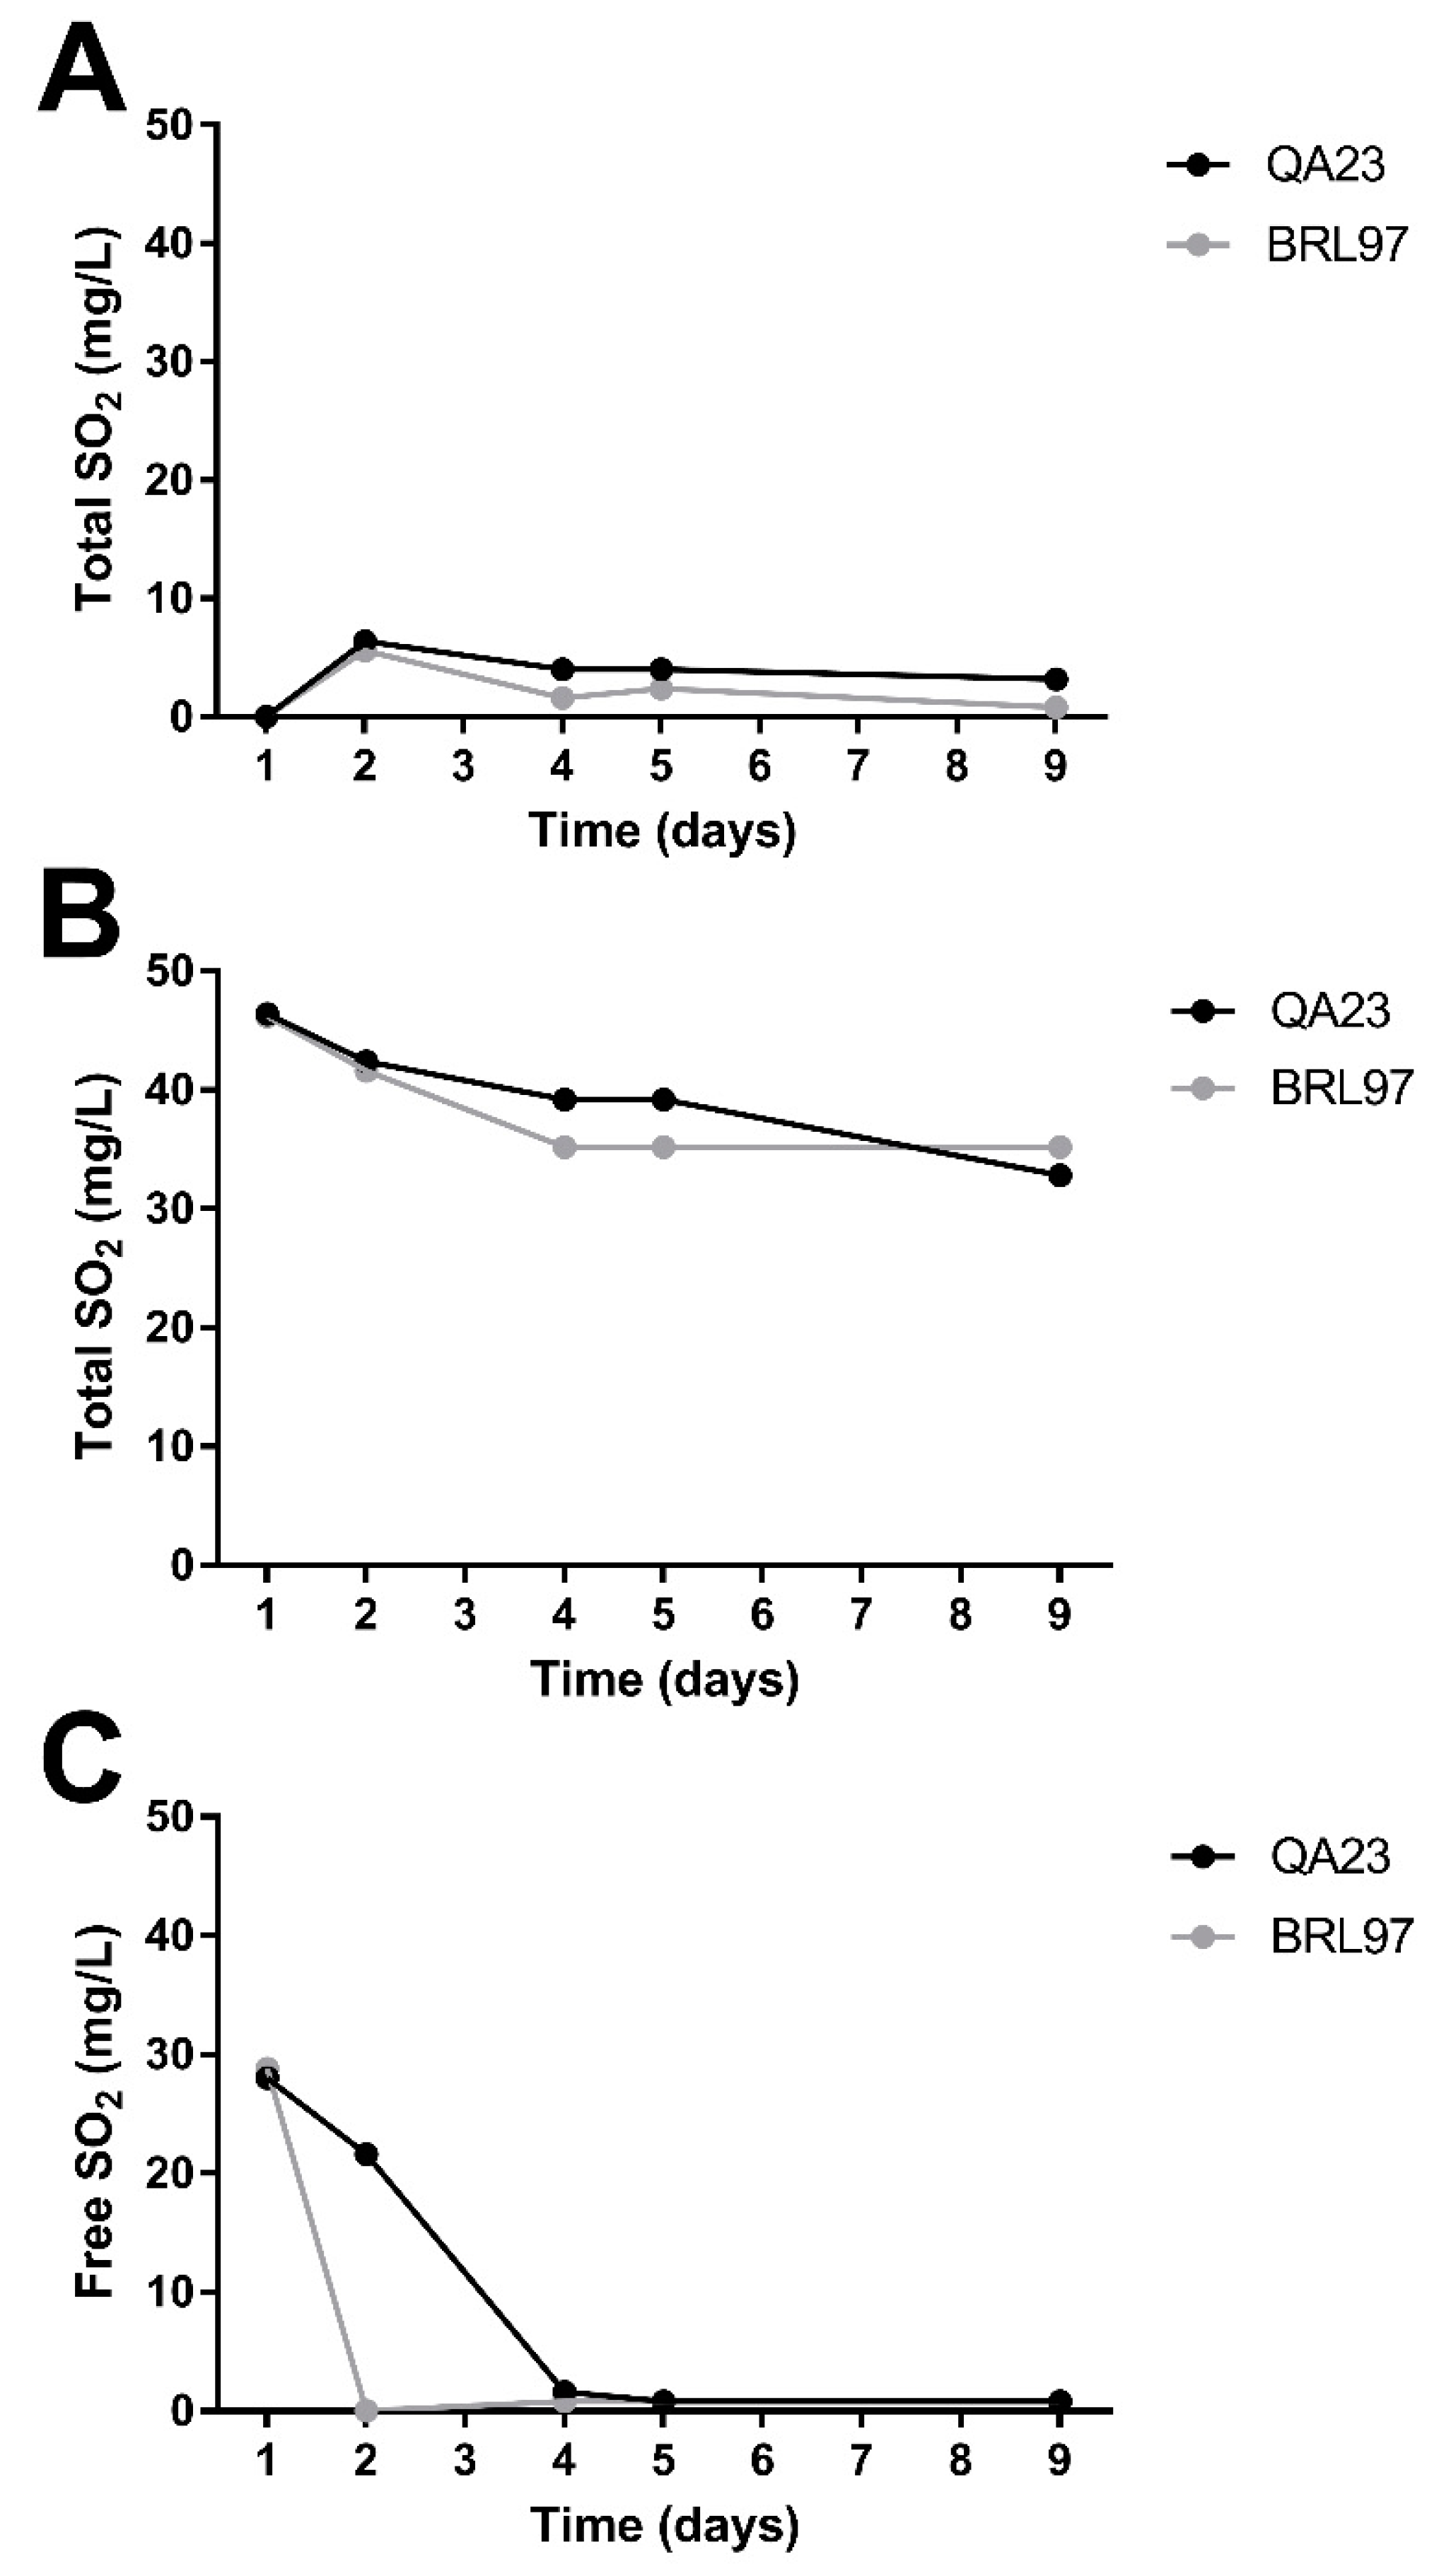
3.2. Sulfur Dioxide Concentration during Fermentation

Sulfur dioxide concentrations changed over the course of fermentation for all treatments. When no SO2 was added, total SO2 (free + bound SO2) was 0 mg/L on Day 1, increased between Day 1 and Day 2 due to SO2 production by yeasts, and then decreased gradually over the rest of the fermentation for both yeast strains (Figure 3A). Both strains produced similar total SO2 levels in the absence of added SO2. The treatments that received 50 mg/L SO2 contained ~46 mg/L total SO2 on Day 1 (Figure 3B). In the SO2-added fermentations, total SO2 decreased consistently over the course of the nine-day experiment for both strains, resulting in similar total SO2 patterns for both strains.
While total SO2 is useful for confirming SO2 addition levels and for monitoring SO2 production by yeasts, free SO2 is more useful for evaluating antimicrobial activity. Free SO2 is the portion of total SO2 that is available to act as an antimicrobial agent, and molecular SO2, which has the most antimicrobial activity, can be calculated from the concentration of free SO2 and the pH of the juice [1,35]. In the 50 mg/L SO2 treatments, approximately 28 mg/L of the SO2 added was present in its free form on Day 1 (Figure 3C). The pH of the juice on Day 1 was 3.16, and molecular SO2 was calculated to be ~1.2 mg/L in these fermentations. Free SO2 represented approximately 60% of the total SO2 concentration on Day 1. By Day 2, the fermentations inoculated with BRL97 did not contain any free SO2, but the fermentations inoculated with QA23 still contained approximately 21 mg/L. By Day 4, free SO2 had decreased to ~0 mg/L for both treatments and remained at this concentration until the end of the experiment. Free SO2 was not produced by either strain in the control (0 mg/L SO2) treatment.

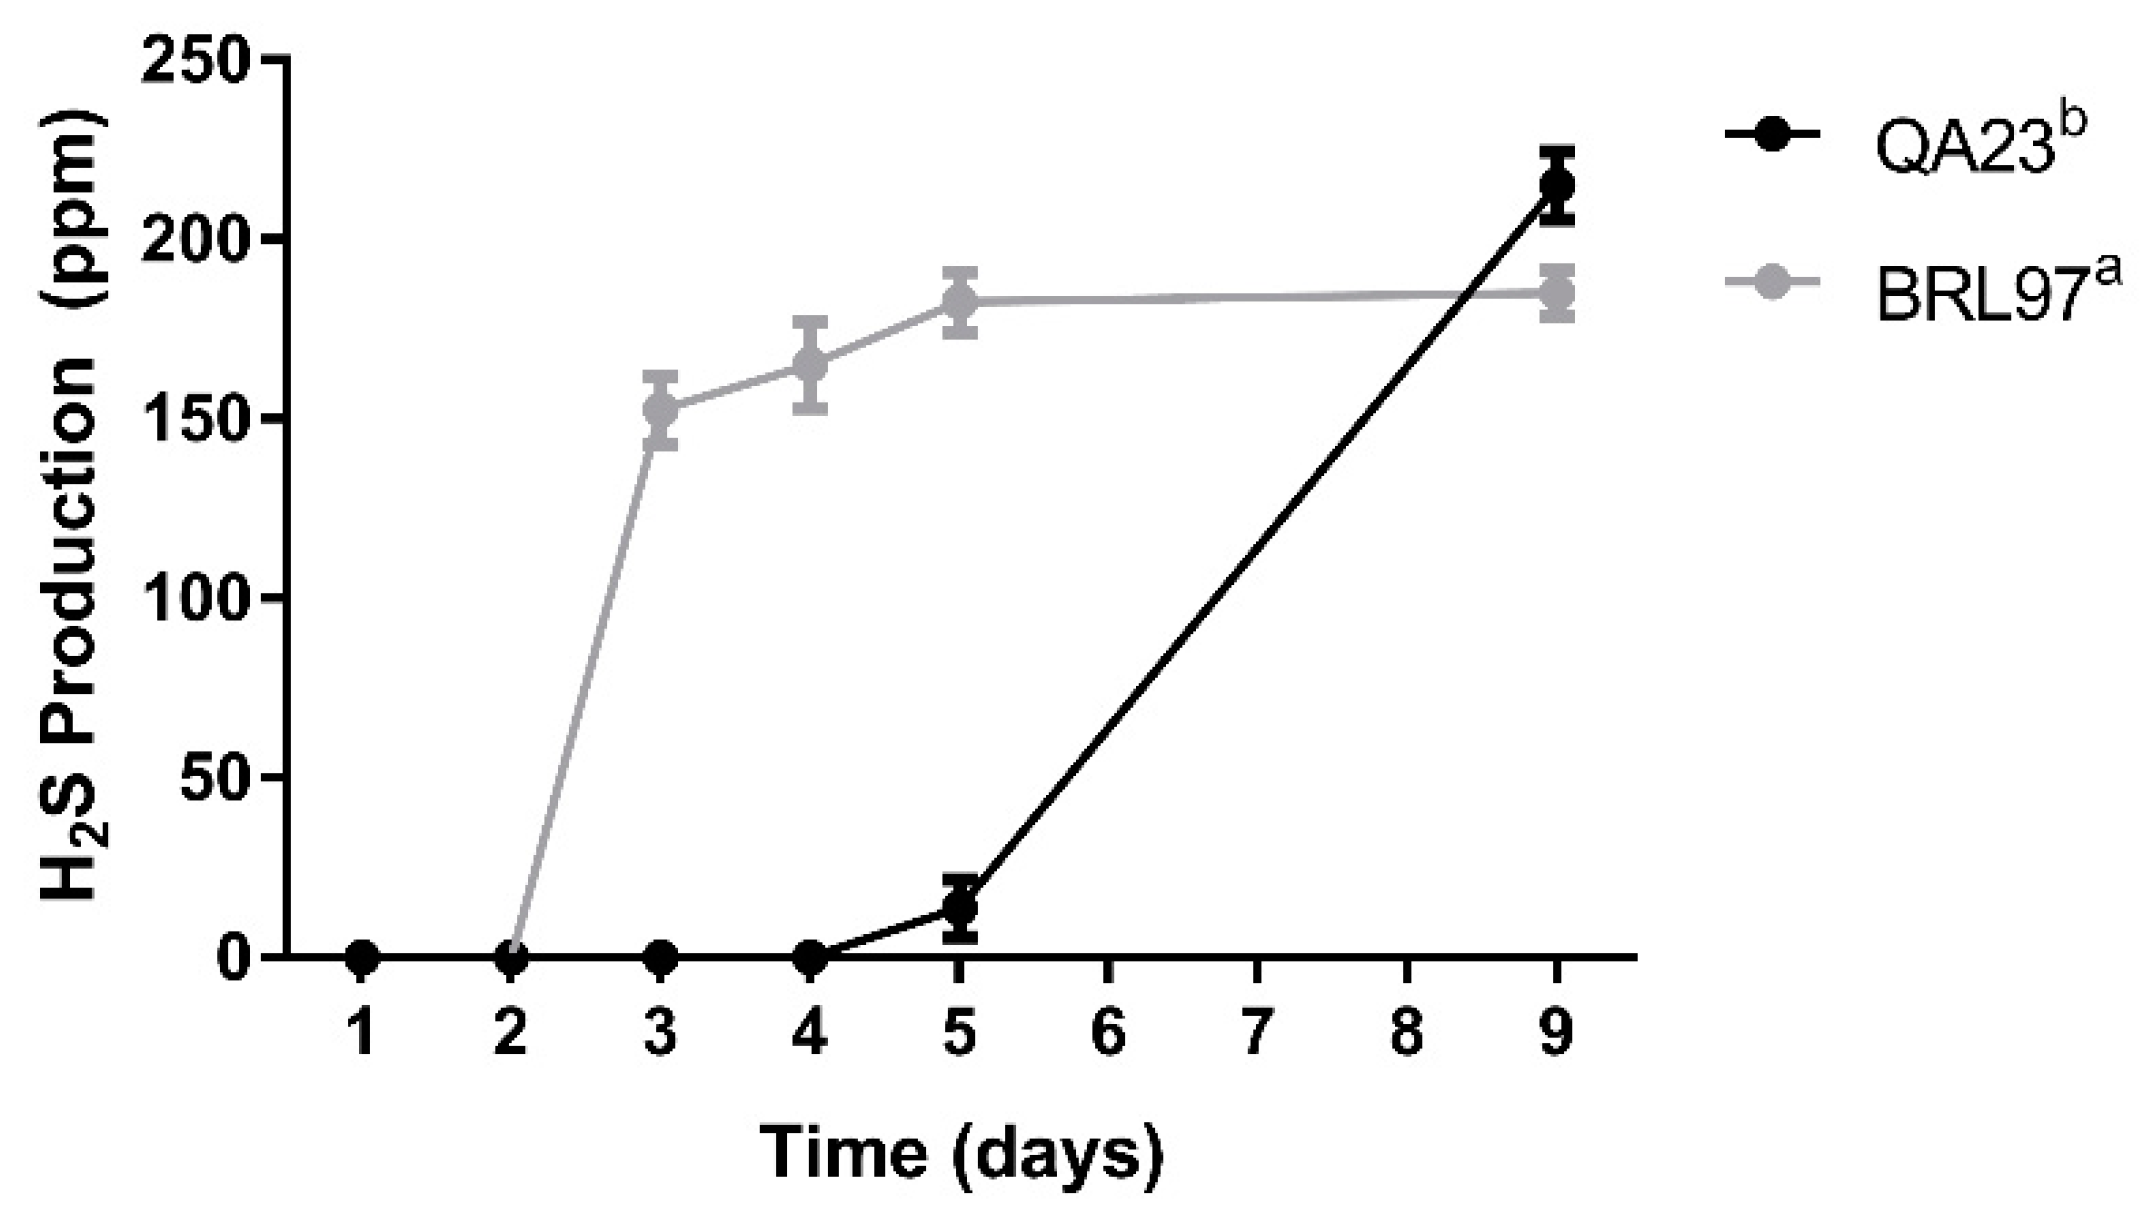
3.3. Hydrogen Sulfide Production during Fermentation

Hydrogen sulfide production differed between strains when SO2 was added (Figure 4), but no H2S was produced by either strain in the absence of SO2 (data not shown). In the SO2 treatments, both strains produced similar levels of H2S by the end of the nine-day fermentations, but their rates of production differed. Neither strain produced H2S by Day 2, but by Day 3 H2S production began to differ. Between Day 2 and Day 3, BRL97 produced an average of 152 ppm H2S. After this rapid increase, H2S production slowed for the remainder of the fermentation for BRL97. QA23 did not produce any H2S until Day 5, after which time H2S production increased to an average of 215 ppm by Day 9.

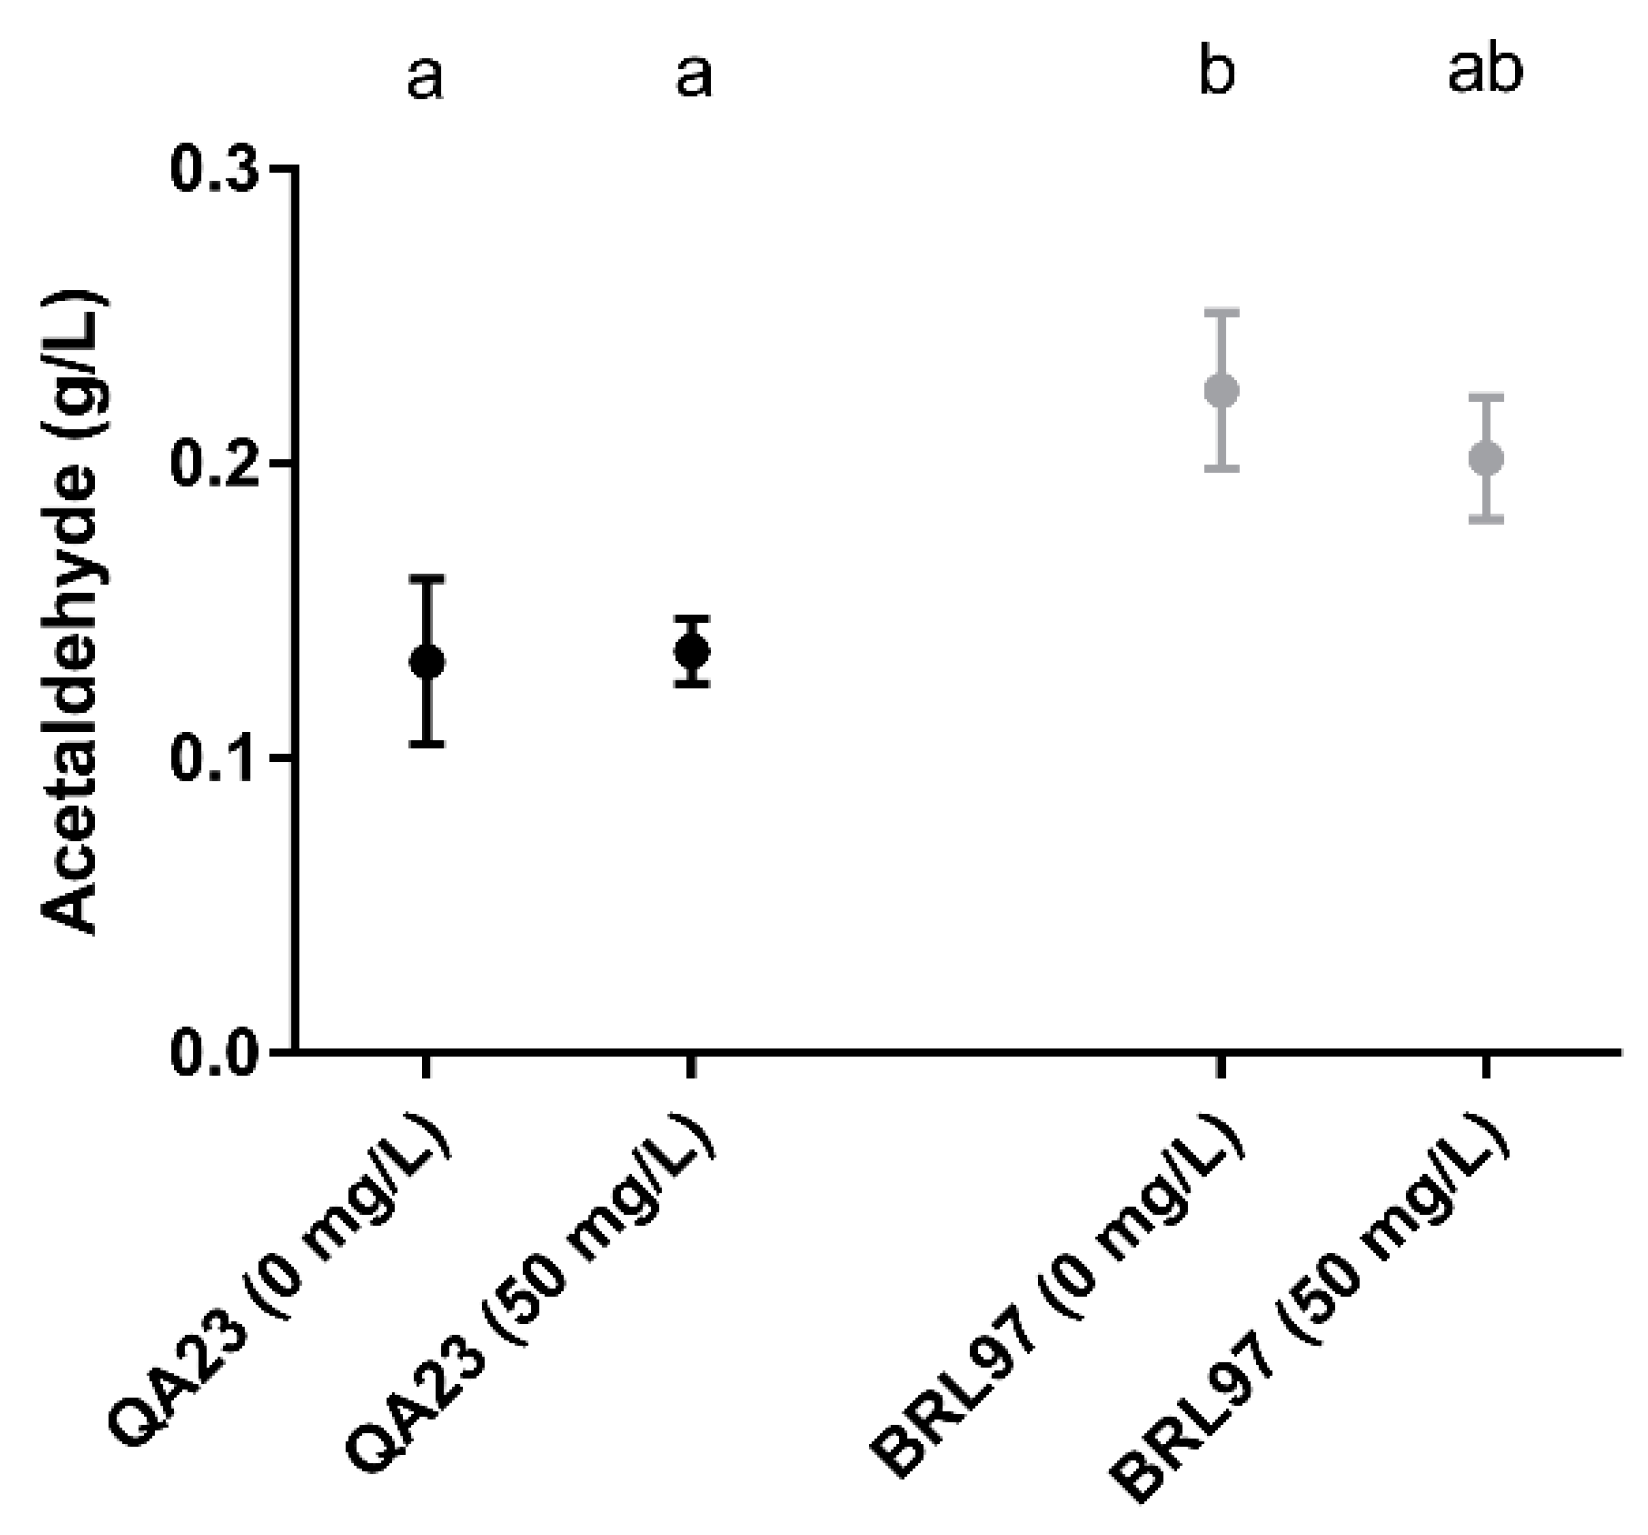
3.4. Post-Fermentation Acetaldehyde Production

The addition of SO2 did not alter the production of acetaldehyde for either strain, but overall, BRL97 produced more acetaldehyde than QA23, particularly in the absence of SO2 (Figure 5).

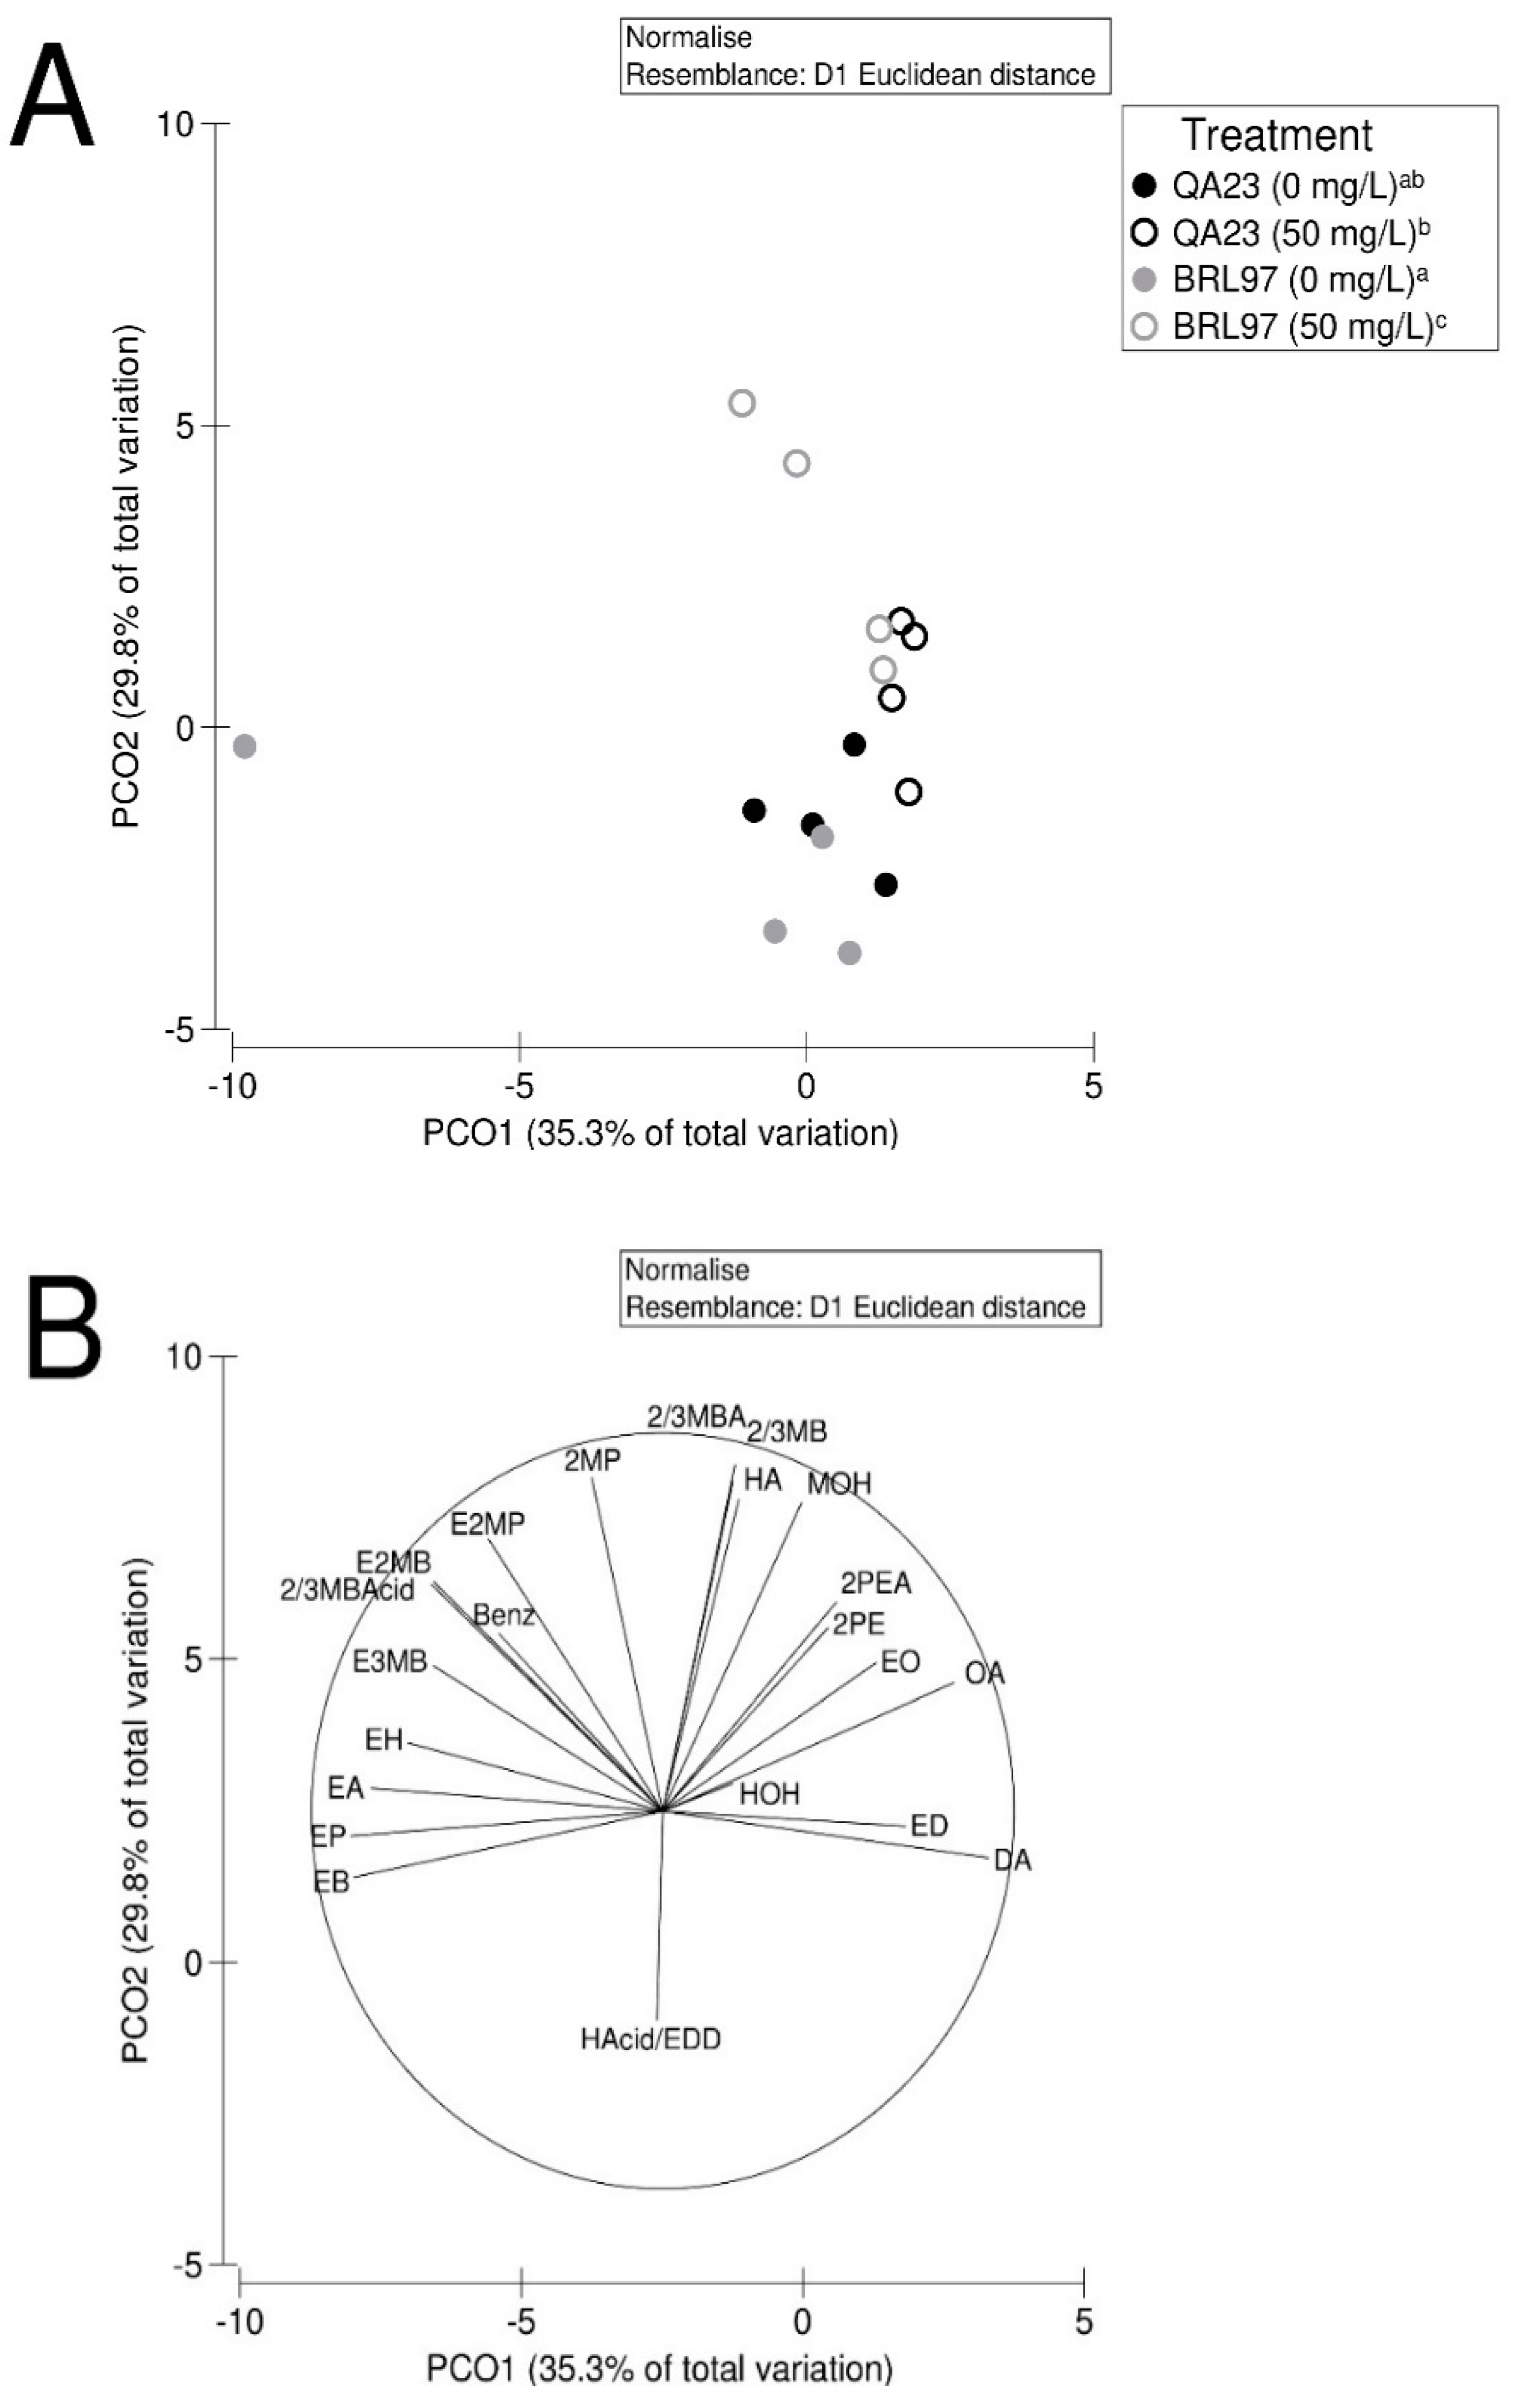
3.5. Yeast-Derived Secondary Metabolite Composition

The composition of volatile secondary metabolites was affected by both yeast strain and SO2 treatment (Table 2), and a PCoA ordination was created to visualize the spatial distribution of samples with respect to their volatile profiles (Figure 6). This PCoA showed that the separation of samples by SO2 treatment and by yeast strain was achieved with the second principal component (PCO2), representing 29.8% of total variation. When no SO2 was added, both QA23 and BRL97 produced similar volatile profiles (Figure 6A). Additionally, the overall composition of volatile secondary metabolites of the wines fermented by QA23 was not significantly altered by the addition of SO2, although the relative abundance of some specific metabolites did vary (Table 3, discussed below). However, the production of volatile compounds by BRL97 was affected by SO2 addition, and more variation was observed among replicates for the wines fermented by this strain.
Both QA23 and BRL97 increased their production of 2/3-methylbutyl acetate, hexyl acetate, 2-phenylethyl acetate, and 2-phenyl ethanol in the presence of SO2 (Table 3). BRL97 also showed an increase in the production of 2-methyl propanol, 2/3-methyl butanol, and methionol, and a decrease in the production of hexanoic acid/ethyl dodecanoate when SO2 was added. In general, the production of volatile compounds was higher in the SO2-supplemented wines, especially with regards to the wines fermented by BRL97. QA23 was less affected by SO2 addition in terms of the production of volatile compounds.
Two of the four replicate wines fermented by BRL97 in the SO2 treatment were positively correlated with the production of 2/3-methylbutyl acetate, hexyl acetate, methionol, 2-phenylethyl acetate, 2-phenylethanol, and ethyl octanoate (Figure 6). The other two replicate wines fermented by BRL97 in the SO2 treatment were found to be more similar to the wines fermented by QA23 in the presence of SO2, which were positively correlated with the production of ethyl decanoate (grape) and decanoic acid (sour/rancid/fatty), and negatively correlated with the production of ethyl acetate (fruity/solvent), ethyl hexanoate (fruity/fermented pear), and ethyl 3-methylbutanol (apple/strawberry) (Figure 6). A single replicate wine fermented by BRL97 in the control treatment was positively correlated with the production of ethyl butanoate (apple/strawberry), and negatively correlated with the production of octanoic acid (sweat/cheese) (Figure 6). In general, the wines produced from the SO2 control treatment (no SO2 added) were negatively correlated with the production of compounds such as 2-methyl propanol, ethyl 2-methylpropanoate, ethyl 2-methylbutanoate, and 2/3-methylbutanoic acid.

4. Discussion

The slower fermentation rate and growth delay of QA23 in the presence of SO2 suggested that QA23 is more sensitive to SO2 addition than BRL97. This was confirmed by a sulfite resistance assay, where BRL97 showed no decrease in colony size at any concentration of Na2SO3, but QA23 showed signs of growth inhibition beginning at 1.5 mM Na2SO3 (data not shown). Previous studies [52,53,54] have found no differences in fermentation rate in response to SO2 addition, and one study [55] found an increase in fermentation rate with added SO2. However, these studies were conducted using nonsterile grape must, because the objective was to follow changes in yeast community dynamics as a result of SO2 addition level. In the case of Constantí et al. [55] it is likely that the addition of SO2 reduced the growth and development of the non-Saccharomyces yeast community, thereby reducing competition for S. cerevisiae. Contrastingly, in the case of our study, the progression of fermentation in each flask was dependent upon the SO2 resistance of a single yeast strain. Furthermore, even though QA23 did perform AF at a slower rate when SO2 was added, it was still able to complete fermentation successfully within 12 days, and no fermentations in this study could be considered slow or sluggish.
The increased susceptibility of QA23 to SO2 was also observed in the delay in cell growth, which may also have caused the slower fermentation rate in the SO2 treatment as compared with the control. Cocolin and Mills [56] also observed an initial decrease in S. cerevisiae cell concentration in response to SO2 addition, but this initial decrease did not affect its ability to complete fermentation within a similar time frame as the fermentations conducted without SO2 addition. Previous studies, conducted with nonsterilized grape must, have found that SO2 addition can both stimulate yeast growth [57] or inhibit it [53,56], depending on the must characteristics, and also likely on the yeast strain(s) used. In accordance with our QA23 results, Andorrà et al. [54] also noticed no difference in overall yeast abundance in fermentations inoculated with QA23 and fermented with or without SO2 addition.
The observation of both strains being present at every stage of fermentation in the SO2 treatment suggests that neither of the yeast strains entered a VBNC state. Although SO2 is able to induce a VBNC response in S. cerevisiae [4], it is rare to have commercial S. cerevisiae strains exhibiting this resistance mechanism. In addition, the concentration of SO2 used in this study (50 mg/L) is commonly added to commercial fermentations and was likely much too low to induce a VBNC state in commercial S. cerevisiae strains.
The proportion of free SO2 measured on Day 1 (~60%) was larger than is regularly reported in grape must after SO2 addition [36,53,57]. This is likely because this juice was sterile filtered before the SO2 was added, so there were few grape constituents, and only one microbe (as opposed to a diversity of microorganisms), present to bind the SO2. The extended presence of free SO2 in the fermentations conducted by QA23, but not by BRL97, suggests that these strains may have different responses to SO2. It is possible that QA23 has a higher constitutive expression of FZF1 or SSU1/SSU1-R, which encode and regulate the sulfite efflux pump Ssu1p [9,13]. A higher expression of these genes could lead to more free SO2 being exported back outside the yeast cell. This response to SO2 is desirable for winemakers, because it allows the exported SO2 to act as an antimicrobial agent against other microorganisms which may cause spoilage. Studies have shown that these genes display a high degree of polymorphism, and different yeast strains have highly variable expressions of these genes [11,13]. However, it is also possible that the prolonged presence of free SO2 seen in these treatments was simply a result of decreased yeast activity during the first days of the experiment, due to increased sulfite sensitivity; QA23 did display decreased cell growth during the first few days of fermentation when SO2 was added. A detailed exploration of the transcriptome and proteome of these two strains, particularly with regards to genes and gene products involved in sulfite efflux, could help conclusively determine the reasons for the differences in sulfite response observed here.
When SO2 enters the yeast cell, it is converted to bisulfite (HSO3), which may then be incorporated into the SAAB pathway and reduced to sulfide (S2−) by the sulphite reductase enzyme, encoded by the MET5/MET10 genes [1]. This S2− may be used to produce sulfur-containing amino acids, or may be exported outside the cell as H2S. The fate of S2− in this pathway is, in part, determined by the levels of sulfur-containing amino acids already available to the yeast, as media containing higher levels of methionine have been correlated with decreased SO2 resistance in yeasts [18]. The production of H2S by yeasts is also highly strain-dependent [58], and is considered an undesirable response to SO2, because H2S has a very low detection threshold (1.1–1.6 µg/L), above which it can produce a rotten egg or cooked cabbage smell in wine [14,59]. The delay in H2S production by QA23 in response to SO2 addition is possibly due to its decreased cell density at the beginning of fermentation as a result of sulfite sensitivity, since both strains eventually produced similar total H2S over the course of fermentation. H2S production by yeasts is related to the presence of free (and molecular) SO2 in the environment, therefore, the higher relative proportion of free SO2 in these experimental fermentations likely resulted in higher than normal H2S production by these yeast strains. Furthermore, H2S is very volatile, and our methodology in this study involved determining only the total amount of H2S produced by each strain, not the final concentration of H2S in the wines at the end of the fermentation. Anecdotally, none of these wines expressed any aromas related to H2S, and it is likely that the final concentration of H2S in the wines was below its detection threshold.
Acetaldehyde has a high affinity for SO2, and can bind to SO2 outside the cell and effectively prevent its antimicrobial actions [1]. At low levels (<125 mg/L), acetaldehyde may benefit a wine’s sensory profile, but at higher concentrations it can cause the wine to smell of bruised apple and sherry [15,35,60]. Therefore, high acetaldehyde production by wine yeasts is considered undesirable. In white wine, acetaldehyde levels range from 11–493 mg/L [61]. The acetaldehyde levels measured in this current study fall in the middle of this range (100–250 mg/L), and were slightly above the sensory threshold for acetaldehyde, though likely not high enough in any treatment to result in a fault. Some previous studies have found acetaldehyde production by yeasts to increase in response to SO2 addition [62,63], and others have found increased acetaldehyde production to be a general trait of sulfite-resistant strains, even in the absence of SO2 [16,17]. Since we found BRL97 to be more resistant to SO2 than QA23, this could explain the higher constitutive production of acetaldehyde by BRL97. It is currently unclear whether the increased production of acetaldehyde is a defense mechanism used by yeasts to survive in the presence of SO2, or simply a result of the presence of SO2 causing enzymatic inhibition of the products of acetaldehyde [1].
Santos et al. [27] also found different compositions of volatile compounds between wines produced with and without SO2. In that study, the volatile composition was also analyzed via HS-SPME GC-MS, although most compounds were combined into representative groups for analysis. It is also unclear in that study which commercial S. cerevisiae strain was used for inoculation, or what concentration of SO2 was added at crush. A study conducted by Howell et al. [30] found that single-strain fermentations conducted by QA23 and ICV-D47 (genetically equivalent to BRL97) produced unique volatile profiles. In that study, the volatile profiles produced by QA23 were more variable among replicates than the profiles produced by ICV-D47, which is in contrast with our findings. However, it is unclear whether these fermentations were conducted in the presence of SO2 or not.
The production of 2/3-methylbutyl acetate, hexyl acetate, methionol, 2-phenylethyl acetate, 2-phenylethanol, and ethyl octanoate was correlated with two of the wines fermented by BRL97 in the presence of SO2. These compounds produce a range of aromas, including both desirable (fruity/banana, floral/rose, honey, herby) and undesirable (fatty, and cooked potato) aromas (Table 1), and can often be found above their sensory thresholds in wines fermented by S. cerevisiae [42,64,65,66,67,68]. The wines fermented by QA23 in the presence of SO2, as well as the other two wines fermented by BRL97 in the presence of SO2, were positively correlated with the production of ethyl decanoate (grape) and decanoic acid (sour/rancid/fatty), and negatively correlated with the production of ethyl acetate (fruity/solvent), ethyl hexanoate (fruity/fermented pear), and ethyl 3-methylbutanol (apple/strawberry). These compounds are also often found above their sensory thresholds in wine [42,64,65,66,68,69,70], and because ethyl acetate was negatively correlated with these wines, it is likely that it was found at a lower concentration, which can lend a pleasant fruity aroma to the wine.
The compounds that were negatively correlated with the SO2 control treatment wines (2-methyl propanol, ethyl 2-methylpropanoate, ethyl 2-methylbutanoate, and 2/3-methylbutanoic acid) tend to give the wine roasted nuts/solvent, fruity, apple/strawberry, and butter/cheese/sweat/rancid aromas, respectively (Table 1). The wines fermented without SO2 were therefore generally found to be negatively correlated with the production of compounds that produce undesirable aromas such as octanoic acid, 2/3-methylbutanoic acid, and 2-methyl propanol. Previous studies that have investigated the effects of SO2 addition at crush on the sensory profiles of wines have also noted that in general, wines fermented without SO2 tend to contain more fruity aromas, while wines fermented with SO2 contain higher intensities of undesirable characteristics [36,53].
Few other studies have investigated the effect of SO2 addition on the volatile profiles of wines fermented by different S. cerevisiae strains [25,26,27]. Partially in accordance with our results, Santos et al. [27] also observed differences in the composition of volatile compounds in wines produced with and without SO2, and Sun et al. [25] also noted an increase in the production of 2-phenylethanol when SO2 was added to strawberry wine fermentations. However, contrary to our results, Boroski et al. [26] noted a general decrease in the relative production of volatile compounds in response to SO2 addition in chardonnay. We hypothesize that the production of volatile secondary metabolites in response to SO2 addition is highly dependent on the composition of the juice being fermented as well as the specific yeast strains involved in the fermentation, but more research is needed to confirm this.

5. Conclusions

This study investigated the responses of two different commercial S. cerevisiae strains to the presence (50 mg/L) and absence (0 mg/L, control) of SO2 in terms of fermentation kinetics and yeast-derived volatile secondary metabolites. BRL97 was found to be more resistant to SO2 than QA23, which exhibited decreased growth and a slower fermentation rate when SO2 was added. However, both yeast strains successfully completed fermentation with or without SO2 addition, and neither yeast strain exhibited a VBNC response to the 50 mg/L SO2 added. Free SO2 levels differed between strains when 50 mg/L SO2 was added, with free SO2 remaining in the juice for a longer period of time in the fermentations conducted by QA23. The rate of H2S production also differed between the two yeast strains in response to SO2 addition, but both strains ultimately produced similar levels of H2S by the end of the fermentations. BRL97 expressed constitutively higher acetaldehyde production, potentially explaining at least part of the difference in SO2 resistance observed between the two strains. Based on these results, sulfite efflux and acetaldehyde production were the most different between the two strains, but it is likely that a combination of multiple mechanisms were involved in sulfite resistance for both strains. Research into the transcriptome and proteome of these two specific strains may help provide a clearer understanding of which mechanism(s) these strains rely on most heavily for sulfite resistance. Overall, the production of volatile compounds by both yeast strains was higher when SO2 was added, and the wines produced without SO2 were generally negatively correlated with the production of undesirable volatile compounds. QA23 produced a consistent wine regardless of whether SO2 was added, and the volatile profile of these wines were not different between SO2 treatments. Conversely, wines fermented by BRL97 were much more variable in their volatile profiles, and SO2 addition significantly affected the composition of these yeast-derived secondary metabolites.

Author Contributions

Conceptualization, S.C.M., J.J.H., V.J. and D.M.D.; formal analysis, S.C.M.; investigation, S.C.M., J.J.H. and B.J.; methodology, S.C.M., J.J.H. and B.J.; resources, V.J. and D.M.D.; supervision, V.J. and D.M.D.; visualization, S.C.M.; writing—original draft, S.C.M.; writing—review and editing, S.C.M., J.J.H., B.J., V.J. and D.M.D.

Funding

This research received no external funding.

Acknowledgments

We would like to thank the following people for technical assistance, guidance, and equipment: Paul Grbin, Nicholas Van Holst, Tommaso Watson, Joanna Sundstrom, Louise Bartle, Ee Lin Tek, Liang Chen, Chen Liang, Tom Lang, Krista Sumby, and Jennifer Gardner of the University of Adelaide, as well as Mark Rheault, Miranda Hart, and Sarah Lyons of the University of British Columbia.

Conflicts of Interest

The authors declare no conflict of interest.

Appendix A

Table A1. List of yeast-derived volatile secondary metabolites as analyzed by HS-SPME GC-MS.
MetaboliteRt (min)Quantitation Ion MassConfirmation Ion MassScan Window (min)Dwell Time (msec)
Ethyl acetate3.7843.0029.00.1240
Ethyl propanoate4.4543.0057.00.6620
Ethyl 2-methylpropanoate4.5443.0057.00.8520
Ethyl butanoate5.5131.0088.00.7225
Ethyl 2-methylbutanoate5.84102.0087.00.6820
Ethyl 3-methylbutanoate6.0488.00130.00.4830
2-methyl propanol6.5541.0043.00.8830
2-methylbutyl acetate7.0087.0072.00.6030
3-methylbutyl acetate7.1087.0072.00.8030
2-methyl butanol9.1042.0056.01.80100
3-methyl butanol9.2042.0056.02.00100
Ethyl hexanoate9.6588.0099.01.10100
Hexyl acetate10.6369.0073.01.44100
Hexanol12.5645.0056.02.7230
Ethyl octanoate14.7688.00101.02.52100
1-octanol (internal standard)17.6556.0041.04.30100
Ethyl decanoate19.68101.00157.02.36100
2-methylbutanoic acid20.2861.0073.01.26100
3-methylbutanoic acid20.2861.0073.01.26100
Methionol21.38106.0061.01.56100
2-phenylethyl acetate23.6065.00104.03.20100
Hexanoic acid24.12101.0060.01.14100
Ethyl dodecanoate24.20101.0060.01.30100
Benzyl alcohol24.8279.0051.00.7480
2-phenylethanol25.5691.0092.01.42100
Octanoic acid28.4460.0073.02.88100
Decanoic acid32.3373.00139.04.66100
Table A2. Multilocus genotypes of two commercial S. cerevisiae strains. Numbers represent the fragment lengths of allele 1 (A1) and allele 2 (A2) at eight microsatellite loci.
C11C3C4C8YOR267cYLR177wYML091cYPL009c
A1A2A1A2A1A2A1A2A1A2A1A2A1A2A1A2
QA23191216115121312312140146306312125125268317422434
BRL97194202121121244250143143280280125125302302446446
C11C3C4C8YOR267cYLR177wYML091cYPL009c
A1A2A1A2A1A2A1A2A1A2A1A2A1A2A1A2
QA23191216115121312312140146306312125125268317422434
BRL97194202121121244250143143280280125125302302446446

References

  1. Divol, B.; du Toit, M.; Duckitt, E. Surviving in the presence of sulphur dioxide: Strategies developed by wine yeasts. Appl. Microbiol. Biotechnol. 2012, 95, 601–613. [Google Scholar] [CrossRef] [PubMed]
  2. Agnolucci, M.; Rea, F.; Sbrana, C.; Cristani, C.; Fracassetti, D.; Tirelli, A.; Nuti, M. Sulphur dioxide affects culturability and volatile phenol production by Brettanomyces/Dekkera bruxellensis. Int. J. Food Microbiol. 2010, 143, 76–80. [Google Scholar] [CrossRef] [PubMed]
  3. Agnolucci, M.; Cristani, C.; Maggini, S.; Rea, F.; Cossu, A.; Tirelli, A.; Nuti, M. Impact of sulphur dioxide on the viability, culturability, and volatile phenol production of Dekkera bruxellensis in wine. Ann. Microbiol. 2013, 64, 653–659. [Google Scholar] [CrossRef]
  4. Divol, B.; Lonvaud-Funel, A. Evidence for viable but nonculturable yeasts in botrytis-affected wine. J. Appl. Microbiol. 2005, 99, 85–93. [Google Scholar] [CrossRef] [PubMed]
  5. Piškur, J.; Rozpedowska, E.; Polakova, S.; Merico, A.; Compagno, C. How did Saccharomyces evolve to become a good brewer? Trends Genet. 2006, 22, 183–186. [Google Scholar] [CrossRef] [PubMed]
  6. Salma, M.; Rousseaux, S.; Sequeira-Le Grand, A.; Divol, B.; Alexandre, H. Characterization of the Viable but Nonculturable (VBNC) State in Saccharomyces cerevisiae. PLoS ONE 2013, 8, e77600. [Google Scholar] [CrossRef] [PubMed]
  7. King, A.D.; Ponting, J.D.; Sanshuck, D.W.; Jackson, R.; Mihara, K. Factors affecting death of yeast by sulfur dioxide. J. Food Prot. 1981, 44, 92–97. [Google Scholar] [CrossRef] [PubMed]
  8. Howe, P.A.; Worobo, R.; Sacks, G.L. Conventional measurements of sulfur dioxide (SO2) in red wine overestimate SO2 antimicrobial activity. Am. J. Enol. Vitic. 2018, 1. [Google Scholar] [CrossRef]
  9. Park, H.; Bakalinsky, A.T. SSU1 mediates sulphite efflux in Saccharomyces cerevisiae. Yeast 2000, 16, 881–888. [Google Scholar] [CrossRef]
  10. Avram, D.; Leid, M.; Bakalinsky, A.T. Fzf1p of Saccharomyces cerevisiae is a positive regulator of SSU1 transcription and its first zinc finger region is required for DNA binding. Yeast 1999, 15, 473–480. [Google Scholar] [CrossRef]
  11. Nardi, T.; Corich, V.; Giacomini, A.; Blondin, B. A sulphite-inducible form of the sulphite efflux gene SSU1 in a Saccharomyces cerevisiae wine yeast. Microbiology 2010, 156, 1686–1696. [Google Scholar] [CrossRef] [PubMed]
  12. Aa, E.; Townsend, J.P.; Adams, R.I.; Nielsen, K.M.; Taylor, J.W. Population structure and gene evolution in Saccharomyces cerevisiae. FEMS Yeast Res. Rev. 2006, 6, 702–715. [Google Scholar] [CrossRef] [PubMed]
  13. Goto-Yamamoto, N.; Kitano, K.; Shiki, K.; Yoshida, Y.; Suzuki, T.; Iwata, T.; Yamane, Y.; Hara, S. SSU1-R, a sulfite resistance gene of wine yeast, is an allele of SSU1 with a different upstream sequence. J. Ferment. Bioeng. 1998, 86, 427–433. [Google Scholar] [CrossRef]
  14. Siebert, T.E.; Bramley, B.; Solomon, M. Hydrogen sulfide: Aroma detection threshold study in white and red wines. AWRI Tech. Rev. 2009, 183, 14–16. [Google Scholar]
  15. Swiegers, J.H.; Bartowsky, E.J.; Henschke, P.A.; Pretorius, I.S. Yeast and bacterial modulation of wine aroma and flavour. Aust. J. Grape Wine Res. 2005, 11, 139–173. [Google Scholar] [CrossRef]
  16. Casalone, E.; Colella, C.M.; Daly, S.; Gallori, E.; Moriani, L.; Polsinelli, M. Mechanism of resistance to sulphite in Saccharomyces cerevisiae. Curr. Genet. 1992, 22, 435–440. [Google Scholar] [CrossRef] [PubMed]
  17. Stratford, M.; Morgan, P.; Rose, A.H. Sulphur dioxide resistance in Saccharomyces cerevisiae and Saccharomycodes ludwigii. J. Gen. Microbiol. 1987, 133, 2173–2179. [Google Scholar] [CrossRef]
  18. Aranda, A.; Jiménez-Martí, E.; Orozco, H.; Matallana, E.; Del Olmo, M. Sulfur and adenine metabolisms are linked, and both modulate sulfite resistance in wine yeast. J. Agric. Food Chem. 2006, 54, 5839–5846. [Google Scholar] [CrossRef]
  19. Park, H.; Hwang, Y.-S. Genome-wide transcriptional responses to sulfite in Saccharomyces cerevisiae. J. Microbiol. 2008, 46, 542–548. [Google Scholar] [CrossRef]
  20. Nadai, C.; Treu, L.; Campanaro, S.; Giacomini, A.; Corich, V. Different mechanisms of resistance modulate sulfite tolerance in wine yeasts. Appl. Microbiol. Biotechnol. 2016, 100, 797–813. [Google Scholar] [CrossRef]
  21. Hoppe, A. What mRNA abundances can tell us about metabolism. Metabolites 2012, 2, 614–631. [Google Scholar] [CrossRef] [PubMed]
  22. de Sousa Abreu, R.; Penalva, L.O.; Marcotte, E.M.; Vogel, C. Global signatures of protein and mRNA expression levels. Mol. Biosyst. 2009, 5, 1512–1526. [Google Scholar] [CrossRef] [PubMed] [Green Version]
  23. Vogel, C.; Marcotte, E.M. Insights into the regulation of protein abundance from proteomic and transcriptomic analyses. Nat. Rev. Genet. 2012, 13, 227–232. [Google Scholar] [CrossRef] [PubMed]
  24. Schrimpf, S.P.; Weiss, M.; Reiter, L.; Ahrens, C.H.; Jovanovic, M.; Malmström, J.; Brunner, E.; Mohanty, S.; Lercher, M.J.; Hunziker, P.E.; et al. Comparative functional analysis of the Caenorhabditis elegans and Drosophila melanogaster proteomes. PLoS Biol. 2009, 7, e1000048. [Google Scholar] [CrossRef] [PubMed]
  25. Sun, Y.; Zhang, T.; Lü, H.; Yu, Z.; Li, X. Effect of added sulphur dioxide levels on the fermentation characteristics of strawberry wine. J. Inst. Brew. 2016, 122, 446–451. [Google Scholar] [CrossRef] [Green Version]
  26. Boroski, M.; Crupi, P.; Tamborra, P.; Antonacci, D.; Toci, A.T. Influence of winemaking techniques with low sulphur dioxide on wine varieties Chardonnay, Pinot and Montepulciano. J. Food Nutr. Res. 2017, 56, 326–334. [Google Scholar]
  27. Santos, M.C.; Nunes, C.; Rocha, M.A.M.; Rodrigues, A.; Rocha, S.M.; Saraiva, J.A.; Coimbra, M.A. High pressure treatments accelerate changes in volatile composition of sulphur dioxide-free wine during bottle storage. Food Chem. 2015, 188, 406–414. [Google Scholar] [CrossRef] [PubMed]
  28. Borneman, A.R.; Forgan, A.H.; Kolouchova, R.; Fraser, J.A.; Schmidt, S.A. Whole genome comparison reveals high levels of inbreeding and strain redundancy across the spectrum of commercial wine strains of Saccharomyces cerevisiae. G3 Genes Genomes Genet. 2016, 6, 957–971. [Google Scholar] [CrossRef] [PubMed]
  29. Morgan, S.C.; Scholl, C.M.; Benson, N.L.; Stone, M.L.; Durall, D.M. Sulfur dioxide addition at crush alters Saccharomyces cerevisiae strain composition in spontaneous fermentations at two Canadian wineries. Int. J. Food Microbiol. 2017, 244, 96–102. [Google Scholar] [CrossRef]
  30. Howell, K.S.; Cozzolino, D.; Bartowsky, E.J.; Fleet, G.H.; Henschke, P.A. Metabolic profiling as a tool for revealing Saccharomyces interactions during wine fermentation. FEMS Yeast Res. 2006, 6, 91–101. [Google Scholar] [CrossRef]
  31. Peter, J.J.; Watson, T.L.; Walker, M.E.; Gardner, J.M.; Lang, T.A.; Borneman, A.; Forgan, A.; Tran, T.; Jiranek, V. Use of a wine yeast deletion collection reveals genes that influence fermentation performance under low-nitrogen conditions. FEMS Yeast Res. 2018, 18, foy009. [Google Scholar] [CrossRef] [PubMed]
  32. Valentine, G.D.S.; Walker, M.E.; Gardner, J.M.; Schmid, F.; Jiranek, V. Brief temperature extremes during wine fermentation: Effect on yeast viability and fermentation progress. Aust. J. Grape Wine Res. 2019, 25, 62–69. [Google Scholar] [CrossRef]
  33. Tondini, F.; Lang, T.; Chen, L.; Herderich, M.; Jiranek, V. Linking gene expression and oenological traits: Comparison between Torulaspora delbrueckii and Saccharomyces cerevisiae strains. Int. J. Food Microbiol. 2019, 294, 42–49. [Google Scholar] [CrossRef] [PubMed]
  34. Long, D.; Wilkinson, K.; Taylor, D.; Jiranek, V. Novel wine yeast for improved utilisation of proline during fermentation. Fermentation 2018, 4, 1–16. [Google Scholar] [CrossRef]
  35. Zoecklein, B.W.; Fugelsang, K.C.; Gump, B.H.; Nury, F.S. Wine Analysis and Production; Chapman & Hall: New York, NY, USA, 1995. [Google Scholar]
  36. Morgan, S.C.; Tantikachornkiat, M.; Scholl, C.M.; Benson, N.L.; Cliff, M.A.; Durall, D.M. The effect of sulfur dioxide addition at crush on the fungal and bacterial communities and the sensory attributes of Pinot gris wines. Int. J. Food Microbiol. 2019, 290, 1–14. [Google Scholar] [CrossRef]
  37. Park, H.; Lopez, N.I.; Bakalinsky, A.T. Use of sulfite resistance in Saccharomyces cerevisiae as a dominant selectable marker. Curr. Genet. 1999, 36, 339–344. [Google Scholar] [CrossRef] [PubMed]
  38. Haggerty, J.; Bowyer, P.K.; Jiranek, V.; Taylor, D.K. Comparative study on the sensitivity of solid-phase microextraction fibre coatings for the analysis of fermentation bouquet compounds. Aust. J. Grape Wine Res. 2014, 20, 378–385. [Google Scholar] [CrossRef]
  39. Francis, I.L.; Newton, J.L. Determining wine aroma from compositional data. Aust. J. Grape Wine Res. 2005, 11, 114–126. [Google Scholar] [CrossRef]
  40. Guth, H. Quantitation and sensory studies of character impact odorants of different white wine varieties. J. Agric. Food Chem. 1997, 45, 3027–3032. [Google Scholar] [CrossRef]
  41. Peinado, R.A.; Mauricio, J.C.; Moreno, J. Aromatic series in sherry wines with gluconic acid subjected to different biological aging conditions by Saccharomyces cerevisiae var. capensis. Food Chem. 2006, 94, 232–239. [Google Scholar] [CrossRef]
  42. Peinado, R.A.; Moreno, J.; Medina, M.; Mauricio, J.C. Changes in volatile compounds and aromatic series in sherry wine with high gluconic acid levels subjected to aging by submerged flor yeast cultures. Biotechnol. Lett. 2004, 26, 757–762. [Google Scholar] [CrossRef] [PubMed]
  43. Salo, P. Determining the odor thresholds for some compounds in alcoholic beverages. J. Food Sci. 1970, 35, 95–99. [Google Scholar] [CrossRef]
  44. Siebert, T.E.; Smyth, H.E.; Capone, D.L.; Neuwöhner, C.; Pardon, K.H.; Skouroumounis, G.K.; Herderich, M.J.; Sefton, M.A.; Pollnitz, A.P. Stable isotope dilution analysis of wine fermentation products by HS-SPME-GC-MS. Anal. Bioanal. Chem. 2005, 381, 937–947. [Google Scholar] [CrossRef] [PubMed]
  45. Haggerty, J.J.; Taylor, D.K.; Jiranek, V. Monitoring volatile aroma compounds during fermentation in a chemically defined grape juice medium deficient in Leucine. Am. J. Enol. Vitic. 2016, 67, 350–355. [Google Scholar] [CrossRef]
  46. Sun, J.; Li, Q.; Luo, S.; Zhang, J.; Huang, M.; Chen, F.; Zheng, F.; Ab, X.S.; Li, H. Characterization of key aroma compounds in Meilanchun sesame flavor style baijiu by application of aroma extract dilution analysis, quantitative measurements, aroma recombination, and omission/addition experiments. RSC Adv. 2018, 8, 23757. [Google Scholar] [CrossRef]
  47. Ferreira, V.; López, R.; Cacho, J.F. Quantitative determination of the odorants of young red wines from different grape varieties. J. Sci. Food Agric. 2000, 80, 1659–1667. [Google Scholar] [CrossRef]
  48. Legras, J.L.; Ruh, O.; Merdinoglu, D.; Karst, F. Selection of hypervariable microsatellite loci for the characterization of Saccharomyces cerevisiae strains. Int. J. Food Microbiol. 2005, 102, 73–83. [Google Scholar] [CrossRef] [PubMed]
  49. Richards, K.D.; Goddard, M.R.; Gardner, R.C. A database of microsatellite genotypes for Saccharomyces cerevisiae. Antonie van Leeuwenhoek Int. J. Gen. Mol. Microbiol. 2009, 96, 355–359. [Google Scholar] [CrossRef] [PubMed]
  50. Scholl, C.M.; Morgan, S.C.; Stone, M.L.; Tantikachornkiat, M.; Neuner, M.; Durall, D.M. Composition of Saccharomyces cerevisiae strains in spontaneous fermentations of Pinot Noir and Chardonnay. Aust. J. Grape Wine Res. 2016, 22, 384–390. [Google Scholar] [CrossRef]
  51. Clarke, K.; Gorley, R. PRIMER v6: User Manual/Tutorial 2006; Plymouth Marine Laboratory: Plymouth, UK, 2006. [Google Scholar]
  52. Bokulich, N.A.; Swadener, M.; Sakamoto, K.; Mills, D.A.; Bisson, L.F. Sulfur dioxide treatment alters wine microbial diversity and fermentation progression in a dose-dependent fashion. Am. J. Enol. Vitic. 2014, 66, 1–21. [Google Scholar] [CrossRef]
  53. Henick-Kling, T.; Edinger, W.; Daniel, P.; Monk, P. Selective effects of sulfur dioxide and yeast starter culture addition on indigenous yeast populations and sensory characteristics of wine. J. Appl. Microbiol. 1998, 84, 865–876. [Google Scholar] [CrossRef]
  54. Andorrà, I.; Landi, S.; Mas, A.; Guillamón, J.M.; Esteve-Zarzoso, B. Effect of oenological practices on microbial populations using culture-independent techniques. Food Microbiol. 2008, 25, 849–856. [Google Scholar] [CrossRef] [PubMed]
  55. Constantí, M.; Reguant, C.; Poblet, M.; Zamora, F.; Mas, A.; Guillamon, J.M. Molecular analysis of yeast population dynamics: Effect of sulphur dioxide and inoculum on must fermentation. Int. J. Food Microbiol. 1998, 41, 169–175. [Google Scholar] [CrossRef]
  56. Cocolin, L.; Mills, D.A. Wine yeast inhibition by sulfur dioxide: A comparison of culture-dependent and independent methods. Am. J. Enol. Vitic. 2003, 54, 125–130. [Google Scholar]
  57. Pateraki, C.; Paramithiotis, S.; Doulgeraki, A.I.; Kallithraka, S.; Kotseridis, Y.; Drosinos, E.H. Effect of sulfur dioxide addition in wild yeast population dynamics and polyphenolic composition during spontaneous red wine fermentation from Vitis vinifera cultivar Agiorgitiko. Eur. Food Res. Technol. 2014, 239, 1067–1075. [Google Scholar] [CrossRef]
  58. Linderholm, A.L.; Findleton, C.L.; Kumar, G.; Hong, Y.; Bisson, L.F. Identification of genes affecting hydrogen sulfide formation in Saccharomyces cerevisiae. Appl. Environ. Microbiol. 2008, 74, 1418–1427. [Google Scholar] [CrossRef] [PubMed]
  59. Smith, M.E.; Bekker, M.Z.; Smith, P.A.; Wilkes, E.N. Sources of volatile sulfur compounds in wine. Aust. J. Grape Wine Res. 2015, 21, 705–712. [Google Scholar] [CrossRef]
  60. Bartowsky, E.J.; Pretorius, I.S. Microbial Formation and Modification of Flavor and Off-Flavor Compounds in Wine. In Biology of Microorganisms on Grapes, in Must and in Wine; Springer: Berlin/Heidelberg, Germany, 2009; pp. 209–231. [Google Scholar]
  61. Liu, S.-Q.; Pilone, G.J. An overview of formation and roles of acetaldehyde in winemaking with emphasis on microbiological implications. Int. J. Food Sci. Technol. 2000, 35, 49–61. [Google Scholar] [CrossRef]
  62. Weeks, C. Production of sulfur dioxide-binding compounds and of sulfur dioxide by two Saccharomyces yeasts. Am. J. Enol. Vitic. 1969, 32–39. [Google Scholar]
  63. Divol, B.; Miot-Sertier, C.; Lonvaud-Funel, A. Genetic characterization of strains of Saccharomyces cerevisiae responsible for “refermentation” in Botrytis-affected wines. J. Appl. Microbiol. 2006, 100, 516–526. [Google Scholar] [CrossRef]
  64. Capece, A.; Siesto, G.; Romaniello, R.; Lagreca, V.M.; Pietrafesa, R.; Calabretti, A.; Romano, P. Assessment of competition in wine fermentation among wild Saccharomyces cerevisiae strains isolated from Sangiovese grapes in Tuscany region. LWT - Food Sci. Technol. 2013, 54, 485–492. [Google Scholar] [CrossRef]
  65. Mateo, J.J.; Jiménez, M.; Pastor, A.; Huerta, T. Yeast starter cultures affecting wine fermentation and volatiles. Food Res. Int. 2001, 34, 307–314. [Google Scholar] [CrossRef]
  66. Nicolini, G.; Moser, S.; Román, T.; Mazzi, E.; Larcher, R. Effect of juice turbidity on fermentative volatile compounds in white wines. Vitis - J. Grapevine Res. 2011, 50, 131–135. [Google Scholar]
  67. Herraiz, T.; Reglero, G.; Herraiz, M.; Martin-Alvarez, P.J.; Cabezudo, M.D. The influence of the yeast and type of culture on the volatile composition of wines fermented without sulfur dioxide. Am. J. Enol. Vitic. 1990, 41, 313–318. [Google Scholar]
  68. Saberi, S.; Cliff, M.A.; van Vuuren, H.J.J. Impact of mixed S. cerevisiae strains on the production of volatiles and estimated sensory profiles of Chardonnay wines. Food Res. Int. 2012, 48, 725–735. [Google Scholar] [CrossRef]
  69. Garcia, A.; Carcel, C.; Dulau, L.; Samson, A.; Aguera, E.; Agosin, E.; Günata, Z. Influence of a mixed culture with Debaryomyces vanriji and Saccharomyces cerevisiae on the volatiles of a Muscat wine. J. Food Sci. 2002, 67, 1138–1143. [Google Scholar] [CrossRef]
  70. Ubeda Iranzo, J.F.; González Magaña, F.; González Viñas, M.A. Evaluation of the formation of volatiles and sensory characteristics in the industrial production of white wines using different commercial strains of the genus Saccharomyces. Food Control 2000, 11, 143–147. [Google Scholar] [CrossRef]
Figure 1. Daily residual sugar levels (g/L ± SEM) of controlled fermentations conducted by different yeast strains (n = 4 per treatment). Fermentations were conducted in the presence of either (A) 0 mg/L SO2 or (B) 50 mg/L SO2. Treatments with different superscript letters indicate significantly different fermentation progressions (2-factor repeated measures ANOVA, α = 0.05).
Fermentation 05 00069 g001
Figure 2. Total yeast abundance (CFU/mL ± SEM) during controlled fermentations conducted by different yeast strains (n = 4 per treatment). Fermentations were conducted in the presence of either (A) 0 mg/L SO2 or (B) 50 mg/L SO2. Treatments with different superscript letters indicate significantly different yeast abundance dynamics throughout fermentation (2-factor repeated measures ANOVA, α = 0.05).
Fermentation 05 00069 g002
Figure 3. SO2 levels (mg/L) throughout fermentations conducted by different yeast strains and in the presence of different levels of initial SO2. Wine samples from each of the four replicates were combined for SO2 analysis due to volume constraints. Plots represent (A) total SO2 produced by yeasts throughout fermentations containing 0 mg/L SO2; (B) total SO2 levels throughout fermentations containing 50 mg/L SO2; (C) free SO2 levels throughout fermentations containing 50 mg/L SO2.
Fermentation 05 00069 g003
Figure 4. Cumulative H2S production (ppm ± SEM) by different yeast strains when fermented in the presence of 50 mg/L SO2. Treatments with different superscript letters indicate significant differences in overall H2S production dynamics (2-factor repeated measures ANOVA, α = 0.05).
Fermentation 05 00069 g004
Figure 5. Acetaldehyde production (g/L ± SEM) by different yeast strains when fermented in the presence of 0 or 50 mg/L SO2. Different letters written above each treatment indicate significant differences in acetaldehyde concentration (2-factor ANOVA, α = 0.05).
Fermentation 05 00069 g005
Figure 6. Principal coordinate analysis (PCoA) visualizing the production of volatile secondary metabolites by different yeast strains in controlled pinot gris fermentations containing either 0 mg/L or 50 mg/L SO2 (n = 4 per treatment). Plots depict (A) the individual factors map and (B) the variable factors map showing secondary metabolites as vectors. On the individual factors map, each point represents the entire volatile secondary metabolite composition of a single wine sample. Points that are closer together contain more similar volatile profiles than points that are further apart. On the variable factors map, the length of the variable vector reflects that variable’s relative contribution in producing this ordination. Variable vectors that point towards a sample are positively correlated with that sample, and those that point away from a sample are negatively correlated. Variable vectors that appear at a ~90° angle are not correlated with each other, while those that appear at <0° and >90° angles are positively and negatively correlated with each other, respectively.
Fermentation 05 00069 g006
Table 1. List of yeast-derived secondary metabolites measured, as well as their characteristic aromas and odour detection thresholds in 10% (v/v) ethanol ([39,40,41,42,43,44], compiled by [45]).
CategoryMetaboliteAbbreviationAromaThreshold (µg/L)
Ethyl estersEthyl acetateEAfruity, solvent a,b7500
Ethyl propanoateEPfruity, solvent a,b1800
Ethyl 2-methylpropanoateE2MPFruity a15
Ethyl butanoateEBapple, strawberry a20
Ethyl 2-methylbutanoateE2MBapple, strawberry a1–18
Ethyl 3-methylbutanoateE3MBapple, strawberry a3
Ethyl hexanoateEHfruity, fermented pear a5–14
Ethyl octanoateEOfruity, fatty b2
Ethyl decanoateEDGrape b200
Ethyl dodecanoate 1EDDsoapy, estery b25,619 *
Acetates2-methylbutyl acetate 22MBAFruity b160
3-methylbutyl acetate 23MBABanana b30
Hexyl acetateHAfruity, herby b670
2-phenylethyl acetate2PEArose, honey b250
Acids2-methylbutanoic acid 32MBAcidbutter, cheese b1500
3-methylbutanoic acid 33MBAcidsweat, rancid b33.4
Hexanoic acid 1HAcidsour, vinegar-like a420
Octanoic acidOAsweat, cheese a,b500
Decanoic acidDASour a, rancid/fatty b1000–8100
Alcohols2-methyl propanol2MProasted nuts a, solvent b40,000
2-methyl butanol 42MBOnion b65,000
3-methyl butanol 43MBroasted nutsa, whisky b30,000
HexanolHOHgreen, floral a,b8000
2-phenylethanol2PEhoney, spice, floral b10,000–14,000
Benzyl alcoholBenzsweet, floral b900,000
MethionolMOHcooked potato a1000
1 EDD and HAcid had overlapping retention times. 2 2MBA and 3MBA had overlapping retention times. 3 2MBAcid and 3MBAcid had overlapping retention times. 4 2MB and 3MB had overlapping retention times. a Aroma descriptors sourced from [46]. b Aroma descriptors sourced from [47]. * Aroma threshold for EDD was determined in 43% (v/v) ethanol [46].
Table 2. Results of a two-factor PERMANOVA evaluating the effects of yeast strain and SO2 addition on the volatile secondary metabolite profiles of pinot gris wines. Results with an asterisk (*) are significant at α = 0.05.
SourcedfSSMSPseudo-Fp
Yeast strain (Y)179.96379.9635.32150.002 *
Sulfite addition (S)143.75543.7552.91190.009 *
Y × S125.96525.9651.72790.13
Residual12180.3215.026
Total15330
Table 3. Relative quantity (± SEM) of volatile compounds in wines fermented by different commercial yeast strains and in the presence of different sulfite levels (n = 4 per treatment). Compounds with an asterisk (*) indicate significant results from a two-factor ANOVA, and different superscript letters for each significant compound, written beside the relative quantity values for each treatment, indicate significant differences among treatments (α = 0.05). Each compound/compound group was analyzed separately.
Compound(s)QA23 (0 mg/L SO2)QA23 (50 mg/L SO2)BRL97 (0 mg/L SO2)BRL97 (50 mg/L SO2)
EA4.10 ± 0.134.21 ± 0.1564.64 ± 0.413.96 ± 0.20
EP0.206 ± 0.0120.19 ± 0.0070.25 ± 0.070.150 ± 0.016
E2MP *0.081 ± 0.005 a0.08 ± 0.003 a0.103 ± 0.013 ab0.131 ± 0.011 b
EB0.334 ± 0.0080.316 ± 0.0180.421 ± 0.100.272 ± 0.003
E2MB0.026 ± 0.00270.022 ± 0.0010.027 ± 0.0040.033 ± 0.004
E3MB0.025 ± 0.0050.022 ± 0.0030.0345 ± 0.0060.033 ± 0.006
2MP *1.02 ± 0.066 a1.07 ± 0.027 ab0.928 ± 0.11 a1.35 ± 0.074 b
2/3MBA *0.730 ± 0.020 a1.04 ± 0.031 b0.738 ± 0.041 a1.21 ± 0.042 c
2/3MB *54.2 ± 1.7 ab55.7 ± 1.9 ab47.8 ± 1.4 a58.5 ± 3.1 b
EH11.1 ± 0.4113.1 ± 0.8213.2 ± 2.610.2 ± 1.3
HA *0.322 ± 0.020 a0.57 ± 0.046 b0.386 ± 0.020 a0.581 ± 0.039 b
HOH3.57 ± 0.113.37 ± 0.053.45 ± 0.133.47 ± 0.11
EO38.8 ± 3.045.0 ± 4.236.4 ± 4.240.0 ± 2.3
ED11.7 ± 1.610.8 ± 1.29.61 ± 3.010.1 ± 0.90
2/3MBAcid *0.213 ± 0.010 ab0.196 ± 0.006 a0.236 ± 0.025 ab0.277 ± 0.014 b
MOH *0.066 ± 0.009 a0.078 ± 0.009 a0.0480 ± 0.0074 a0.122 ± 0.0076 b
2PEA *1.28 ± 0.038 b1.65 ± 0.061 c0.843 ± 0.018 a1.35 ± 0.012 b
HAcid/EDD *2.44 ± 0.18 ab2.06 ± 0.13 ab2.66 ± 0.31 b1.71 ± 0.095 a
Benz0.016 ± 0.0010.016 ± 0.0010.015 ± 0.0010.016 ± 0.0007
2PE *35.1 ± 1.4 b41.84 ± 1.8 c22.3 ± 0.70 a32.2 ± 1.5 b
OA *4.85 ± 0.16 ab5.64 ± 0.063 b4.77 ± 0.33 a5.46 ± 0.10 ab
DA5.51 ± 0.195.71 ± 0.294.41 ± 1.14.84 ± 0.074

