Abstract
In this contribution, the effect of the presence of a presumed inert gas like in the feed gas on the biological methanation of hydrogen and carbon dioxide with Methanothermobacter marburgensis was investigated. can be found as a component besides in possible feed gases like mine gas, weak gas, or steel mill gas. To determine whether there is an effect on the biological methanation of and from renewable sources or not, the process was investigated using feed gases containing , , and in different ratios, depending on the content. A possible effect can be a lowered conversion rate of and to . Feed gases containing up to 47% were investigated. The conversion of hydrogen and carbon dioxide was possible with a conversion rate of up to 91% but was limited by the amount of when feeding a stoichiometric ratio of 4:1 and not by adding to the feed gas.
1. Introduction
Today’s demand for energy all over the world makes it necessary to reduce the use of fossil energy sources to a minimum. Therefore, renewable sources must be used to develop a sustainable energy management that does not end in overexploitation of natural resources and global warming. But the volatility of renewable energies is still a big problem when switching from conventional power plants to photovoltaics and wind power plants without having a system for distributing this energy to those places where it is needed. Since the Kyoto Protocol was adopted in 1997, which extends the United Nations Framework Convention on Climate Change (UNFCCC) from 1992, politics has officially cared about the emission of carbon dioxide (). To reduce the emissions of , it is necessary to recycle emissions that are not avoidable. This approach of recycling also increases the overall efficiency of a process where is an unused product and reduces its carbon footprint. Biological methanation is a technology that combines these aspects and converts hydrogen from electrolysis (power-to-gas), operating with power from renewable energies and carbon dioxide, possibly from biogenic sources, and methanogenic microorganisms. It is a contribution to the solution of storing power that is not needed at the time of its generation, the smoothing of current peaks in the power grid, and reducing emissions. Due to the lack of an adequate hydrogen () infrastructure in many countries like Germany, a further step of converting the hydrogen to methane is undertaken. Methanogenic archaea use substrates like acetate, methanol, carbon monoxide, or carbon dioxide as sources for carbon assimilation [1]. In the case of carbon dioxide, some of those methanogenic organisms use hydrogen to convert adenosine diphosphate (ADP) to adenosine triphosphate (ATP) and reduce carbon dioxide to methane () [2]. Those organisms are part of microbic consortia in, e.g., biogas plants, where they convert intermediates to methane in a last step—methanogenesis. Methanothermobacter marburgensis is such a hydrogenotrophic organism and was first isolated from an anaerobic sewage digester [3]. Equation (1) shows the chemical reaction of methanation.
Since the price of emission certificates (European Union Allowance EUA) is increasing (see Figure 1), there will be a competition for purchasing, using, and recycling . This will lead to an increasing price for . Therefore, other sources of carbon-dioxide-containing gases have to be determined. These gases are of interest for biological methanation. While biogases consist mostly of methane and carbon dioxide (fractions ) [4,5], there are other gases, like weak gas from pressure swing adsorption (PSA) or water washing (WW), or mine gases with a high content, that are also possible carbon dioxide sources for the process of methanation (see Table 1) [6,7,8,9]. Steel mill gas, for example, consists of around 44% , 23% , 21% , 10% , and 2% [10]. To use this gas as a source for methanation would mean to access a large potential, and the steel industry has a major interest in improving efficiency. Only for Germany, it could mean a potential of of carbon dioxide emissions [11]. This is about 10% of the emissions of German industrial processes and the manufacturing industry.
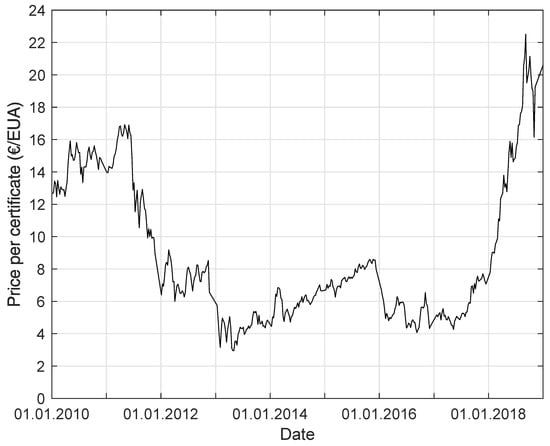
Figure 1.
Price per certificate (European Union Allowance) for the allowance to emit the greenhouse gas equivalent of 1 from 1 January 2010 to 31 March 2019 [18].

Table 1.
Composition of possible feed gases for methanation [5,9,12].
This work investigated the effects of a content greater than 10% on the conversion rate and other process parameters. Therefore, / mixtures in different proportions were used as feed gases instead of pure carbon dioxide. For comparison, the experiments were also performed with pure . The following two observations might be possible. While in catalytic methanation is formed from up to 600 due to the process conditions [13], in biological methanation can be used enzymatically for nitrogen fixation (diazotrophy) by some archaea [14,15]. It was reported that M. marburgensis can grow diazotrophic [16]. This may cause a difference in the formation of methane due to a change in metabolism because the reactions for reducing to are anabolic [14]. According to Equation (1), there is no reaction of in the catabolic methanogenesis of [17]. Furthermore, when using a biological multiphase system, methane formation is limited by the molecular transport of and from the gas phase into the liquid phase. Adding may result in a lower conversion rate.
2. Materials and Methods
2.1. Instrumentation
For methanation, a fermenter with a total volume of was used. A stirrer with three Rushton turbines () from Präzisions-Rührer Gesellschaft mbH (Warburg, Germany) was able to perform an agitation at −1. Gases were fed with thermal mass flow controllers EL-FLOW select (Bronkhorst Deutschland Nord GmbH, Kamen, Germany) from compressed gas bottles into the fermenter via two ring gas spargers on the bottom. Temperature and pressure were both set constant at and with a pressure control valve EL-PRESS (Bronkhorst Deutschland Nord GmbH, Kamen, Germany). , , and were measured in the off-gas with BCP gas sensors via infrared (IR) (carbon dioxide and methane) and thermal conductivity (hydrogen) (BlueSens gas sensor GmbH, Herten, Germany). The pH value was measured with a CPS11D (Endress+Hauser Messtechnik GmbH & Co. KG, Weil am Rhein, Germany) and regulated with ( mol L) and ( mol L). Redox potential (ORP) was measured with an EasyFerm Plus ORP Arc 120 (Hamilton Bonaduz AG, Bonaduz, Switzerland).
2.2. Nutrition Media, Microorganism, and Gases
At first, the reactor was filled with 25 nutrition solution consisting of , , , , , , , , , 10 mineral solution [ nitrilotriacetic acid, 3 , , 1 , , , , , , , , , , , , ad. 1000 distilled water], 10 vitamin solution [2 biotin, 2 folic acid, 10 pyridoxine-HCl, 5 thiamine-HCl, 5 riboflavin, 5 nicotinic acid, 5 D-Ca-panthothenate, vitamin B12, 5 aminobenzoic acid, 5 -lipoic acid, ad. 1000 distilled water] and filled up with distilled water. The reactor was flushed with for 180 to obtain an anaerobic atmosphere. A total of 20 of ( mol L) was added to reduce the remaining , and 20 cell suspension of Methanothermobacter marburgensis (DSM-2133, Deutsche Sammlung von Mikroorganismen und Zellkulturen GmbH, Braunschweig, Germany) were added to the reactor. Then was added until a ratio of : 4:1 was reached. had a nominal purity of (Linde AG, München, Germany), and (later referred to as C100) had a nominal purity of % (Westfalen AG, Münster, Germany). To get a sufficient cell concentration of M. marburgensis, the organisms were cultured for d. The doubling time of M. marburgensis, according to the literature, is h [19,20]. In this work, a doubling time of about h was observed. Experiments were performed with different -containing premixed feed gases. / mix gases BIOGON© C20 ( ()%, rest ), C30 ( ()%, rest N2), and C40 ( ()%, rest ) were obtained in pressure gas bottles from Linde AG. The resulting composition of the feed gases containing the / mix and is shown in Table 2. In addition, an anaerobe solution of ( mol L) was added periodically to the reactor to maintain the supply of sulfur for the growth of M. marburgensis [21].
Table 2.
Composition of mixed gases and volumetric amounts of , , and in the feed gas.
2.3. Calculations
For the following calculations, it was assumed that . For the calculation of the feed gas compositions shown in Table 2, Equations (2)–(4) were used.
The carbon dioxide/hydrogen ratio was chosen to be 1 to 4 according to Equation (1), resulting in Equation (3).
The dinitrogen content depended on the composition of the mixed gas. Thus, it follows Equation (4).
To compare the experiments, it is possible to consider the ratio of outgoing methane flow and carbon dioxide feed flow. This relationship is called the conversion rate in the following descriptions. The conversion rate of to was calculated via Equation (5) and can also be applied to the conversion rate in a // gas system without . It describes the degree of conversion from to .
3. Results
The obtained parameters, pH, oxidation reduction potential (ORP), temperature, and pressure, which were observed and are not presented in this section, did not differ from a normal methanation process using just carbon dioxide and hydrogen as feed gases. All experiments were performed 4 to 6 times with the same results. For each experiment, a typical result was considered. Figure 2 shows the off-gas concentrations of , , , and in such a typical experiment for each gas mixture. The axes are scaled identically in all subfigures. There was no change of values after in any of them, so here just a duration of 8 is presented. Sensor data for each parameter were recorded every 10 . The mean value of each parameter was calculated. These mean values are presented in Table 3, Table 4, Table 5 and Table 6.
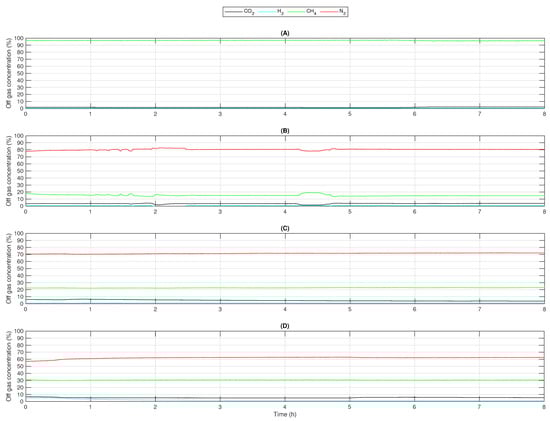
Figure 2.
Concentrations of , , (measured), and (calculated) in the off-gas when using feed gases with different mole fractions: (A) C100 (), (B) C20 (), (C) C30 (), (D) C40 ().
Table 3.
Overview of the mean feed and off-gas concentrations and flows using pure (C100). Concentration of , , and were measured values, was calculated.
Table 4.
Overview of the mean feed and off-gas concentrations and flows using C20. Concentration of , , and were measured values, was calculated.
Table 5.
Overview of the mean feed and off-gas concentrations and flows using C30. Concentration of , , and were measured values, was calculated.
Table 6.
Overview of the mean feed and off-gas concentrations and flows using C40. Concentration of , , and were measured values, was calculated.
Using pure resulted in and an off-gas concentration of methane , which is shown in Table 3. The off-gas composition is presented in Figure 2A. While the experiment was performed, was greater than 95%. varied from 0.6% to 0.8% and from 1.4% to 2.4%. According to [22], this composition is sufficient for an injection into the natural gas grid. These values fit other observations [23,24] and support the results made for this contribution. It is a typical off-gas composition for the biological methanation performed with and , even though the flow rates were very low.
Feeding C20 resulted in a off-gas concentration of 80% and a concentration of 15% (see Figure 2B). Moreover, about 4% was left in the off-gas. While using C30 as a feed gas (Figure 2C), the off-gas consisted of 72% , 23% , and 5% . Experiments with C40 led to an off-gas composition of about 63% , 30% , and 5% , which is presented in Figure 2D. Hydrogen concentrations in all experiments were at about 1%. The resulting conversion rates were 85% to 91%. All results are also shown in Table 4, Table 5 and Table 6, Figure 3.
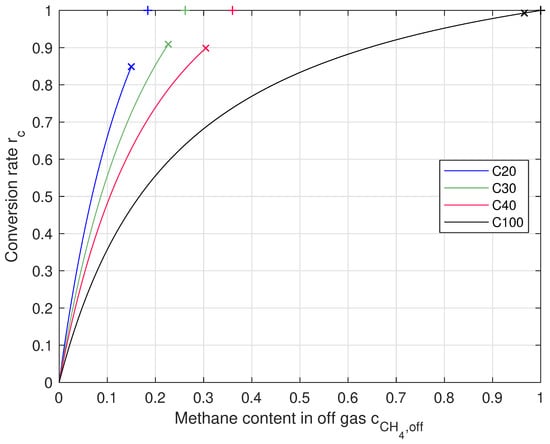
Figure 3.
Conversion rate with respect to content in off-gas for each feed gas composition. Markers: the “×” show mean values the processes were running at, the “+” show theoretical maximum.
When reaching a full conversion, which means and no and left, the off-gas only consisted of for C20 and C30, for C40, and just when using C100. This means that the off-gas must show the same composition as the carbon-dioxide-containing feed gas, but is fully replaced by . In every experiment, was close to its mole fraction in the mixed gas (without ). It can also be seen that the concentration of in the off-gas was always close to 1% and therefore, was almost fully converted to methane. The carbon dioxide concentration was 3.9% to 5.4% when feeding /, so there was carbon dioxide left in the off-gas that could be converted. There was also a difference between and . Volumetric flows were calculated and not measured.
4. Discussion
The aim of this contribution was to determine the effect of in the feed gas of a biological methanation performed in a continuous stirred-tank reactor (CSTR) with M. marburgensis. Methanation was performed in the common way, feeding and with a ratio of 4:1 into the fermenter. It was shown that the target of 95% methane in the off-gas is possible to reach, which is a requirement for natural gas grid injection in Germany and other European countries [22]. To show whether there is an effect of an additional presumed inert gas in the feed gas, was replaced with a / premixed gas. Mixtures with different compositions from 20% to 40% were used and the rest was . These compositions were chosen to simulate possible sources as they are presented in Section 1.
To compare both scenarios, namely feeding with pure and feeding with a / mixture, the ratio of and was defined as the conversion rate . concentration did not affect this value. Using pure led to with an off-gas concentration of % methane. According to former assumptions, this rate must be (nearly) the same when adding to the feed gas. Regarding Table 4, Table 5 and Table 6, the in all experiments was about 84.9% to 90.9%. Comparing in all experiments, there was a slight difference. Regarding the accuracy of the used equipment, the authors cannot determine if this deviation comes from inaccuracies in measurement or from a possible consumption of in the process. In particular, the cross-sensitivity of the sensor towards and and the low concentration resulted in a possibly high error of the gas sensors. We tried to compensate for this cross-sensitivity by doing a compensation calculation according to the manufacturer. These observations led to the assumption that in the process of biological methanation, did not influence the process of converting carbon dioxide into methane. behaves like an inert gas, and an overall concentration in feed gas from 0% to 47% can be used for biological methanation. Yet, the stoichiometric ratio of 4:1 hydrogen to carbon dioxide is not optimal. The limiting factor in this conversion was hydrogen. It was almost completely converted, with around 5% left in the off-gas. To convert the remaining , an additional experiment feeding more into the reactor, but deviating from the : ratio 4:1, resulted in . The ratio in this experiment was 4.3:1. This experiment is not presented in this contribution.
Regarding the first hypothesis made in the introduction, it is not possible to determine whether there is a formation of ammonia or not, considering the results obtained for this contribution. Due to Equation (1), does not participate in the catabolic reaction. On the other hand, the catalytic methanation process has been investigated while using in addition to and [13]. was added there to reduce the temperature in the reactor, and was formed. Even if the target—to use dinitrogen for dilution of the synthesis gas and to cool down the catalytic process—is different from using new -containing gases as a carbon source, a / mix should be considered for biological methanation processes. Further experiments can be performed to investigate the formation of and its presence in both the liquid and the gas phase. If there is a formation of ammonia, a substitution of from the nutrition solution can be considered.
In addition, the second hypothesis states that there should be an effect of any content on the mass transfer into the liquid phase. The presence of dinitrogen in the feed gas led to lower concentrations of hydrogen and carbon dioxide than in a system without . According to Fick’s law of diffusion, lower concentrations of and result in lower mass flows, which also increases the limitation of the process. This might have had an effect on the conversion rate, but this could not have been determined during this work. By using a higher , such a possible limitation could be determined.
Of course, a downstream processing of the off-gas would be necessary to separate and remaining from [5,25] to fit the requirements for a natural gas grid injection, according to [22]. The following step of upgrading the -containing off-gas to a gas to fit the grid injection requirements is not part of this contribution and can be found in the literature [5]. Alternatively, it can be directly used as a fuel in internal plant applications without downstreaming.
Author Contributions
Conceptualization, M.P.H., T.B., and J.S.; methodology, M.P.H.; investigation, M.P.H.; resources, J.S.; data curation, M.P.H., T.B., and J.S.; writing–original draft preparation, M.P.H.; writing–review and editing, M.P.H.; visualization, M.P.H.; supervision, J.S.; project administration, J.S.; funding acquisition, M.P.H., T.B., and J.S.
Funding
This research was funded by the German Federal Ministry of Education and Research (BMBF) grant number 13FH240PX6.
Conflicts of Interest
The authors declare no conflict of interest.
Abbreviations
The following abbreviations are used in this manuscript:
| ADP | Adenosine diphosphate |
| ATP | Adenosine triphosphate |
| C20 | Gas mix with approx. and |
| C30 | Gas mix with approx. and |
| C40 | Gas mix with approx. and |
| C100 | Gas with approx. |
| CSTR | Continuous stirred-tank reactor |
| DSMZ | Leibniz-Institut DSMZ-Deutsche Sammlung von Mikrooganismen und Zellkulturen GmbH |
| IR | Infrared |
| ORP | Oxidation reduction potential |
| PSA | Pressure swing adsorption |
| UNFCCC | United Nations Framework Convention on Climate Change |
| WW | Water washing |
References
- Ferry, J.G. (Ed.) Methanogenesis: Ecology, Physiology, Biochemistry & Genetics; Chapman & Hall microbiology series; Chapman & Hall: New York, NY, USA, 1993. [Google Scholar]
- Rouvière, P.E.; Wolfe, R.S. Novel biochemistry of methanogenesis. J. Biol. Chem. 1988, 263, 7913–7916. [Google Scholar] [PubMed]
- Fuchs, G.; Stupperich, E.; Thauer, R.K. Acetate assimilation and the synthesis of alanine, aspartate and glutamate in Methanobacterium thermoautotrophicum. Arch. Microbiol. 1978, 117, 61–66. [Google Scholar] [CrossRef] [PubMed]
- Adler, P.; Billig, E.; Brosowski, A.; Daniel-Gromke, J.; Falke, I.; Fischer, E. (Eds.) Leitfaden Biogasaufbereitung und -einspeisung, 5th ed.; Fachagentur für Nachwachsende Rohstoffe e. V. (FNR): Gülzow-Prüzen, Germany, 2014. [Google Scholar]
- Graf, F. (Ed.) Biogas: Erzeugung, Aufbereitung, Einspeisung; Oldenbourg Industrieverl.: München, Germany, 2011. [Google Scholar]
- Bibler, C.J.; Marshall, J.S.; Pilcher, R.C. Status of worldwide coal mine methane emissions and use. Int. J. Coal Geol. 1998, 35, 283–310. [Google Scholar] [CrossRef]
- Kaltschmitt, M.; Hartmann, H.; Hofbauer, H. Energie aus Biomasse, 3rd ed.; Springer: Berlin/Heidelberg, Germany, 2016. [Google Scholar]
- Evonik New Energies GmbH, Saarbrücken. Abschlussbericht zum Verbundprojekt Aufbereitung von Grubengas mit niedrigen Methangehalten zur Nutzung in Hochtemperaturbrennstoffzellen. Available online: https://www.tib.eu/en/search/id/TIBKAT%3A634597698/ (accessed on 1 July 2019).
- Thielemann, T.; Cramer, B.; Schippers, A. Coalbed methane in the Ruhr Basin, Germany: A renewable energy resource? Organ. Geochem. 2004, 35, 1537–1549. [Google Scholar] [CrossRef]
- thyssenkrupp AG. The Carbon2Chem Project. Available online: https://www.thyssenkrupp.com/en/carbon2chem/ (accessed on 24 June 2019).
- German Federal Ministry of Education and Research. Mit Abgas das Klima retten. Available online: https://www.bmbf.de/de/mit-abgas-das-klima-retten-3044.html (accessed on 27 June 2019).
- Oles, M.; Lüke, W.; Kleinschmidt, R.; Büker, K.; Weddige, H.J.; Schmöle, P.; Achatz, R. Carbon2Chem—Ein cross-industrieller Ansatz zur Reduzierung der Treibhausgasemissionen. Chemie Ingenieur Technik 2018, 90, 169–178. [Google Scholar] [CrossRef]
- Kiendl, I.; Klemm, M.; Clemens, A.; Herrman, A. Dilute gas methanation of synthesis gas from biomass gasification. Fuel 2014, 123, 211–217. [Google Scholar] [CrossRef]
- Kaster, A.K.; Goenrich, M.; Seedorf, H.; Liesegang, H.; Wollherr, A.; Gottschalk, G.; Thauer, R.K. More than 200 genes required for methane formation from H2 and CO2 and energy conservation are present in Methanothermobacter marburgensis and Methanothermobacter thermautotrophicus. Archaea 2011, 2011. [Google Scholar] [CrossRef] [PubMed]
- Leigh, J.A.; Dodsworth, J.A. Nitrogen regulation in bacteria and archaea. Annu. Rev. Microbiol. 2007, 61, 349–377. [Google Scholar] [CrossRef] [PubMed]
- Fardeau, M.L.; Peillex, J.P.; Belach, J.P. Energetics of the growth of Methanobacterium thermoautotrophicum and Methanococcus thermolithotrophicus on ammonium chloride and dinitrogen. Arch. Microbiol. 1987, 148, 128–131. [Google Scholar] [CrossRef]
- Thauer, R.K. The Wolfe cycle comes full circle. Proc. Natl. Acad. Sci. USA 2012, 109, 15084–15085. [Google Scholar] [CrossRef] [PubMed]
- German Emissions Trading Authority. Auctioning: German Auctioning of Emission Allowances: Periodical Reports. Available online: https://www.dehst.de/EN/understanding-emissions-trading/auctioning/reports/reports-node.html (accessed on 1 July 2019).
- Liesegang, H.; Kaster, A.K.; Wiezer, A.; Goenrich, M.; Wollherr, A.; Seedorf, H.; Gottschalk, G.; Thauer, R.K. Complete genome sequence of Methanothermobacter marburgensis, a methanoarchaeon model organism. J. Bacteriol. 2010, 192, 5850–5851. [Google Scholar] [CrossRef] [PubMed]
- Schönheit, P.; Moll, J.; Thauer, R.K. Growth parameters (Ks, µmax, Ys) of Methanobacterium thermoautotrophicum. Arch. Microbiol. 1980, 127, 59–65. [Google Scholar] [CrossRef]
- Rittmann, S.; Seifert, A.; Herwig, C. Quantitative analysis of media dilution rate effects on Methanothermobacter marburgensis grown in continuous culture on H2 and CO2. Biomass Bioenergy 2012, 36, 293–301. [Google Scholar] [CrossRef]
- European Committee for Standardization CEN. Gas Infrastructure—Quality of Gas—Group H; CEN: Brussels, Belgium, 2016. [Google Scholar]
- Götz, M.; Lefebvre, J.; Mörs, F.; McDaniel Koch, A.; Graf, F.; Bajohr, S.; Reimert, R.; Kolb, T. Renewable Power-to-Gas: A technological and economic review. Renew. Energy 2016, 85, 1371–1390. [Google Scholar] [CrossRef]
- Burkhardt, M.; Koschack, T.; Busch, G. Biocatalytic methanation of hydrogen and carbon dioxide in an anaerobic three-phase system. Bioresour. Technol. 2015, 178, 330–333. [Google Scholar] [CrossRef]
- Beil, M.; Beyrich, W.; Holzhammer, U.; Krause, T. Biomethane. Available online: https://mediathek.fnr.de/media/downloadable/files/samples/b/i/biomethane.pdf (accessed on 1 July 2019).


© 2019 by the authors. Licensee MDPI, Basel, Switzerland. This article is an open access article distributed under the terms and conditions of the Creative Commons Attribution (CC BY) license (http://creativecommons.org/licenses/by/4.0/).