Abstract
Flocculation is one of the most important characteristics of brewing yeast as it allows for the easy and cheap removal of cells after fermentation. The genes responsible for both the Flo1 and NewFlo flocculation phenotypes are well characterized. However, the relationship between Flo protein abundance and flocculation efficiency is poorly understood. In this present study, we used mass spectrometry proteomics to compare the cell wall and whole cell proteomes of commercial yeast strains with diverse flocculation behaviors. We found that the relative abundance of Flo1/5 or Flo10 in the cell wall was correlated with the ability of these yeast strains to flocculate. Analysis of whole cell proteomes identified differences in the proteomes of yeast strains and identified the potential for high metabolic diversity. Characterization of the cell wall and whole cell proteomes during fermentation showed high levels of Flo10 in cells that settled early during fermentation. Our data reveal the diversity of the cell wall and global proteomes of brewing yeast, highlighting the potential biochemical diversity present in yeast that can be utilized in the production of fermented beverages.
1. Introduction
Fermentation is the key stage in the beer brewing process, when yeast, primarily Saccharomyces, ferment sugars into ethanol and carbon dioxide. Two species of Saccharomyces are commonly used for beer brewing, ale yeast S. cerevisiae and lager yeast S. pastorianus. The S. cerevisiae typically used for the production of ales generally remain in suspension during fermentation, leading to the name top-fermenting yeast. S. cerevisiae is a domesticated species of yeast, which has been subject to extensive selective pressures through its use in brewing, baking, and to a lesser extent wine making by the continuous inoculation of ferments from previous cultures, either intentionally or unintentionally [1]. In contrast, S. pastorianus is a hybrid between S. cerevisiae and Saccharomyces eubayanus, which is used for lager production [2]. This fermentation style is also known as bottom fermentation as the yeast tends to efficiently settle on the bottom of fermentation vessels towards the end of fermentation [3].
An industrially important characteristic of brewing yeast, either ale or lager, is their ability to flocculate. Flocculation is a process in which yeast cells adhere together to form large flocs, which consist of up to thousands of individual yeast cells. Once formed, these flocs rapidly separate from the bulk fermentation liquor by either sedimenting to the bottom (lager yeasts) or surfacing to the top of the fermenter (ale yeasts). The ability of yeast to efficiently flocculate at the end of fermentation is a highly desirable phenotypic property for commercial alcohol production as it greatly reduces the difficulty and expense that would otherwise be associated with downstream removal of cells from suspension [4,5].
Flocculation in Saccharomyces is typically achieved through the non-sexual, calcium-dependent aggregation of homotypic individual cells into multicellular groups or ‘flocs’ and is a reversible behavior that is distinct from other observed multicellular aggregation behaviors in Saccharomyces [6]. Flocculent cells express lectin-like proteins on their surface which, in the presence of divalent cations, recognize and bind to receptors on neighboring cells [7]. These receptors are typically α-mannan carbohydrates, which are key components of the Saccharomyces cell wall [6,7]. Many such lectins have been identified in yeast, with the majority belonging to the FLO gene family. The domain structure of these proteins consists of a signal peptide, a lectin domain that is located near the N-terminus of the mature protein, a serine/threonine-rich heavily O-mannosylated linker domain and a C-terminal glycosylphosphatidylinositol (GPI) anchor, which is the basis for the transfer of the mature protein to cell wall polysaccharides [6,8,9]. The epitome of the FLO family is FLO1, which is the dominant flocculation gene in many yeast strains [10,11]. Other FLO genes include FLO2 and FLO4, which are alleles of FLO1, FLO5, FLO9, FLO10, and FLO11, with all these genes sharing high homology to FLO1 [12]. FLO8 encodes a transcriptional activator of FLO1, FLO11, and STA1. Interestingly, FLO11 is not associated with the flocculation of S. cerevisiae but is required in S. cerevisiae var. diastaticus strains [13]. More recently, a new FLO1 homolog was identified, Lg-FLO1, located in the same genomic location as FLO5 in S288c [14]. FLO-dependent flocculation requires the presence of cations, with Ca2+ being the most effective [7,15]. The absolute amount of Ca2+ that is required to induce flocculation is strain-dependent, which is perhaps due to differences in FLO gene expression or polymorphisms affecting binding affinity [16]. Many other factors have strong effects on yeast flocculation, including pH, temperature, oxygen, cell age and ethanol concentration [17].
Two distinct Saccharomyces flocculation phenotypes have been described, known as Flo1 and NewFlo [18]. The Flo1 phenotype is linked with FLO1 and is associated with flocculation that is specifically inhibited by mannose occupying the flocculin binding sites [17]. In contrast, NewFlo is associated with Lg-FLO1 [9,19] and is a phenotype widely observed in brewing yeasts that is typified by the reversible inhibition of flocculation by mannose along with maltose, glucose or sucrose [17,18]. It has also been proposed that the NewFlo phenotype is mechanistically caused by NewFlo proteins having a lower affinity to mannan on neighboring cells relative to malto-oligosaccharides, resulting in dissolved fermentable sugars in the brewing media preventing flocculation until fermentation is complete [5,20]. NewFlo flocculation may also be triggered at the end of exponential growth when the depletion of critical nutrients, such as sugars, amino nitrogen, sterols or fatty acids, induces flocculin expression [21,22,23]. However, in modern brewing, the use of vertical conical fermenters and the presence of the NewFlo phenotype in essentially all commonly used ale and lager yeast strains results in efficient sedimentation in the cone of the fermenter at the end of fermentation [17].
In this study, we used mass spectrometry proteomics to investigate the cell wall proteins that are associated with variable flocculation phenotypes among five distinct alcoholic fermentation yeast strains. We also assayed the global proteomes of these yeast strains and monitored the dynamics of the cell wall and global proteome during the course of fermentation.
2. Materials and Methods
2.1. Yeast Strains
The yeast strains used were: BY4743 diploid S. cerevisiae, a strain widely used in laboratories; WLP775, a cider brewing strain advertised as being moderately flocculent; WLP002, an English ale brewing strain advertised as being highly flocculent; WLP500, a Trappist ale brewing strain advertised as being moderately to lowly flocculent; and WLP705, a sake brewing strain advertised as being non-flocculent.
2.2. Assessment of Flocculation Phenotype
Single colonies of each yeast strain were grown in liquid YPD with shaking at 30 °C to stationary phase. After this, they were diluted to an OD600 of 1.0 before visualization with microscopy at 400× magnification. Three separate images were taken at random for each sample. Floc size was measured for all imaged cells by the number of total cells present in each multicellular cluster.
2.3. Fermentation
For comparisons of the cell wall and whole cell proteomes of the yeast strains, yeast were grown in liquid YPD with shaking at 30 °C until they reached an OD600 of 1.0, before being harvested by centrifugation at 4500 rcf for 10 min. For proteomic analysis of the cell wall and whole cell proteomes during the course of fermentation, yeast WLP002 was grown in wort prepared using a commercial 1.7 kg can of Coopers Australian Pale Ale liquid and pre-hopped malt extract supplemented with 1 kg of Coopers Brew Enhancer Type 2 (containing dried malt extract and glucose), sufficient for 20 L of wort. The extract and enhancer were dissolved in 5 L of boiled ddH2O water and cooled, before aliquots of 5 mL were diluted with 20 mL of ddH2O in 50-mL Falcon tubes. A single colony of WLP002 was taken from YPD agar and inoculated in 50 mL of liquid YPD media. This inoculum was incubated overnight at 30 °C with shaking at 200 rcf, and 10 µL was used to inoculate 25 mL of wort in 50-mL Falcon tubes, as described above. The inoculated tubes were left to ferment at 24 °C without shaking. Samples were taken 2 and 6 days post inoculation, which involved separating the suspended cells in the supernatant from settled cells in the pellet. The pellet was washed in ddH2O and harvested by centrifugation at 4500 rcf for 10 min, while suspended cells in the supernatant were harvested by centrifugation at 4500 rcf for 10 min.
2.4. Yeast Protein Sample Preparation
Proteins in the yeast cell wall and whole cell extracts were prepared for mass spectrometry (MS) as described [24,25,26]. Briefly, harvested cells were resuspended in non-denaturing buffer with protease inhibitors, lysed by bead beating, cysteines were reduced/alkylated, and cell wall material was thoroughly washed with a strongly denaturing buffer. Yeast whole cell extracts were taken from the soluble fraction after centrifugation to remove cell debris, and proteins were desalted by precipitation with methanol/acetone. The final cell wall and whole cell protein pellets were resuspended in 50 mM ammonium acetate and the proteins were digested with trypsin.
2.5. SWATH-MS
Peptides were desalted with C18 ZipTips (Millipore, Burlington, MA, United States) and measured by LC-ESI-MS/MS using a Prominence nanoLC system (Shimadzu, Kyoto, Japan) and TripleTof 5600 instrument with a Nanospray III interface (SCIEX Concord, ON, Canada) as previously described [27]. Approximately 1 µg or 0.2 µg of desalted peptides, estimated from ZipTip peptide binding capacity, were injected for data dependent acquisition (DDA) or data independent acquisition (DIA; sequential window acquisition of all theoretical fragment ions mass spectrometry, SWATH-MS), respectively. LC parameters were identical for DDA and DIA, while MS parameters were set as previously described [26].
2.6. Data Analysis
Peptides and proteins were identified using ProteinPilot 4 (SCIEX) searching against all yeast proteins in UniProtKB with the following settings: sample type, identification; cysteine alkylation, acrylamide; instrument, TripleTof 5600; species, none; ID focus, biological modifications; enzyme, trypsin; search effort, thorough ID. The abundance of peptide fragments, peptides and proteins was determined using PeakView 2.1 (SCIEX) with the following settings: shared peptides, excluded; peptide confidence threshold, 99%; false discovery rate, 1%; XIC extraction window, 6 min; XIC width, 75 ppm. For protein-centric analyses, protein abundances were normalized to total protein in a sample. The data were reformatted as appropriate for use with MSstats. Protein abundance differences between samples were determined using MSstats (2.4) in R [28], with Benjamini and Hochberg corrections to adjust for multiple comparisons, at a significance threshold of p = 10−5. Gene Ontology (GO) term enrichment and KEGG pathway enrichment analysis was performed using DAVID (6.8) [29,30] at a significance threshold of p = 0.05. Principal component analysis (PCA) was performed using Python, the machine learning library Scikit-learn (0.19.1) and the data visualization package Plotly (1.12.2). The mass spectrometry proteomics data have been deposited to the ProteomeXchange Consortium via the PRIDE [31] partner repository with the dataset identifier PXD010969.
3. Results
3.1. Cell Wall Proteome Correlates with Yeast Flocculation
Flocculation of yeast is driven by lectin-like proteins in the cell wall that bind neighboring cells through mannans in their cell walls. We investigated the flocculation and proteome of five distinct fermentation yeast strains: laboratory BY4743, cider WLP775 (moderate flocculation), English ale WLP002 (high flocculation), Trappist ale WLP500 (moderate to low flocculation) and sake WLP705 (non-flocculent). We grew yeast to stationary phase in YPD and measured the extent of flocculation of each strain. The microscopy showed clear differences in flocculation between strains (Figure 1A). Cider WLP775 and English ale WLP002 were highly flocculent, while Trappist ale WLP500, laboratory BY4743 and sake WLP705 showed minimal flocculation (Figure 1A). The floc sizes of cider WLP775, English ale WLP002, Trappist ale WLP500 and sake WLP705 were all significantly larger than laboratory BY4743 (Mann–Whitney non-parametric test, p < 0.01) (Figure 1B).
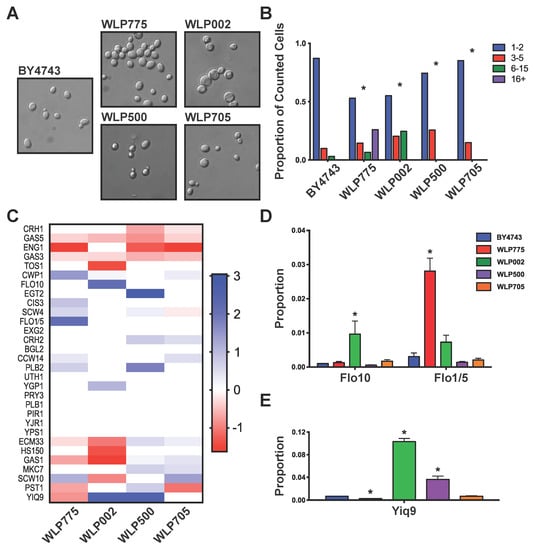
Figure 1.
Yeast flocculation and cell wall proteome. (A) Microscopy images of the five yeast strains (400x magnification); (B) flocculation extent of each strain. * p < 0.01 with comparison to BY4743; (C) heat map of significantly differentially abundant proteins (p < 10−5) between designated yeast strain and BY4743. Values shown as log2(fold change); (D) abundance of Flo1/5 and Flo10 in the cell wall; (E) abundance of YIQ9 in the cell wall. Values, mean. Error bars, SEM. * p < 10−5 with comparison to BY4743.
As flocculation is a cell wall protein-driven process, we used MS proteomics to compare the cell wall proteomes of the five yeast strains. DDA-MS identified 30 unique bona fide cell wall proteins (Table S1). We then compared the intrinsic differences in the cell wall proteome between yeast strains using SWATH-MS, comparing the cell wall proteome of each yeast strain to BY4743 (Table S1). This analysis revealed that most proteins in the cell wall were present in all yeast strains, although there were some substantial differences in their abundance. Compared to laboratory yeast BY4743, Trappist ale WLP500 and sake WLP705 showed similar differences in cell wall proteome, while cider WLP775 and English ale WLP002 also demonstrated similar differences (Figure 1C). The flocculin proteins Flo1/5 and Flo10 had some of the largest differences in relative protein abundance between brewing and laboratory yeasts. The Flo1 protein was identified with 10 unique peptides, all of which are also shared by the highly similar Flo5 protein. Therefore, our MS proteomics data were not able to differentiate these two proteins nor to unequivocally determine if the protein identified was Flo1 or Flo5. We therefore report this identification here as Flo1/5. English ale WLP002 was the only strain that showed significantly more Flo10 protein than BY4743, while cider WLP775 had significantly more Flo1/5 than BY4743 (Figure 1C,D). The presence of Flo1/5 and Flo10 in WLP775 and WLP002, respectively, is consistent with their flocculation ability (Figure 1A,B,D). Conversely, the lack of abundant flocculins in the cell wall proteomes of laboratory BY4743, Trappist ale WLP500 and sake WLP705 is consistent with their low flocculation. Another striking difference that we observed in the cell wall proteome of English ale WLP002 and Trappist ale WLP500 compared to laboratory BY4743 was the high abundance of YIQ9, which is an uncharacterized cell wall protein (Figure 1C,E).
3.2. Fermenting Yeasts Show Diverse Global Proteomes
To investigate global differences in cell biology between different brewing yeast strains, we performed SWATH-MS on whole cell proteomes of all five strains. We identified 468 proteins in the whole cell extract and used SWATH-MS to compare the proteomes of the four alcoholic fermentation strains to laboratory yeast BY4743 (Table S2). We first used PCA to provide an overview of the proteomic variability between strains. This showed good clustering of the biological replicate analyses of each yeast strain and a close association of cider WLP775 with sake WLP705 compared to the other three strains (Figure 2A). The comparison of global differences in protein abundance between each fermentation strain and laboratory BY4743 showed that the fermentation yeasts showed a generally similar pattern of differences to BY4743 (Figure 2B). We performed GO term enrichment analyses to gain insights into the biological pathways that were different between yeast strains (Table S3 and Figure 2C). At a pathway level, the non-beer yeasts, cider WLP775 and sake WLP705, showed similar enrichment of diverse pathways (Figure 2C). The “Ribosome” pathway was significantly enriched in cider WLP775 and sake WLP705 compared to laboratory BY4743 (Figure 2C). The “Biosynthesis of secondary metabolites”, “Biosynthesis of amino acids”, “Glycolysis/Gluconeogenesis”, “Biosynthesis of antibiotics”, “Metabolic pathways”, “Pentose phosphate pathway” and “Carbon metabolism” pathways were significantly enriched in laboratory BY4743 compared to both cider WLP775 and sake WLP705 (Figure 2C). “Biosynthesis of secondary metabolites”, “Biosynthesis of amino acids”, “Biosynthesis of antibiotics” and “Metabolic pathways” were also enriched in laboratory BY4743 compared to Trappist WLP500 (Figure 2C). English ale WLP002 showed no pathway enrichment that was shared with any other strain compared to BY4743, but the “Steroid biosynthesis”, “Terpenoid backbone biosynthesis” and “Phagosome” pathways were all enriched in this yeast compared to laboratory BY4743 (Figure 2C).
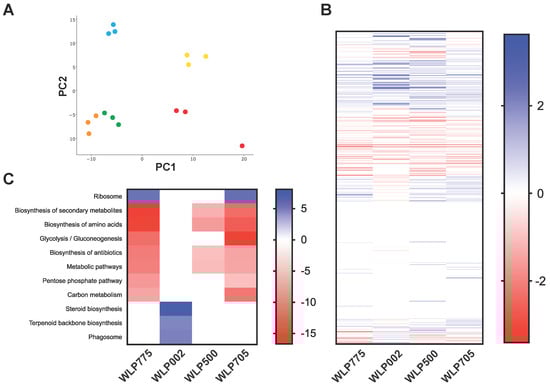
Figure 2.
Whole cell proteome comparison between yeast strains. (A) Principle component analysis of whole cell proteome. Colored by yeast strain: BY4743 (red), WLP775 (green), WLP002 (yellow), WLP500 (blue) and WLP705 (orange). The first component (x-axis) accounted for 25.86% of the total variance and the second component accounted for an additional 20.51%; (B) heat map of differentially abundant proteins between designated yeast strains and laboratory BY4743. Values shown as log2(fold change) for proteins which were significantly different in abundance (p < 10−5) between each yeast strain and BY4743; (C) heat map of significantly enriched pathways identified by DAVID analysis. Values shown as −log2 of Benjamini corrected p-values for pathways which were significantly enriched (p < 0.05).
After comparing both cell wall and whole cell proteomes of alcoholic fermentation yeast strains to laboratory strain BY4743, we performed a pairwise comparison of each strain’s cell wall and whole cell proteomes to the other strains (Figure 3A). These pairwise comparisons showed that although there were differences in the whole cell proteomes (Figure 2 and Figure 3A), the cell wall proteomes had larger quantitative differences in relative protein abundance, as measured by the average R2 values for each plot (Figure 3A,B). This analysis demonstrated that while the overall cellular proteomes were relatively consistent between yeast strains, there were comparatively large differences in the strain-specific cell wall proteomes. This is consistent with the large differences in flocculation behavior observed between this selection of yeast strains (Figure 1), mediated through the cell wall proteomes.
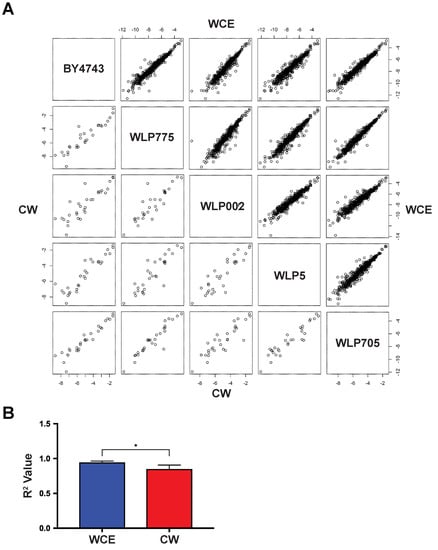
Figure 3.
Pairwise comparison of yeast cell wall and whole cell proteomes. (A) Pairwise scatter plots of the natural logarithm normalized mean relative abundance for identified proteins between all strains. Cell wall proteome (n = 30) data are in the bottom left plots, while whole cell proteome (n = 468) data are in the top right plots; (B) R2 correlation plot. Error bars, SD. * p < 0.001.
3.3. Stage of Fermentation Drives Changes in the Cellular Proteome
Our cell wall and whole cell proteomic analyses showed diversity across five yeast strains when grown under standard laboratory conditions (Figure 1, Figure 2 and Figure 3). We next focused on the dynamics of the cell wall and whole cell proteome of a single strain, English ale WLP002, across the course of fermentation in wort. We sampled settled and suspended cells after two days (early fermentation) and after six days (late fermentation). There were insufficient cells still suspended in late fermentation to allow analysis. We subsequently performed SWATH-MS analysis of the cell wall and whole cell proteomes, and compared settled and suspended cells in early fermentation, as well as comparing settled cells from late fermentation to settled cells from early fermentation. These comparisons identified significant changes in protein abundance (Figure 4 and Table S4). Comparing the cell wall proteome of settled and suspended yeast at early fermentation showed that Flo10 was significantly more abundant in early settled cells than in early suspended cells (Figure 4B). This is consistent with the cells that express Flo10 forming flocs and rapidly sedimenting. In contrast, Flo10 was significantly less abundant in the cell wall at late fermentation than at early fermentation (Figure 4B). This suggests that many cells at late fermentation sediment because cell growth has ceased, rather than due to increased flocculin expression.
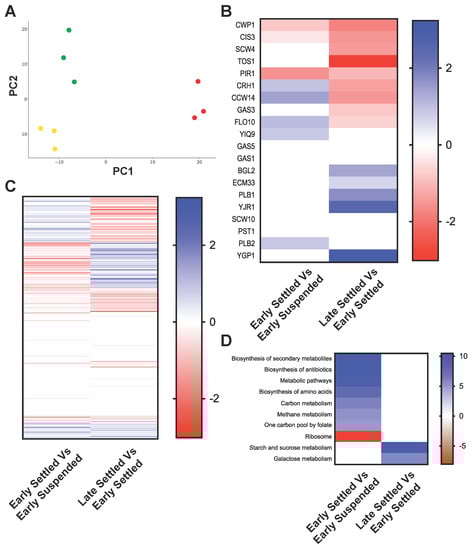
Figure 4.
Proteomic comparison of English ale WLP002 across the course of fermentation. (A) Principle component analysis of whole cell proteome. Colored by stage of fermentation: Early Suspended (yellow), early settled (green) and late settled (red). The first component (x-axis) accounted for 37.56% of the total variance and the second component accounted for an additional 20.25%; (B) heat map of cell wall proteins that are different in WLP002: early settled cells compared to early suspended cells, and late settled cells compared to early settled cells; (C) heat map of whole cell proteins that are different in WLP002: Early settled cells compared to early suspended cells, and late settled cells compared to early settled cells. Values in heat map (A,B) are shown as log2(fold change) for proteins with significantly different abundances (p < 10−5) in the relevant comparisons; (D) heat map of significantly enriched pathways identified by DAVID analysis. Values shown as −log2 of Benjamini corrected p-value for pathways which were significantly enriched (p < 0.05).
The whole cell proteome showed substantial differences between early settled and early suspended cells, and also between late settled and early settled cells (Table S5, Figure 4A,C). We examined these two separate comparisons by GO term pathway enrichment (Table S6 and Figure 4D). Early settled cells showed enrichment relative to suspended cells in the pathways of “Biosynthesis of secondary metabolites”, “Biosynthesis of antibiotics”, “Metabolic pathways”, “Biosynthesis of amino acids”, “Carbon metabolism”, “Methane metabolism” and “One carbon pool by folate” (Figure 4D). The “Ribosome” pathway was significantly enriched in early suspended cells compared to early settled cells (Figure 4D). The abundance of ribosomes in suspended cells is consistent with active protein expression and high general metabolism. The comparison of late settled to early settled cells showed that the “Starch and sucrose metabolism” and “Galactose metabolism” pathways were enriched in late settled cells (Figure 4D).
4. Discussion
We used SWATH-MS to explore the proteomic differences between selected yeast strains and across the course of fermentation. We found that cider WLP775 and English ale WLP002 exhibited significantly higher flocculation than laboratory BY4743, which correlated with the increased abundance of flocculin proteins in the cell walls of these strains. Interestingly, the flocculation phenotype of these two strains was associated with two distinct flocculins, Flo1/5 in cider WLP775 and Flo10 in English ale WLP002 (Figure 1C,D). This highlights the utility of proteomics in understanding the mechanisms underlying flocculation behavior in brewing yeasts. While we analyzed the determinants of flocculation of these strains during exponential growth in YPD, similar approaches could be used to investigate the stability of these phenotypes during growth in the context of industrial fermentation conditions or with repeated re-pitching. The uncharacterized YIQ9 protein was highly abundant in the cell walls of both beer strains of yeast, English ale WLP002 and Trappist ale WLP500, compared to laboratory BY4743 (Figure 1E). Therefore, YIQ9 may be associated with beer quality, and indeed shows homology to Cfg1 (Carlsbergensis foaming gene) from S. pastorianus, which has been linked to beer foam stability [32]. It is striking that these proteins, which are relatively abundant in the cell walls of brewing yeasts, are essentially absent from the cell wall of laboratory BY4743. This may be due to the heavy selection pressure on laboratory yeast against proteins in the cell wall that are surface-active or that induce aggregation, as these phenotypes are not conducive for clonal selection or easy handling.
The global whole cell proteomes of yeast strains showed large differences between brewing strains and laboratory yeast BY4743. PCA and DAVID KEGG pathway analysis showed that cider WLP775 and sake WLP705 had similar proteomes, with significant depletion in pathways involved in central carbon metabolism and diverse other secondary metabolic pathways relative to laboratory BY4743 (Figure 2C). Trappist ale WLP500 showed a similar reduction in secondary metabolic pathways but at lower levels, while English ale WLP002 showed an increase in terpenoid biosynthesis (Figure 2C). These differences in metabolism are likely linked to growth, fermentation ability and flavor profile [1], although the mechanisms underlying the link between proteome, metabolome and the quality of fermentation end products remain to be determined.
SWATH-MS of cell wall proteins is a powerful method for investigating the proteomic basis for flocculation of yeast strains that allows for the identification of expressed flocculins and prediction of the flocculation behavior of yeasts without having to perform genome sequencing. Our data also highlight the unexplored diversity of the cell wall and global proteomes of brewing yeasts, and emphasize the potential for understanding the biochemical basis of yeast metabolic and phenotypic diversity in the production of fermented beverages.
Supplementary Materials
The following are available online at http://www.mdpi.com/2311-5637/4/3/80/s1. Table S1: Yeast strain comparison of cell wall by MSstats. Uniprot accession number and protein name, followed by MSstats comparison with log2(fold change) and Benjamini and Hochberg adjusted p value, with a significance threshold of p < 10−5, Table S2: Yeast strain comparison of whole cell extract by MSstats. Uniprot accession number and protein name, followed by MSstats comparison with log2(fold change) and Benjamini and Hochberg adjusted p value, with a significance threshold of p < 10−5, Table S3: Yeast strain comparison of whole cell extract by GOStats KEGG Pathway enrichment. GO Term, Proteins and Benjamini adjusted p value are shown as well as additional information. Significance threshold, p < 0.05, Table S4: Comparison of cell wall during fermentation by MSstats. Uniprot accession number and protein name, followed by MSstats comparison with log2(fold change) and Benjamini and Hochberg adjusted p value, with a significance threshold of p < 10−5, Table S5: Comparison of whole cell extract during fermentation by MSstats. Uniprot accession number and protein name, followed by MSstats comparison with log2(fold change) and Benjamini and Hochberg adjusted p value, with a significance threshold of p < 10−5, Table S6: Comparison of whole cell extract during fermentation by GOStats KEGG Pathway enrichment. GO Term, Proteins and Benjamini adjusted p value are shown as well as additional information. Significance threshold, p < 0.05.
Author Contributions
All authors designed experiments, performed experiments, analyzed data and wrote the paper.
Funding
Benjamin L. Schulz is funded by an NHMRC Career Development Fellowship. Edward D. Kerr is funded by an Advance Queensland PhD Scholarship.
Acknowledgments
We gratefully acknowledge the assistance of Amanda Nouwens and Peter Josh at The University of Queensland School of Chemistry and Molecular Biosciences Mass Spectrometry Facility.
Conflicts of Interest
The authors declare no conflict of interest.
References
- Gallone, B.; Steensels, J.; Prahl, T.; Soriaga, L.; Saels, V.; Herrera-Malaver, B.; Merlevede, A.; Roncoroni, M.; Voordeckers, K.; Miraglia, L.; et al. Domestication and Divergence of Saccharomyces cerevisiae Beer Yeasts. Cell 2016, 166, 1397–1410. [Google Scholar] [CrossRef] [PubMed]
- Libkind, D.; Hittinger, C.T.; Valério, E.; Gonçalves, C.; Dover, J.; Johnston, M.; Gonçalves, P.; Sampaio, J.P. Microbe domestication and the identification of the wild genetic stock of lager-brewing yeast. Proc. Natl. Acad. Sci. USA 2011, 108, 14539–14544. [Google Scholar] [CrossRef] [PubMed]
- Gibson, B.; Liti, G. Saccharomyces pastorianus: Genomic insights inspiring innovation for industry. Yeast 2014, 26. [Google Scholar] [CrossRef]
- Govender, P.; Kroppenstedt, S.; Bauer, F.F. Novel wine-mediated FLO11 flocculation phenotype of commercial Saccharomyces cerevisiae wine yeast strains with modified FLO gene expression. FEMS Microbiol. Lett. 2011, 317, 117–126. [Google Scholar] [CrossRef] [PubMed]
- Verstrepen, K.J.; Derdelinckx, G.; Verachtert, H.; Delvaux, F.R. Yeast flocculation: What brewers should know. Appl. Microbiol. Biotechnol. 2003, 61, 197–205. [Google Scholar] [CrossRef] [PubMed]
- Tofalo, R.; Perpetuini, G.; Di Gianvito, P.; Schirone, M.; Corsetti, A.; Suzzi, G. Genetic diversity of FLO1 and FLO5 genes in wine flocculent Saccharomyces cerevisiae strains. Int. J. Food Microbiol. 2014, 191, 45–52. [Google Scholar] [CrossRef] [PubMed]
- Miki, B.L.A.; Poon, N.H.; James, A.P.; Seligy, V.L. Possible mechanism for flocculation interactions governed by gene FLO1 in Saccharomyces cerevisiae. J. Bacteriol. 1982, 150, 878–889. [Google Scholar] [PubMed]
- Bidard, F.; Bony, M.; Blondin, B.; Dequin, S.; Barre, P. TheSaccharomyces cerevisiae FLO1 flocculation gene encodes for a cell surface protein. Yeast 1995, 11, 809–822. [Google Scholar] [CrossRef] [PubMed]
- Kobayashi, O.; Hayashi, N.; Kuroki, R.; Sone, H. Region of FLO1 proteins responsible for sugar recognition. J. Bacteriol. 1998, 180, 6503–6510. [Google Scholar] [CrossRef] [PubMed]
- Watari, J.; Takata, Y.; Ogawa, M.; Sahara, H.; Koshino, S.; Onnela, M.-L.; Airaksinen, U.; Jaatinen, R.; Penttilä, M.; Keränen, S. Molecular cloning and analysis of the yeast flocculation geneFLO1. Yeast 1994, 10, 211–225. [Google Scholar] [CrossRef] [PubMed]
- Bony, M.; Thines-Sempoux, D.; Barre, P.; Blondin, B. Localization and cell surface anchoring of the Saccharomyces cerevisiae flocculation protein Flo1p. J. Bacteriol. 1997, 179, 4929–4936. [Google Scholar] [CrossRef] [PubMed]
- Teunissen, A.W.R.H.; Steensma, H.Y. The dominant flocculation genes of Saccharomyces cerevisiae constitute a new subtelomeric gene family. Yeast 1995, 11, 1001–1013. [Google Scholar] [CrossRef] [PubMed]
- Bayly, J.; Douglas, L.; Pretorius, I.; Bauer, F.; Dranginis, A. Characteristics of Flo11-dependent flocculation in. FEMS Yeast Res. 2005, 5, 1151–1156. [Google Scholar] [CrossRef] [PubMed]
- Ogata, T.; Izumikawa, M.; Kohno, K.; Shibata, K. Chromosomal location of Lg -FLO1 in bottom-fermenting yeast and the FLO5 locus of industrial yeast. J. Appl. Microbiol. 2008, 105, 1186–1198. [Google Scholar] [CrossRef] [PubMed]
- Stratford, M. Yeast flocculation: Calcium specificity. Yeast 1989, 5, 487–496. [Google Scholar] [CrossRef]
- Taylor, N.W.; Orton, W.L. Calium in flocculence of saccharomyces cerevisiae. J. Inst. Brew. 1975, 81, 53–57. [Google Scholar] [CrossRef]
- Soares, E.V. Flocculation in Saccharomyces cerevisiae: A review. J. Appl. Microbiol. 2011, 110, 1–18. [Google Scholar] [CrossRef] [PubMed]
- Stratford, M.; Assinder, S. Yeast flocculation: Flo1 and NewFlo phenotypes and receptor structure. Yeast 1991, 7, 559–574. [Google Scholar] [CrossRef] [PubMed]
- Sato, M.; Maeba, H.; Watari, J.; Takashio, M. Analysis of an inactivated Lg-FLO1 gene present in bottom-fermenting yeast. J. Biosci. Bioeng. 2002, 93, 395–398. [Google Scholar] [CrossRef]
- Verstrepen, K.J.; Klis, F.M. Flocculation, adhesion and biofilm formation in yeasts. Mol. Microbiol. 2006, 60, 5–15. [Google Scholar] [CrossRef] [PubMed]
- Sampermans, S.; Mortier, J.; Soares, E.V. Flocculation onset in Saccharomyces cerevisiae: The role of nutrients. J. Appl. Microbiol. 2005, 98, 525–531. [Google Scholar] [CrossRef] [PubMed]
- Smit, G.; Straver, M.H.; Lugtenberg, B.J.; Kijne, J.W. Flocculence of Saccharomyces cerevisiae cells is induced by nutrient limitation, with cell surface hydrophobicity as a major determinant. Appl. Environ. Microbiol. 1992, 58, 3709–3714. [Google Scholar] [PubMed]
- Straver, M.H.; Aar, P.C.V.D.; Smit, G.; Kijne, J.W. Determinants of flocculence of brewer’s yeast during fermentation in wort. Yeast 1993, 9, 527–532. [Google Scholar] [CrossRef] [PubMed]
- Bailey, U.M.; Jamaluddin, M.F.; Schulz, B.L. Analysis of congenital disorder of glycosylation-Id in a yeast model system shows diverse site-specific under-glycosylation of glycoproteins. J. Proteome Res. 2012, 11, 5376–5383. [Google Scholar] [CrossRef] [PubMed]
- Schulz, B.L.; Aebi, M. Analysis of Glycosylation Site Occupancy Reveals a Role for Ost3p and Ost6p in Site-specific N-Glycosylation Efficiency. Mol. Cell. Proteom. 2009, 8, 357–364. [Google Scholar] [CrossRef] [PubMed]
- Zacchi, L.F.; Schulz, B.L. SWATH-MS glycoproteomics reveals consequences of defects in the glycosylation machinery. Mol. Cell. Proteom. 2016, 15, 2435–2447. [Google Scholar] [CrossRef] [PubMed]
- Xu, Y.; Bailey, U.M.; Schulz, B.L. Automated measurement of site-specific N-glycosylation occupancy with SWATH-MS. Proteomics 2015, 15, 2177–2186. [Google Scholar] [CrossRef] [PubMed]
- Choi, M.; Chang, C.Y.; Clough, T.; Broudy, D.; Killeen, T.; MacLean, B.; Vitek, O. MSstats: An R package for statistical analysis of quantitative mass spectrometry-based proteomic experiments. Bioinformatics 2014, 30, 2524–2526. [Google Scholar] [CrossRef] [PubMed]
- Huang, D.W.; Sherman, B.T.; Lempicki, R.A. Bioinformatics enrichment tools: Paths toward the comprehensive functional analysis of large gene lists. Nucleic Acids Res. 2009, 37, 1–13. [Google Scholar] [CrossRef] [PubMed]
- Huang, D.W.; Sherman, B.T.; Lempicki, R.A. Systematic and integrative analysis of large gene lists using DAVID bioinformatics resources. Nat. Protoc. 2009, 4, 44–57. [Google Scholar] [CrossRef] [PubMed]
- Vizcaíno, J.A.; Csordas, A.; Del-Toro, N.; Dianes, J.A.; Griss, J.; Lavidas, I.; Mayer, G.; Perez-Riverol, Y.; Reisinger, F.; Ternent, T.; et al. 2016 update of the PRIDE database and its related tools. Nucleic Acids Res. 2016, 44, D447–D456. [Google Scholar] [CrossRef] [PubMed]
- Blasco, L.; Veiga-Crespo, P.; Sánchez-Pérez, A.; Villa, T.G. Cloning and Characterization of the Beer Foaming Gene CFG1 from Saccharomyces pastorianus. J. Agric. Food Chem. 2012, 60, 10796–10807. [Google Scholar] [CrossRef] [PubMed]


© 2018 by the authors. Licensee MDPI, Basel, Switzerland. This article is an open access article distributed under the terms and conditions of the Creative Commons Attribution (CC BY) license (http://creativecommons.org/licenses/by/4.0/).