Article

Bacillus subtilis GB Shows High Polyglutamic Acid Bioconversion Efficiency in Low-Glutamic-Acid Monosodium Glutamate Wastewater

1
College of Biological Sciences, China Agricultural University, Beijing 100193, China
2
COFCO Nutrition and Health Research Institute, Beijing 102209, China
3
COFCO Biotechnology Co., Ltd., Beijing 100020, China
*
Authors to whom correspondence should be addressed.
These authors contributed equally to this work.
Fermentation 2026, 12(9), 395; https://doi.org/10.3390/fermentation12090395
Submission received: 27 July 2026 / Revised: 18 August 2026 / Accepted: 19 August 2026 / Published: 22 August 2026
(This article belongs to the Section Industrial Fermentation)

Abstract

Low-glutamic-acid monosodium glutamate wastewater (L-MSGW), characterized by high (NH4)2SO4 concentrations, presents significant challenges for conventional treatment. γ-Polyglutamic acid (γ-PGA) production using industrial wastewater is an economical and environmentally friendly strategy. In the current study, we isolated and identified Bacillus subtilis GB, which exhibited exceptional tolerance to (NH4)2SO4, and capability for the high-efficiency biosynthesis of γ-PGA using untreated L-MSGW. Fermentation conditions were optimized using single-factor experiments coupled with response surface methodology, followed by scale-up validation in a 5 L fermenter. Under optimal conditions, the maximum γ-PGA yield reached 16.57 g/L with a minimal glutamate consumption of only 4.9 g/L. The study validated the feasibility of efficient γ-PGA production from L-MSGW by B. subtilis GB, providing a novel technical approach and theoretical basis for low-cost treatment and high-value resource utilization of L-MSGW. This study not only demonstrates the low-cost L-MSGW can be used for the high-value γ-PGA by B. subtilis GB but also provides a sustainable and economically viable solution for industrial wastewater treatment.

1. Introduction

Monosodium glutamate wastewater (MSGW) is the mother liquor remaining after multiple glutamic acid extraction processes in the industrial production of monosodium glutamate, and is also referred to as glutamic acid mother liquor [1]. Depending on the extraction stage, the composition of monosodium glutamate wastewater varies to a certain extent. Among them, the most difficult type of monosodium glutamate wastewater to treat, namely low-glutamic-acid monosodium glutamate wastewater (L-MSGW), generally exhibits the distinct characteristics of “four highs and one low,” that is, high chemical oxygen demand (COD), high biochemical oxygen demand (BOD), high ammonium nitrogen (NH4+-N), high sulfate (SO42−), and low pH [2]. The discharge of such wastewater directly into the natural environment will pose a significant threat to the integrity of aquatic ecosystems [3]. The relatively thorough extraction process employed in the production of monosodium glutamate results in wastewater containing only 1.2%–2.0% residual glutamic acid and 2.0–3.0% residual sugars [4]. This indicates that the potential for further utilization of wastewater is relatively limited. At present, the global monosodium glutamate industry operates on a large scale, leading to the generation of a substantial volume of L-MSGW. In 2024, global monosodium glutamate production reached approximately 3.9 million tons, and the wastewater generated per ton of 100% monosodium glutamate ranged from 10 to 12 tons [5]. The substantial quantity of L-MSGW gives rise to significant treatment challenges.
At present, the majority of monosodium glutamate factories treat high-concentration organic wastewater primarily through physical and chemical methods, and subsequently process it into fertilizers for agricultural application [6,7,8]. However, the relatively high processing costs and the low market price of fertilizers impose economic pressure on monosodium glutamate manufacturers. It is evident that microbial technology, as an emerging, cost-effective, and environmentally friendly biological treatment strategy, offers a more promising solution [9]. Studies have demonstrated the efficacy of the technology in reducing the chemical oxygen demand of wastewater while selectively and efficiently degrading associated pollutants, thereby achieving substantial improvement in key water quality parameters [10]. However, the osmotic stress induced by (NH4)2SO4 concentrations as high as 13%–16% in the wastewater severely inhibits the growth and metabolic activity of most microorganisms.
Bacillus subtilis is an aerobic Gram-positive soil bacterium that has been widely utilized as a microbial cell factory for the production of chemicals, enzymes, and antimicrobial materials in the industrial, agricultural, and pharmaceutical sectors, owing to its highly efficient protein secretion system and versatile metabolic adaptability [11]. γ-Polyglutamic acid (γ-PGA) is a biopolymeric material [12] with substantial application potential in agriculture, the food industry, and the pharmaceutical field [13,14]. In the agricultural sector, polyglutamic acid has been shown to promote crop growth [15,16], enhance plant tolerance to abiotic stresses such as drought and salinity–alkalinity [17,18], and improve the soil microenvironment [19]; consequently, fertilizers containing polyglutamic acid possess greater economic value. It has been reported that certain Bacillus species possess the biosynthetic pathway for polyglutamic acid, enabling them to convert environmental glutamic acid into polyglutamic acid [20]. If a γ-PGA-producing strain with strong environmental tolerance could be developed to ferment in L-MSGW, it would not only reduce the chemical oxygen demand of the wastewater [10] but also convert glutamic acid into polyglutamic acid, producing economically valuable γ-PGA agricultural fertilizers, thereby creating an opportunity to turn L-MSGW into a resource.
In contrast to conventional γ-PGA fermentation using glutamate-rich substrates, direct fermentation of L-MSGW presents distinct challenges because the wastewater contains relatively low concentrations of residual glutamic acid (1.2%–2.0%) together with high levels of (NH4)2SO4 and other components that impose substantial osmotic and metabolic stress on microorganisms. Therefore, the primary challenge in utilizing L-MSGW for γ-PGA production is not simply maximizing the γ-PGA titer, but identifying a robust strain capable of efficiently converting the limited glutamic acid available in the wastewater under these harsh conditions.
In this study, a bacterium with high γ-PGA conversion efficiency, designated as B. subtilis GB (CGMCC No.35797), capable of tolerating up to 160 g/L (NH4)2SO4, was isolated from Dou Chi samples. The strain underwent systematic taxonomic identification and physicochemical characterization, and was directly applied to L-MSGW without complex pretreatment for γ-PGA fermentation. The optimal culture conditions were determined through single-factor experiments and response surface methodology, followed by scale-up verification in a 5 L fermenter. The objective of this study was to develop an efficient and practical strategy for the direct conversion of L-MSGW into value-added γ-PGA, thereby promoting the green treatment and high-value utilization of L-MSGW.

2. Materials and Methods

2.1. Sample Collection, Isolation, and Culture Conditions

Fifty-two samples were collected from various food processing plants and plant rhizospheres, including fermented soybeans, broad bean paste, soy sauce, fermented tofu and saline–alkali soil. A 10 g sample was added to 100 mL of 0.9% saline solution and thoroughly mixed. The resulting suspension was heated in a water bath at 85 °C for 10 min, cooled to room temperature, and then serially diluted tenfold with 0.9% saline solution, yielding final dilutions ranging from 10−1 to 10−6. The diluted suspensions were subsequently spread onto LB medium for screening. Colonies for each possible species were selected after incubation at 37 °C for 24 h. To minimize interference between different strains, isolates were purified three times using the fresh LB solid medium. All isolates were stored in our lab, for subsequent experiments.

2.2. PCR Amplification, Sequencing, and Phylogenetic Analysis

The genomic DNA of the strain was extracted using the TIANamp Bacteria DNA Kit (Tiangen Biotech (Beijing) Co., Ltd. (Beijing, China); Cat. #DP302). The conserved genes of 16S rRNA and gyrA were amplified using the primers 27F/1492R (27F: 5′-AGAGTTTGATCMTGGCTCAG-3′; 1492R: 5′-GGTTACCTTACGACTT-3′) and gyrA-F/gyrA-R (gyrA-F: 5′-CAGTCAGGAAATGCGTACGTCCTT-3′; gyrA-R: 5′-CAAGGTAATGCTCCAGGCATTGCT-3′), respectively. PrimeSTAR Max DNA Polymerase (TaKaRa Biomedical Technology (Beijing) Co., Ltd. (Beijing, China); Cat. #R405A) was used for PCR amplification. The gene fragments were purified and ligated into the pGEM-T vector. Recombinant plasmids were transformed into Escherichia coli DH10B and transformants were selected by blue/white screening procedure. Plasmids containing target gene were extracted and purified, and then sequenced by Shanghai Majorbio Bio-pharm Technology Co., Ltd. (Shanghai, China) The sequences were aligned with BLAST software from NCBI (https://blast.ncbi.nlm.nih.gov/Blast.cgi (accessed on 1 September 2025)).
The phylogenetic trees were constructed using the neighbor-joining method with MEGA12 software package based on 16S rRNA gene sequences and gyrA gene sequences, respectively. Bootstrap analysis was performed with 1000 cycles, and only bootstrap values greater than 50% were shown at the branch points.

2.3. Culture of Strains in Synthetic Fermentation Medium

Strains were inoculated into 20 mL of seed culture medium (per liter: 30 g glucose, 8 g yeast extract, 10 g sodium glutamate, 4 g K2HPO4·3H2O, 2 g (NH4)2SO4, 0.1 g MgSO4·7H2O, and 0.04 g MnSO4·H2O, with an initial pH of 7.0 [21]) and shaken at 220 rpm at 37 °C for 16 h. A total of 2% (v/v) of the seed culture was inoculated into 30 mL of synthetic fermentation medium (per liter: 40 g glucose, 40 g sodium glutamate, 2 g K2HPO4·3H2O, 5 g (NH4)2SO4, 0.25 g MgSO4, and 0.03 g MnSO4·H2O, with an initial pH of 7.0 [22]) and cultured at 37 °C and 220 rpm for 48 h. Cell growth was monitored by measuring OD600nm of the fermentation broth using a spectrophotometer. Residual concentrations of glucose and glutamate in the fermentation broth were determined using the SBA biological analyzer (Shandong Provincial Key Laboratory of Biosensors, Jinan, Shandong, China).

2.4. Purification and Detection of γ-PGA in Fermentation Broth

The fermentation broth was centrifuged at 8228× g for 15 min to remove bacterial cells, and 10 mL of the supernatant was mixed with three volumes of pre-chilled absolute ethanol, shaken thoroughly, and incubated at 4 °C overnight. The supernatant was discarded after centrifugation at 12,857× g for 10 min, and the pellet was resuspended in 10 mL of deionized water by vortexing to obtain the γ-PGA. The concentration of γ-PGA was determined using the CTAB turbidimetric method. A volume of 2 mL of standard solution or appropriately diluted sample was mixed with 2 mL of CTAB reagent (5 g/L CTAB dissolved in 2% NaOH solution) in a test tube. The contents were fully mixed and timed immediately, while avoiding bubble formation as much as possible. Subsequent to an interval of three minutes, the absorbances were measured at a wavelength of 250 nm.

2.5. Determination of the Tolerance to (NH4)2SO4 of Strain GB

The strain GB was grown in fresh LB broth in 50 mL flasks shaken at 220 rpm and 37 °C overnight. Then, 5% (v/v) of the culture was inoculated into LB liquid medium supplemented with 50–170 g/L (NH4)2SO4 and LB liquid medium containing 50–170 g/L NaCl, respectively. After incubating the cultures for 24 h at 37 °C with shaking at 220 rpm, the growth of strain GB in different (NH4)2SO4 and NaCl were measured by absorbance at 600 nm using the UV–visible spectrophotometer (Shanghai Metash Instruments Co., Ltd., Shanghai, China). All experiments were performed in biological triplicate with independently prepared cultures.

2.6. Fermentation of Isolate GB in L-MSGW

For the preparation of the second-stage seed culture, the seed culture of GB was inoculated to fresh seed medium, and incubated for 16 h at 37 °C and 220 rpm. Next, 2% (v/v) of the second-stage seed culture was inoculated into L-MSGW diluted with water to final concentrations of 50%, 70%, 90%, and 100% (v/v), with the pH adjusted to 7.0, and incubated at 37 °C and 220 rpm for 48 h. The maximum growth of strain GB was assessed by absorbance at 600 nm. The concentrations of residual glucose and glutamate in the fermentation broth were determined using the SBA biological analyzer (Shandong Provincial Key Laboratory of Biosensors, Jinan, Shandong, China). All experiments were performed in biological triplicate.

2.7. Optimization of Fermentation Conditions

To optimize γ-PGA production by strain GB, L-MSGW was supplemented with glucose and soybean meal powder. Based on single-factor experiments, response surface methodology (Box–Behnken design) was employed using Design-Expert 13 to evaluate the effects of three independent variables containing soybean meal concentration (A), L-MSGW proportion (B), and glucose concentration (C). Sixteen experiments of three factors at three levels were carried out according to Tables S1 and S2. Fermentation media were sterilized by autoclaving and inoculated with 2% (v/v) second-stage seed culture, followed by incubation at 37 °C and 220 rpm for 48 h. All experiments were performed in biological triplicate, and γ-PGA concentrations were quantified to determine the optimal fermentation conditions.

2.8. Culture Experiment in the 5 L Fermenter

Based on the optimal fermentation medium formulation determined by the response surface experiments, 3.5 L of fermentation medium was prepared according to this formulation and inoculated with 175 mL of seed culture in a 5 L bioreactor. The fermenter conditions were maintained at a temperature of 37 °C and a pH of 6.5 using 2M NaOH. The dissolved oxygen (DO) was regulated via aeration and agitation control. Production media containing different initial concentrations of glucose were tested in the 5 L fermenter. During fermentation, the feeding of 50% (w/v) glucose solution was started when the concentration of glucose was lower than 5 g/L. By adjusting the feeding rate, the glucose concentration was maintained in the range of 5–10 g/L in the broth for the whole fermentation process. At 4 h intervals, samples of the culture were collected for the determination of the cell density, residual substrate and γ-PGA concentrations.

3. Results and Discussion

3.1. Screening for the γ-PGA Producer

In the study, a total of 86 strains were isolated from 52 natural samples preliminarily and inoculated into synthetic fermentation medium shaken for 48 h. The density and γ-PGA content of the fermentation broths were determined. The results showed that 64 isolates could produce γ-PGA successfully with variation from 0.07 g/L to 13.84 g/L (Figure S1). And the cell growth in the fermentation broths was evaluated by measuring the optical density at 600 nm (OD600nm), which ranged from 0.57 to 21.74. Pearson correlation analysis revealed that the cell density and γ-PGA production did not exhibit a simple linear positive correlation (r = −0.112), indicating the presence of diverse metabolic characteristics among γ-PGA-producing strains, such as “high yield with low biomass” or “high biomass with metabolic flux directed toward extracellular polymer synthesis”. According to the dual screening strategy based on the cell density and γ-PGA concentration, the strain designated as strain GB demonstrated exceptional performance, producing a highly viscous broth with an OD600nm of 14.02 and a γ-PGA yield of 13.84 g/L following fermentation for 48 h, which outperformed all other strains screened in this study in terms of both biomass accumulation and productivity.

3.2. Identification of Isolate GB

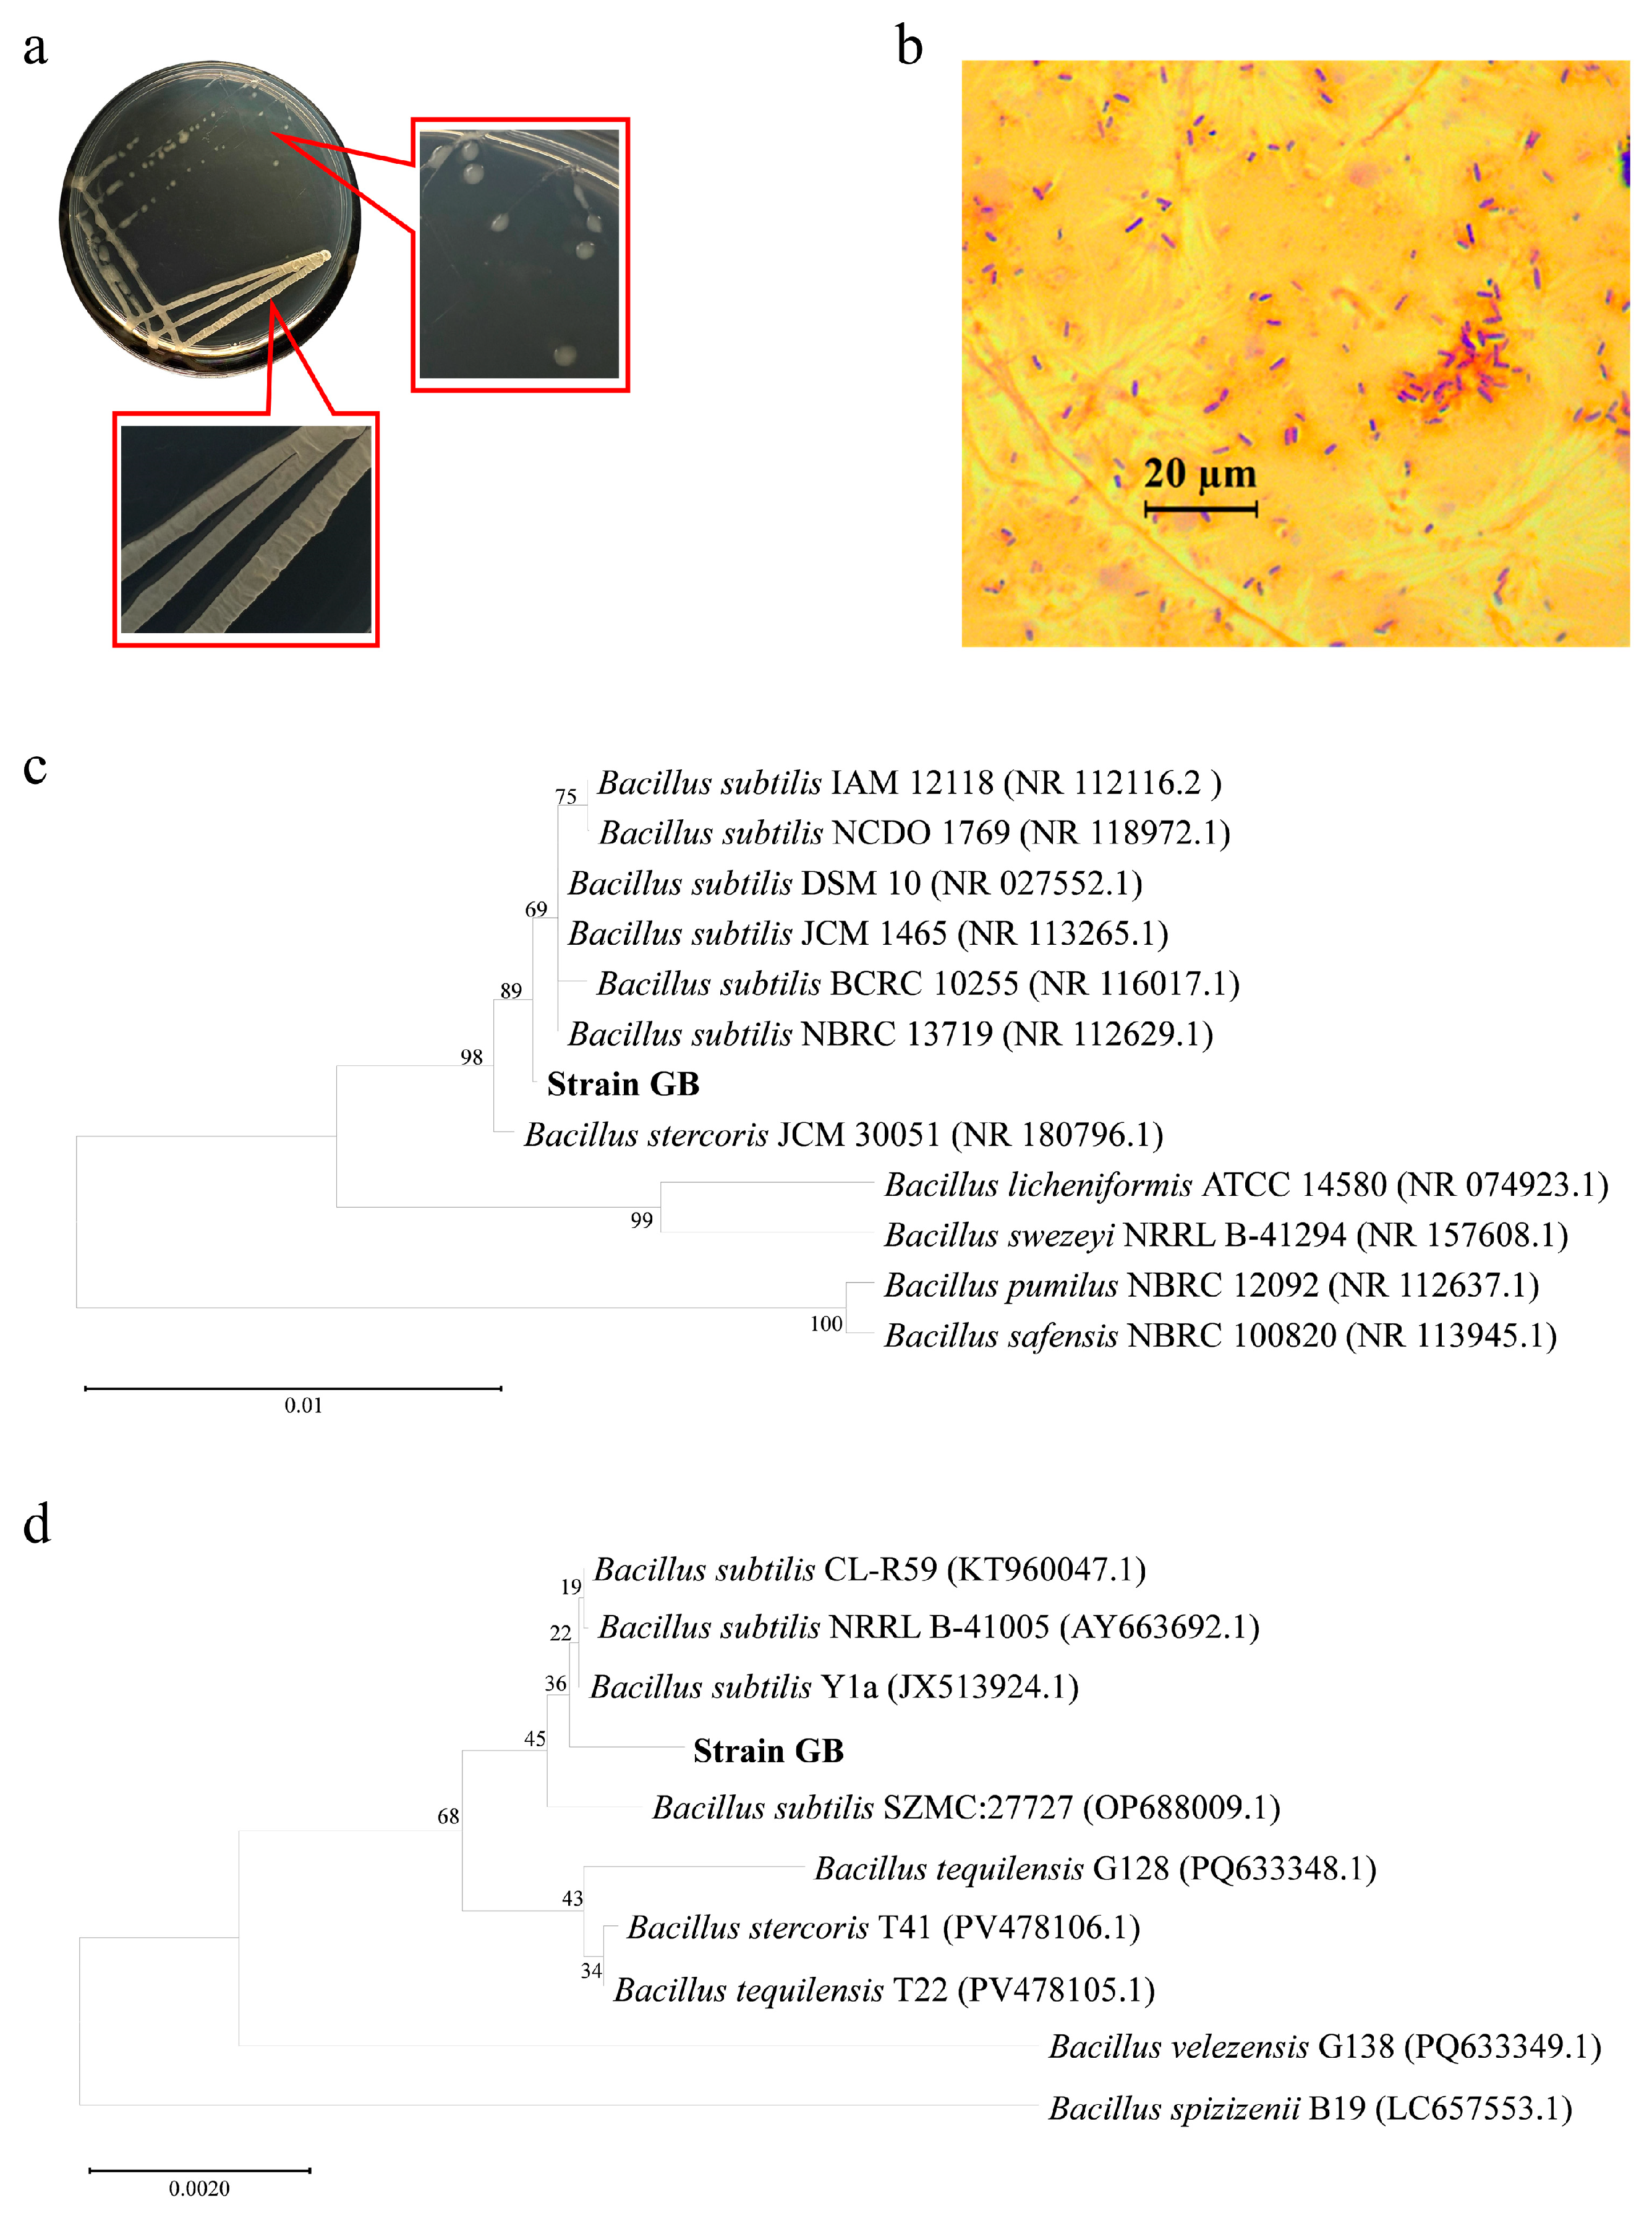
The colony shape of strain GB grown on LB medium exhibited smooth surfaces, and was semi-transparent, moist, and convex, with droplet-like morphology (Figure 1a). And it was found to be Gram-positive and rod-shaped (Figure 1b). In order to determine physiological and biochemical characteristics of GB, a series of tests was performed using GEN III microplates by Biolog system (Biolog, Inc., Hayward, CA, USA) [23]. The range of pH and temperature for growth were 5.0–9.0 and 18–54 °C, respectively. As shown in Table S3, the strain GB tolerated 1% Sodium Lactate, Lithium Chloride, and Potassium Tellurite. And the isolate GB could assimilate different substrates including dextrin, D-maltose, D-trehalose, D-cellobiose, gentiobiose, D-turanose, sucrose, D-raffinose, D-Melibiose, β-Methyl-D-Glucoside, D-Salicin, N-Acetyl-D-Glucosamine, D-glucose, D-mannose, D-fructose, D-sorbitol, D-mannitol, myo-inositol, gelatin, glycyl-L-prolin, L-alanine, L-arginine, L-aspartic acid, D-aspartic acid, L-glutamic acid, D-gluconic acid, L-histidine, L-pyroglutamic acid, L-serine, pectin, D-galacturonic acid, L-galactonic acid lactone, D-glucuronic acid, mucic acid, D-saccharic acid, methyl pyruvate, glycerol, L-rhamnose, L-lactic acid, citric acid, L-Malic Acid, Bromo-Succinic Acid, Acetoacetic Acid, Acetic Acid and Formic Acid as a sole carbon source, which provided a firm framework for the fermentation of the strain.
The 16S rRNA gene sequence is regarded as the evolution clock of bacterial phylogeny because of high conservation and slow evolution, widely used for the classification of bacteria [24]. The 16S rRNA gene sequence of the strain GB was compared with sequences reserved in the GenBank database (https://www.ncbi.nlm.nih.gov). Comparisons of the 16S rRNA gene sequences revealed that strain GB belonged to the genus Bacillus. The isolate GB showed the highest 16S rRNA gene sequence similarity (99.9%) to B. subtilis JCM 1465 (GenBank accession number: MH145363.1). Based on the phylogenetic analysis of 16S rRNA sequences, the isolate GB from Dou Chi samples clustered with all B. subtilis (Figure 1c).
Generally, a 98.7% sequence identity on the 16S rRNA gene are considered to be the same specie [25]. However, it often shows limited variation for members of closely related taxa [26]. Therefore, housekeeping genes are routinely used to complement the 16S rRNA gene analysis for species level determination [27,28]. The gyrA gene, coding for DNA gyrase subunit A, was confirmed to be useful for the rapid and accurate identification of B. subtilis and allied taxa [29]. Similarly, the gyrA gene sequence of strain GB exhibited high similarity to B. subtilis strains with 99.89% identity, which formed a monophyletic cluster with B. subtilis (Figure 1d). Based on the above results, the strain GB could be assigned to B. subtilis.

3.3. Evaluation of Salt Tolerance and Fermentation Performance in L-MSGW of B. subtilis GB

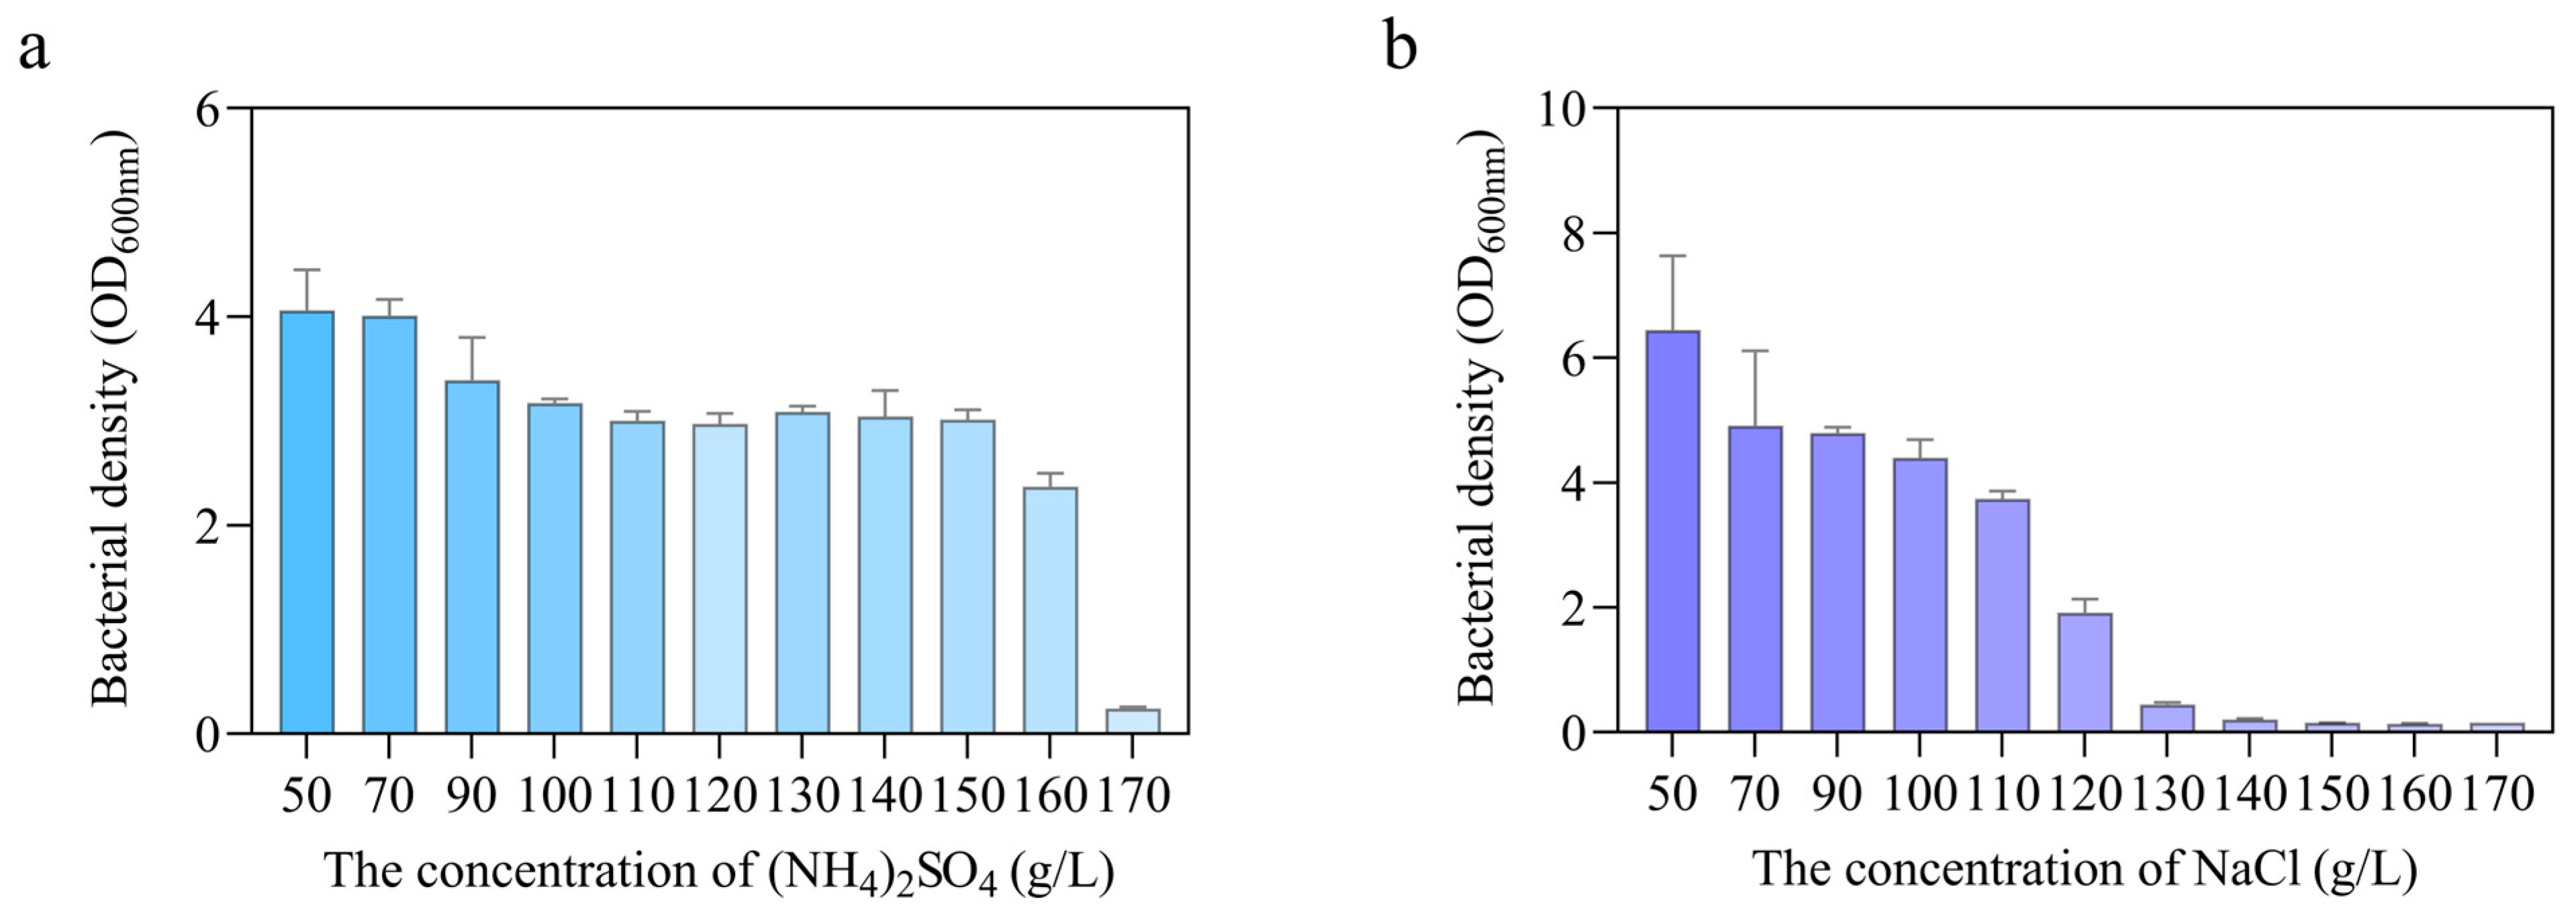
L-MSGW typically contains 13–16% (NH4)2SO4, and the high osmotic stress inhibits the growth and metabolism of large quantities of microorganisms, which limits the utilization and fermentation of L-MSGW significantly. In this study, the high-salt tolerance of B. subtilis GB was assessed systematically. As shown in Figure 2a, B. subtilis GB could grow stably in LB medium containing high concentrations of (NH4)2SO4 ranging from 130 to 160 g/L. Specifically, the growth of strain GB, represented by the OD600nm value, reached 2.37 at a concentration of 160 g/L, whereas the OD600nm value rapidly decreased to 0.244 when the concentration increased to 170 g/L. The results indicated that the maximum tolerance of B. subtilis GB to (NH4)2SO4 was approximately 160 g/L, which was significantly higher than the previous results reported by Yu et al. [4]. To further evaluate the salt tolerance characteristics of strain GB under different salt stresses, NaCl tolerance was also investigated as a comparison. The OD600nm value significantly decreased to 1.92 when the concentration of NaCl reached 120 g/L in the medium. The OD600nm value of B. subtilis GB was lower than 0.45 at higher NaCl concentrations (130–170 g/L), suggesting that the maximum NaCl tolerance of strain GB was approximately 120 g/L (Figure 2b). These results demonstrated that B. subtilis GB exhibited stronger tolerance to (NH4)2SO4 than to NaCl, indicating its superior adaptation to the high-(NH4)2SO4 stress environment. This indicated that B. subtilis GB possessed enormous potential for the high-value fermentation and utilization of L-MSGW.
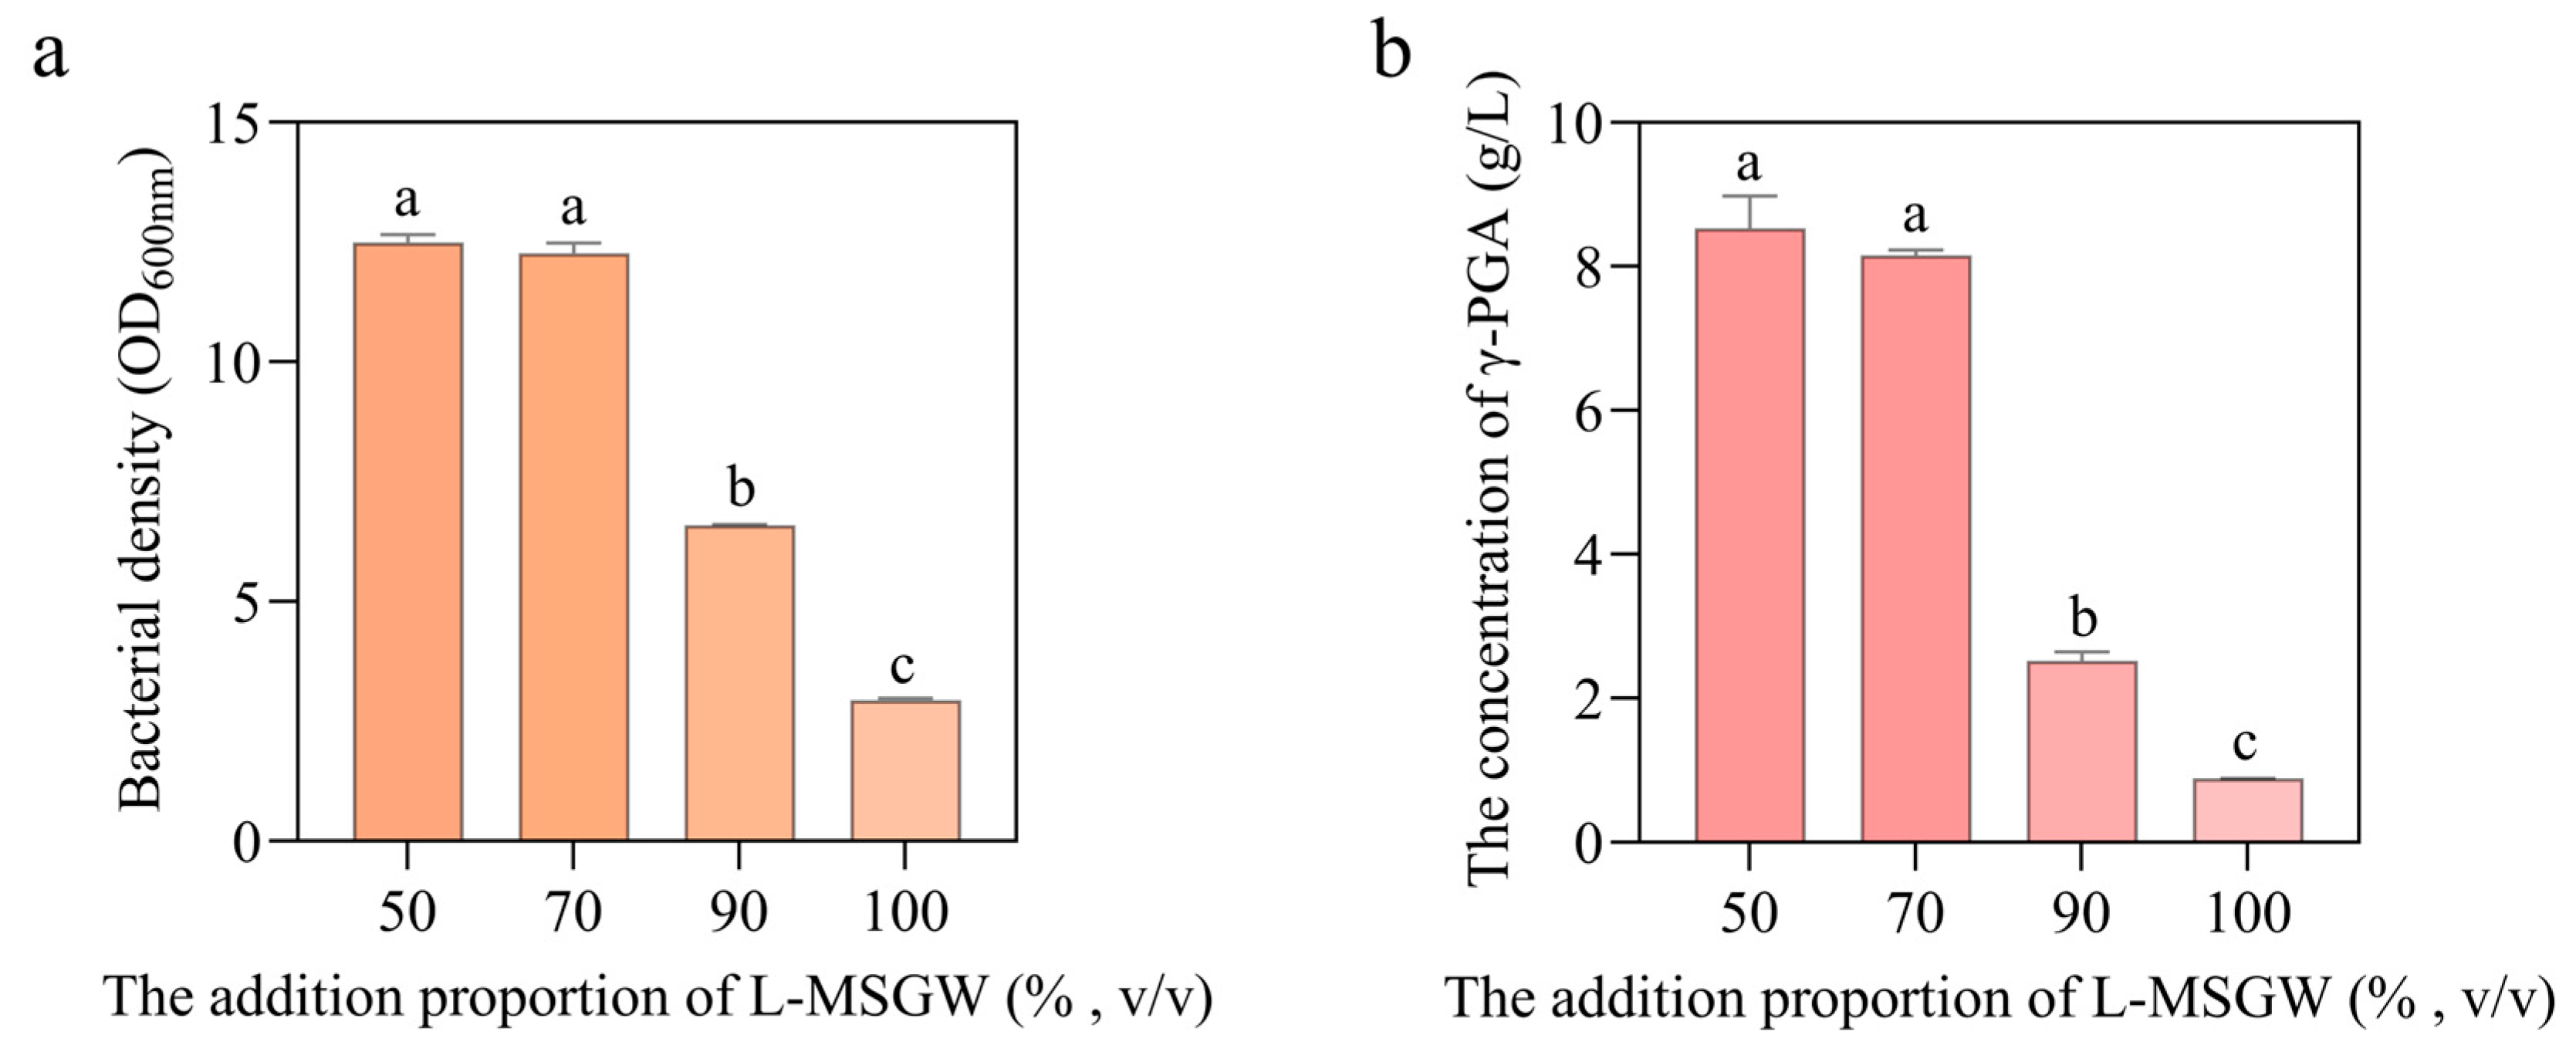
To evaluate the ability of B. subtilis GB to ferment in L-MSGW, the composition of the wastewater used in this study was first characterized. The glutamate concentration in L-MSGW was determined to be 18 g/L using an SBA biological analyzer, while the (NH4)2SO4 concentration was 138.89 g/L as determined by the Kjeldahl nitrogen method. The wastewater was diluted with water to various concentrations and inoculated for 48 h of fermentation, followed by determination of the OD600nm value and γ-PGA content in the fermentation broth. As shown in Figure 3, the growth of B. subtilis GB remained stable with the wastewater concentration lower than 70%, while its growth declined as the concentration exceeded 70%, and the OD600nm value was 2.94 even when the proportion of wastewater reached 100%. It was revealed that B. subtilis GB presented robust environmental tolerance despite significant growth inhibition by high-concentration L-MSGW. Considering that the (NH4)2SO4 concentration in undiluted L-MSGW was 138.89 g/L, which was lower than the maximum tolerance level of strain GB (160 g/L) determined above, the growth inhibition observed at high L-MSGW concentrations was unlikely to be solely caused by (NH4)2SO4. Therefore, other unidentified components or combined stresses present in L-MSGW may contribute to the reduced cell growth. As the L-MSGW proportion increased from 50% to 100%, γ-PGA production decreased from 8.53 g/L to 0.88 g/L, with a sharp reduction occurring above 70%, consistent with changes in cell density, indicating that growth rate suppression predominantly governs γ-PGA yield under high-stress conditions. Notably, the maximum production of 8.53 g/L at 50% L-MSGW confirmed that B. subtilis GB could effectively convert L-MSGW into γ-PGA without the need for complex pretreatment, contrary to prior reports, which focused on substituting pure glutamic acid with milder wastewater streams containing high glutamate and low (NH4)2SO4 [30,31,32].

3.4. Effects of Glucose, L-MSGW and Soybean Meal on γ-PGA Production

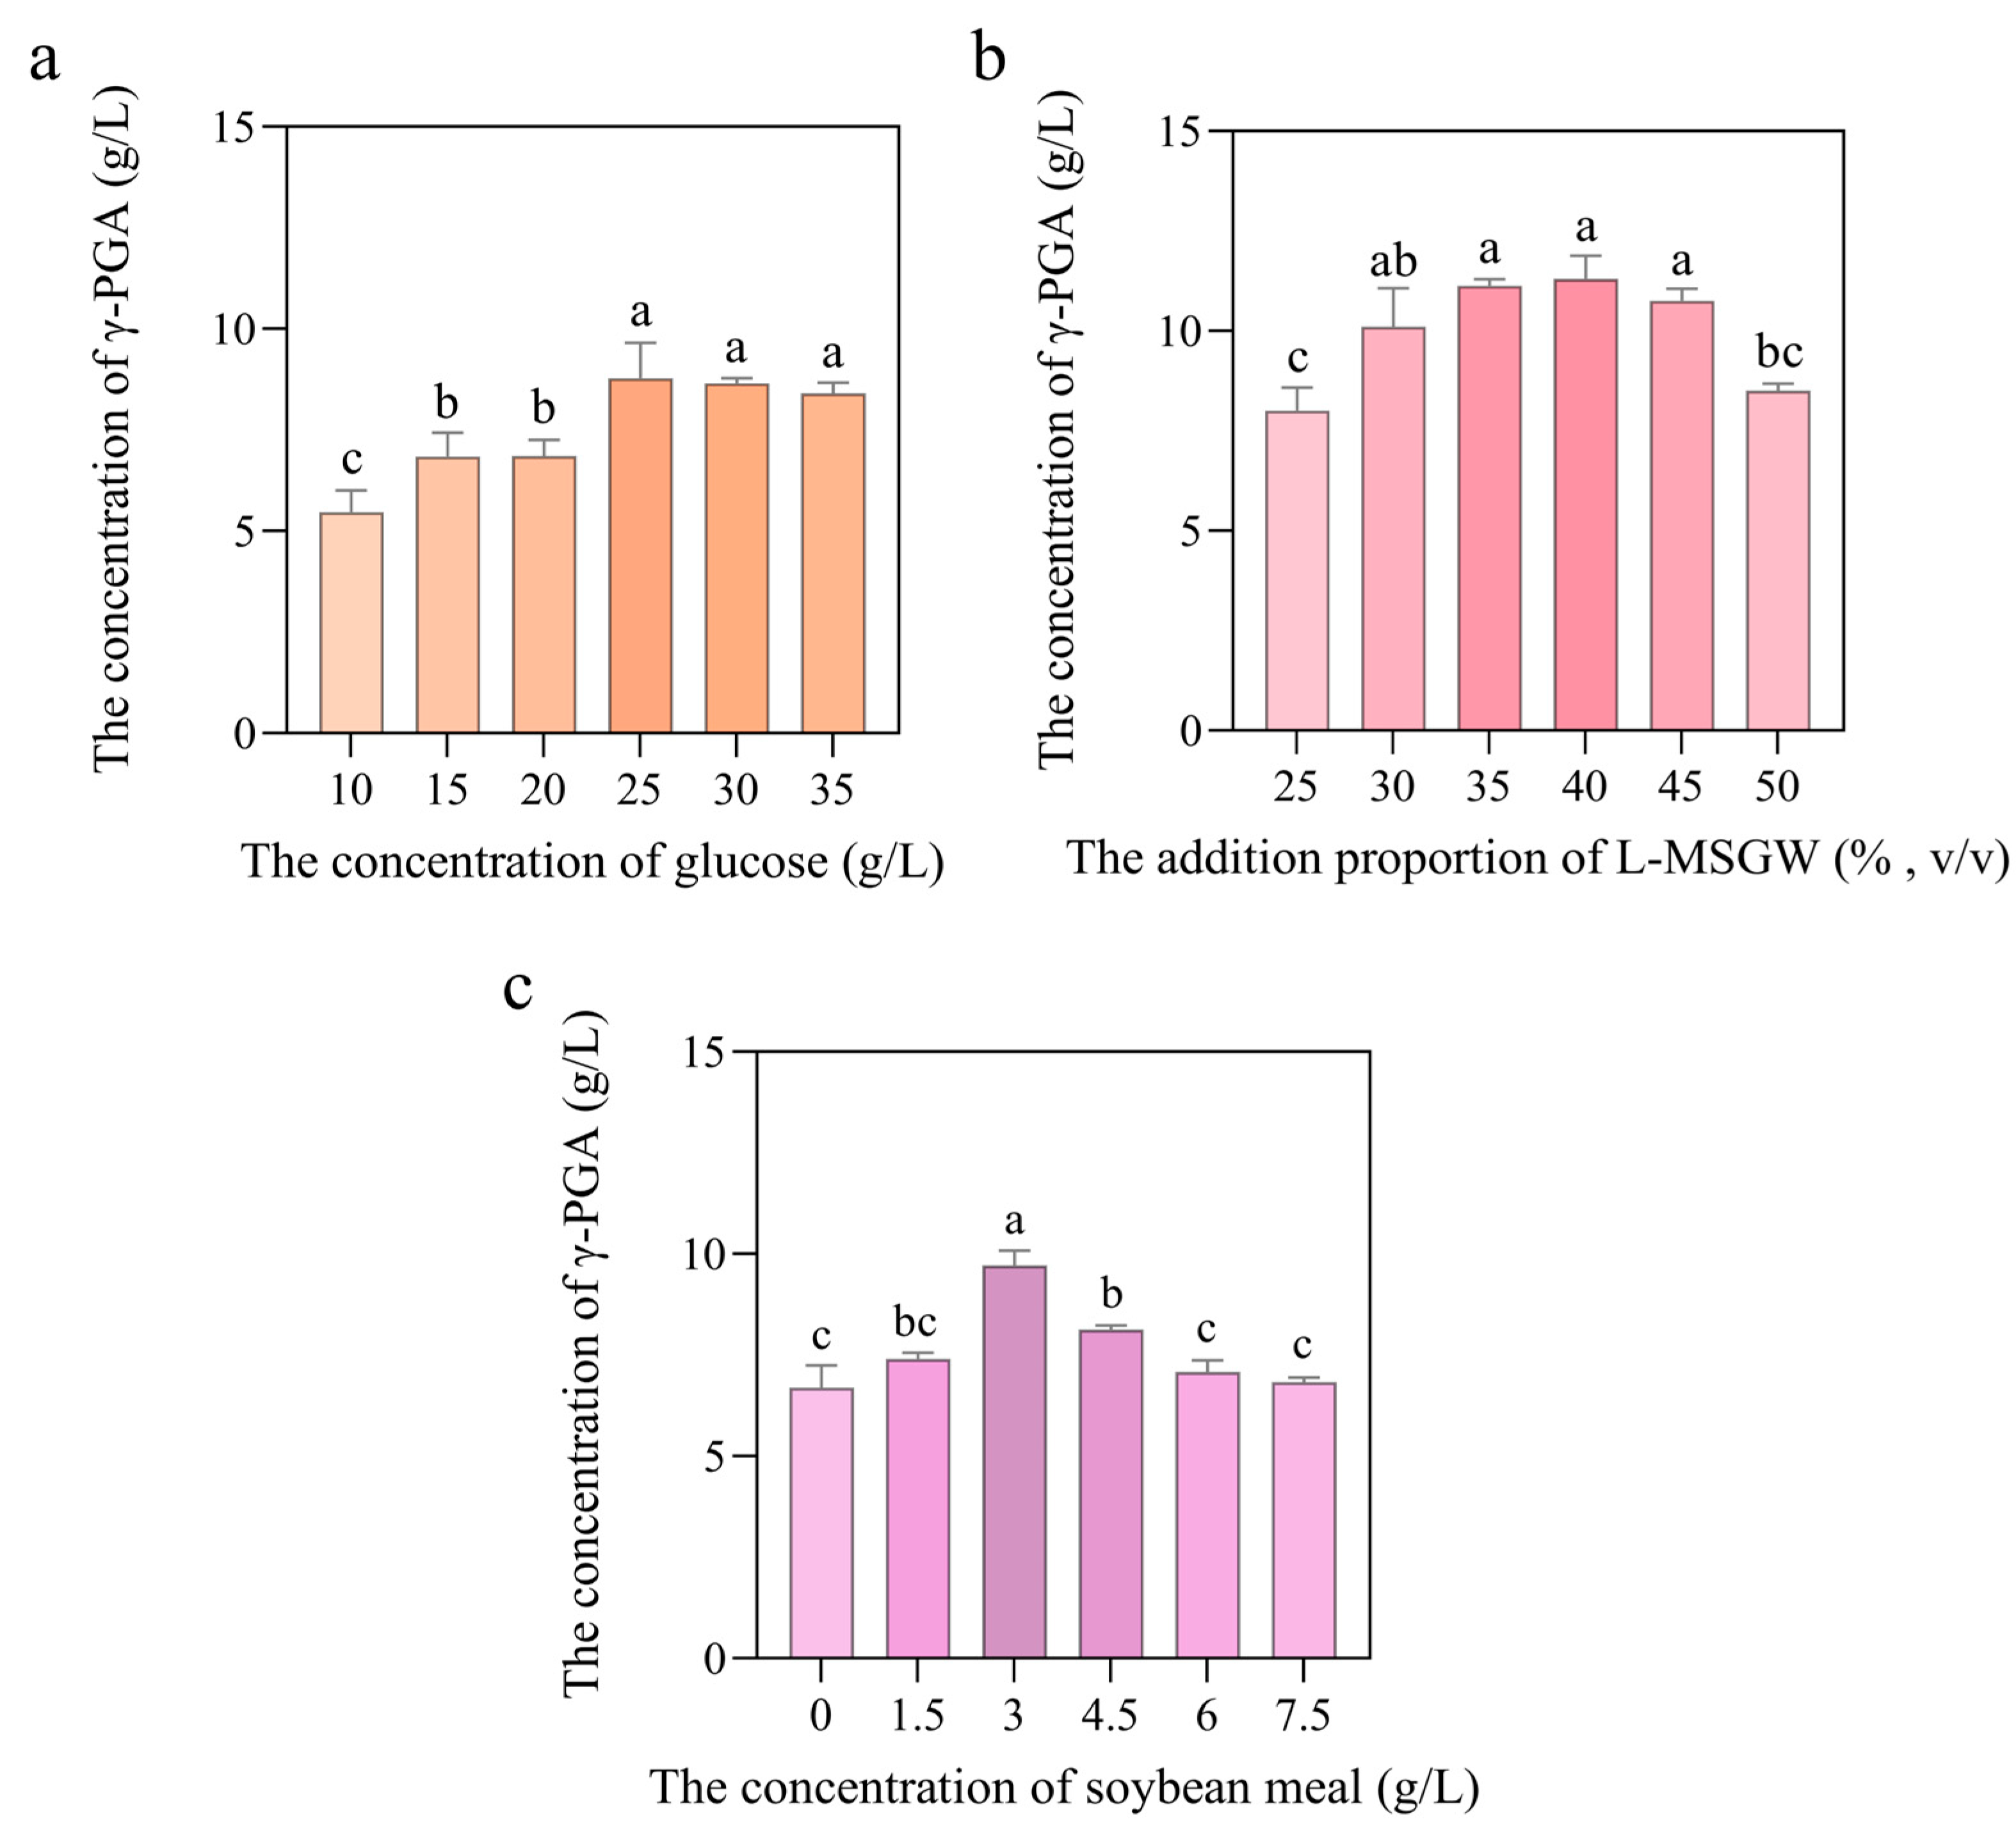
B. subtilis GB is a novel isolate for γ-PGA production in L-MSGW, so it is important to optimize cultivation conditions. The influences of carbon source, nitrogen source and L-MSGW on γ-PGA production by B. subtilis GB were investigated by single-factor experiments. It was reported that glucose was an efficient carbon source for γ-PGA fermentation by B. subtilis [30]. In this study, the γ-PGA yield was improved as the concentration of glucose increased, and the maximum production of B. subtilis GB was 8.79 g/L obtained at 25 g/L glucose (Figure 4a). It was confirmed that low concentrations of glucose provided sufficient energy for strain growth and γ-PGA synthesis through glycolysis and the tricarboxylic acid cycle, while high concentrations of glucose did not significantly improve the productivity of γ-PGA. This agreed with previous reports [33,34].
L-glutamic acid plays an important role in the production of γ-PGA. MSG wastewater can provide essential nutrients and substrates for γ-PGA synthesis, but it may contain potential inhibitory factors that suppress γ-PGA production [32]. Therefore, it is necessary to study the optimum concentration of L-MSGW for fermentation by B. subtilis GB. As shown in Figure 4b, the γ-PGA yield increased with proportions of L-MSGW (v/v) increasing, and the highest production of γ-PGA was 11.31 g/L when the content of L-MSGW was 40% followed by a subsequent decline. These results implied that the synthesis of γ-PGA was inhibited when the wastewater proportion exceeded 40%, presumably due to the combined stress from high salinity, osmotic pressure, and inhibitory compounds introduced by the untreated wastewater.
Considering that γ-PGA is produced during soybean fermentation for natto production in the conventional food industry, soybean may contain certain factors triggering γ-PGA synthesis [35]. Industrial waste, such as soybean meal, had been reported to be used for γ-PGA production by fermentation [36]. To enhance the yield of γ-PGA produced by B. subtilis GB in L-MSGW, we optimized the culture conditions by supplementing the wastewater medium with different concentrations of soybean meal. The results revealed that a soybean meal concentration of 3 g/L was optimal for γ-PGA production, yielding 9.73 g/L; excess substrate resulted in reduced productivity (Figure 4c). Within the range of 0–3 g/L, the supplementation of soybean meal significantly induced γ-PGA production. The abundant amino acids and oligopeptides in soybean meal could be directly assimilated by B. subtilis GB, bypassing the energy-intensive de novo amino acid biosynthesis and thereby accelerating cell growth. Furthermore, rapid conversion of specific amino acids into glutamic acid streamlines the biosynthetic pathway of γ-PGA [37]. Meanwhile, the cell density exhibited a consistent upward trend with increasing soybean meal supplementation (0–7.5 g/L), with OD600nm rising from 12.43 to 17.46. However, when the supplementation exceeded 3 g/L, the balance between cell growth and γ-PGA production might be disrupted. It was hypothesized that excessive biomass led to oxygen limitation in the fermentation broth, resulting in the shutdown of the γ-PGA biosynthetic pathway. This observation aligned with the previous studies that γ-PGA synthesis in B. subtilis was a stress-resistance mechanism [38,39].

3.5. Fermentation Optimization for γ-PGA Production Using Response Surface Methodology (RSM)

The effect of glucose, L-MSGW and soybean meal on the yields of γ-PGA were optimized. Based on the above results, soybean meal (3 g/L), L-MSGW (40%, v/v) and glucose (25 g/L) were best for γ-PGA accumulation by B. subtilis GB. The optimization of soybean meal (A), L-MSGW (B) and glucose (C) was further analyzed by response surface methodology. Experimental results regarding γ-PGA yield and responding parameter settings are shown in Table 1. According to the experimental design, 16 fermentation runs were conducted, and the final γ-PGA yield of each run was determined. The γ-PGA yield ranged from 6.02 g/L to 12.55 g/L. The highest concentration of γ-PGA (12.55 g/L) was obtained under conditions when soybean meal concentration, L-MSGW addition proportion and glucose levels were set at 3 g/L, 40% (v/v), 25 g/L. In contrast, the minimum yield of γ-PGA (6.02 g/L) was observed when the soybean meal concentration was 1.5 g/L, the L-MSGW proportion was 50% (v/v), and the glucose levels was 35 g/L.
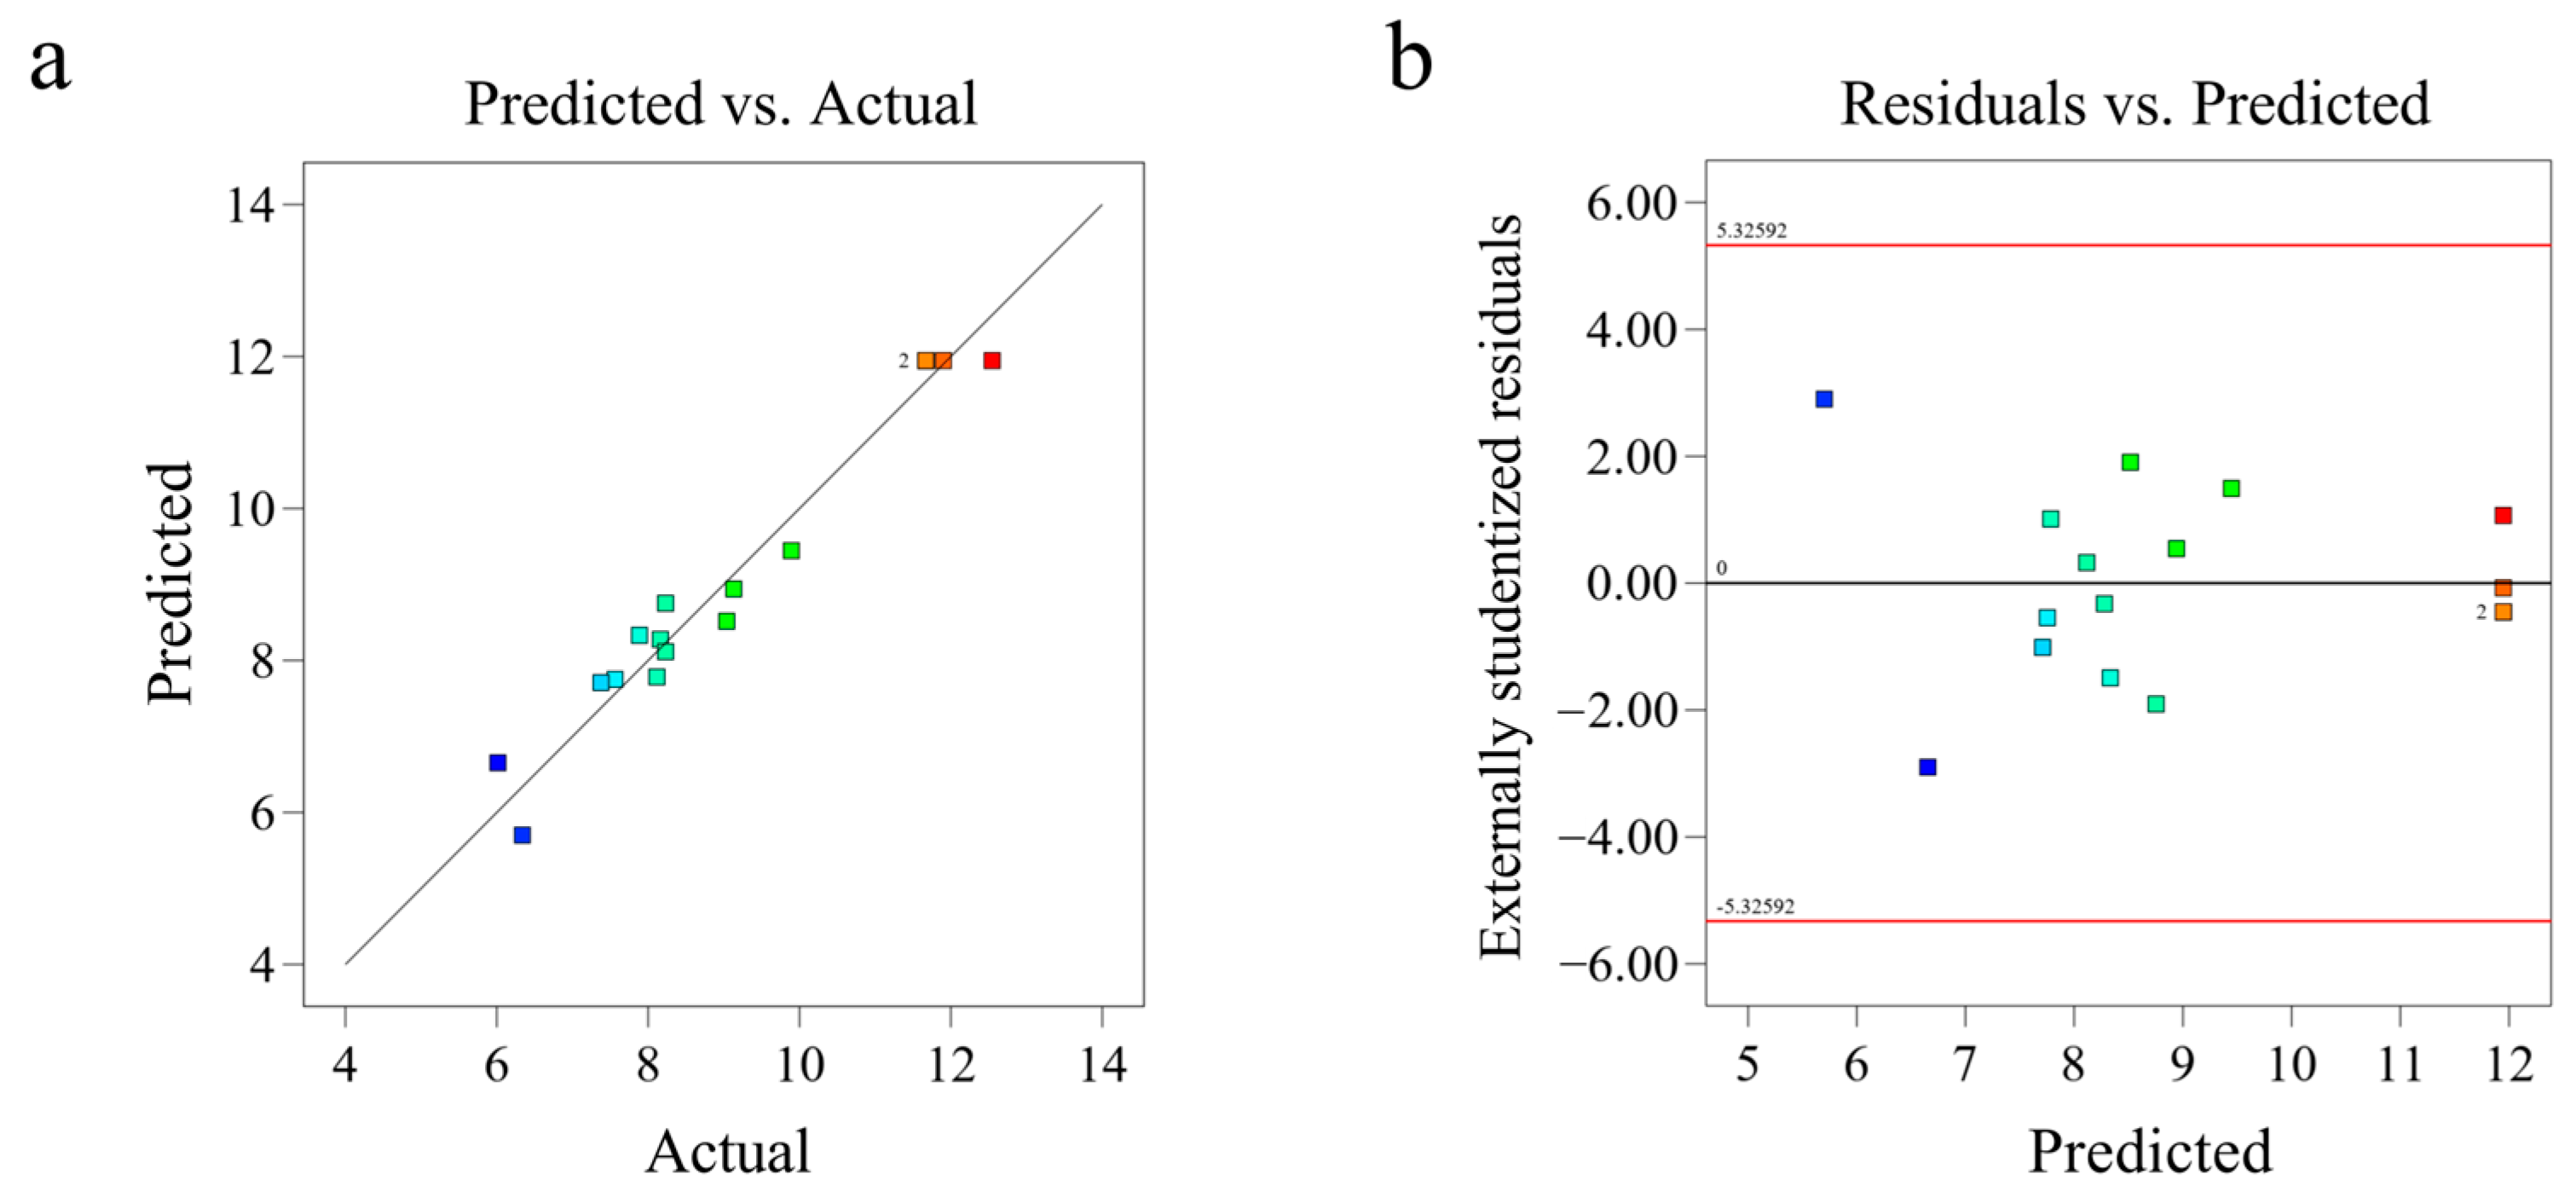
The above experimental data were subjected to analysis of variance (ANOVA) and regression analysis using Design-Expert 13 software. The adequacy of the developed model was evaluated by ANOVA, and the results are presented in Table 2. The model exhibited a p-value below 0.01, confirming its statistical significance, and demonstrating that the interactions among soybean meal concentration, L-MSGW ratio, and glucose levels played a crucial role in γ-PGA production. Additionally, the lack-of-fit was not statistically significant (p-value = 0.1412 > 0.05) indicating the model was well-calibrated. The model exhibited a high coefficient of determination (R2 = 0.9573) and a substantial adjusted R2 (0.8931), indicating the excellent fit and predictive robustness of the regression model. As shown in Figure 5a, a significant linear correlation was observed between the predicted and experimental values. Figure 5b illustrated that the residuals were independent and remained within control limits. These results underscored the validity of the model for accurately predicting γ-PGA yields by B. subtilis GB during fermentation. To optimize γ-PGA production by B. subtilis GB, a second-order polynomial regression model was fitted to the experimental data using Design-Expert 13 to quantify the effects of soybean meal concentration (A, g/L), L-MSGW ratio (B, %), and glucose concentration (C, g/L) on yield (Y). The coefficients in the following equation were obtained from the fitted regression model: Y = 11.95 − 0.3375 × A + 0.2192 × B + 0.2567 × C − 0.1269 × AB − 0.0750 × AC − 0.7846 × BC − 0.9375 × A2 − 2.25 × B2 − 2.75 × C2.
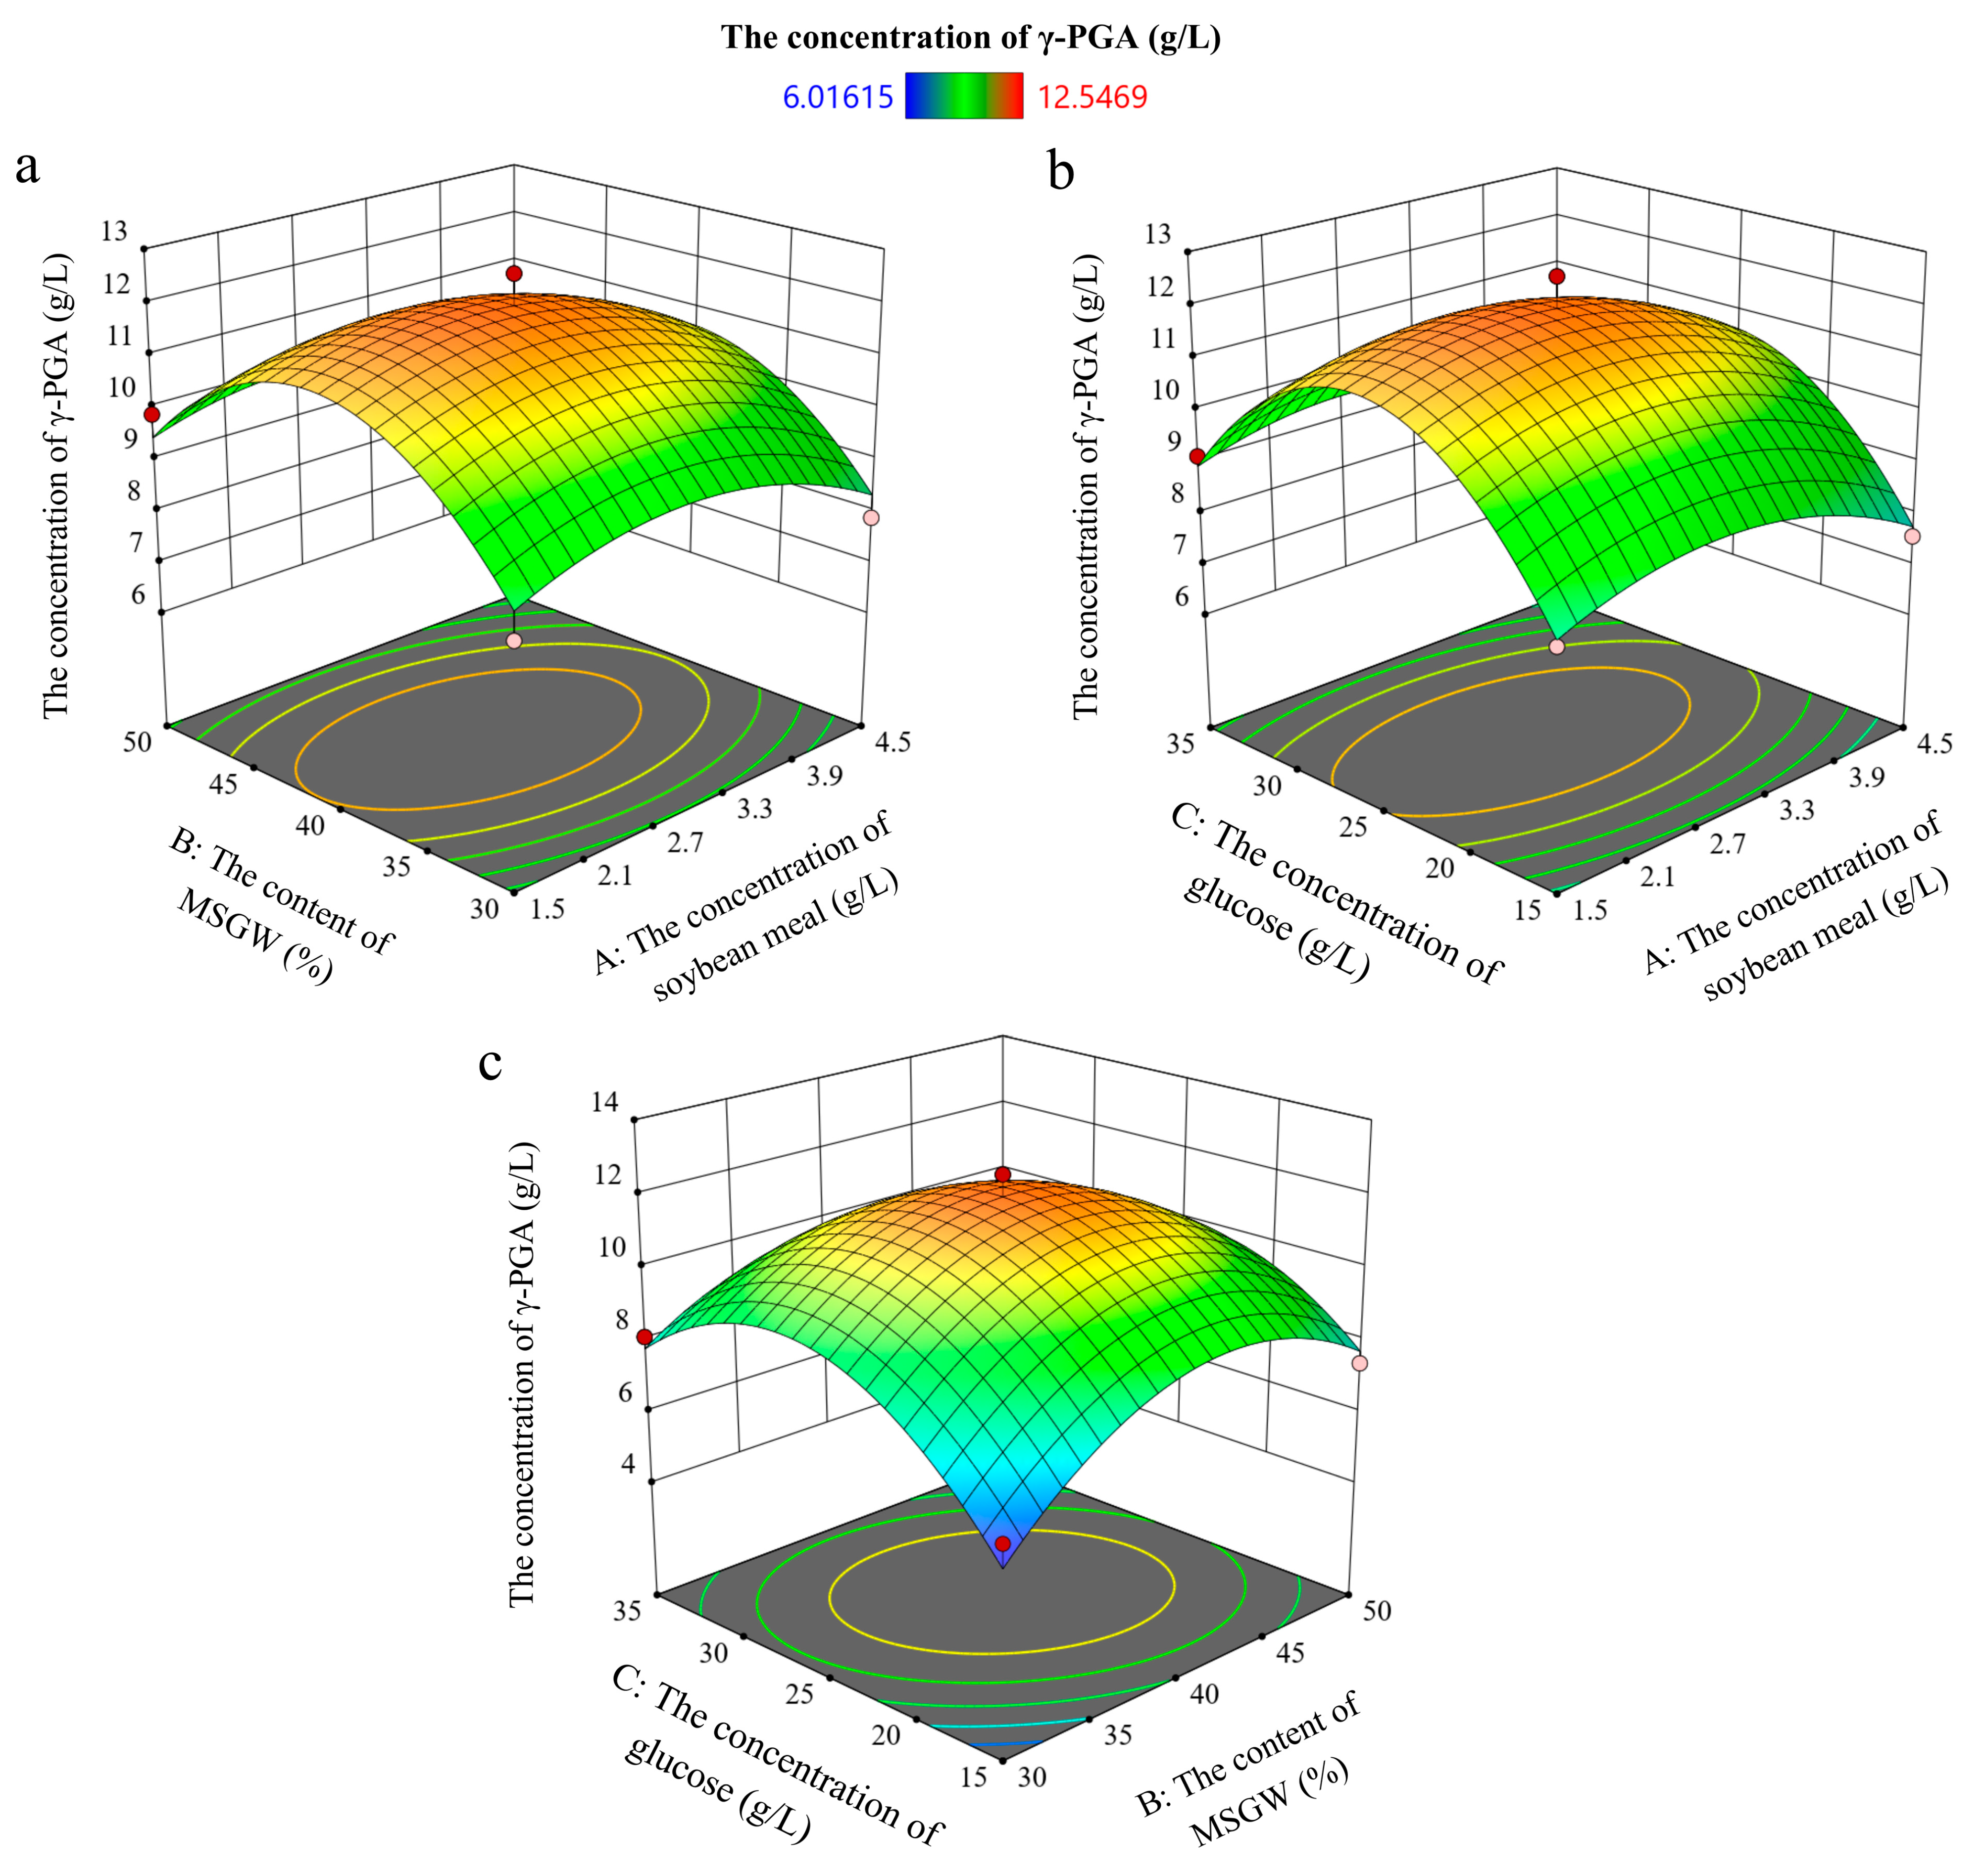
In order to elucidate the individual and interactive effects of the variables on γ-PGA yield, three-dimensional (3D) response surface plots were generated based on the regression model exhibited in Figure 6. The overall surfaces exhibited a convex shape, indicating the presence of a maximum value [40]. Combined with contour plot analysis, panels (A) and (B) display elliptical contours aligned with the coordinate axes, indicating non-significant interactions (p > 0.1). In contrast, the inclined elliptical contours in panel C suggest a marginal interaction between L-MSGW addition and glucose concentration (0.05 < p < 0.1). Based on the steepness of response surface slopes, the relative importance of variables ranked as: L-MSGW proportion > soybean meal concentration (Figure 6a), glucose concentration > soybean meal concentration (Figure 6b), and glucose concentration > L-MSGW proportion (Figure 6c). According to the RSM model, the predicted maximum yield of γ-PGA would be achieved as 11.989 g/L under the following optimized conditions: the soybean meal concentration of 2.724 g/L, the L-MSGW addition of 40.461%, and the glucose concentration of 25.427 g/L. To validate the predictions, triplicate fermentation experiments were conducted using this optimized medium. The average experimental γ-PGA yield was 11.632 ± 1.162 g/L, which was close to the predicted value. Compared with the γ-PGA yield of 7.12 g/L reported in a previous study using L-MSGW as the fermentation substrate [4], the yield obtained in the present study increased by approximately 63.4%. It was confirmed that the established RSM model was robust and could serve as a reliable tool for guiding and optimizing the fermentation by B. subtilis GB.

3.6. Enhancement of γ-PGA Production at Bioreactor Scale

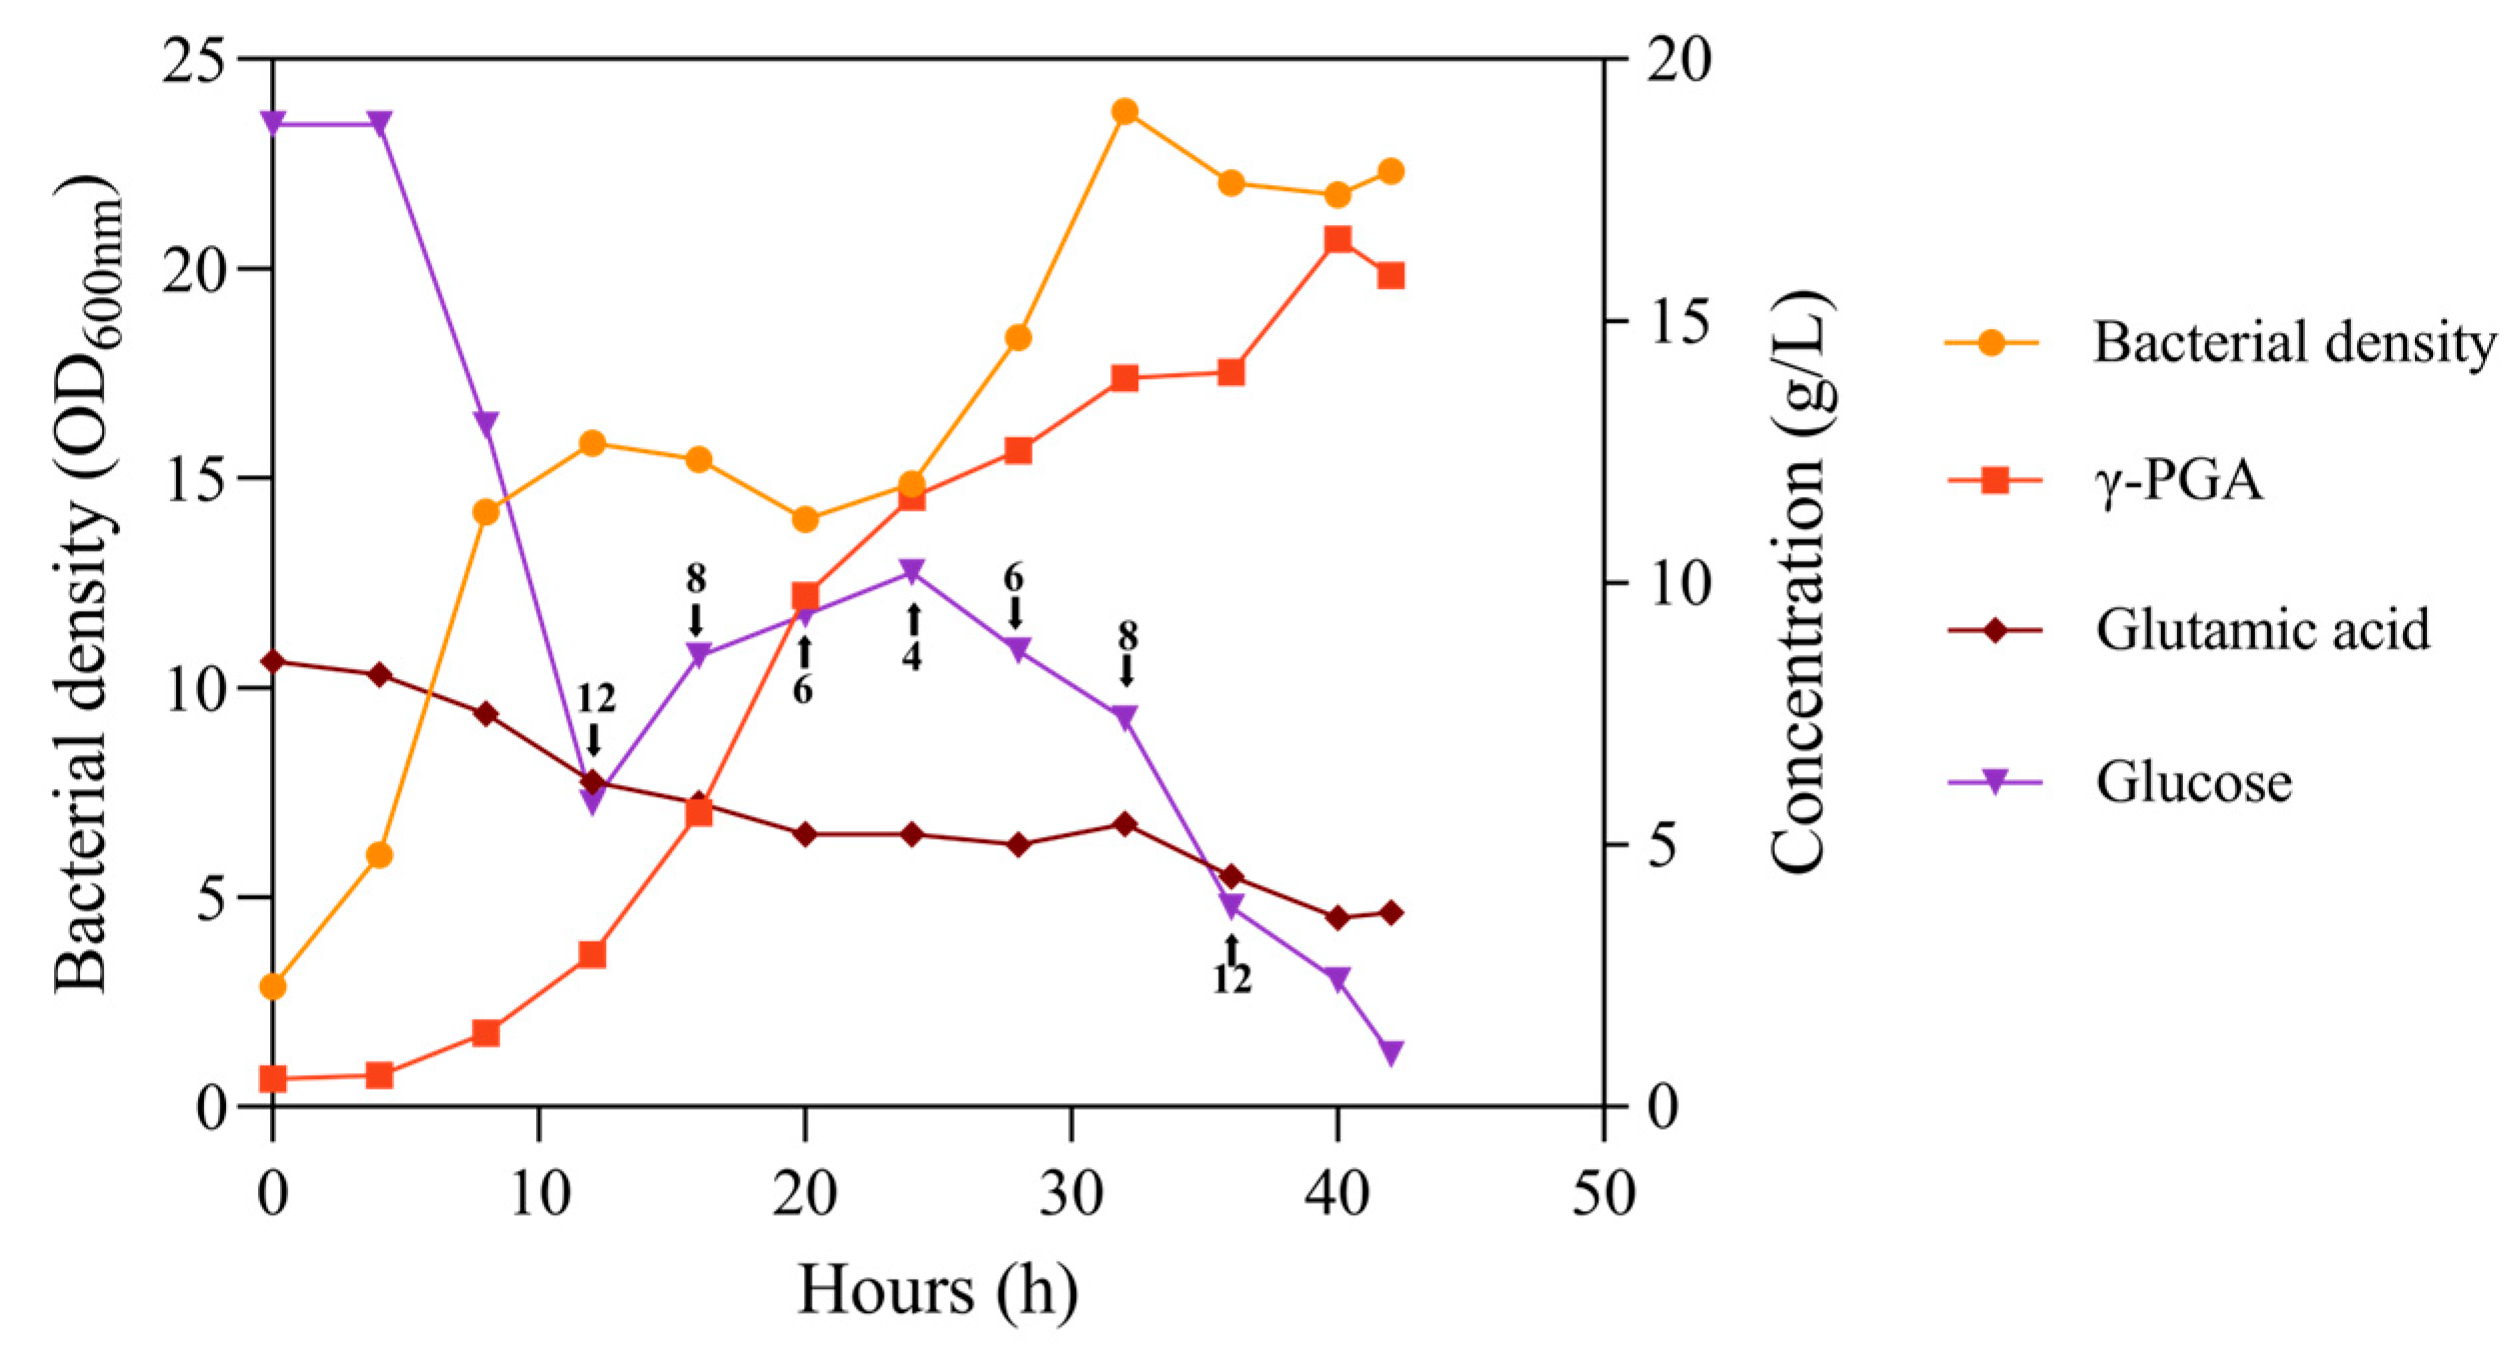
To validate the applicability of the optimized fermentation medium for γ-PGA production at a larger scale, fermentation of B. subtilis GB was conducted in a 5 L bioreactor. From an economic perspective, a 50% (w/v) glucose mother liquor (the liquid remaining after glucose crystallization) was utilized as a carbon source for both medium preparation and fed-batch supplementation. The amount of glucose mother liquor added was adjusted according to its glucose content, ensuring that the final glucose concentration was consistent with the optimized glucose concentration obtained from response surface methodology. The fermentation profile revealed distinct phases (Figure 7). During the first 12 h, the strain exhibited vigorous growth with high glucose consumption, yet low γ-PGA accumulation (2.90 g/L), suggesting that metabolic flux was primarily channeled into biomass formation. Subsequently (12–24 h), cell growth slowed as resources were redirected towards γ-PGA synthesis, driving the titer to 11.64 g/L. This clearly indicated that the peak of product formation lagged behind the growth peak, which is a typical characteristic of microbial secondary metabolism [41]. Notably, a second growth peak (OD600nm = 23.76) emerged between 24 and 32 h, which was possibly triggered by the addition of glucose alleviating carbon limitation and shifting metabolic flux.
In this study, the optimized medium supported the maximum yield of γ-PGA at 16.57 g/L at 40 h of fermentation, which showed a 38% increase compared with that of the shaker flask, and this demonstrated that the optimum culture conditions obtained by the RSM analysis supported the enhanced production of γ-PGA in a bioreactor. Intriguingly, the concentration of glutamic acid (Glu), the precursor for γ-PGA synthesis, declined steadily at a constant rate throughout the fermentation, independent of cell growth or production dynamics. Furthermore, when γ-PGA production peaked at 16.57 g/L, the Glu consumption was only 4.9 g/L. It was evident that the supplied Glu was insufficient to account for total production. This implied that B. subtilis GB might possess an intrinsic metabolic pathway for Glu synthesis from complex carbon sources de novo, which was similar to B. subtilis KH2 reported by Tian et al. [32]. Therefore, the isolate B. subtilis GB provides a promising route for the high-value utilization of L-MSGW, coupling low concentration expenses with high conversion efficiency.

4. Conclusions

In this study, the feasibility of converting L-MSGW, a high-salinity and low-economic-value byproduct, into high-value γ-PGA was successfully demonstrated. A novel halotolerant strain, B. subtilis GB, capable of thriving under extreme (NH4)2SO4 stress (up to 160 g/L), exhibited remarkable growth in L-MSGW with minimal pretreatment. The optimal fermentation conditions for B. subtilis GB were identified using single-factor experiments and RSM analysis. The highest yield (11.632 g/L) of γ-PGA, which was 1.7-fold higher than the previous studies, was achieved under the following optimized conditions: 50 mL culture broth in 250 mL flasks, consisting of 2.724 g/L soybean meal, 40.461% (v/v) L-MSGW, and 25.427 g/L glucose. The optimized medium was further confirmed in a 5 L bioreactor, and the maximum yield γ-PGA was 16.57 g/L for 40 h fermentation, while requiring only negligible supplement of exogenous Glu (4.9 g/L). Crucially, this study overcomes the limitations of relying on high-glutamate feedstocks, and demonstrates that direct fermentation of the challenging L-MSGW is viable. This finding highlights the adaptability and potential of the B. subtilis GB strain to efficiently utilize low-glutamate L-MSGW for γ-PGA production. It not only establishes a cost-effective paradigm for biopolymer production but also provides a theoretical foundation for the resource recovery of industrial effluents plagued by high salt concentrations, which may be helpful in promoting the value of industrial wastewater.

Supplementary Materials

The following supporting information can be downloaded at: https://www.mdpi.com/article/10.3390/fermentation12090395/s1, Figure S1: Results of the preliminary strain screening; Table S1: Factors and levels for Box–Behnken design; Table S2: Results of Box–Behnken design; Table S3: Phenotypic characteristics of strain GB.

Author Contributions

Conceptualization, Z.D.; Methodology, C.S., X.L., Q.Z., L.Z. and X.Z.; Validation, C.S., X.L. and Q.Z.; Investigation, R.Y., D.B., R.K. and L.Z.; Formal analysis, C.S., Q.Z., R.K. and L.Z.; Resources, R.Y., D.B. and X.Z.; Data curation, C.S. and R.K.; Writing—original draft preparation, C.S. and X.L.; Writing—review and editing, X.L., X.Z. and W.J.; Visualization, C.S.; Supervision, Z.D., X.Z. and W.J.; Project administration, Z.D. All authors have read and agreed to the published version of the manuscript.

Funding

This work was supported by the National Key Research and Development Program of China (2021YFC2103003).

Institutional Review Board Statement

Not applicable.

Informed Consent Statement

Not applicable.

Data Availability Statement

The data presented in this study are available on request from the corresponding author due to privacy restrictions imposed by COFCO Nutrition and Health Research Institute.

Conflicts of Interest

Authors Chengyue Sun, Xiaomeng Liu, Qiulong Zou, Roujia Kang, Lei Zhang, and Ziyuan Ding were employed by COFCO Nutrition and Health Research Institute; authors Ruwen Yang, Dixiang Bing, and Xianlong Zhou were employed by COFCO Biotechnology Co., Ltd. The remaining authors declare that the research was conducted in the absence of any commercial or financial relationships that could be construed as a potential conflict of interest.

Abbreviations

The following abbreviations are used in this manuscript:
L-MSGWLow-glutamic-acid monosodium glutamate wastewater
γ-PGAγ-Polyglutamic acid
MSGWMonosodium glutamate wastewater
CODChemical oxygen demand
BODBiochemical oxygen demand
DODissolved oxygen
ANOVAAnalysis of variance
GluGlutamic acid

References

  1. Yang, Q.; Yang, M.; Zhang, S.; Lv, W. Treatment of wastewater from a monosodium glutamate manufacturing plant using successive yeast and activated sludge systems. Process Biochem. 2005, 40, 2483–2488. [Google Scholar] [CrossRef] [Scilit]
  2. Zhuang, Y.; Su, Q.; Wang, H.; Wu, C.; Tong, S.; Zhang, J.; Qiao, H. Strain Screening and Conditions Optimization in Microalgae-Based Monosodium Glutamate Wastewater (MSGW) Treatment. Water 2023, 15, 1663. [Google Scholar] [CrossRef] [Scilit]
  3. Qiu, B.; Shao, Q.; Shi, J.; Yang, C.; Chu, H. Application of biochar for the adsorption of organic pollutants from wastewater: Modification strategies, mechanisms and challenges. Sep. Purif. Technol. 2022, 300, 121925. [Google Scholar] [CrossRef] [Scilit]
  4. Yu, F.; Zhao, C.; Su, L.; Zhang, S.; Sun, X.; Li, K.; Yue, Q.; Zhao, L. Treatment and high value utilization of glutamic acid wastewater. Prep. Biochem. Biotechnol. 2022, 52, 1119–1133. [Google Scholar] [CrossRef] [Scilit] [PubMed]
  5. Li, W.; Cui, Z.; Han, F. Current Status and Prospects of Resource Utilization of Wastewater in the Monosodium Glutamate Industry. Renew. Resour. Circ. Econ. 2014, 7, 34–38. [Google Scholar] [CrossRef]
  6. Shen, G. Concentrating and extracting the ammonium sulfate mother liquor from monosodium glutamate wastewater to produce organic and inorganic fertilizers. Ferment. Technol. Newsl. 2006, 35, 30–31. [Google Scholar] [CrossRef]
  7. Liu, L.; Li, T.; Wei, X.; Jiang, B.; Fang, P. Effects of a nutrient additive on the density of functional bacteria and the microbial community structure of bioorganic fertilizer. Bioresour. Technol. 2014, 172, 328–334. [Google Scholar] [CrossRef] [Scilit] [PubMed]
  8. Gu, W.; Chen, J.; Mei, R. Advanced treatment technology for high-concentration nitrogen-containing monosodium glutamate wastewater. Ind. Water Treat. 2009, 29, 83–86. [Google Scholar] [CrossRef]
  9. Huo, Q.; Li, R.; Chen, C.; Wang, C.; Long, T.; Liu, X. Study on potential microbial community to the waste water treatment from bauxite desilication process. Environ. Sci. Pollut. Res. 2023, 30, 15438–15453. [Google Scholar] [CrossRef] [Scilit] [PubMed]
  10. Ren, J.; Li, X.; Zhang, W.; Li, Z.; Wang, Q.; Li, S.; Wang, S.; Li, H. Evaluation of application potential of dye-decolorizing peroxidase from Bacillus amyloliquefaciens in bioremediation of paper and pulp mill effluent. Front. Microbiol. 2022, 13, 1031853. [Google Scholar] [CrossRef] [Scilit] [PubMed]
  11. Park, S.A.; Bhatia, S.K.; Park, H.A.; Kim, S.Y.; Sudheer, P.D.V.N.; Yang, Y.-H.; Choi, K.-Y. Bacillus subtilis as a robust host for biochemical production utilizing biomass. Crit. Rev. Biotechnol. 2021, 41, 827–848. [Google Scholar] [CrossRef] [Scilit] [PubMed]
  12. Sha, Y.; Sun, T.; Qiu, Y.; Zhu, Y.; Zhan, Y.; Zhang, Y.; Xu, Z.; Li, S.; Feng, X.; Xu, H. Investigation of Glutamate Dependence Mechanism for Poly-γ-glutamic Acid Production in Bacillus subtilis on the Basis of Transcriptome Analysis. J. Agric. Food Chem. 2019, 67, 6263–6274. [Google Scholar] [CrossRef] [Scilit] [PubMed]
  13. Shih, I.-L.; Van, Y.-T. The production of poly-(γ-glutamic acid) from microorganisms and its various applications. Bioresour. Technol. 2001, 79, 207–225. [Google Scholar] [CrossRef] [Scilit] [PubMed]
  14. Wang, G.; Liu, Q.; Yang, Y.M.; Lee, S.U.; Han, J.S.; Jang, K.J.; Kang, D.Y.; Sp, N.; Li, Z.; Tong, T. Applications and Functions of γ-Poly-Glutamic Acid and its Derivatives in Medicine. Curr. Pharm. Biotechnol. 2021, 22, 1404–1411. [Google Scholar] [CrossRef] [Scilit] [PubMed]
  15. Li, S.-H.; Yang, C.-H.; Yi, X.-X.; Zheng, F.-X.; Du, X.-Z.; Sheng, F. Influence of γ-PGA on greenhouse gas emissions and grain yield from paddy rice under different rice varieties. Sci. Total Environ. 2024, 948, 174649. [Google Scholar] [CrossRef] [Scilit] [PubMed]
  16. Wei, L.; Cheng, L.; Guo, F.; Wu, F.; Wang, Y. Influence of Biochar and Modified Polyglutamic Acid Co-Coated Urea on Crop Growth and Nitrogen Budget in Rice Fields. Agriculture 2024, 14, 2212. [Google Scholar] [CrossRef] [Scilit]
  17. Ma, H.; Li, C.; Xiao, N.; Liu, J.; Li, P.; Xu, J.; Yan, J.; Zhang, S.; Xia, T. Heterologous synthesis of poly-γ-glutamic acid enhanced drought resistance in maize (Zea mays L.). Int. J. Biol. Macromol. 2024, 273, 133179. [Google Scholar] [CrossRef] [Scilit] [PubMed]
  18. Fu, Y.; Wang, S.; Gao, S.; Wang, S.; Gao, Z.; He, Z. Effect of a Superabsorbent Polymer (Poly-Gamma-Glutamic Acid) on Water and Salt Transport in Saline Soils under the Influence of Multiple Factors. Polymers 2022, 14, 4056. [Google Scholar] [CrossRef] [Scilit] [PubMed]
  19. Zhang, X.; Cai, J.; Wang, C.; Jiang, Z.; Li, H.; Wang, Z.; Jiang, Y.; Zhang, Y. The Effects of Different Soil Fertilization Methods on Soil Improvement and Vegetation Restoration in Desertified Grasslands of Northern Liaoning. J. Appl. Ecol. 2024, 35, 55–61. [Google Scholar] [CrossRef] [Scilit] [PubMed]
  20. Sawada, K.; Hagihara, H.; Takimura, Y.; Kataoka, M. Production and molecular weight variation of poly-γ-glutamic acid using a recombinant B. subtilis with various Pgs-component ratios. Biosci. Biotechnol. Biochem. 2024, 88, 1217–1224. [Google Scholar] [CrossRef] [Scilit] [PubMed]
  21. Zhang, L.; Zhang, L.; Wang, L.; Wei, Z.; Li, J.; Zhou, Y.; Ding, F.; Gao, J.; Shi, Y. Identification and Optimization of Fermentational Condition of γ-Polyglutamic Acid Producing Strain. Sci. Technol. Food Ind. 2020, 41, 64–71. [Google Scholar] [CrossRef]
  22. Ruan, W.; Yang, J.; Yao, J.; Cao, X.; Wei, Q.; Lu, Y.; Sun, D. Screening a novel γ-polyglutamic acid producing strain and optimization of its culture medium. China Brew. 2011, 30, 66–69. [Google Scholar] [CrossRef]
  23. Ripa, F.A.; Tong, S.; Cao, W.D.; Wang, E.T.; Wang, T.; Liu, H.C.; Gao, J.L.; Sun, J.G. Paenibacillus rhizophilus sp. nov., a nitrogen-fixing bacterium isolated from the rhizosphere of wheat (Triticum aestivum L.). Int. J. Syst. Evol. Microbiol. 2019, 69, 3689–3695. [Google Scholar] [CrossRef] [Scilit] [PubMed]
  24. Vandamme, P.; Pot, B.; Gillis, M.; de Vos, P.; Kersters, K.; Swings, J. Polyphasic taxonomy, a consensus approach to bacterial systematics. Microbiol. Rev. 1996, 60, 407–438. [Google Scholar] [CrossRef] [PubMed]
  25. Kim, M.; Oh, H.S.; Park, S.C.; Chun, J. Towards a taxonomic coherence between average nucleotide identity and 16S rRNA gene sequence similarity for species demarcation of prokaryotes. Int. J. Syst. Evol. Microbiol. 2014, 64, 346–351. [Google Scholar] [CrossRef] [Scilit] [PubMed]
  26. Fox, G.E.; Wisotzkey, J.D.; Jurtshuk, P., Jr. How close is close: 16S rRNA sequence identity may not be sufficient to guarantee species identity. Int. J. Syst. Bacteriol. 1992, 42, 166–170. [Google Scholar] [CrossRef] [Scilit] [PubMed]
  27. Rodríguez, M.; Reina, J.C.; Béjar, V.; Llamas, I. Paenibacillus lutrae sp. nov., A Chitinolytic Species Isolated from A River Otter in Castril Natural Park, Granada, Spain. Microorganisms 2019, 7, 637. [Google Scholar] [CrossRef] [Scilit] [PubMed]
  28. Li, Q.; Li, Y.; Liu, X.; Chen, S. Paenibacillus sinensis sp. nov., a nitrogen-fixing species isolated from plant rhizospheres. Antonie Van Leeuwenhoek 2022, 115, 7–18. [Google Scholar] [CrossRef] [Scilit] [PubMed]
  29. Chun, J.; Bae, K.S. Phylogenetic analysis of Bacillus subtilis and related taxa based on partial gyrA gene sequences. Antonie Van Leeuwenhoek 2000, 78, 123–127. [Google Scholar] [CrossRef] [Scilit] [PubMed]
  30. Zhang, D.; Feng, X.; Zhou, Z.; Zhang, Y.; Xu, H. Economical production of poly(γ-glutamic acid) using untreated cane molasses and monosodium glutamate waste liquor by Bacillus subtilis NX-2. Bioresour. Technol. 2012, 114, 583–588. [Google Scholar] [CrossRef] [Scilit] [PubMed]
  31. Zeng, W.; Li, W.; Shu, L.; Yi, J.; Chen, G.; Liang, Z. Non-sterilized fermentative co-production of poly(γ-glutamic acid) and fibrinolytic enzyme by a thermophilic Bacillus subtilis GXA-28. Bioresour. Technol. 2013, 142, 697–700. [Google Scholar] [CrossRef] [Scilit] [PubMed]
  32. Tian, Y.; Hu, R.; Zhang, R.; Yan, G.; Zhang, Y.; Hu, J.; Zhao, S.; Ju, J.; Yu, B.; Wang, L. Engineering of Bacillus subtilis KH2 for effective production of poly-γ-glutamic acid from glutamate waste based on transcriptomics. Int. J. Biol. Macromol. 2026, 338, 149708. [Google Scholar] [CrossRef] [Scilit] [PubMed]
  33. Sun, J.-D.; Tang, C.; Zhou, J.; Wei, P.; Wang, Y.-J.; An, W.; Yan, Z.-Y.; Yong, X.-Y. Production of poly-γ-glutamic acid (γ-PGA) from xylose-glucose mixtures by Bacillus amyloliquefaciens C1. 3 Biotech 2021, 11, 100. [Google Scholar] [CrossRef] [Scilit] [PubMed]
  34. Völker, F.; Hoffmann, K.; Halmschlag, B.; Maaß, S.; Büchs, J.; Blank, L.M. Citrate Supplementation Modulates Medium Viscosity and Poly-γ-Glutamic Acid Synthesis by Engineered B. subtilis 168. Eng. Life Sci. 2025, 25, e70009. [Google Scholar] [CrossRef] [Scilit] [PubMed]
  35. Yan, D.; Huang, L.; Mei, Z.; Bao, H.; Xie, Y.; Yang, C.; Gao, X. Untargeted metabolomics revealed the effect of soybean metabolites on poly(γ-glutamic acid) production in fermented natto and its metabolic pathway. J. Sci. Food Agric. 2024, 104, 1298–1307. [Google Scholar] [CrossRef] [Scilit] [PubMed]
  36. Zhang, C.; Wu, D.; Ren, H. Economical production of agricultural γ-polyglutamic acid using industrial wastes by Bacillus subtilis. Biochem. Eng. J. 2019, 146, 117–123. [Google Scholar] [CrossRef] [Scilit]
  37. Hsueh, Y.H.; Huang, K.Y.; Kunene, S.C.; Lee, T.Y. Poly-γ-glutamic Acid Synthesis, Gene Regulation, Phylogenetic Relationships, and Role in Fermentation. Int. J. Mol. Sci. 2017, 18, 2644. [Google Scholar] [CrossRef] [Scilit] [PubMed]
  38. Nguyen, S.L.T.; Inaoka, T.; Kimura, K. Poly-γ-glutamic acid production by Bacillus subtilis (natto) under high salt conditions. Jpn. Agric. Res. Q. JARQ 2018, 52, 249–253. [Google Scholar] [CrossRef] [Scilit]
  39. Song, Y.; Zhang, Y.; He, M.; Liu, H.; Hu, C.; Yang, L.; Yu, P. Enhancing the production of poly-γ-glutamate in Bacillus subtilis ZJS18 by the heat-and osmotic shock and its mechanism. Prep. Biochem. Biotechnol. 2020, 50, 1023–1030. [Google Scholar] [CrossRef] [Scilit] [PubMed]
  40. Zhang, S.; Jiang, Z.; An, S.; Jiang, X.; Zhang, Y. Optimization of fermentation conditions for physcion production of Aspergillus chevalieri BYST01 by response surface methodology. PeerJ 2024, 12, e18380. [Google Scholar] [CrossRef] [Scilit] [PubMed]
  41. Moimenta, A.R.; Troitiño-Jordedo, D.; Henriques, D.; Contreras-Ruíz, A.; Minebois, R.; Morard, M.; Barrio, E.; Querol, A.; Balsa-Canto, E. An integrated multiphase dynamic genome-scale model explains batch fermentations led by species of the Saccharomyces genus. mSystems 2025, 10, e0161524. [Google Scholar] [CrossRef] [Scilit] [PubMed]
Figure 1. (a) Colony morphology of B. subtilis GB on LB solid medium; (b) optical microscopy image of B. subtilis GB after Gram staining, with the black scale bar indicating 20 μm; (c) phylogenetic tree of B. subtilis GB based on the 16S rRNA gene. The scale corresponds to 0.01 estimated nucleotide substitutions per sequence position. Bootstrap values from 1000 replicates; (d) phylogenetic tree of B. subtilis GB based on the gyrA gene. The scale corresponds to 0.002 estimated nucleotide substitutions per sequence position. Bootstrap values from 1000 replicates.
Fermentation 12 00395 g001
Figure 2. (a) Cell density of B. subtilis GB after 24 h of cultivation in LB medium supplemented with different concentrations of (NH4)2SO4; (b) cell density of B. subtilis GB after 24 h of cultivation in LB medium supplemented with different concentrations of NaCl.
Fermentation 12 00395 g002
Figure 3. (a) Cell density of B. subtilis GB after 48 h of fermentation in media containing different proportions of L-MSGW; (b) γ-PGA concentration produced by B. subtilis GB after 48 h of fermentation in media containing different proportions of L-MSGW. Different lowercase letters above the bars indicate significant differences among treatments (p < 0.05).
Fermentation 12 00395 g003
Figure 4. Effects of different factors on γ-PGA production by B. subtilis GB during fermentation in L-MSGW: (a) effect of soybean meal supplementation on γ-PGA yield; (b) effect of addition proportion of L-MSGW on γ-PGA yield; (c) effect of glucose supplementation on γ-PGA yield. Different lowercase letters above the bars indicate significant differences among treatments (p < 0.05).
Fermentation 12 00395 g004
Figure 5. Production of γ-PGA via microbial fermentation by B. subtilis GB. (a) Actual concentration of γ-PGA vs predicted response. (b) Residual diagnostic analysis of concentration of γ-PGA. The color gradient represents the concentration (g/L) of γ-PGA, ranging from 6.01615 (blue) to 12.5469 (red), with intermediate colors indicating intermediate concentration values.
Fermentation 12 00395 g005
Figure 6. 3D surface plot of concentration of γ-PGA showing interaction of various variable pairs on fermentation process of B. subtilis GB for γ-PGA production. (a) Interaction effect of the concentration of soybean meal and the addition proportion of L-MSGW, (b) interaction effect of the concentration of soybean meal and the concentration of glucose, and (c) interaction effect of the addition proportion of L-MSGW and the concentration of glucose.
Fermentation 12 00395 g006
Figure 7. B. subtilis GB fermentation in a 5 L fermenter for the production of γ-PGA. Curves showing the changes in bacterial density, γ-PGA production, glutamic acid consumption and glucose consumption during the fermentation process. The arrows and numbers indicate the amount of glucose solution that was started to be infused at that moment, with the unit being mL/h.
Fermentation 12 00395 g007
Table 1. Results of response surface optimization experiment.
RunSoybean Meal (A)L-MSGW (B)Glucose (C)Concentration of γ-PGA (g/L)
11109.04
200012.55
31−107.89
401−17.38
500011.90
6−1−108.23
7−1019.13
80−1−16.34
900011.67
10−1109.89
1110−17.56
12−10−18.16
131018.23
1400011.67
150116.02
160−118.12
Table 2. The analysis of variance results of the regression model.
SourceSum of SquaresdfMean SquareF-Valuep-Value
Model58.0696.4514.930.0019
A0.911210.91122.110.1967
B0.384510.38450.88980.3819
C0.527310.52731.220.3116
AB0.064410.06440.14910.7127
AC0.022510.02250.05210.8271
BC2.4612.465.70.0542
A23.5213.528.140.0291
B220.2120.246.740.0005
C229.98129.9869.370.0002
Residual2.5960.4321--
Lack of Fit2.0830.69244.030.1412
Pure Error0.515530.1718--
Cor Total60.6515---
Note: “-” indicates not applicable.
Disclaimer/Publisher’s Note: The statements, opinions and data contained in all publications are solely those of the individual author(s) and contributor(s) and not of MDPI and/or the editor(s). MDPI and/or the editor(s) disclaim responsibility for any injury to people or property resulting from any ideas, methods, instructions or products referred to in the content.