Article

Effects of Cold Fermentation and Cold Storage on Type I Sourdough and Bread Properties

Department of Food Engineering, Faculty of Chemical and Metallurgical Engineering, Yildiz Technical University, Istanbul 34210, Türkiye
*
Authors to whom correspondence should be addressed.
Fermentation 2026, 12(8), 388; https://doi.org/10.3390/fermentation12080388
Submission received: 3 July 2026 / Revised: 11 August 2026 / Accepted: 13 August 2026 / Published: 18 August 2026
(This article belongs to the Special Issue Biotechnology for Smarter Industrial Fermentation)

Abstract

The aim of this study is to provide an alternative bakery practice by evaluating the effects of cold fermentation (backslopping at 7 and 15 °C) and cold storage (stored at 7 and 15 °C) after backslopping on Type I sourdough characteristics and the technological performance of the corresponding breads. Sourdough characteristics (pH, acidity, and microbial counts), bread quality (texture and color), storage behavior, and volatile compound profiles (VoC) were investigated to compare the extent to which these treatments improve product quality. No significant difference was observed in pH and total titratable acidity among the sourdoughs. However, the fermentation quotient of the cold storage group was higher than that of the cold fermented group. Backslopping at cold fermentation temperatures (7 and 15 °C) caused a significant reduction in lactic acid bacteria counts. Conversely, cold fermentation and cold storage at 15 °C led to a significant increase in yeast counts. From a technological perspective, bread produced with sourdough backslopped at 15 °C exhibited a higher specific volume than breads produced with the other cold-treated sourdoughs. At the end of the storage period, the bread made with cold-backslopped sourdough at 7 °C had the highest hardness value, while others remained similar. Principal component analysis (PCA) of volatile compounds revealed that cold-stored sourdoughs were clustered apart from room-temperature-stored sourdoughs, mainly driven by ethyl hexanoate and hexyl acetate. Heptanoic acid was among the key VOCs contributing to the positioning of breads made with cold-stored sourdoughs in the PCA. In conclusion, these findings demonstrate that backslopping and storage at 15 °C offer an industrially relevant production strategy while improving textural properties and VoC profiles.

1. Introduction

Sourdough is a traditional ingredient obtained by fermenting flour and water with lactic acid bacteria (LAB) and yeasts, which serves to improve the quality of bakery products [1,2]. The use of sourdough improves bread texture, enriches its flavor and aroma profile, extends its shelf life by delaying staling, and provides protection against microbial spoilage [3]. De Vuyst et al. [4] classified sourdough into three main types depending on the production technology and the inoculum used. Type I sourdoughs are fermented by the microbiota originating from the environment and the flour, and their viability is typically maintained through continuous backslopping at room temperature (approximately 10–25 °C). Type II (industrial) sourdoughs are produced using selected starter cultures under controlled conditions, whereas Type III sourdoughs are dried sourdough preparations derived from Type I or Type II sourdoughs, in which microbial activity is largely absent, making them suitable primarily for flavor enhancement rather than fermentation.
Fermentation temperature is one of the most fundamental environmental factors that drives the growth and metabolic activities of lactic acid bacteria and yeasts, and consequently, the final characteristics of the bread [5]. Although refrigerated fermentation and delayed proofing are commonly applied in the baking industry to improve production flexibility and facilitate overnight processing, these practices also influence microbial metabolism and flavor formation. Therefore, the impact of low-temperature fermentation on aroma development and overall bread quality has become an important focus of recent scientific research [6].
When examining existing cold application examples in the literature, it is evident that low temperatures have significant effects on both the microbiota and the volatile organic compound (VOC) profile of the sourdough. Low-temperature fermentation plays a direct role in aroma development; indeed, Belloli et al. [7] compared sourdough fermentation at 15 °C and 25 °C and reported that sourdough breads produced at 15 °C reached the highest level of acceptability by panelists due to increased levels of aromatic volatile compounds. Similarly, Xu et al. [6], in their study conducted at 10 °C, 20 °C, and 30 °C, revealed that low-temperature fermentation at 10 °C significantly increased the accumulation of volatile compounds such as acetic acid, 1-octen-3-one, and various esters in the sourdough. Liszkowska and Berlowska [8] also reported that cold fermentation of wheat dough performed with lactic acid bacteria and yeasts at 15 °C enriched the natural aroma profile of the bread, particularly by increasing the production of esters with fruity notes. Lowering not only the fermentation temperature but also the backslopping temperature has a direct selective effect on the microbiota [9]. It was found that by reducing the temperature from 30 to 23 °C in continuously backslopped sourdoughs, Leuconostoc citreum became dominant, whereas at higher temperatures (30 and 37 °C), Limosilactobacillus fermentum stood out. On the other hand, for the long-term preservation of sourdoughs, cold storage at low temperatures such as 4 °C and periodic refreshment cycles are also applied [10]. In the related study, the persistence capacity and robustness against cold developed by specific cultures such as Limosilactobacillus fermentum under these cold conditions (4 °C) were evaluated through weekly, three-week, or six-week refreshment cycles.
From a technological perspective, applying low-temperature strategies during Type I sourdough propagation may provide several practical advantages for bakeries. Reducing the fermentation or storage temperature may increase production flexibility, thereby facilitating overnight or weekend operation, and reducing labor associated with frequent refreshments. Such an approach could be particularly attractive for artisan and industrial bakeries seeking to optimize production scheduling while preserving the characteristic properties of traditional Type I sourdough. However, before these strategies can be implemented in practice, their effects on sourdough microbiology, biochemical characteristics, and the technological quality of bread must be comprehensively evaluated.
Although previous studies have provided valuable insights mainly into the behavior of Type II and Type III sourdough systems fermented with defined starter cultures under low-temperature conditions, limited information is available regarding the response of traditionally propagated Type I sourdoughs to different cold fermentation strategies. In artisanal bread making, where Type I sourdoughs are maintained through continuous backslopping, the effects of low-temperature applications on sourdough microbiology, biochemical characteristics, and the technological performance of bread remain insufficiently understood. Furthermore, it is still unclear whether these approaches can provide practical advantages for bakery operations while maintaining sourdough functionality and bread quality. Therefore, the present study aimed to comparatively investigate the effects of two different cold applications, namely cold backslopping and cold storage, on Type I sourdough systems. The two approaches were intentionally designed as distinct technological strategies rather than as temperature-controlled fermentation treatments with identical fermentation histories. Cold backslopping represents repeated propagation of the sourdough microbiota under low-temperature conditions, whereas cold storage represents the preservation of an already mature Type I sourdough prior to bread making. In addition, the study evaluated how these approaches influence the microbiological and biochemical characteristics of sourdough, as well as the technological and physicochemical properties of the resulting breads, thereby providing information regarding their potential applicability in bakery production.

2. Materials and Methods

2.1. Materials

Whole wheat flour (WWF) (10.5% protein, 1.37% ash, and 13.4% moisture) and refined wheat flour (13% protein, 0.53% ash, 13.9% moisture, and 57.5% water absorption) were purchased from Tellioglu Companies Group (Balıkesir, Türkiye). Salt (Billur, İzmir, Türkiye) and fresh yeast (Pakmaya, İzmit, Türkiye) were purchased from a local market. De Man, Rogosa and Sharpe (MRS) agar, Dichloran Rose Bengal Chloramphenicol (DRBC) agar, and Plate Count Agar were used for the enumeration of lactic acid bacteria, yeast, and total aerobic mesophilic bacteria (TAMB), respectively; all media were obtained from Merck (Darmstadt, Germany).

2.2. Methods

2.2.1. Production of Type I Sourdough

Sourdough was prepared by mixing whole wheat flour and water at a dough yield (DY) of 170 (100 g flour and 70 g water). DY was calculated using the following equation: DY (%) = (amount of flour + amount of water) × 100/amount of flour. The dough was fermented at 25 °C and propagated through continuous backslopping for five consecutive days to obtain a mature Type I sourdough (25SD). During each backslopping step, 20% (w/w) mature sourdough was used as inoculum, and fresh flour and water were added to maintain a constant DY of 170. Refreshments were carried out whenever the dough pH reached 3.50.
Cold-backslopped sourdoughs were subsequently prepared using the laboratory-produced Type I sourdough (25SD) as the starter culture. Continuous backslopping was performed at either 7 °C or 15 °C to obtain the 7SD and 15SD sourdoughs, respectively. Cold backslopping at both 7 °C and 15 °C was performed at 24 h intervals. After each 24 h fermentation cycle, 20% (w/w) of the mature sourdough was used to inoculate fresh flour and water (DY 170), and this propagation procedure was repeated for five consecutive days.
To evaluate the effect of storage temperature independently of cold backslopping, mature Type I sourdough (25SD) was additionally stored for 24 h at 25 °C (25SD25S), 15 °C (25SD15S), or 7 °C (25SD7S) prior to analysis. The experimental design and preparation procedure of all sourdough samples are illustrated schematically in Figure 1. Each sourdough was produced three independent times.

2.2.2. Determination of Sourdough Characteristics

pH, Total Titratable Acidity (TTA), and Organic Acids
The pH of sourdoughs was measured using a PL-700 pH meter (EZDO, Taiwan). A total of 10 g of sourdough sample was homogenized with 90 mL of deionized water (Velp Scientifica, Usmate Velate, Italy). TTA was determined as the volume (mL) of 0.1 mol L−1 NaOH required to titrate the mixture to pH 8.5 [6,10].
The organic acid analysis was performed according to a previously published and validated UHPLC methodology that was consistently used in our previous study [11]. A total of 2 g of sourdough sample was weighed into a 15 mL centrifuge tube, and 10 mL of distilled water was added. The mixture was incubated at +4 °C for 15 min, with occasional stirring. It was then centrifuged at 8000 rpm at 4 °C for 20 min. A total of 900 µL of the supernatant was taken into 2 mL microtubes. A total of 900 µL of 80% acetonitrile was added to these tubes and mixed. The sample was then centrifuged at 12,000× g for 20 min (Hettich Universal 320 R, Tuttlingen, Germany). Following supernatant collection, the sample was filtered through a 0.45 μm nylon membrane. The analysis was performed using UHPLC (Thermo, Waltham, MA, USA) equipped with a DAD-3000 (RS) detector and an Aminex HPX-87H (Bio-Rad, Hercules, CA, USA) column (300 × 7.8 mm). The system was operated at an isocratic flow rate of 0.6 mL/min, with a column temperature of 45 °C, and detection at 210 nm, by injecting a 20 µL sample. To calculate organic acid concentrations in the samples, standard solutions of lactic and acetic acids (Sigma-Aldrich Co. Darmstadt, Germany) were prepared between 1 and 5000 ppm and run on the HPLC (R2 ≈ 0.99) [11]. The fermentation quotient (FQ) of sourdough types was calculated as the molar ratio of lactic acid to acetic acid.
Microbiological Counting
A 10 g sourdough sample was homogenized with 90 mL of sterile peptone water (1 g/L). Following serial decimal dilutions, LAB were plated on MRS and incubated at 30 °C for 72 h; yeasts were plated on DRBC and incubated at 30 °C for 72 h; total aerobic mesophilic bacteria (TAMB) were plated on Plate Count Agar and incubated at 37 °C for 48 h [6].

2.2.3. Bread Making Procedures and Storage

Control bread (CB; baker’s yeast bread without sourdough) was prepared using refined wheat flour (100 g), baker’s yeast (2 g), salt (1.5 g), and water (57.5 g). For sourdough breads, mature whole wheat sourdough (DY 170) was incorporated at 20% (w/w, flour basis). Accordingly, each sourdough bread formulation contained 20.0 g mature sourdough, 88.24 g refined wheat flour, 49.26 g added water, 2.0 g baker’s yeast, and 1.5 g salt. The 20.0 g mature sourdough contributed 11.76 g whole wheat flour and 8.24 g water to the formulation. Thus, the total flour (100 g) and total water (57.5 g) contents were maintained constant across the formulations.
All ingredients were mixed in a spiral mixer (Öztiryakiler OM10, Istanbul, Türkiye) for 12 min to achieve optimum dough development. The resulting dough was divided into 161 g pieces and proofed at 30 °C and 90% relative humidity for 30 min (Nuve TK 252, Akyurt, Ankara, Türkiye). After punching and rounding, the doughs underwent a second fermentation for 30 min, followed by sheeting, molding, and panning. Final proofing was performed for 120 min before baking at 200 °C for 55 min (Fimak, Konya, Türkiye). After baking, the loaves were cooled at room temperature for 2 h and stored in low-density polyethylene bags (Koroplast, İstanbul, Türkiye) under ambient conditions (25 ± 2 °C and 55 ± 5% relative humidity) for 0, 4, and 8 days. Bread production for each experimental group (25 °C SD, 7 °C and 15 °C cold backslopping SD, 7 °C and 15 °C cold storage SD, and control bread) was carried out in three independent production runs (biological replicates, n = 3). Each production run yielded two loaves (technical replicates).

2.2.4. Determination of Dough Rheology

The dynamic rheological properties of sourdough and bread dough samples were evaluated using a stress- and temperature-controlled rotational rheometer (Anton Paar MCR 302, Graz, Austria). An amplitude sweep test was first performed to determine the linear viscoelastic region, which was identified as 0.1%. Subsequently, frequency sweep tests were conducted over a range of 0.628–62.8 rad/s at 25 °C. The elastic modulus (G′) and viscous modulus (G″) were measured at 25 °C using a 2 mm gap. Analyses were conducted on 3 independent production runs for each dough.

2.2.5. Determination of Bread Quality

Specific Volume and Texture
Bread volume was determined according to the rapeseed displacement method [12], and specific volume (SV) was expressed as the volume-to-weight ratio (mL/g).
For texture profile analysis (TPA), each bread sample was sliced to a thickness of 1.25 cm and subjected to a compression test using a texture analyzer (SMS TA.XT2 Plus, Godalming, Surrey, UK) equipped with a 5 kg load cell and a 36 mm-diameter cylindrical probe. For each measurement, two slices (each 1.25 cm-thick and 3 × 3 cm in size) taken from the center of the loaf were used. The TPA test was performed at 30% compression, with a pre-test speed of 1.0 mm/s, a test speed of 5.0 mm/s, and a post-test speed of 5.0 mm/s. Six loaves (3 independent production runs × 2 loaves per run) were analyzed for each bread type. The two loaves obtained from each production run were considered technical replicates, and their measurements were averaged before statistical analysis. Thus, the three independent production runs were considered the experimental units for inferential statistical analysis (n = 3).
Color Analysis
Crust and crumb color of bread samples were determined using a chromameter (CR-100, Konica Minolta, Tokyo, Japan), with lightness (L*), redness (a*), and yellowness (b*) values recorded. Color measurements were performed on six loaves (3 independent production runs × 2 loaves per run) for each bread type.
Differential Scanning Calorimetry (DSC)
The thermal behavior in breads was determined using a differential scanning calorimeter (TA Instruments DSC Q20, New Castle, DE, USA). Bread samples (10 mg) were placed in hermetically sealed aluminum pans and heated from 25 °C to 250 °C at a heating rate of 10 °C/min [13]. The analyses were performed in 3 independent production runs for each bread.

2.2.6. Identification of Volatile Compounds

Volatile compounds of sourdough and bread crumb samples were determined by headspace solid-phase microextraction coupled with gas chromatography–mass spectrometry (HS-SPME-GC–MS) according to the method of Plessas et al. [14], with some modifications. Briefly, 2 g of sample was transferred into an SPME vial. Volatile compounds were extracted using a 50/30 μm DVB/Carboxen/PDMS StableFlex SPME fiber (2 cm; Supelco, Bellefonte, PA, USA).
Analyses were performed using a GC–MS system (QP2010, Shimadzu, Kyoto, Japan) equipped with a Stabil-wax capillary column (60 m × 0.32 mm i.d. × 0.25 μm film thickness; Restek, Bellefonte, PA, USA). The oven temperature program consisted of an initial hold at 40 °C for 5 min, followed by heating to 100 °C at 7 °C/min and holding for 5 min, heating to 130 °C at 4 °C/min and holding for 1 min, and finally heating to 180 °C at 2 °C/min with a final hold of 4 min. Helium was used as the carrier gas at a constant flow rate of 3.0 mL/min.
Volatile compounds were identified by comparison of their mass spectra with the Wiley 6 and FFNSC (Flavors and Fragrances of Natural and Synthetic Compounds) mass spectral libraries. The volatile compounds were expressed as relative peak area (%). Each sample was analyzed in duplicate. Volatile compound identification was considered tentative and was based on comparison of the obtained mass spectra with the Wiley 6 and FFNSC spectral libraries.

2.3. Statistical Analysis and Use of Generative Artificial Intelligence

The results are presented as mean ± standard deviation. Statistical analyses were performed using SPSS version 31.0 (IBM Corp., Armonk, NY, USA). Bread production was performed in three independent production runs (n = 3) for each bread type. Two loaves were produced from each independent production run. The two loaves obtained from the same production run were considered technical replicates, whereas the three independent production runs were considered biological replicates. Differences among bread types at each storage time were analyzed separately using one-way analysis of variance (ANOVA) followed by Duncan’s multiple range test. Similarly, differences among storage times within each bread type were analyzed using one-way analysis of variance (ANOVA) followed by Duncan’s multiple range test. Statistical significance was accepted at p < 0.05.
Principal component analysis (PCA) was performed using JMP Pro (Version 17, SAS Inc., Cary, NC, USA) to differentiate sourdough and bread samples based on their volatile compounds. Principal component analysis (PCA) was performed using the mean relative abundance (peak area %) of volatile compounds for each treatment as input data. PCA was used as an exploratory multivariate tool to visualize similarities, differences, and distribution patterns among the average VOC profiles of the treatments and was not used for inferential statistical testing of treatment separation.
A generative artificial intelligence tool (ChatGPT, GPT-5.6 Sol, OpenAI) was used solely to assist in the graphical editing and visual organization of the experimental workflow presented in Figure 1. The AI-assisted output was reviewed and revised by the authors to ensure that it accurately represented the experimental procedures used in the study.

3. Results and Discussion

3.1. Effects of Cold Fermentation and Cold Storage on Type I Sourdough Characteristics

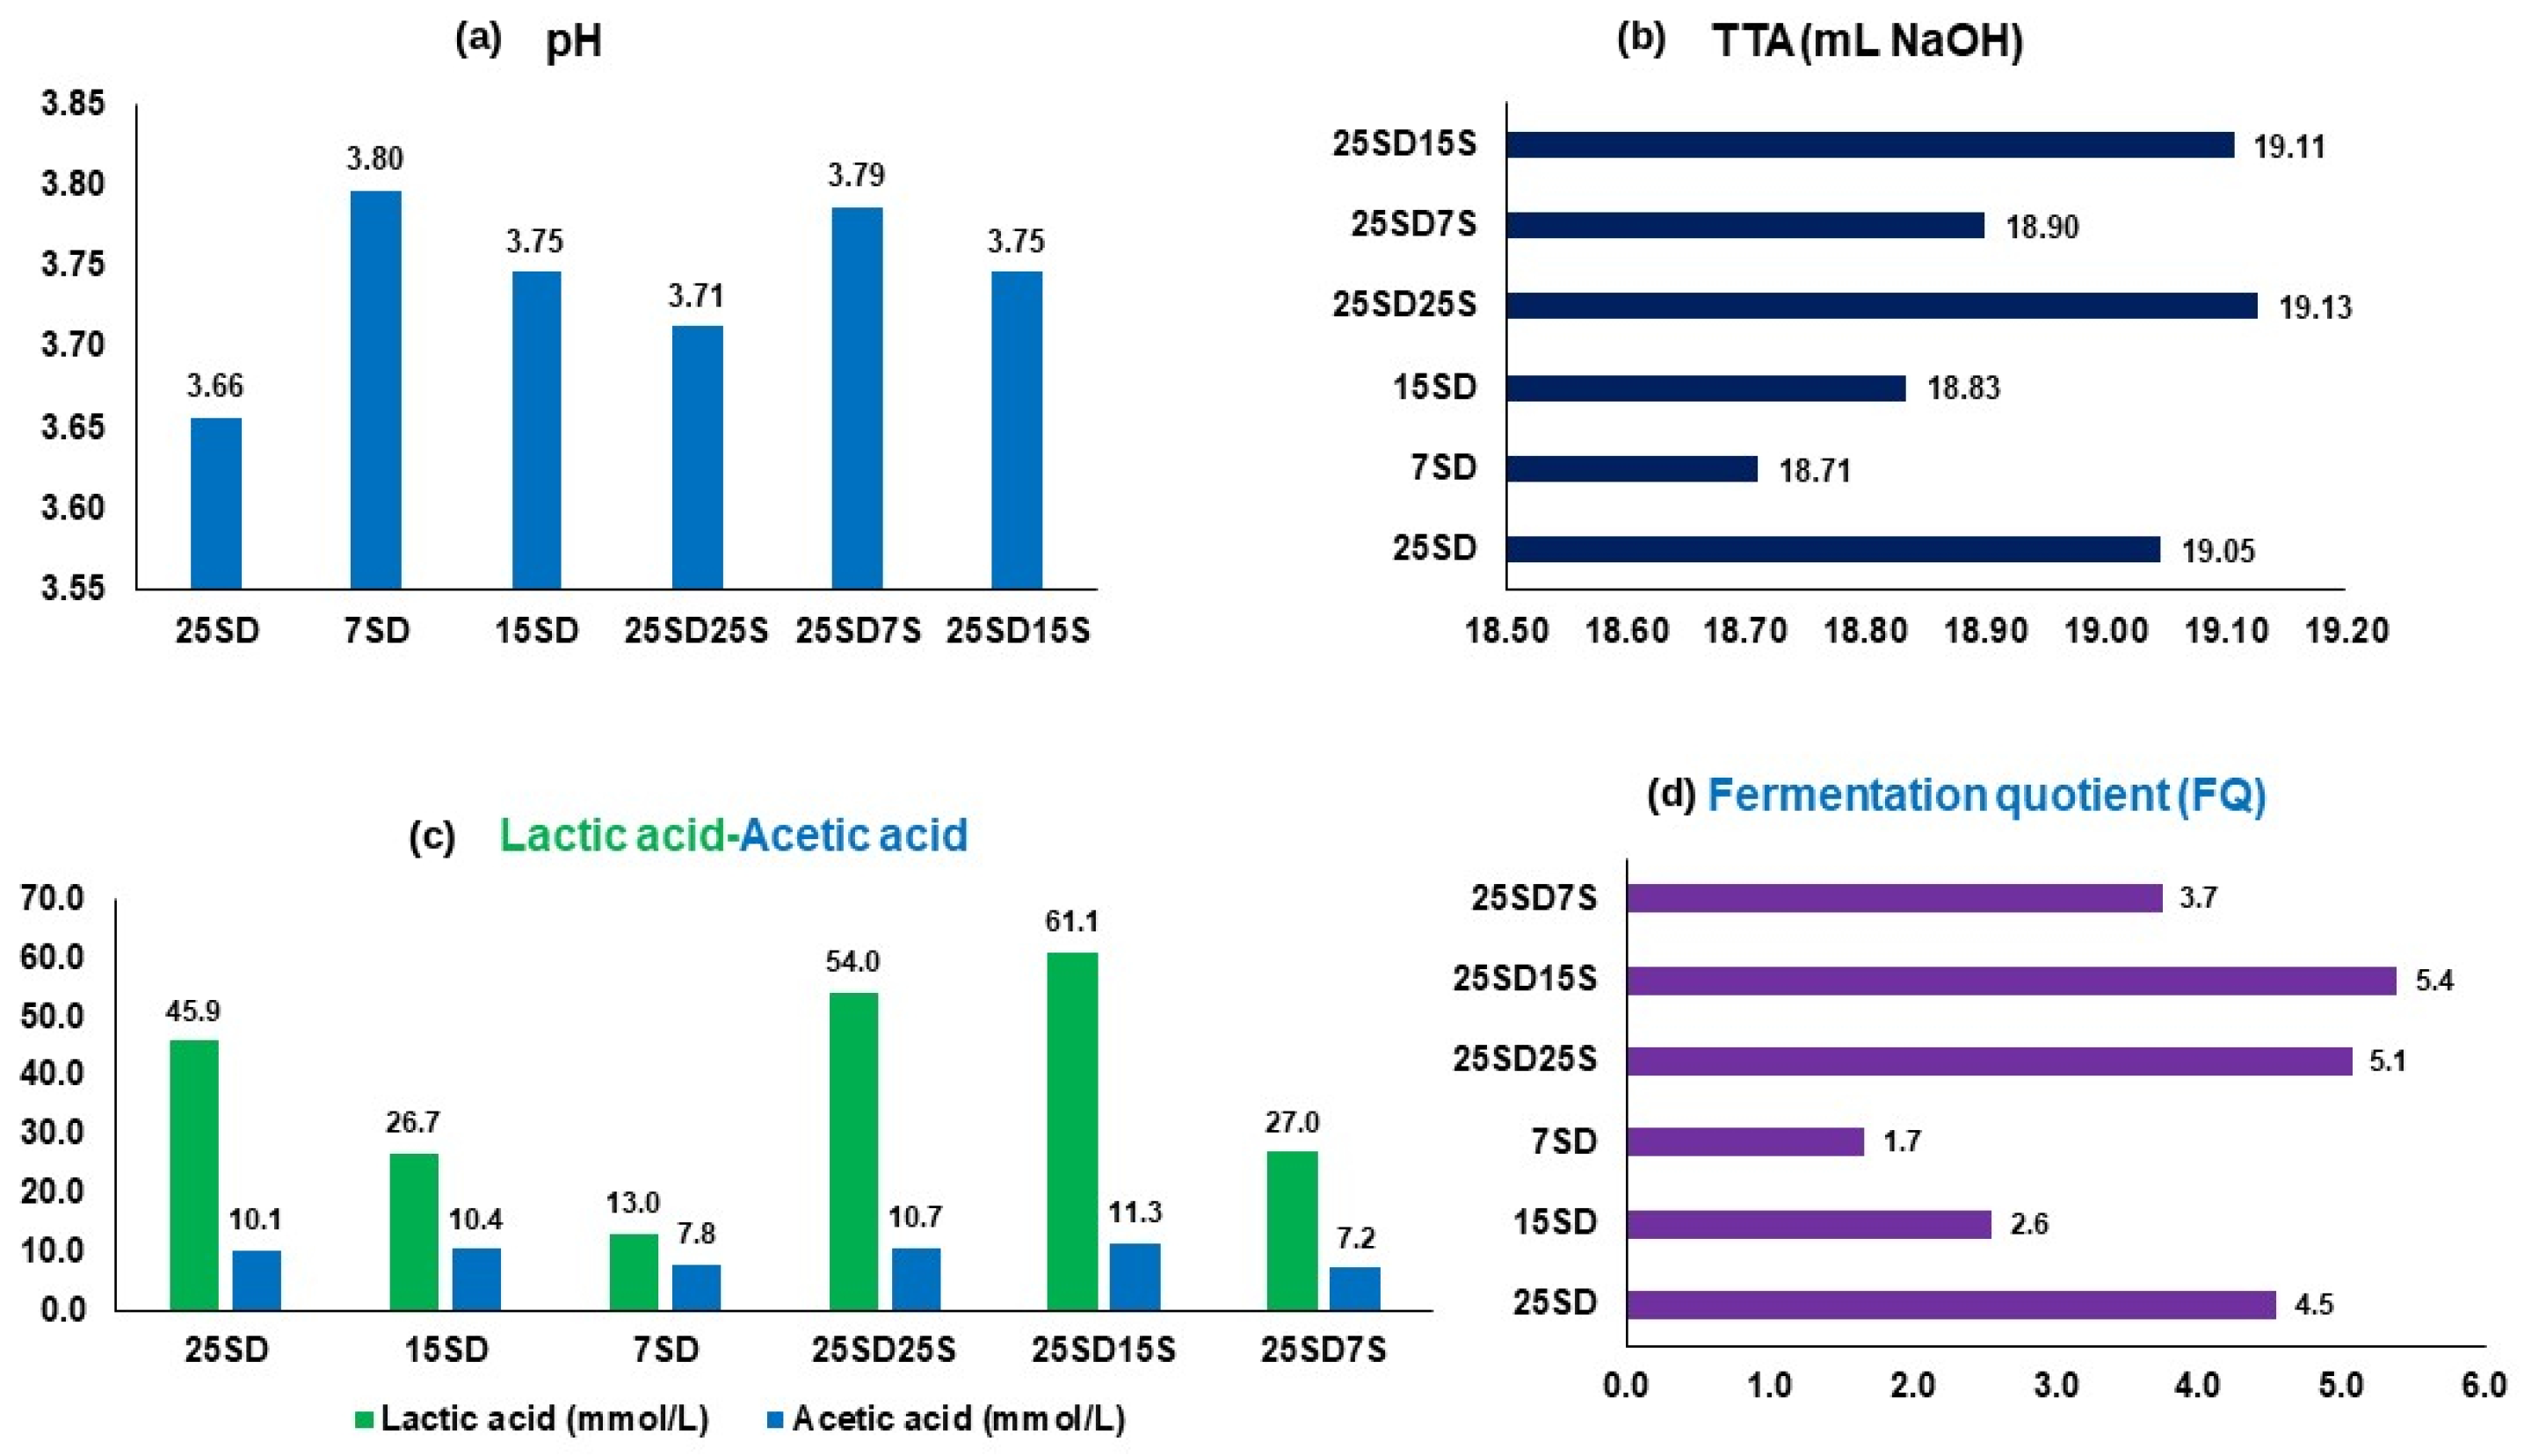
The properties of Type I sourdough produced in this study, regarding pH, TTA, FQ value, LAB, yeast, and TAMB counts, are presented in Figure 2 and Figure 3. Both backslopping at cold temperatures (7 °C and 15 °C) and cold storage after backslopping produced sourdoughs similar to those backslopped and stored at 25 °C in terms of pH and TTA (mL NaOH). The pH values of the samples ranged between 3.66 and 3.80 (Figure 2a). The pH values commonly reported for Type I sourdoughs range between 3.4 and 4.9 [15]. Siepmann et al. [16] reported that decreasing the fermentation temperature from 35 to 28 °C resulted in higher pH values in Type II sourdoughs (p < 0.05). In contrast, Casado et al. [17] observed no significant effect of fermentation temperature (25 and 35 °C) on the final pH of traditional sourdough after 24 h of fermentation. Similarly, Xu et al. [6] demonstrated that fermentation at 10 °C slowed the acidification process, requiring a longer fermentation time to reach the target pH, rather than directly affecting the final pH value itself. These discrepancies among studies are likely related to differences in sourdough type, fermentation conditions, starter cultures, and other technological parameters applied during fermentation [18].
The ratio of lactic acid to acetic acid, defined as the fermentation quotient (FQ), is another parameter used to evaluate sourdough characteristics. The recommended FQ range has been reported as 2.0–2.7 by Hammes and Gänzle [19] and 3.0–5.0 by De Vuyst et al. [20]. In this study, the FQ values of sourdoughs ranged from 1.7 (7SD) to 5.4 (25SD15S), as shown in Figure 2d. The sourdough backslopped at 7 °C (7SD) appeared to be less metabolically active, as indicated by its low TTA and FQ values, whereas the sourdough stored at 7 °C (25SD7S) exhibited higher TTA and FQ. The highest FQ value was obtained in cold-stored sourdough at 15 °C (25SD15S), followed by storage at room temperature (25SD25S), likely due to elevated lactic acid production (Figure 2c,d). Higher backslopping fermentation temperatures resulted in increased FQ values, with 25SD exhibiting a higher FQ than 7SD and 15SD. This finding is consistent with the results of Siepmann et al. [16], who also reported an increase in FQ when the fermentation temperature was raised from 28 °C to 35 °C.
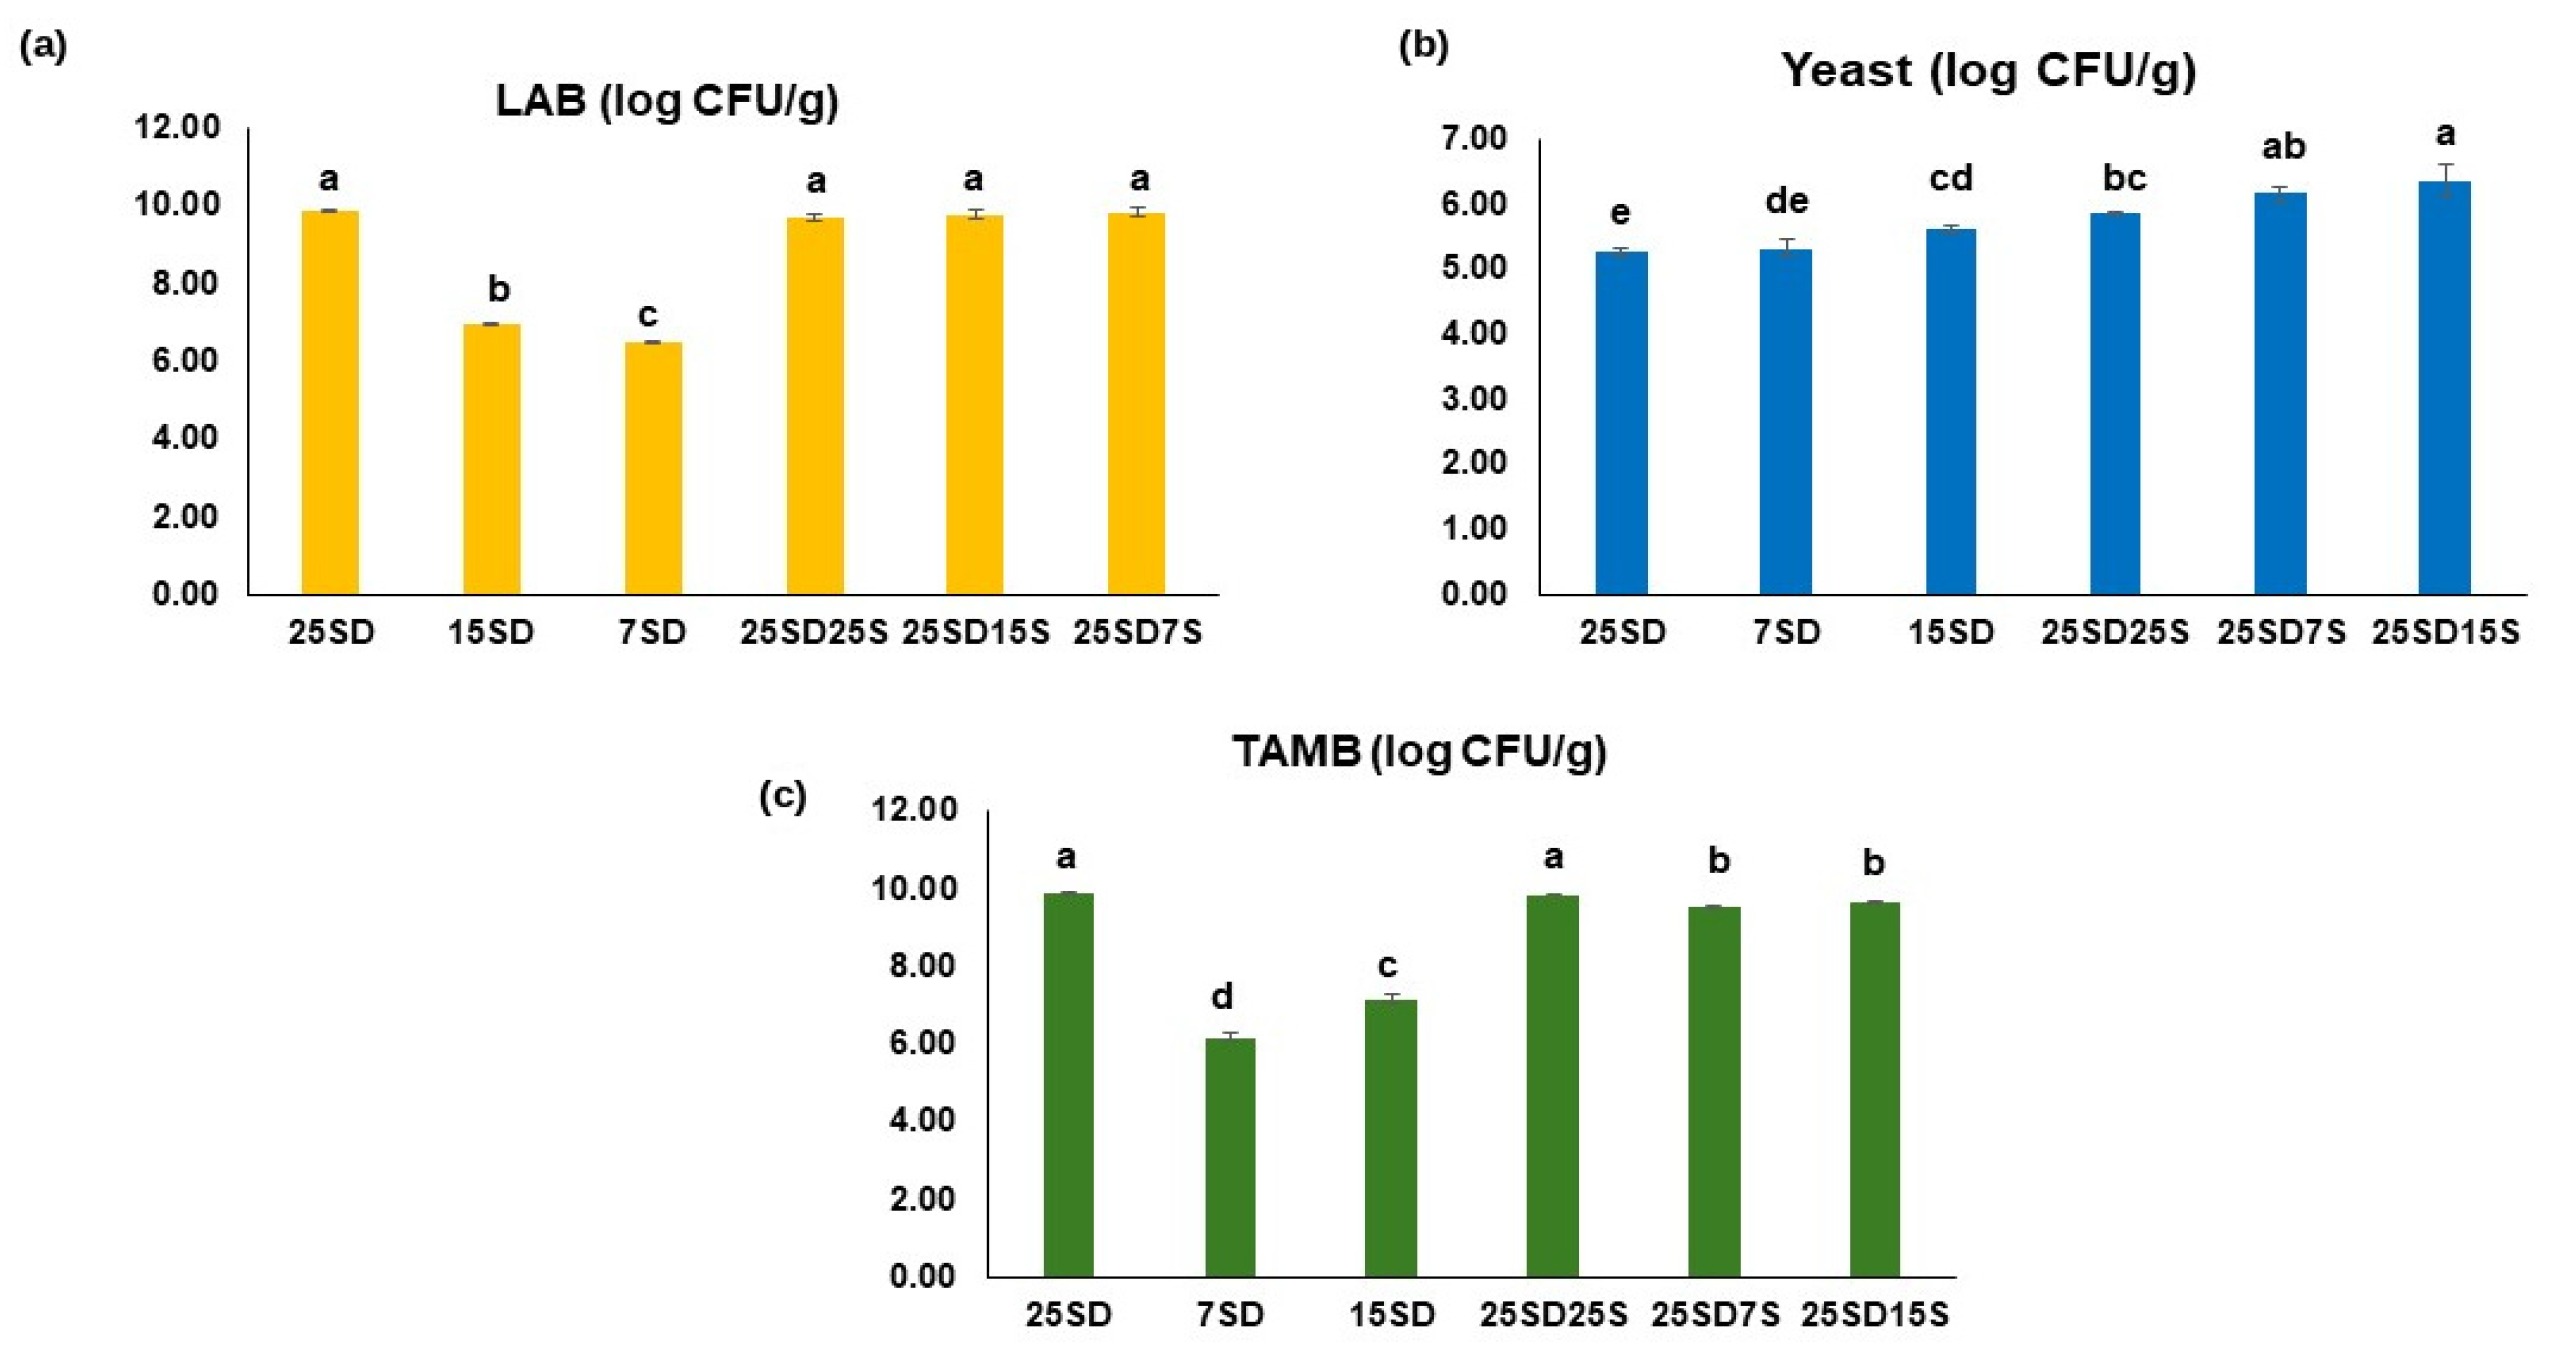
Significant variations were detected in LAB, yeast, and TAMB counts of sourdoughs (Figure 3). Fermentation time, temperature, and the cycle number of backslopping influence microbial growth in sourdough [9]. However, fermentation temperatures between 10 °C and 30 °C had no major effect on the microbial population in a study by Xu et al. [6] on cold fermentation of Type II sourdough. In the current study, cold backslopping reduced LAB counts, with the lowest observed at 7 °C (p < 0.05), whereas cold storage had no significant effect (Figure 3a). Yeast counts increased under cold storage conditions (p < 0.05) when compared to sourdough (25SD) and cold-backslopped sourdough (Figure 3b). This observation may suggest the presence of yeast populations that were better able to persist under the applied storage conditions [8]; however, microbial community analyses would be required to confirm this hypothesis. Both cold storage and backslopping conditions resulted in lower TAMB counts compared to 25SD (Figure 3c).

3.2. Rheological Behavior of Sourdough and Bread Dough

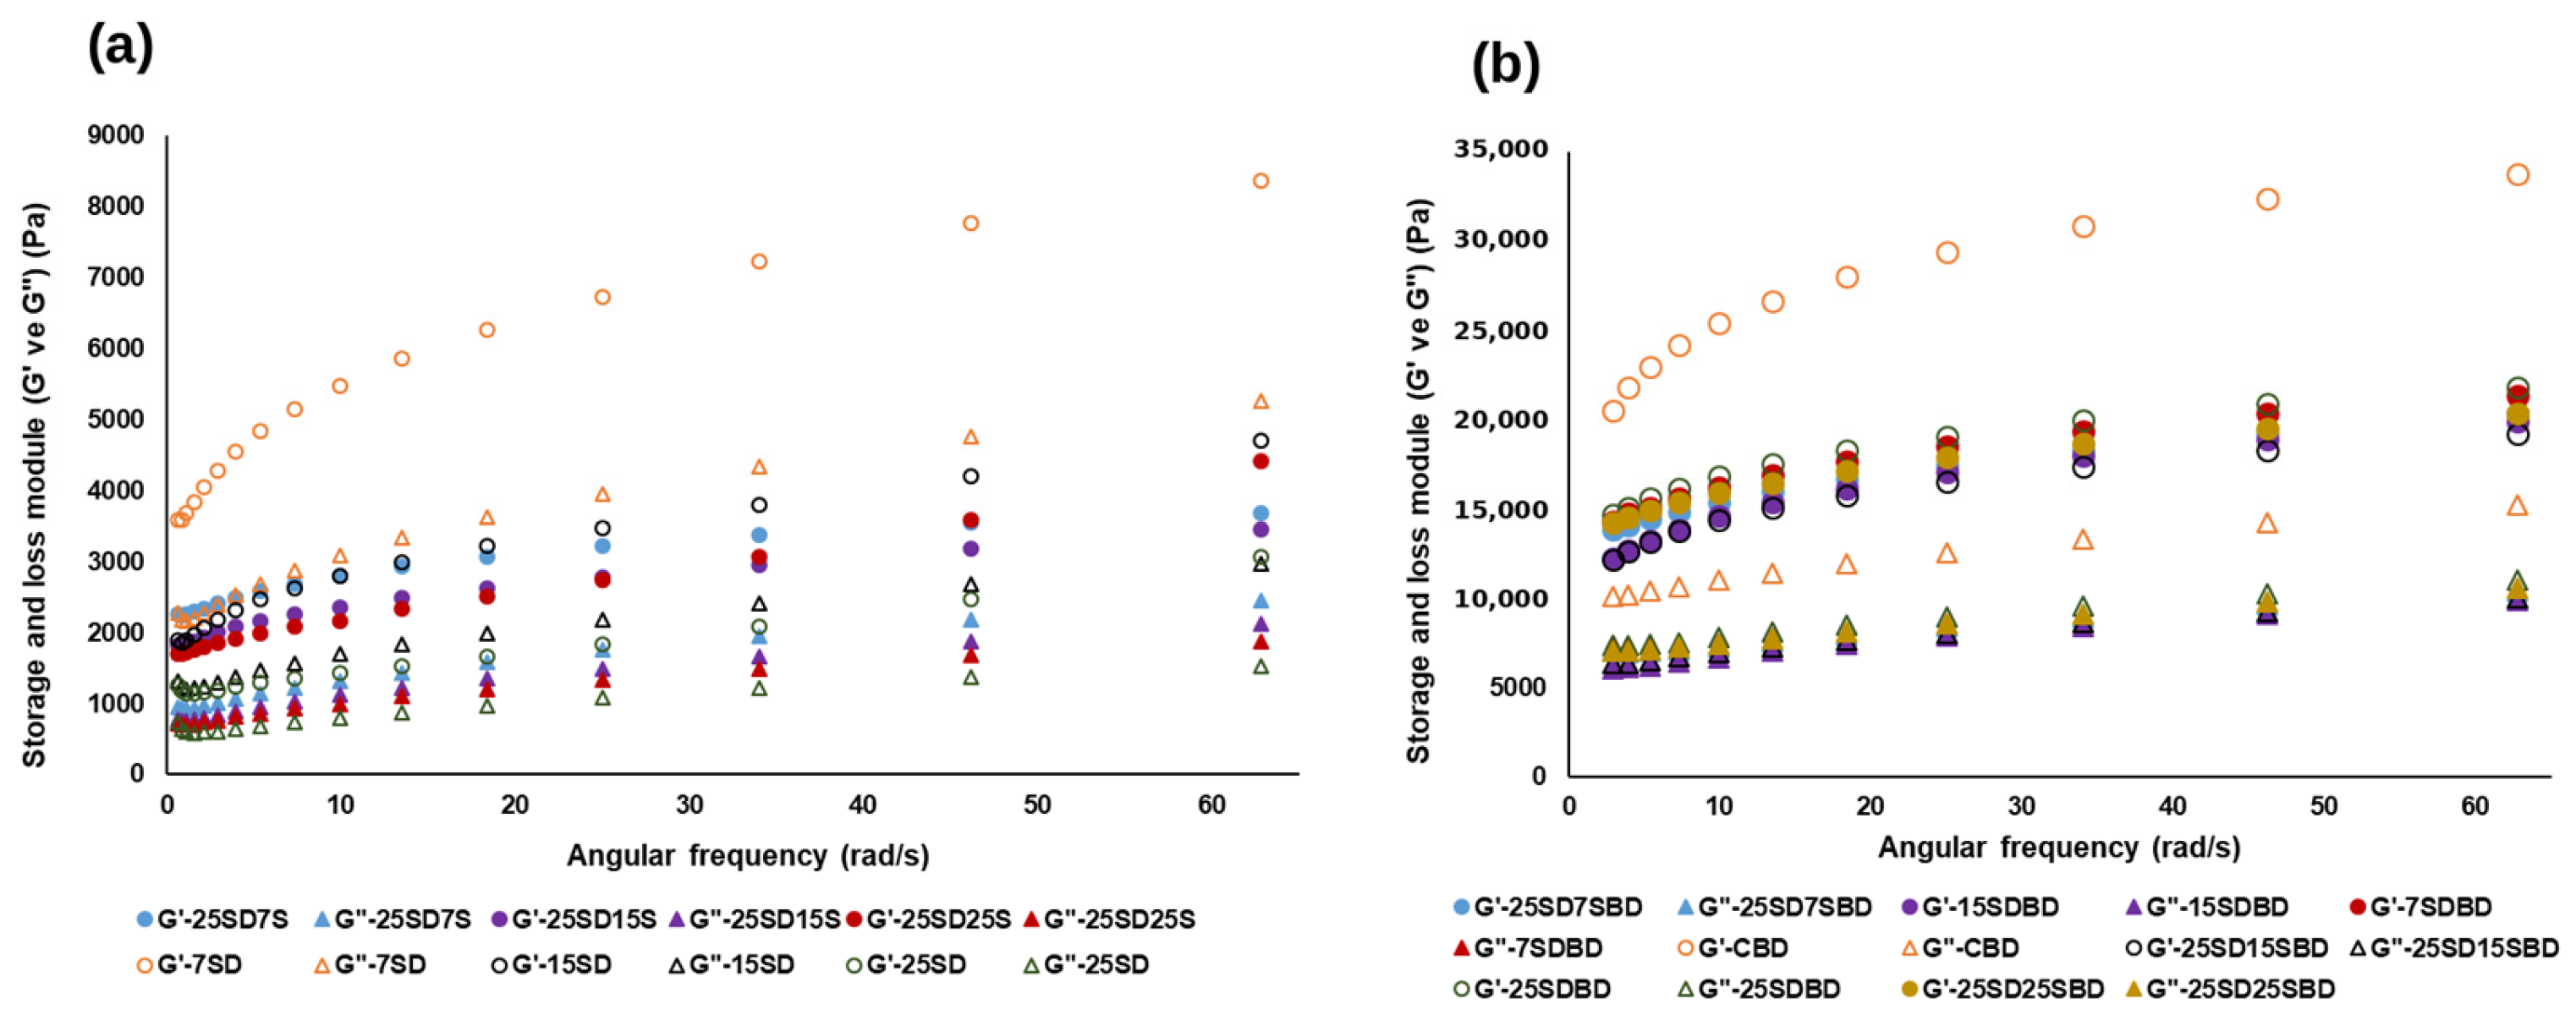
The storage modulus (G′) and loss modulus (G″) behaviors of Type I sourdough under cold backslopping and cold storage, as well as those of the corresponding breads, as a function of angular frequency, are shown in Figure 4a,b. G′ and G″ are key parameters in dynamic rheological measurements, representing the solid-like and liquid-like characteristics of dough samples, respectively. All sourdough samples exhibited a predominantly elastic behavior, as G′ values exceeded G″ over the entire frequency range. The highest G′ and G″ values were observed in sourdough backslopped at 7 °C (7SD), followed by 15SD and the cold-stored sourdoughs (25SD7S and 25SD15S), whereas the conventionally propagated Type I sourdough (25SD) exhibited the lowest moduli (Figure 4a). Although the pH values of the sourdoughs were comparable, differences in rheological behavior are likely associated with changes in microbial metabolism induced by temperature. Lower fermentation temperatures reduce the metabolic activity of lactic acid bacteria and yeasts, resulting in slower acidification and enzymatic degradation of flour biopolymers. Consequently, gluten proteins and arabinoxylan-rich structures may undergo less extensive modification, allowing the dough to retain a stronger and more elastic viscoelastic network. In addition, repeated backslopping under cold conditions may gradually select microbial populations with different metabolic activities, thereby influencing the production of organic acids and extracellular metabolites that contribute to dough structure. In contrast, the lower G′ and G″ values of 25SD suggest a more extensive modification of the dough matrix during fermentation at 25 °C, where higher microbial activity may have promoted greater proteolysis and other biochemical transformations. Such changes are known to weaken the gluten network and reduce dough elasticity [21,22].
The bread doughs also exhibited G′ values higher than G″, confirming their solid-like behavior. However, their rheological responses differed from those of the corresponding sourdoughs because bread formulations additionally contained baker’s yeast, salt, and wheat flour, and underwent remixing prior to analysis. Consequently, the viscoelastic properties reflected not only the characteristics of the sourdough but also the interactions among dough ingredients and the newly developed gluten network. Similar observations have been reported previously for wheat dough systems [23].

3.3. Quality Properties of Breads

Table 1 presents SV values and textural properties of bread samples. SV values of all sourdough breads are lower than those of control bread (baker’s yeast bread without SD). Hardness values, showing mostly a negative correlation with SV, are higher in sourdough breads when compared to the control. The usage of sourdough prepared with WWF in bread making decreased the SV and increased the hardness (Table 1). Similar results were reported in recent studies by Seis Subaşı and Ercan [24] and Tomić et al. [25]. On the contrary, improvements in SV and crumb hardness of fermented sourdough breads were also reported in previous studies [26,27]. Several factors in bread making can cause these inconsistencies in the literature, such as the leavening strategies, process parameters, and flour type [22,28].
Among the sourdough breads, 25SD-B exhibited the lowest hardness, followed by 25SD15S-B and 25SD25S-B, whereas breads prepared from cold-backslopped sourdoughs showed significantly higher hardness values. This observation suggests that cold backslopping affected the biochemical characteristics of the mature sourdough, which subsequently influenced bread texture. Lower fermentation temperatures are known to reduce microbial metabolic activity and enzyme-mediated modifications of dough constituents, including gluten proteins and non-starch polysaccharides. Consequently, the dough may retain a stronger and less extensible structure, limiting gas cell expansion during proofing and resulting in breads with lower specific volume and firmer crumbs [1,3]. A similar pattern to crumb hardness was also found in chewiness values. The lowest springiness value was obtained in 25SD7S-B. Springiness is a primary textural parameter that indicates the ability of a sample to recover after the removal of force [29]. No significant differences were observed in the cohesiveness values among all samples; however, CB exhibited the highest value (p > 0.05). Higher cohesiveness values for bread without sourdough have also been reported by Casado et al. [17]. A similar trend was also observed for resilience, with no significant differences among samples, except for those prepared using cold backslopping and stored at 15 °C (15SD-B and 25SD15S-B). Resilience is defined as the instant springiness of bread texture and is desirable at higher values [29]. The resilience was significantly higher in sample 25SD15S-B than in 15SD-B (Table 1), suggesting that storing the sourdough at 15 °C resulted in better crumb resilience than backslopped sourdough at 15 °C.
The crust and crumb color characteristics of breads were presented in Table 2. Control bread exhibited the highest crust L* value compared to sourdough breads, suggesting that the control formulation may contain lower levels of reducing sugars for the Maillard reaction, or that the available sugars were largely utilized by baker’s yeast during fermentation [30]. Lower crust L* values indicated more pronounced browning for cold-backslopped and stored sourdough breads than Type I sourdough bread (25SD-B). This could be attributed to the limited ability of sourdough microorganisms to utilize sugars under cold conditions. A similar pattern was also observed in the crumb L values of the samples, with the control bread showing the highest value. However, among sourdough breads, the sample prepared with cold-backslopped sourdough at 15 °C exhibited the highest crumb L value, possibly due to sugar consumption by yeast under those conditions.

3.4. Quality Aspects of Breads During Storage

The breads were stored at room temperature for 8 days, and textural properties (Table 1), along with thermal transition parameters (Table 3), were monitored. All samples showed a gradual increase in hardness during storage (p < 0.05). The bread produced using cold-backslopped sourdough at 7 °C (7SD-B) exhibited the highest hardness among sourdough breads at the end of the storage period, while the other sourdough breads were similar to the control bread. However, on the 4th day of storage, lower hardness was observed in sourdough breads, except for 7SD-B, compared to the control bread. The springiness of breads decreased at the end of the storage period; however, no significant differences were observed for 15SD-B and 25SD7S-B, indicating that their elastic characteristics were preserved during storage. High springiness values reflect the bread’s resistance to crumbling [24]. Similarly, a high cohesiveness value is desired in bread quality, indicating lower crumbling during storage [31]. A gradual reduction in cohesiveness was observed for CB, whereas this decrease was not significant in sourdough breads after 4 days of storage. The effects of sourdough on bread staling are attributed to several factors, including the acidification capability of sourdough microorganisms, the sourdough level used in bread, and the interaction between starch and protein depending on flour type [32,33]. The increase in hardness and a decrease in springiness and cohesiveness during storage may be associated with starch retrogradation caused by water migration from crumb to crust [33,34]. The thermal transition parameters of the bread samples determined by DSC are presented in Table 3. Overall, the sourdough breads exhibited lower apparent enthalpy values than the control bread during storage (Table 3). The measured enthalpy values may reflect differences in the thermal behavior of the bread samples under the applied DSC conditions. These differences may be associated with changes in moisture distribution, structural modifications of starch and other bread components, and interactions between water and the bread matrix during storage [13,33,34]. The apparent enthalpy of the major endothermic transition increased during storage in several bread samples, indicating greater energy requirements for the measured thermal event. Because the DSC analyses were performed on hermetically sealed samples heated from 25 to 250 °C and moisture normalization was not performed, the measured thermal event likely represents overlapping thermal phenomena rather than a single transition. Accordingly, changes in Tonset, Tpeak, and Tend were not always consistent among treatments, suggesting that storage mainly affected the extent of the measured thermal event rather than its temperature range.

3.5. Volatile Compound (VoC) Profile of Sourdoughs and Breads

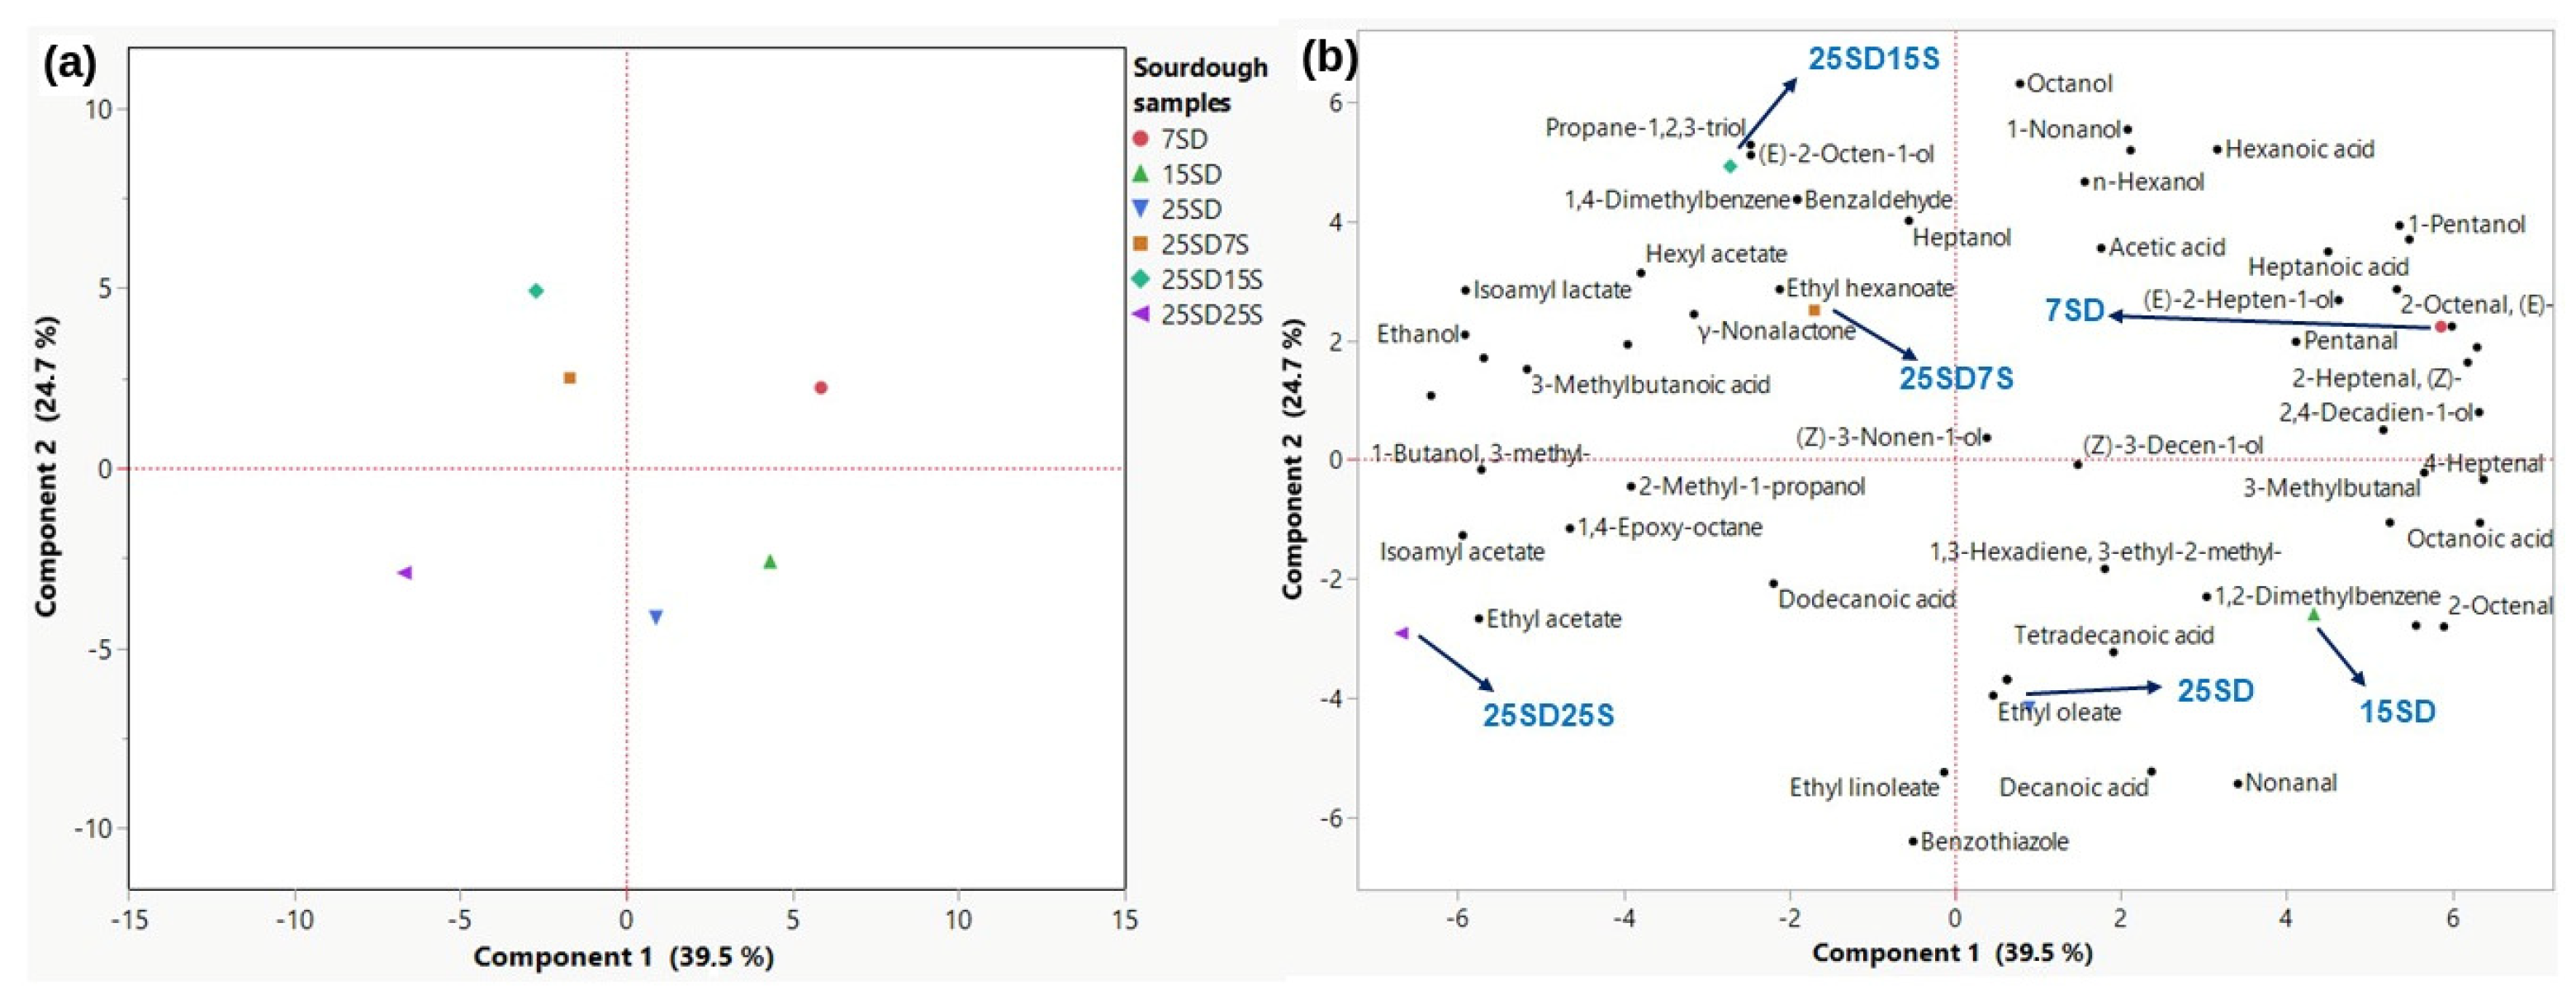
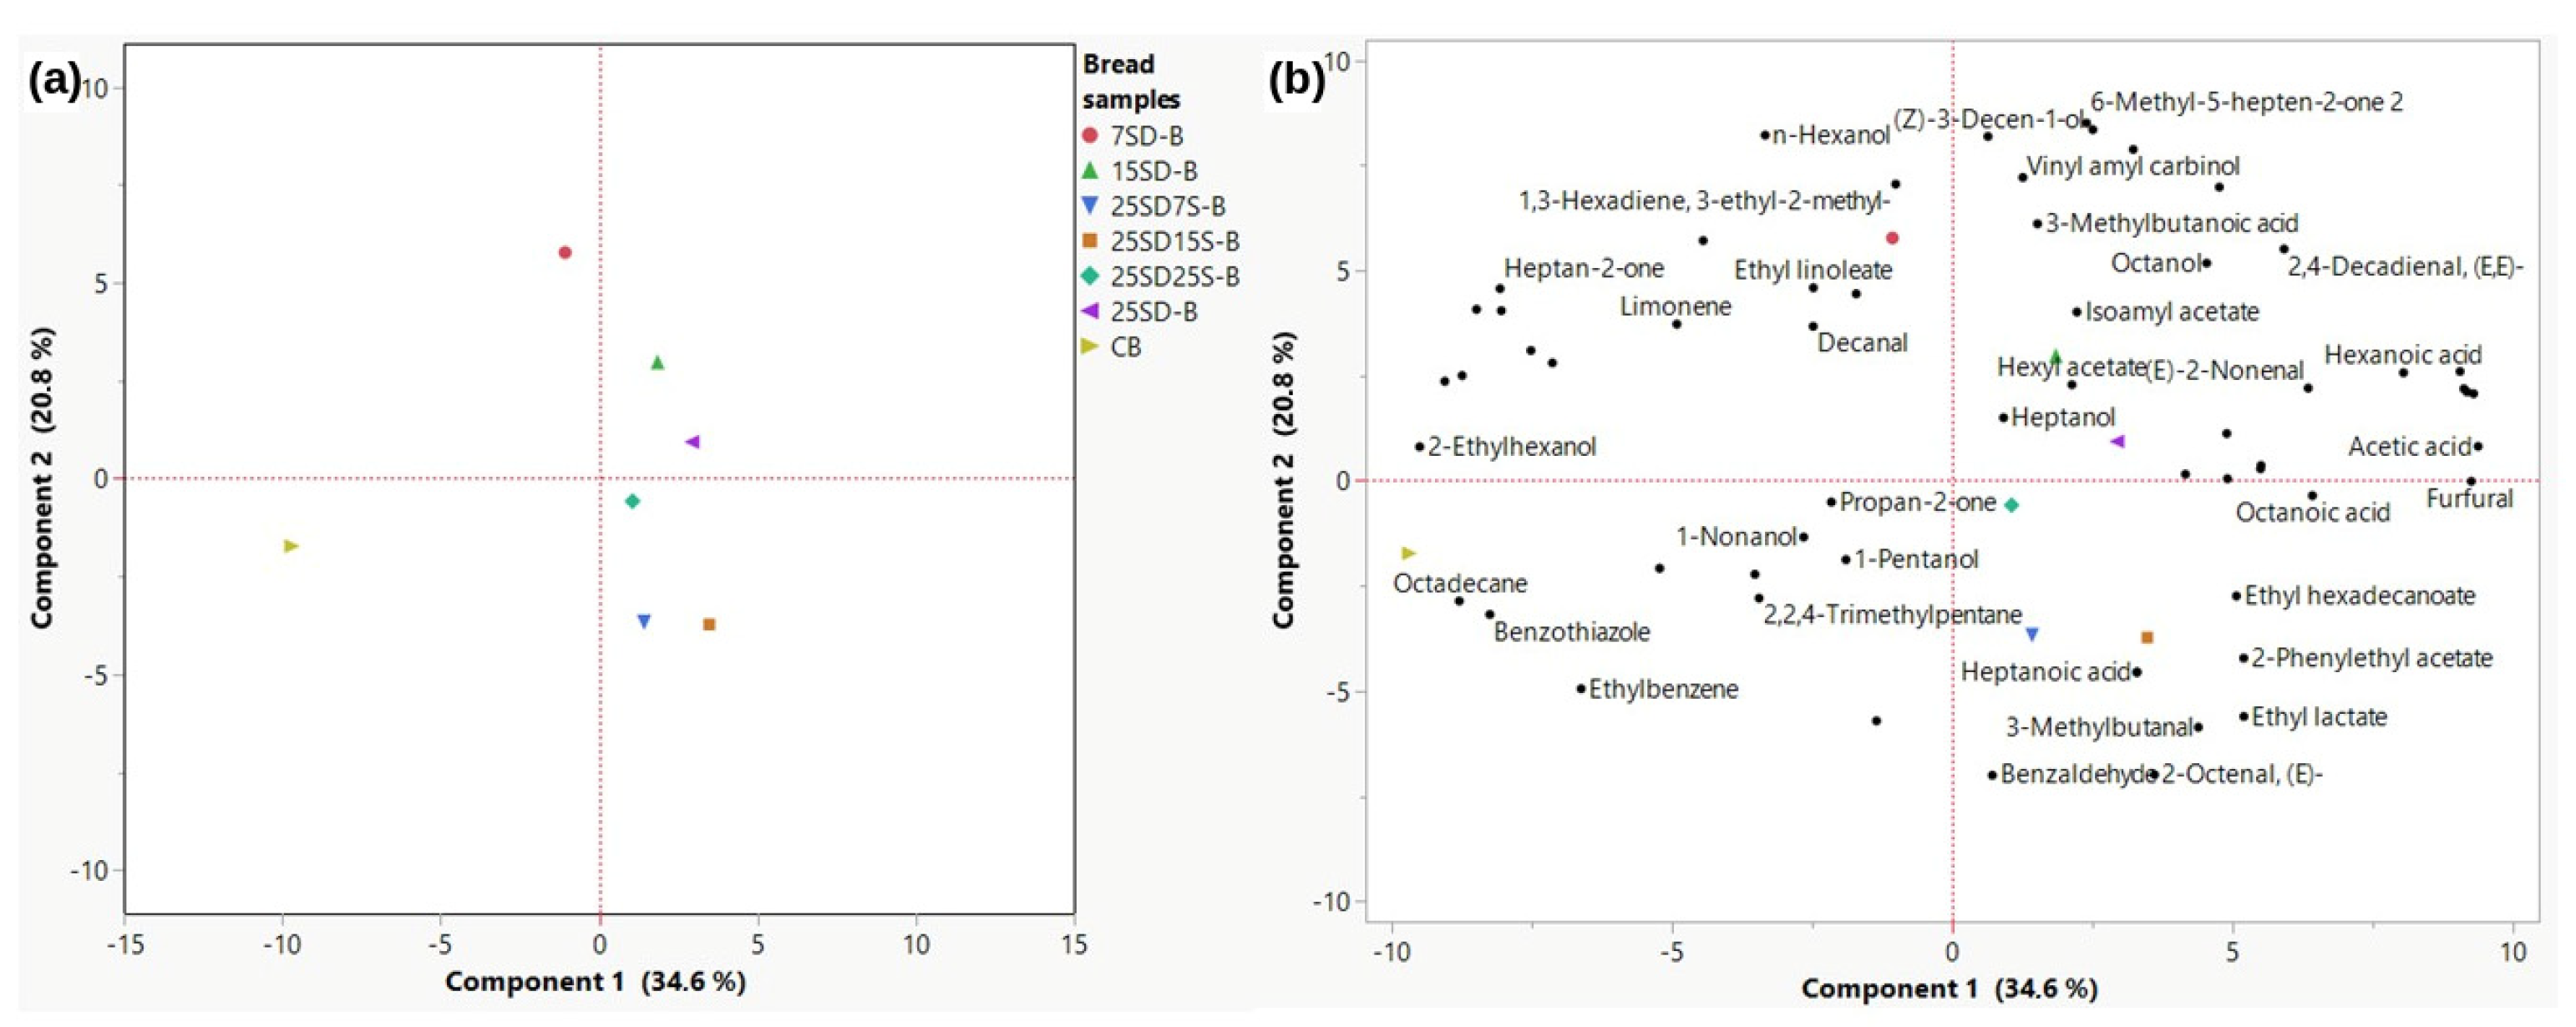
The VoCs in all sourdough and bread samples are shown in Figure 5 and Figure 6 using PCA plots. A total of 67 key VOCs, including 18 alcohols, 14 aldehydes, 10 esters, 8 acids, 8 hydrocarbons, and 4 other compounds, were identified and used for PCA.
The VoC profiles of the sourdough samples exhibited four descriptive clustering patterns (Table S1, Figure 5). The cold-backslopped sourdough at 7 °C (7SD) occupied a distinct position relative to the other average treatment profiles in the PCA score plot, being located in the positive region of both PC1 and PC2. Aldehydes such as 2-octenal, pentanal, and 2-heptenal were among the compounds contributing to this positioning. These compounds are known to be products of lipid oxidation. The presence of lipoxygenase activity in the wholemeal flour used for sourdough preparation may have contributed to their formation [35]. Furthermore, Nor Qhairul Izzreen et al. [36] reported increased levels of lipid oxidation compounds in the crumb of wholemeal wheat bread fermented with lower yeast levels. Similarly, 7SD exhibited a low yeast count in the present study (Figure 3b), which may explain its higher abundance of lipid oxidation products. 2-Octenal has also been identified as an aroma-active compound in wheat bread and is associated with green and fatty odor characteristics [37]. The cold-stored sourdoughs (25SD15S and 25SD7S) showed a tendency to cluster together, apart from the room-temperature-stored sourdough (25SD25S). Ethyl hexanoate and hexyl acetate for 25SD15S and 25SD7S, and ethyl acetate for 25SD25S, were the main drivers of the observed separation. These esters are generated from fatty acid metabolic pathways in the yeast cell during fermentation and are often characterized as giving fruity odors [38,39]. Ethyl acetate, ethyl hexanoate, and hexyl acetate have been described as major volatile compounds in Type I sourdough in studies by Kaseleht et al. [40] and Yan BoWen et al. [41]. However, low fermentation temperatures (8 and 16 °C) used in the production of whole-meal wheat bread led to higher ethyl acetate and ethyl hexanoate formation in studies by Birch et al. [42] and Nor Qhairul Izzreen et al. [36]. For sourdough bread samples, the CB sample was separated from the other bread samples (Figure 6), mainly due to the contribution of octadecane. The bread produced with 7SD was also separated from the other sourdough bread samples, consistent with the PCA results of sourdough samples (Figure 5). This differentiation was primarily associated with ethyl linoleate and 1,3-hexadiene, 3-ethyl-2-methyl. The other sourdough breads were grouped similarly to those of their corresponding sourdough samples. Heptanoic acid (sour-sweet, fatty) was the key VoC leading to the discrimination of the breads made with cold-stored sourdoughs (25SD15S-B and 25SD7S-B). The bread made with room-temperature-stored sourdough (25SD25S-B) was differentiated by propan-2-one. Heptanol and hexyl acetate categorized the breads prepared with backslopped sourdough at 15 °C and 25 °C. Briefly, low-temperature conditions may redirect yeast metabolism toward ester biosynthesis pathways due to altered redox balance and reduced volatilization losses, promoting the accumulation of fruity esters such as ethyl hexanoate and hexyl acetate.

4. Conclusions

This study comparatively evaluated the effects of cold backslopping (7 and 15 °C) and cold storage (7 and 15 °C) on the microbiological, biochemical, rheological, technological, and volatile characteristics of Type I sourdoughs and the corresponding breads. The obtained findings demonstrated that cold applications performed specifically at 15 °C significantly improved bread quality. In the context of technological performance, cold-backslopped sourdough at 15 °C provided a statistically significant increase in specific volume (SV) development compared with other cold-treated sourdough breads, whereas the cold storage process improved structural properties by preserving crumb resilience during storage. In terms of volatile development, these applications may modulate the metabolic activity of the microflora, increasing the synthesis of esters such as ethyl hexanoate and hexyl acetate, as well as characteristic volatile compounds like heptanoic acid. This led to the enrichment of the volatile organic compound (VoC) profile of the bread. Overall, the results demonstrate that applying cold backslopping or cold storage at 15 °C can improve selected technological and aromatic characteristics of Type I sourdough bread while providing alternative technological options for sourdough management and bakery production scheduling. Nevertheless, further studies integrating microbial community analysis, sensory evaluation, and pilot-scale validation are required to confirm the industrial applicability of these strategies.

Supplementary Materials

The following supporting information can be downloaded at: https://www.mdpi.com/article/10.3390/fermentation12080388/s1.

Author Contributions

G.T.: Data curation, formal analysis, investigation, methodology, and writing—original draft. G.O.: Supervision, methodology, and writing—original draft. S.S.F.: Formal analysis and writing—review and editing. O.S.: Formal analysis and writing—review and editing. Ö.Ş.: Conceptualization, supervision, and writing—review and editing. All authors have read and agreed to the published version of the manuscript.

Funding

This project has received funding from the European Union’s Horizon Europe research and innovation program under the Marie Skłodowska-Curie grant agreement No. 101126655. This project is also supported in part by a research grant from the Scientific and Technological Research Council of Türkiye (TÜBİTAK) under grant number 123C459.

Institutional Review Board Statement

Not applicable.

Informed Consent Statement

Not applicable.

Data Availability Statement

The original contributions presented in this study are included in the article/Supplementary Material. Further inquiries can be directed to the corresponding authors.

Acknowledgments

The authors gratefully acknowledge Michael Gänzle for his valuable insights and contributions to the interpretation of the results. During the preparation of this manuscript/study, the authors used ChatGPT (GPT-5.6 Sol, OpenAI) for the purposes of editing Figure 1. The authors have reviewed and edited the output and take full responsibility for the content of this publication.

Conflicts of Interest

The authors declare that they have no known competing financial interests or personal relationships that could have appeared to influence the work reported in this paper.

Abbreviations

The following abbreviations are used in this manuscript:
ANOVAAnalysis of variance
CBControl bread
DRBCDichloran Rose Bengal Chloramphenicol
FQFermentation quotient
LABLactic acid bacteria
MRSDe Man, Rogosa and Sharpe
PCAPrincipal component analysis
SDSourdough
SVSpecific volume
TAMBTotal aerobic mesophilic bacteria
TPATexture profile analysis
TTATotal titratable acid
VOCVolatile organic compound
WWFWhole wheat flour

References

  1. Gänzle, M.G. Enzymatic and Bacterial Conversions during Sourdough Fermentation. Food Microbiol. 2014, 37, 2–10. [Google Scholar] [CrossRef] [Scilit] [PubMed]
  2. Poutanen, K.; Flander, L.; Katina, K. Sourdough and Cereal Fermentation in a Nutritional Perspective. Food Microbiol. 2009, 26, 693–699. [Google Scholar] [CrossRef] [Scilit] [PubMed]
  3. Arendt, E.K.; Ryan, L.A.M.; Dal Bello, F. Impact of Sourdough on the Texture of Bread. Food Microbiol. 2007, 24, 165–174. [Google Scholar] [CrossRef] [Scilit] [PubMed]
  4. De Vuyst, L.; Van Kerrebroeck, S.; Leroy, F. Microbial Ecology and Process Technology of Sourdough Fermentation. In Advances in Applied Microbiology; Elsevier: Amsterdam, The Netherlands, 2017; Volume 100, pp. 49–160. [Google Scholar]
  5. Vogelmann, S.A.; Hertel, C. Impact of Ecological Factors on the Stability of Microbial Associations in Sourdough Fermentation. Food Microbiol. 2011, 28, 583–589. [Google Scholar] [CrossRef] [Scilit] [PubMed]
  6. Xu, D.; Zhang, H.; Xi, J.; Jin, Y.; Chen, Y.; Guo, L.; Jin, Z.; Xu, X. Improving Bread Aroma Using Low-Temperature Sourdough Fermentation. Food Biosci. 2020, 37, 100704. [Google Scholar] [CrossRef] [Scilit]
  7. Belloli, K.S.; Botelho, A.B.; Da Silveira, E.B.; Dos Santos, V.T.D.V.; De Almeida, S.W.; Hoffmann, J.F.; Tupuna-Yerovi, D.S.; Marcolin, L.C.; Ziegler, V. Effects of Flour Type and Incubation Temperature of Sourdough on the Technological and Sensory Properties of Bread. Eur. Food Res. Technol. 2025, 251, 1673–1683. [Google Scholar] [CrossRef] [Scilit]
  8. Liszkowska, W.; Berlowska, J. Yeast Fermentation at Low Temperatures: Adaptation to Changing Environmental Conditions and Formation of Volatile Compounds. Molecules 2021, 26, 1035. [Google Scholar] [CrossRef] [Scilit] [PubMed]
  9. Vrancken, G.; Rimaux, T.; Weckx, S.; Leroy, F.; De Vuyst, L. Influence of Temperature and Backslopping Time on the Microbiota of a Type I Propagated Laboratory Wheat Sourdough Fermentation. Appl. Environ. Microbiol. 2011, 77, 2716–2726. [Google Scholar] [CrossRef] [Scilit] [PubMed]
  10. Pradal, I.; González-Alonso, V.; Wardhana, Y.R.; Cnockaert, M.; Wieme, A.D.; Vandamme, P.; De Vuyst, L. Various Cold Storage-Backslopping Cycles Show the Robustness of Limosilactobacillus fermentum IMDO 130101 as Starter Culture for Type 3 Sourdough Production. Int. J. Food Microbiol. 2024, 411, 110522. [Google Scholar] [CrossRef] [Scilit] [PubMed]
  11. Özdemir, N.; Yazıcı, G.; Şimşek, Ö.; Özkal, S.G.; Con, A.H. The effect of lactic acid bacteria and yeast usage on aroma development during tarhana fermentation. Food Biosci. 2018, 26, 30–37. [Google Scholar] [CrossRef] [Scilit]
  12. AACC International. Approved Methods of Analysis, 11th ed.; AACC International: St. Paul, MN, USA, 2010. [Google Scholar]
  13. Kerch, G.; Glonin, A.; Zicans, J.; Merijs Meri, R. A DSC Study of the Effect of Bread Making Methods on Bound Water Content and Redistribution in Chitosan Enriched Bread. J. Therm. Anal. Calorim. 2012, 108, 185–189. [Google Scholar] [CrossRef] [Scilit]
  14. Plessas, S.; Fisher, A.; Koureta, K.; Psarianos, C.; Nigam, P.; Koutinas, A.A. Application of Kluyveromyces marxianus, Lactobacillus delbrueckii ssp. bulgaricus and L. helveticus for Sourdough Bread Making. Food Chem. 2008, 106, 985–990. [Google Scholar] [CrossRef] [Scilit]
  15. Coronas, R.; Bianco, A.; Sanna, A.M.L.; Zara, G.; Budroni, M. Type I Sourdough Preservation Strategies and the Contribution of Microbial Biological Resource Centers to Biodiversity Protection: A Narrative Review. Foods 2025, 14, 2624. [Google Scholar] [CrossRef] [Scilit] [PubMed]
  16. Siepmann, F.B.; Sousa De Almeida, B.; Waszczynskyj, N.; Spier, M.R. Influence of Temperature and of Starter Culture on Biochemical Characteristics and the Aromatic Compounds Evolution on Type II Sourdough and Wheat Bread. LWT 2019, 108, 199–206. [Google Scholar] [CrossRef] [Scilit]
  17. Casado, A.; Álvarez, A.; González, L.; Fernández, D.; Marcos, J.L.; Tornadijo, M.E. Effect of Fermentation on Microbiological, Physicochemical and Physical Characteristics of Sourdough and Impact of Its Use on Bread Quality. Czech J. Food Sci. 2017, 35, 496–506. [Google Scholar] [CrossRef] [Scilit]
  18. Minervini, F.; De Angelis, M.; Di Cagno, R.; Gobbetti, M. Ecological Parameters Influencing Microbial Diversity and Stability of Traditional Sourdough. Int. J. Food Microbiol. 2014, 171, 136–146. [Google Scholar] [CrossRef] [Scilit] [PubMed]
  19. Hammes, W.P.; Gänzle, M.G. Sourdough Breads and Related Products. In Microbiology of Fermented Foods; Wood, B.J.B., Ed.; Springer: Boston, MA, USA, 1998; pp. 199–216. [Google Scholar]
  20. De Vuyst, L.; Comasio, A.; Kerrebroeck, S.V. Sourdough Production: Fermentation Strategies, Microbial Ecology, and Use of Non-Flour Ingredients. Crit. Rev. Food Sci. Nutr. 2023, 63, 2447–2479. [Google Scholar] [CrossRef] [Scilit] [PubMed]
  21. Gocmen, D.; Gurbuz, O.; Kumral, A.Y.; Dagdelen, A.F.; Sahin, I. The Effects of Wheat Sourdough on Glutenin Patterns, Dough Rheology and Bread Properties. Eur. Food Res. Technol. 2007, 225, 821–830. [Google Scholar] [CrossRef] [Scilit]
  22. Verdonck, C.; Hecke, Z.V.; De Bondt, Y.; Goos, P.; Moldenaers, P.; Courtin, C.M. Mechanistic Insights into the Impact of Acetic Acid, Lactic Acid, and Succinic Acid on the Dough Rheology, the Breadmaking Process, and the Specific Volume of Wholemeal Sourdough-Type Bread. Food Hydrocoll. 2025, 162, 110884. [Google Scholar] [CrossRef] [Scilit]
  23. Sun, X.; Wu, S.; Koksel, F.; Xie, M.; Fang, Y. Effects of Ingredient and Processing Conditions on the Rheological Properties of Whole Wheat Flour Dough during Breadmaking—A Review. Food Hydrocoll. 2023, 135, 108123. [Google Scholar] [CrossRef] [Scilit]
  24. Seis Subaşı, A.; Ercan, R. Technological Characteristics of Whole Wheat Bread: Effects of Wheat Varieties, Sourdough Treatments and Sourdough Levels. Eur. Food Res. Technol. 2024, 250, 2593–2608. [Google Scholar] [CrossRef] [Scilit]
  25. Tomić, J.; Dapčević-Hadnađev, T.; Škrobot, D.; Maravić, N.; Popović, N.; Stevanović, D.; Hadnađev, M. Spontaneously Fermented Ancient Wheat Sourdoughs in Breadmaking: Impact of Flour Quality on Sourdough and Bread Physico-Chemical Properties. LWT 2023, 175, 114482. [Google Scholar] [CrossRef] [Scilit]
  26. Ma, S.; Wang, Z.; Guo, X.; Wang, F.; Huang, J.; Sun, B.; Wang, X. Sourdough Improves the Quality of Whole-Wheat Flour Products: Mechanisms and Challenges—A Review. Food Chem. 2021, 360, 130038. [Google Scholar] [CrossRef] [Scilit] [PubMed]
  27. Prückler, M.; Lorenz, C.; Endo, A.; Kraler, M.; Dürrschmid, K.; Hendriks, K.; Soares Da Silva, F.; Auterith, E.; Kneifel, W.; Michlmayr, H. Comparison of Homo- and Heterofermentative Lactic Acid Bacteria for Implementation of Fermented Wheat Bran in Bread. Food Microbiol. 2015, 49, 211–219. [Google Scholar] [CrossRef] [Scilit] [PubMed]
  28. Van Kerrebroeck, S.; Comasio, A.; Harth, H.; De Vuyst, L. Impact of Starter Culture, Ingredients, and Flour Type on Sourdough Bread Volatiles as Monitored by Selected Ion Flow Tube-Mass Spectrometry. Food Res. Int. 2018, 106, 254–262. [Google Scholar] [CrossRef] [Scilit] [PubMed]
  29. Guiné, R.P.F.; Santos, C.; Rocha, C.; Marques, C.; Rodrigues, C.; Manita, F.; Sousa, F.; Félix, M.; Silva, S.; Rodrigues, S. Whey-Bread, an Improved Food Product: Evaluation of Textural Characteristics. J. Culin. Sci. Technol. 2020, 18, 40–53. [Google Scholar] [CrossRef] [Scilit]
  30. Conceição, L.D.S.; Almeida, B.S.D.; Souza, S.F.D.; Martinez, V.O.; Matos, M.F.R.D.; Andrade, L.L.; Ruggiero, W.F.; Pinto Matos, L.C. Critical Conditions for the Formation of Maillard Reaction Products (MRP) in Bread: An Integrative Review. J. Cereal Sci. 2024, 118, 103985. [Google Scholar] [CrossRef] [Scilit]
  31. Rosenthal, A.J.; Thompson, P. What Is Cohesiveness?—A Linguistic Exploration of the Food Texture Testing Literature. J. Texture Stud. 2021, 52, 294–302. [Google Scholar] [CrossRef] [Scilit] [PubMed]
  32. Di, C.; Jinshui, W.; Feng, J.; Changfu, Z. Effects of Sourdough Addition on the Quality and Shelf Life of Chinese Steamed Bread. Grain Oil Sci. Technol. 2018, 1, 85–90. [Google Scholar] [CrossRef] [Scilit]
  33. Li, M.; Zhang, H.; Lyu, L.; Deng, Q.; Fan, H.; Xu, X.; Xu, D. Effects of Sourdough on Bread Staling Rate: From the Perspective of Starch Retrogradation and Gluten Depolymerization. Food Biosci. 2024, 59, 103877. [Google Scholar] [CrossRef] [Scilit]
  34. Arslan-Tontul, S. Correlation of Bread Staling and Starch Digestibility and Role of Carboxymethyl Cellulose. Starch Stärke 2023, 75, 2300007. [Google Scholar] [CrossRef] [Scilit]
  35. Hidalgo, A.; Brandolini, A. Lipoxygenase Activity in Wholemeal Flours from Triticum monococcum, Triticum turgidum and Triticum aestivum. Food Chem. 2012, 131, 1499–1503. [Google Scholar] [CrossRef] [Scilit]
  36. Nor Qhairul Izzreen, M.N.; Petersen, M.A.; Hansen, Å.S. Volatile Compounds in Crumb of Whole-Meal Wheat Bread Fermented with Different Yeast Levels and Fermentation Temperatures. Cereal Chem. 2016, 93, 209–216. [Google Scholar] [CrossRef] [Scilit]
  37. Boeswetter, A.R.; Scherf, K.A.; Schieberle, P.; Koehler, P. Identification of the Key Aroma Compounds in Gluten-Free Rice Bread. J. Agric. Food Chem. 2019, 67, 2963–2972. [Google Scholar] [CrossRef] [Scilit] [PubMed]
  38. Birch, A.N.; Petersen, M.A.; Hansen, Å.S. REVIEW: Aroma of Wheat Bread Crumb. Cereal Chem. 2014, 91, 105–114. [Google Scholar] [CrossRef] [Scilit]
  39. Tolga Niçin, R.; Özdemir, N.; Şimşek, Ö.; Çon, A.H. Production of Volatiles Relation to Bread Aroma in Flour-Based Fermentation with Yeast. Food Chem. 2022, 378, 132125. [Google Scholar] [CrossRef] [Scilit] [PubMed]
  40. Kaseleht, K.; Paalme, T.; Mihhalevski, A.; Sarand, I. Analysis of Volatile Compounds Produced by Different Species of Lactobacilli in Rye Sourdough Using Multiple Headspace Extraction. Int. J. Food Sci. Technol. 2011, 46, 1940–1946. [Google Scholar] [CrossRef] [Scilit]
  41. Yan, B.; Sadiq, F.A.; Cai, Y.; Fan, D.; Zhang, H.; Zhao, J.; Chen, W. Identification of Key Aroma Compounds in Type I Sourdough-Based Chinese Steamed Bread: Application of Untargeted Metabolomics Analysisp. Int. J. Mol. Sci. 2019, 20, 818. [Google Scholar] [CrossRef] [Scilit] [PubMed]
  42. Birch, A.N.; Petersen, M.A.; Hansen, Å.S. The Aroma Profile of Wheat Bread Crumb Influenced by Yeast Concentration and Fermentation Temperature. LWT-Food Sci. Technol. 2013, 50, 480–488. [Google Scholar] [CrossRef] [Scilit]
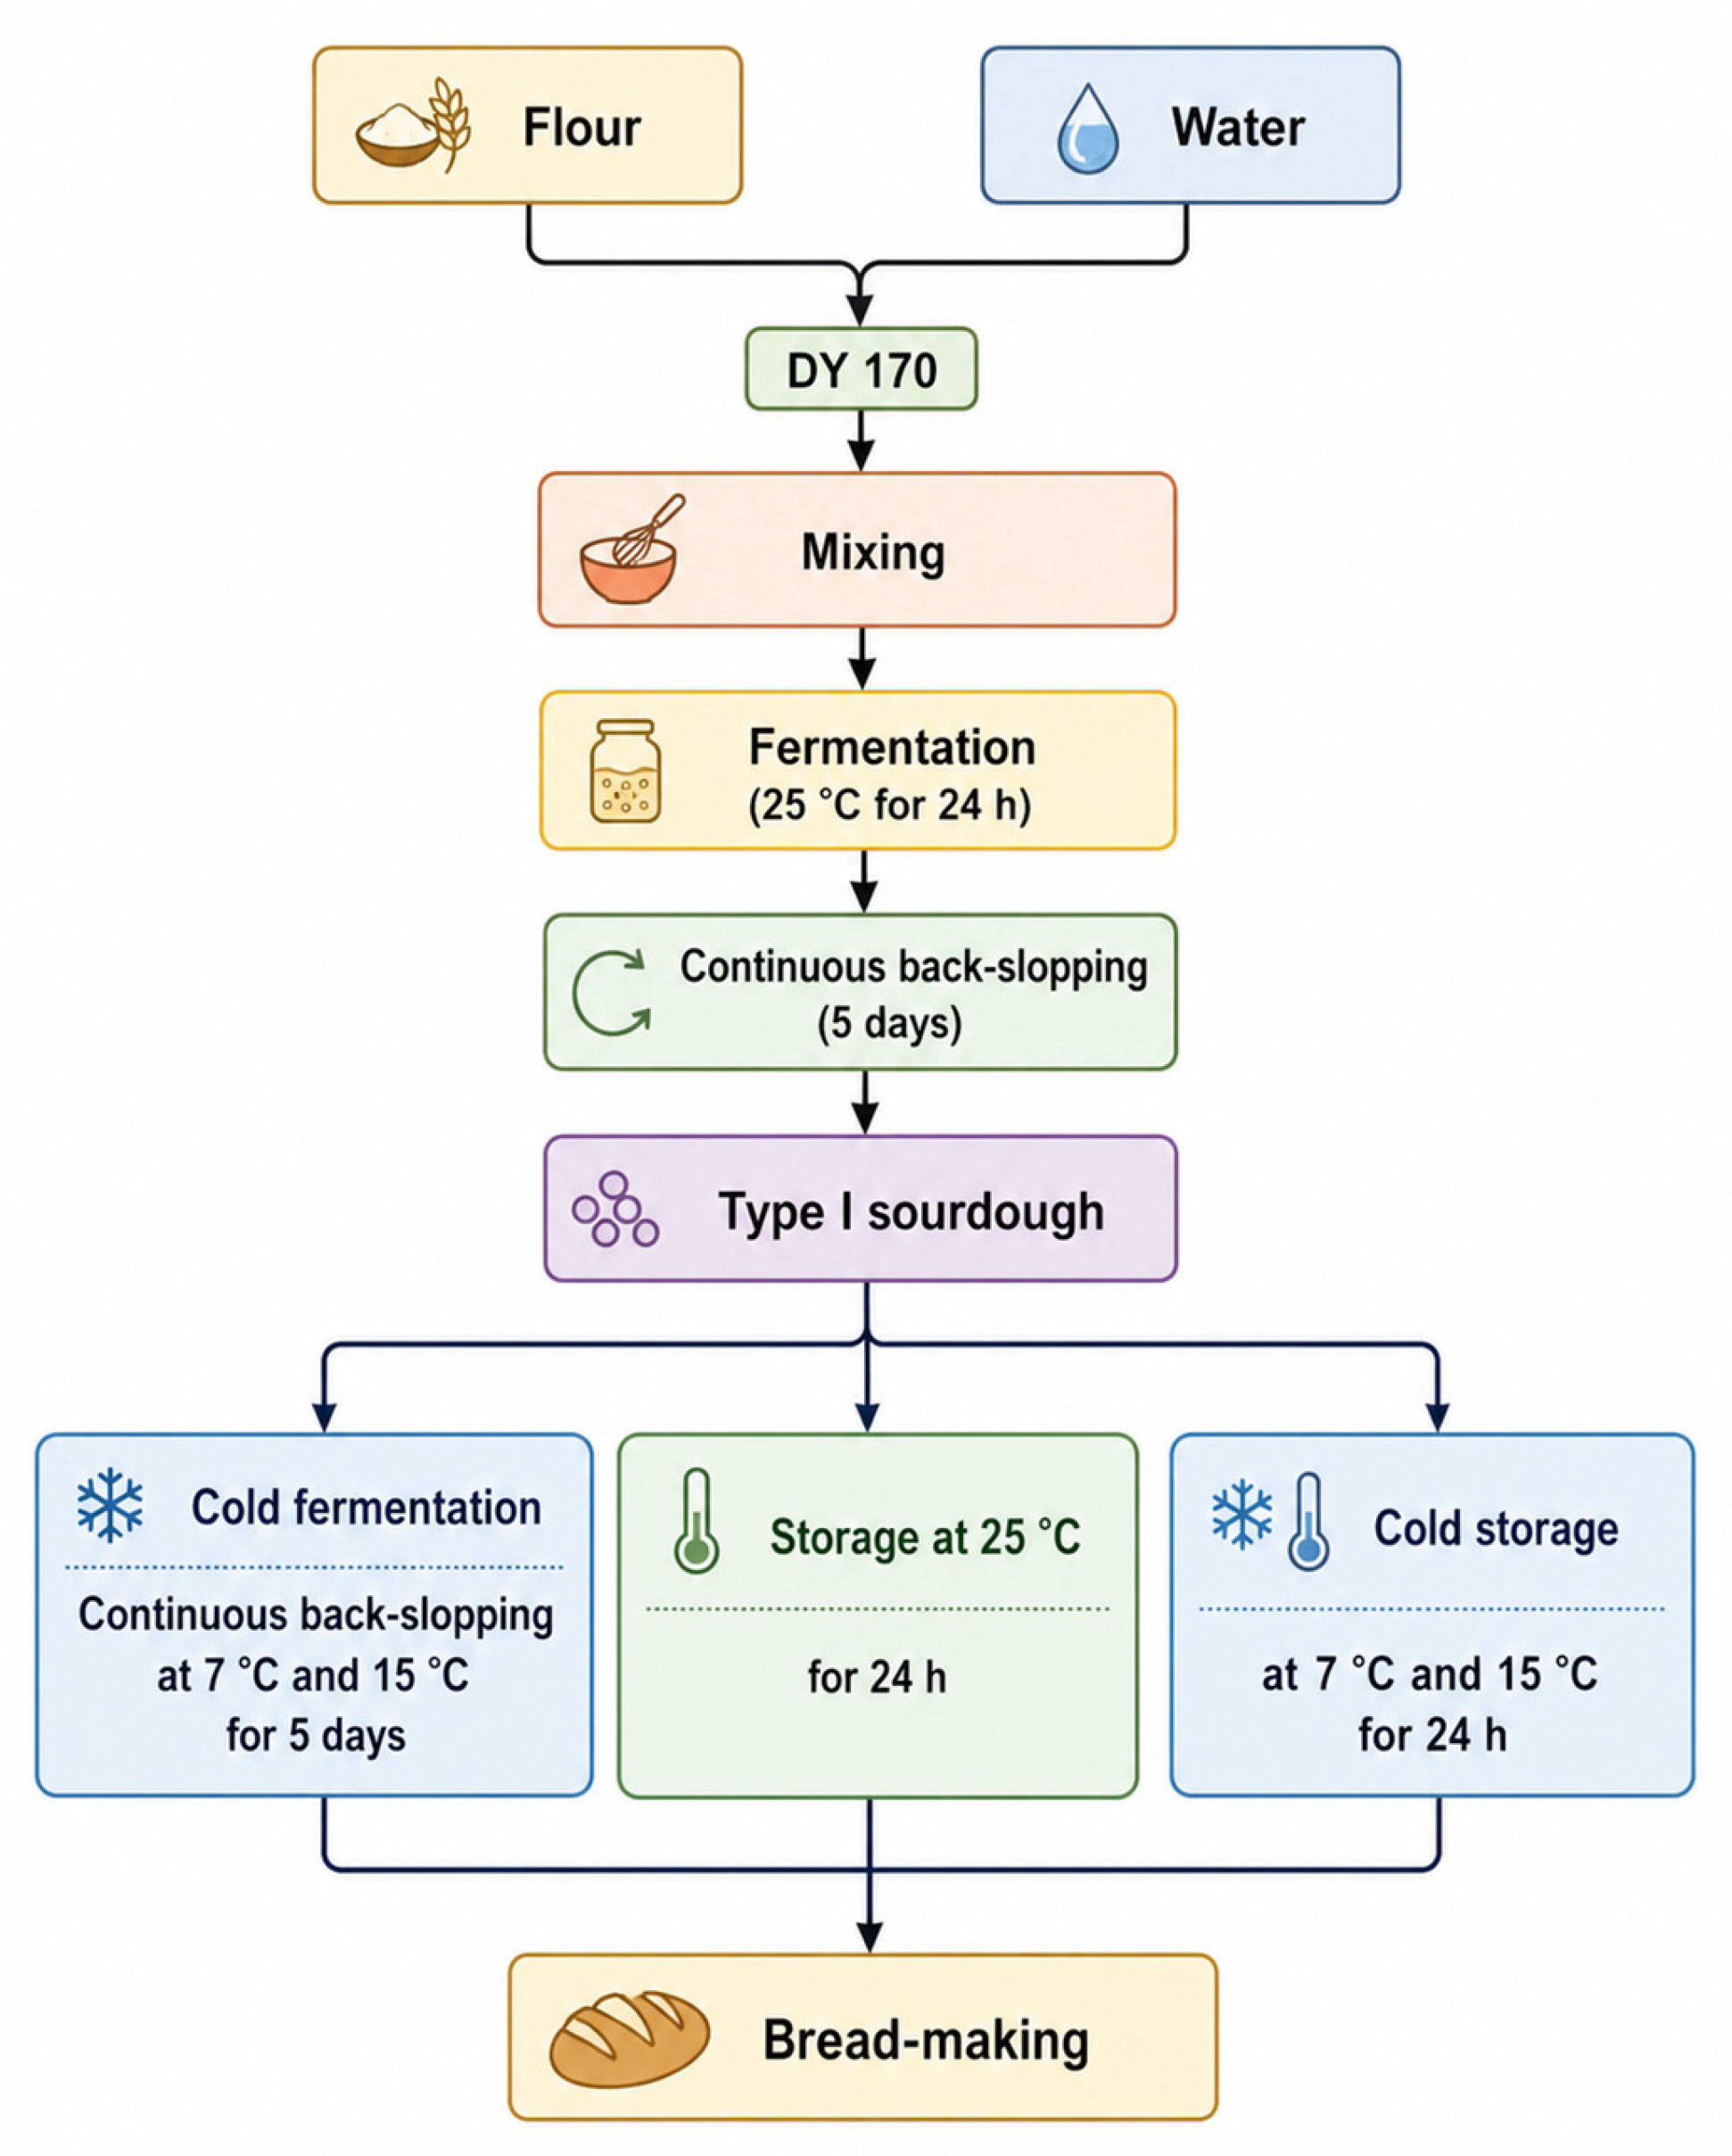
Figure 1. Workflow of the study. (edited by using ChatGPT, GPT-5.6 Sol, OpenAI).
Fermentation 12 00388 g001
Figure 2. The effects of cold fermentation and cold storage on sourdough characteristics; (a) pH, (b) TTA, (c) lactic and acetic acid concentration, (d) fermentation quotient. 7SD: Cold-backslopped sourdough at 7 °C; 15SD: Cold-backslopped sourdough at 15 °C; 25SD: Backslopped sourdough at 25 °C; 25SD25S: Sourdough stored at 25 °C; 25SD15S: Sourdough stored at 15 °C; 25SD7S: Sourdough stored at 7 °C. Data are expressed as mean of triplicate determinations.
Fermentation 12 00388 g002
Figure 3. Changes in (a) lactic acid bacteria (LAB), (b) yeast, and (c) total aerobic mesophilic bacteria (TAMB) counts of sourdough after cold fermentation and cold storage. 7SD: Cold-backslopped sourdough at 7 °C; 15SD: Cold-backslopped sourdough at 15 °C; 25SD: Backslopped sourdough at 25 °C; 25SD25S: Sourdough stored at 25 °C; 25SD15S: Sourdough stored at 15 °C; 25SD7S: Sourdough stored at 7 °C. Data are expressed as mean of triplicate determinations. Different letters (a to e) refer to statistically significance p < 0.05.
Fermentation 12 00388 g003
Figure 4. Dynamic rheological properties of sourdough (a) and bread dough (b) samples. 7SD: Cold-backslopped sourdough at 7 °C; 15SD: Cold-backslopped sourdough at 15 °C; 25SD: Backslopped sourdough at 25 °C; 25SD25S: Sourdough stored at 25 °C; 25SD15S: Sourdough stored at 15 °C; 25SD7S: Sourdough stored at 7 °C, CBD: Control bread dough; 7SDBD: Bread dough made with cold-backslopped sourdough at 7 °C; 15SDBD: Bread dough made with cold-backslopped sourdough at 15 °C; 25SDBD: Bread dough made with backslopped sourdough at 25 °C; 25SD25SBD: Bread dough made with sourdough stored at 25 °C; 25SD15SBD: Bread dough made with sourdough stored at 15 °C; 25SD7SBD: Bread dough made with sourdough stored at 7 °C. Data are expressed as mean of triplicate determinations.
Fermentation 12 00388 g004
Figure 5. PCA of volatile compounds of (a) sourdoughs and with (b) VoCs. 7SD: Cold-backslopped sourdough at 7 °C; 15SD: Cold-backslopped sourdough at 15 °C; 25SD: Backslopped sourdough at 25 °C; 25SD25S: Sourdough stored at 25 °C; 25SD15S: Sourdough stored at 15 °C; 25SD7S: Sourdough stored at 7 °C. PCA results provide a descriptive overview of the similarities and differences among the average treatment profiles and should not be interpreted as inferential evidence of treatment separation.
Fermentation 12 00388 g005
Figure 6. PCA of volatile compounds of all (a) bread samples and with (b) VoCs. 7SD-B: Bread made with cold-backslopped sourdough at 7 °C; 15SD-B: Bread made with cold-backslopped sourdough at 15 °C; 25SD-B: Bread made with backslopped sourdough at 25 °C; 25SD25S-B: Bread made with sourdough stored at 25 °C; 25SD15S-B: Bread made with sourdough stored at 15 °C; 25SD7S-B: Bread made with sourdough stored at 7 °C; CB: Control bread. PCA results provide a descriptive overview of the similarities and differences among the average treatment profiles and should not be interpreted as inferential evidence of treatment separation.
Fermentation 12 00388 g006
Table 1. Specific volume of bread samples and changes in textural properties during storage.
Storage TimeCB7SD-B15SD-B25SD-B25SD7S-B25SD15S-B25SD25S-B
Specific
volume
03.87 ± 0.14 A3.54 ± 0.03 C3.68 ± 0.04 B3.71 ± 0.10 B3.35 ± 0.02 D3.39 ± 0.08 D3.37 ± 0.08 D
04.62 ± 0.16 Fc7.22 ± 0.07 Ac6.71 ± 0.06 Bc5.61 ± 0.10 Ec6.49 ± 0.20 Cc6.33 ± 0.14 Dc6.34 ± 0.13 CDc
Hardness (N)433.55 ± 3.03 Bb40.73 ± 3.88 Ab28.07 ± 2.08 Cb23.29 ± 1.37 Db28.11 ± 3.06 Cb30.78 ± 1.40 BCb28.60 ± 1.03 Cb
855.80 ± 2.48 BCa63.89 ± 2.04 Aa59.72 ± 1.51 Ba56.34 ± 3.21 BCa58.80 ± 5.70 Ba55.40 ± 2.12 BCa53.09 ± 4.24 Ca
00.98 ± 0.02 Aa0.99 ± 0.01 Aa0.97 ± 0.03 Aa0.97 ± 0.01 Aa0.94 ± 0.02 Ba0.97 ± 0.02 Aa0.97 ± 0.02 Aa
Springiness40.94 ± 0.01 ABb0.96 ± 0.01 Ab0.94 ± 0.02 ABa0.96 ± 0.03 Aa0.93 ± 0.05 ABa0.91 ± 0.02 Bb0.95 ± 0.03 ABa
80.93 ± 0.05 Ab0.94 ± 0.01 Ac0.94 ± 0.03 Aa0.93 ± 0.01 Ab0.92 ± 0.01 ABa0.84 ± 0.01 Cc0.89 ± 0.02 Bb
00.89 ± 0.01 Aa0.87 ± 0.02 Aa0.86 ± 0.03 Aa0.86 ± 0.06 Aa0.85 ± 0.02 Aa0.87 ± 0.02 Aa0.87 ± 0.03 Aa
Cohesiveness40.73 ± 0.06 ABb0.71 ± 0.03 ABb0.77 ± 0.05 Ab0.70 ± 0.05 Bb0.73 ± 0.05 ABb0.72 ± 0.05 ABb0.74 ± 0.05 ABb
80.68 ± 0.02 Ac0.70 ± 0.02 Ab0.73 ± 0.05 Ab0.68 ± 0.02 Ab0.69 ± 0.05 Ab0.71 ± 0.06 Ab0.69 ± 0.03 Ac
07.90 ± 0.45 Ac7.02 ± 0.31 Bc5.86 ± 0.27 Cc4.78 ± 0.26 Dc7.21 ± 0.26 Bc5.81 ± 0.19 Cc5.52 ± 0.26 Cc
Chewiness423.34 ± 2.82 Bb28.70 ± 4.41 Ab19.29 ± 1.07 Cb15.93 ± 1.63 Db20.51 ± 2.26 BCb20.59 ± 2.23 BCb20.03 ± 2.09 Cb
835.60 ± 1.75 BCa42.94 ± 2.10 Aa42.02 ± 5.46 Aa35.66 ± 1.97 BCa38.72 ± 5.15 ABa37.24 ± 4.56 BCa33.57 ± 3.74 Ca
00.51 ± 0.01 ABa0.51 ± 0.04 ABa0.48 ± 0.03 Ba0.49 ± 0.03 ABa0.49 ± 0.04 ABa0.52 ± 0.03 Aa0.50 ± 0.02 ABa
Resilience40.35 ± 0.05 Ab0.38 ± 0.04 Ab0.36 ± 0.03 Ab0.36 ± 0.02 Ab0.38 ± 0.03 Ab0.36 ± 0.01 Ab0.38 ± 0.03 Ab
80.33 ± 0.02 BCb0.35 ± 0.04 ABb0.33 ± 0.03 ABb0.29 ± 0.01 Cc0.37 ± 0.04 Ab0.35 ± 0.01 ABb0.32 ± 0.04 BCc
A–F Means marked with different letters on the same line are statistically different from each other (p < 0.05). a–c Means marked with different letters in the same column are statistically different from each other (p < 0.05). CB: Control bread; 7SD-B: Bread made with cold-backslopped sourdough at 7 °C; 15SD-B: Bread made with cold-backslopped sourdough at 15 °C; 25SD-B: Bread made with backslopped sourdough at 25 °C; 25SD25S-B: Bread made with sourdough stored at 25 °C; 25SD15S-B: Bread made with sourdough stored at 15 °C; 25SD7S-B: Bread made with sourdough stored at 7 °C.
Table 2. Color properties of the bread samples.
SamplesCrustCrumb
L*a*b*L*a*b*
CB59.72 ± 1.06 a8.78 ± 0.73 b31.62 ± 1.48 a71.46 ± 1.33 a−1.27 ± 0.02 g14.42 ± 0.72 c
7SD-B53.71 ± 1.28 c9.87 ± 0.73 a25.27 ± 0.95 b67.01 ± 0.79 c−0.11 ± 0.02 b14.72 ± 0.31 ab
15SD-B53.69 ± 0.83 c9.94 ± 0.88 a25.76 ± 1.33 b66.95 ± 0.46 c−0.07 ± 0.01 a14.82 ± 0.64 ab
25SD-B54.95 ± 0.73 b9.80 ± 0.88 a24.65 ± 1.03 b67.66 ± 0.54 bc−0.13 ± 0.01 c15.44 ± 0.35 a
25SD25S-B55.55 ± 0.89 b9.38 ± 0.47 ab25.56 ± 0.77 b68.46 ± 0.47 b−0.30 ± 0.01 f15.06 ± 0.82 ab
25SD15S-B55.43 ± 0.95 b9.65 ± 0.45 a25.73 ± 1.04 b68.19 ± 0.53 b−0.25 ± 0.01 e14.24 ± 0.77 c
25SD7S-B55.23 ± 1.05 b9.75 ± 0.63 a24.99 ± 1.08 b68.09 ± 0.54 b−0.21 ± 0.01 d14.83 ± 1.20 ab
a–g Means marked with different letters in the same column are statistically different from each other (p < 0.05). CB: Control bread; 7SD-B: Bread made with cold-backslopped sourdough at 7 °C; 15SD-B: Bread made with cold-backslopped sourdough at 15 °C; 25SD-B: Bread made with backslopped sourdough at 25 °C; 25SD25S-B: Bread made with sourdough stored at 25 °C; 25SD15S-B: Bread made with sourdough stored at 15 °C; 25SD7S-B: Bread made with sourdough stored at 7 °C. Data are expressed as mean ± standard deviation of six replicates.
Table 3. Thermal transition parameters of bread samples determined by DSC during storage.
Storage Time (Day)CB7SD-B15SD-B25SD-B25SD7S-B25SD15S-B25SD25S-B
Tonset (°C)061.33 ± 3.31 Ba71.70 ± 6.09 Ca100.91 ± 2.56 Dc52.88 ± 1.41 Aa78.74 ± 8.05 Ca93.41 ± 3.66 Da46.97 ± 0.86 Aa
488.29 ± 5.06 Cb69.79 ± 0.58 Ba89.90 ± 6.53 Cb98.75 ± 1.72 Cc94.61 ± 4.11 Cb94.43 ± 6.42 Ca58.59 ± 8.91 Aab
897.51 ± 2.10 Cc96.53 ± 0.11 Cb71.48 ± 2.57 Aa93.47 ± 3.37 Cb98.42 ± 0.37 Cb86.61 ± 3.29 Ba68.65 ± 7.85 Ab
Tend (°C)0169.33 ± 2.38 Aa184.89 ± 2.36 Aa212.03 ± 20.96 Bb183.67 ± 5.48 Aa218.10 ± 7.46 Bb178.69 ± 6.44 Aa206.15 ± 2.68 Bb
4175.26 ± 0.91 Ab180.05 ± 5.64 ABCa177.2 ± 5.46 ABa180.61 ± 4.63 ABCa187.08 ± 7.04 Ca184.23 ± 1.21 BCa173.35 ± 3.38 Aa
8178.60 ± 2.59 ABb181.66 ± 6.33 ABCa189.75 ± 14.82 BCab184.97 ± 3.94 ABCa193.73 ± 0.15 Ca175.087 ± 6.41 Aa180.99 ± 6.30 ABCa
Tpeak (°C)0101.48 ± 0.58 Ba107.37 ± 4.62 Ca115.73 ± 0.30 DEb87.67 ± 0.04 Aa113.92 ± 5.11 Da119.01 ± 1.67 Eb86.33 ± 0.05 Aa
4118.34 ± 1.67 Cb107.25 ± 0.09 Ba113.71 ± 3.05 Cb117.51 ± 1.97 Cb116.35 ± 1.25 Ca117.75 ± 2.14 Cab98.15 ± 6.64 Ab
8117.80 ± 2.11 Bb116.69 ± 0.09 Bb108.70 ± 1.35 Aa115.98 ± 0.39 Bb118.70 ± 2.02 Ba115.32 ± 0.91 Ba105.31 ± 6.21 Ab
Apparent enthalpy
(ΔH, J/g)
0638.20 ± 51.43 Ea622.93 ± 5.25 DEa408.27 ± 23.02 Ba592.00 ± 22.66 Da224.93 ± 14.10 Aa662 ± 32.74 Ea456.93 ± 9.01 Ca
4753.57 ± 52.78 Eb629 ± 26.52 CDa544.57 ± 22.36 Bb616.30 ± 9.49 Ca556.90 ± 24.46 Bb675.07 ± 37.65 Da476.07 ± 11.15 Aa
8765.87 ± 18.82 Cb652.40 ± 13.33 Ba560.17 ± 24.57 Ab625.10 ± 8.93 Ba652.30 ± 44.60 Bc748.07 ± 13.72 Cb526.43 ± 16.16 Ab
A–E: Means marked with different letters on the same line are statistically different (p < 0.05). a–c: Means marked with different letters in the same column are statistically different (p < 0.05). CB: Control bread; 7SD-B: Bread made with cold-backslopped sourdough at 7 °C; 15SD-B: Bread made with cold-backslopped sourdough at 15 °C; 25SD-B: Bread made with backslopped sourdough at 25 °C; 25SD25S-B: Bread made with sourdough stored at 25 °C; 25SD15S-B: Bread made with sourdough stored at 15 °C; 25SD7S-B: Bread made with sourdough stored at 7 °C.
Disclaimer/Publisher’s Note: The statements, opinions and data contained in all publications are solely those of the individual author(s) and contributor(s) and not of MDPI and/or the editor(s). MDPI and/or the editor(s) disclaim responsibility for any injury to people or property resulting from any ideas, methods, instructions or products referred to in the content.