Article

Effect of Pre- and Post-Fermentation Coffee Addition on the Physicochemical, Microbiological and Sensory Properties of Kefir During Refrigerated Storage


1
Department of Food Engineering, Graduate School of Natural and Applied Sciences, Aksaray University, Aksaray 68100, Türkiye
2
Department of Food Engineering, Faculty of Engineering, Aksaray University, Aksaray 68100, Türkiye
*
Author to whom correspondence should be addressed.
Fermentation 2026, 12(8), 346; https://doi.org/10.3390/fermentation12080346
Submission received: 19 June 2026 / Revised: 22 July 2026 / Accepted: 24 July 2026 / Published: 27 July 2026
(This article belongs to the Special Issue Dairy Fermentation from a Microbial Perspective)

Abstract

Kefir is a self-carbonated fermented milk produced with kefir grains which is valued for its complex symbiotic microbiota and probiotic potential. Flavouring kefir is a recognised strategy to broaden consumer appeal, yet the moment at which a flavouring ingredient is introduced—before or after fermentation—may differentially affect the product. The present study evaluated the effect of the timing of instant coffee addition on the physicochemical, microbiological and sensory properties of kefir during 14 days of refrigerated storage (4 ± 1 °C). Three kefir samples were produced from UHT cow’s milk (3% fat) inoculated with 3% (w/v) kefir grains: a control without coffee (K), kefir with 0.5% (w/v) instant coffee added before fermentation (PreF_CK) and kefir with 0.5% (w/v) instant coffee added after fermentation and maturation (PostF_CK). Samples were analysed on days 1, 7 and 14. The coffee addition significantly increased the total dry matter (K = 10.72%; PreF_CK = 11.04%; PostF_CK = 11.00%; p < 0.01) and slightly modified the titratable acidity and pH (p < 0.05), whereas the ash content (expressed in terms of dry matter) did not differ among samples (p > 0.05). The titratable acidity increased and the pH decreased with storage in all samples (p < 0.05). Crucially, the coffee addition—irrespective of the timing—did not impair the viability of the kefir microbiota; the total mesophilic aerobic bacteria, Lactobacillus spp., mesophilic lactic cocci and yeast counts did not differ significantly among the samples (p > 0.05) and remained high throughout storage (lactic acid bacteria ≥8 log CFU/g; yeast ≥5.7 log CFU/g), exceeding the minimum thresholds of the standards for fermented milk products. Sensory evaluation showed that the control achieved the highest odour and taste scores (p < 0.001), while among the coffee-containing samples, the post-fermentation addition (PostF_CK) was generally scored at least as high as the pre-fermentation addition (PreF_CK); overall acceptability did not differ significantly among the samples (p > 0.05). These findings demonstrate that 0.5% instant coffee can be incorporated into kefir without compromising its characteristic microbiota or storage stability and that post-fermentation addition is a viable route for producing an acceptable coffee-flavoured kefir.

1. Introduction

Kefir is a traditional self-carbonated fermented milk beverage characterised by a slightly acidic, mildly alcoholic taste and a creamy consistency. It is produced by inoculating milk with kefir grains, gelatinous masses composed of a complex symbiotic consortium of lactic acid bacteria, acetic acid bacteria and yeasts embedded in a polysaccharide–protein matrix known as kefiran [1,2]. Unlike most dairy fermentations driven by a defined starter culture, kefir fermentation is a mixed lactic and alcoholic process in which the microbial community converts lactose into lactic acid, ethanol and carbon dioxide while generating a wide array of aroma compounds, bioactive peptides, exopolysaccharides and organic acids [2,3]. The resulting beverage has attracted considerable scientific and commercial interest because of reported health-promoting effects, including modulation of the gut microbiota, antimicrobial and antioxidant activity, immunomodulation and improved lactose tolerance [3,4]. These benefits are increasingly supported by controlled and preclinical evidence rather than tradition alone; kefir has been shown to improve lactose digestion and tolerance in adults with lactose maldigestion [5], to improve the serum lipid profile in a randomised controlled trial [6] and to exert consistent anti-inflammatory, antioxidant and metabolic-regulatory effects, including chemopreventive activity in preclinical models [7,8]. Taken together, this evidence frames kefir not merely as a fermented milk with a pleasant sensory character but as a functional food whose value depends critically on delivering a viable, balanced microbiota to the consumer.
A defining feature of kefir, distinguishing it from many other fermented dairy products, is the high and diverse load of viable microorganisms it delivers. For a fermented milk to be regarded as a probiotic-type product, a sufficiently high count of viable lactic acid bacteria must be maintained until the end of its shelf life. The Turkish Food Codex Communiqué on Fermented Milk Products and the corresponding Codex standard require fermented milks to contain at least 7 log CFU/g (colony-forming units per gram) of the total characteristic microbiota and kefir to specifically contain no less than 4 log CFU/g of yeast [9,10]. Preserving the characteristic microbiota during processing and storage while ensuring compliance with these safety criteria is therefore a central quality criterion for any new kefir formulation.
Despite its nutritional and functional attributes, plain kefir has a pronounced sour and slightly yeasty flavour that limits its acceptance among consumers accustomed to sweeter or more aromatic dairy products. Flavouring and fortification are widely used strategies to broaden the appeal of fermented milks, and a range of additions (fruit pulps and juices, honey, cereals, herbal extracts and other functional ingredients) have been investigated for kefir [11,12,13]. Coffee is one of the most widely consumed beverages in the world and is a rich source of phenolic acids (notably chlorogenic acids), caffeine and melanoidins, compounds associated with antioxidant activity and a distinctive, broadly liked aroma [14,15]. Combining coffee with probiotic fermented milk is therefore an attractive concept, and a few studies have explored coffee-flavoured fermented dairy products [16]. However, important questions remain about how and when coffee should be incorporated.
The timing of an ingredient’s addition relative to fermentation can have a decisive influence on the final product. An ingredient added before fermentation is exposed to the entire metabolic activity of the culture and may interact with the microorganisms, potentially inhibiting or stimulating their growth, and be biotransformed during fermentation; coffee constituents such as caffeine and chlorogenic acids have documented antimicrobial properties that could, in principle, affect a sensitive starter [15,17]. Conversely, an ingredient added after fermentation and maturation does not participate in the fermentation itself but may better preserve its native aroma compounds. The few existing reports on coffee-flavoured fermented dairy have added coffee at a single stage only and have relied on sweetened, milk powder-fortified formulations [16]; to our knowledge, no study has directly compared pre- versus post-fermentation coffee additions in sugar-free kefir while simultaneously tracking the microbiological, physicochemical and sensory consequences over storage. Resolving this timing question is the specific novelty of the present work.
The aim of the present study was therefore to determine how the timing of instant coffee’s addition (before versus after fermentation) affects the physicochemical characteristics, the viability of the characteristic kefir microbiota and the sensory acceptability of kefir over 14 days of refrigerated storage and to assess whether coffee-flavoured kefir complying with the fermented milk standards can be produced.

2. Materials and Methods

2.1. Materials

Commercial ultra-high-temperature (UHT) treated cow’s milk (3.0% fat; SEK brand) obtained from a local market was used as the production medium. Commercial spray-dried instant coffee (Jacobs Monarch Gold; JDE Peet’s, Bremen, Germany), also purchased from a local market, was used as the flavouring ingredient. According to the manufacturer’s declaration, the product is a 100% spray-dried soluble coffee of medium-dark roast, obtained from a blend of Coffea arabica and Coffea canephora (robusta) beans, with no added carriers, sugars or flavourings. Instant coffees of this type typically contain to the order of 3–5% caffeine and 3–6% chlorogenic acids on a dry-mass basis, together with roasting-derived melanoidins [14,15]; the exact phenolic, antioxidant and caffeine contribution of the coffee used here was, however, not quantified analytically in the present study (see limitations). Traditional kefir grains used as the inoculum were obtained from a local producer in Ankara, Türkiye, the same grain source used in our previous study [18]. All microbiological culture media and chemical reagents were of analytical grade.
The kefir starter culture was first activated by inoculating UHT cow’s milk with 10% (w/v) kefir grains and incubating at 25 °C for 17 h. After incubation, the kefir grains were separated from the milk with a sterile strainer and re-inoculated into fresh UHT milk; this bioprocess was repeated through successive inoculations to obtain the starter culture required for the study.

2.2. Production of Kefir Samples

Three kefir treatments were produced (Figure 1). UHT milk was inoculated with 3% (w/v) kefir grains and incubated at 25 °C until the pH reached 4.5–4.6 (approximately 20–24 h), after which the grains were removed with a sterile strainer. The kefir was cooled and matured at 4 ± 1 °C for 24 h and then stored for 14 days. The control kefir (K) received no coffee. For the pre-fermentation coffee kefir (PreF_CK), 0.5% (w/v) instant coffee was first dissolved completely in the UHT milk at 25 °C. The coffee-containing milk was then inoculated with 3% (w/v) kefir grains and fermented at 25 °C for 20–24 h to a pH of 4.5 so that the coffee was present throughout fermentation. After the grains were removed, the coffee kefir was matured at 4 °C for 24 h and stored at 4 ± 1 °C for 14 days. For the post-fermentation coffee kefir (PostF_CK), UHT milk was inoculated with 3% (w/v) kefir grains and incubated at 25 °C for 20–24 h to a pH of 4.5. After the grains were removed, the kefir was matured at 4 ± 1 °C for 24 h, after which 0.5% (w/v) instant coffee was dissolved completely into the product, and the kefir was stored at 4 ± 1 °C for 14 days. The 0.5% (w/v) coffee level was selected on the basis of informal preliminary in-house tasting by the research team before the main study, in which kefirs prepared with higher instant coffee concentrations (1% and 2%, w/v) were consistently judged unacceptably bitter and astringent, an effect attributable to the caffeine and chlorogenic-acid content of coffee superimposed on the already acidic, sugar-free kefir base. A comparable decline in consumer enjoyment with an increasing coffee concentration has been reported for coffee-flavoured fermented milk [16]. The 0.5% level represented the highest concentration that delivered a clearly perceptible coffee character while keeping the bitterness within an acceptable range in a formulation deliberately prepared without added sugar. Glass jars were used as the packaging material throughout. Two independent production replicates were carried out.

2.3. Physicochemical Analyses

The samples were analysed on days 1, 7 and 14 of refrigerated storage. The total dry matter was determined gravimetrically by oven drying [19]. The ash content was determined via incineration in a muffle furnace and expressed as a percentage of dry matter [20]. The fat content was determined by the Gerber method [21]. The titratable acidity was determined through titration with 0.1 mol/L sodium hydroxide and expressed as percentage lactic acid [22]. The pH was measured with a calibrated digital pH meter (Inolab; WTW, München, Germany) [23]. The composition of the milk was characterised at the start of the study using the same methods.

2.4. Microbiological Analyses

For enumeration of the characteristic kefir microbiota, 10 g of each kefir sample was aseptically homogenised in 90 mL of sterile maximum recovery diluent (MRD; Merck, Germany; 1.0 g/L peptone and 8.5 g/L sodium chloride) and serially diluted (1:9) in the same diluent, and appropriate dilutions were plated [24]. The total mesophilic aerobic bacteria were enumerated by the spread plate method on plate count agar (PCA; Merck, Darmstadt, Germany) incubated aerobically at 30 °C for 48 h [25]; Lactobacillus spp. via the pour plate method on de Man, Rogosa and Sharpe (MRS) agar (Merck) incubated anaerobically at 30 °C for 72 h [26]; mesophilic lactic cocci via the pour plate method on M17 agar (Merck) incubated aerobically at 30 °C for 72 h [27] and yeasts through the spread plate method on yeast extract glucose chloramphenicol agar (YGC; Merck) incubated aerobically at 25 °C for 3 days [28]. Counts were expressed in log CFU/g, where log denotes the base-10 logarithm. Analyses were performed on days 1, 7 and 14.

2.5. Sensory Evaluation

Sensory evaluation was carried out using a descriptive (acceptance) approach [29] on days 1, 7 and 14 of refrigerated storage by a panel of 10 semi-trained assessors drawn from the academic staff and graduate students of the Faculty of Engineering and the Faculty of Architecture and Design of Aksaray University, all of whom were habitual consumers of fermented dairy products; “semi-trained” denotes panellists familiar with kefir and with the use of structured scoring scales but not formally calibrated against reference standards. The panellists were healthy adults aged 22–45 years, with both sexes represented, and they were selected on the basis of their regular consumption of fermented dairy products and previous experience with hedonic sensory testing of dairy samples in our laboratory. The exclusion criteria were a known allergy or intolerance to milk or milk products (including lactose intolerance), pregnancy or lactation, any current acute respiratory or gastrointestinal illness affecting taste or smell, smoking within one hour before the session and the consumption of strongly flavoured food or beverages within one hour before the session.
The same panel evaluated all three kefir samples (K, PreF_CK and PostF_CK) on each of the three sampling days (days 1, 7 and 14). The evaluation was repeated across the two independent production replicates, giving 20 individual scores per sample at each sampling day. Each kefir sample (∼50 mL) was served at 4–6 °C in coded white plastic cups, presented in randomised order to minimise order bias. The sessions were conducted in a quiet, well-ventilated room at room temperature (20–22 °C) and free of external odours under daylight conditions. Panellists were seated separately to avoid interaction during scoring, and water and unsalted crackers were provided between samples for palate cleansing. Using a structured hedonic (acceptance) scale, panellists scored each sample for appearance and texture, odour, taste and overall acceptability, with higher scores denoting greater enjoyment. The averaged scores for the constituent attributes were used to express each main sensory dimension on a six-point scale (appearance and texture, odour and taste) and the overall acceptability on a five-point scale.

2.6. Statistical Analysis

The experiment was set up as a two-factor design with the sample (K, PreF_CK and PostF_CK) and storage day (1, 7 and 14) as fixed factors. Each physicochemical and microbiological determination was performed in duplicate on two independent production replicates (n = 2 per sample × day cell; n = 6 per sample), and the sensory evaluation was performed by a 10-member semi-trained panel across the two production replicates (n = 20 per sample × day cell; n = 60 per sample). Data were subjected to two-way analysis of variance (ANOVA) with the sample, storage day and their interaction as factors, and means were compared using Tukey’s honestly significant difference test at a significance level of p < 0.05 [30]. The magnitude of each effect was quantified using the partial eta-squared statistic ( η p 2 ), interpreted following Cohen’s benchmarks ( η p 2 ≈ 0.01 (small), 0.06 (medium), 0.14 (large)). The ANOVA assumptions of residual normality and homogeneity of variances were verified using the Shapiro–Wilk and Levene tests, respectively. Because the sensory ratings were ordinal and departed from normality, the sample effect on each sensory attribute was additionally confirmed by the non-parametric Kruskal–Wallis test with Dunn’s post hoc comparisons (Bonferroni correction), and the corresponding epsilon-squared ( ε 2 ) effect size is reported. These non-parametric results were fully concordant with the parametric analysis. Within each table, different lowercase letters denote significant differences among samples, and where reported, different uppercase letters denote significant differences among storage days. Principal component analysis (PCA) was performed on the standardised physicochemical and microbiological variables to visualise the relationships among samples and storage days. Analyses were carried out using IBM SPSS Statistics v. 26 (IBM Corp., Armonk, NY, USA), with effect sizes and non-parametric confirmation computed in Python v. 3.11 (Python Software Foundation, Wilmington, DE, USA) using the SciPy and statsmodels libraries. Values in the text are reported as the mean ± standard deviation (S.D.), with 95% confidence intervals given for the principal comparisons.

3. Results

3.1. Composition of the Milk

The UHT cow’s milk used as the production medium contained (11.14 ± 0.23)% total dry matter, (8.14 ± 0.23)% solids-not-fat, 3.00% fat and (0.63 ± 0.01)% ash ((5.61 ± 0.18)% in dry matter), with a pH of 6.60 and a titratable acidity of (0.17 ± 0.04)% lactic acid (Table 1). These values are typical of standardised commercial cow’s milk and provided a uniform substrate for all three treatments.

3.2. Physicochemical Properties

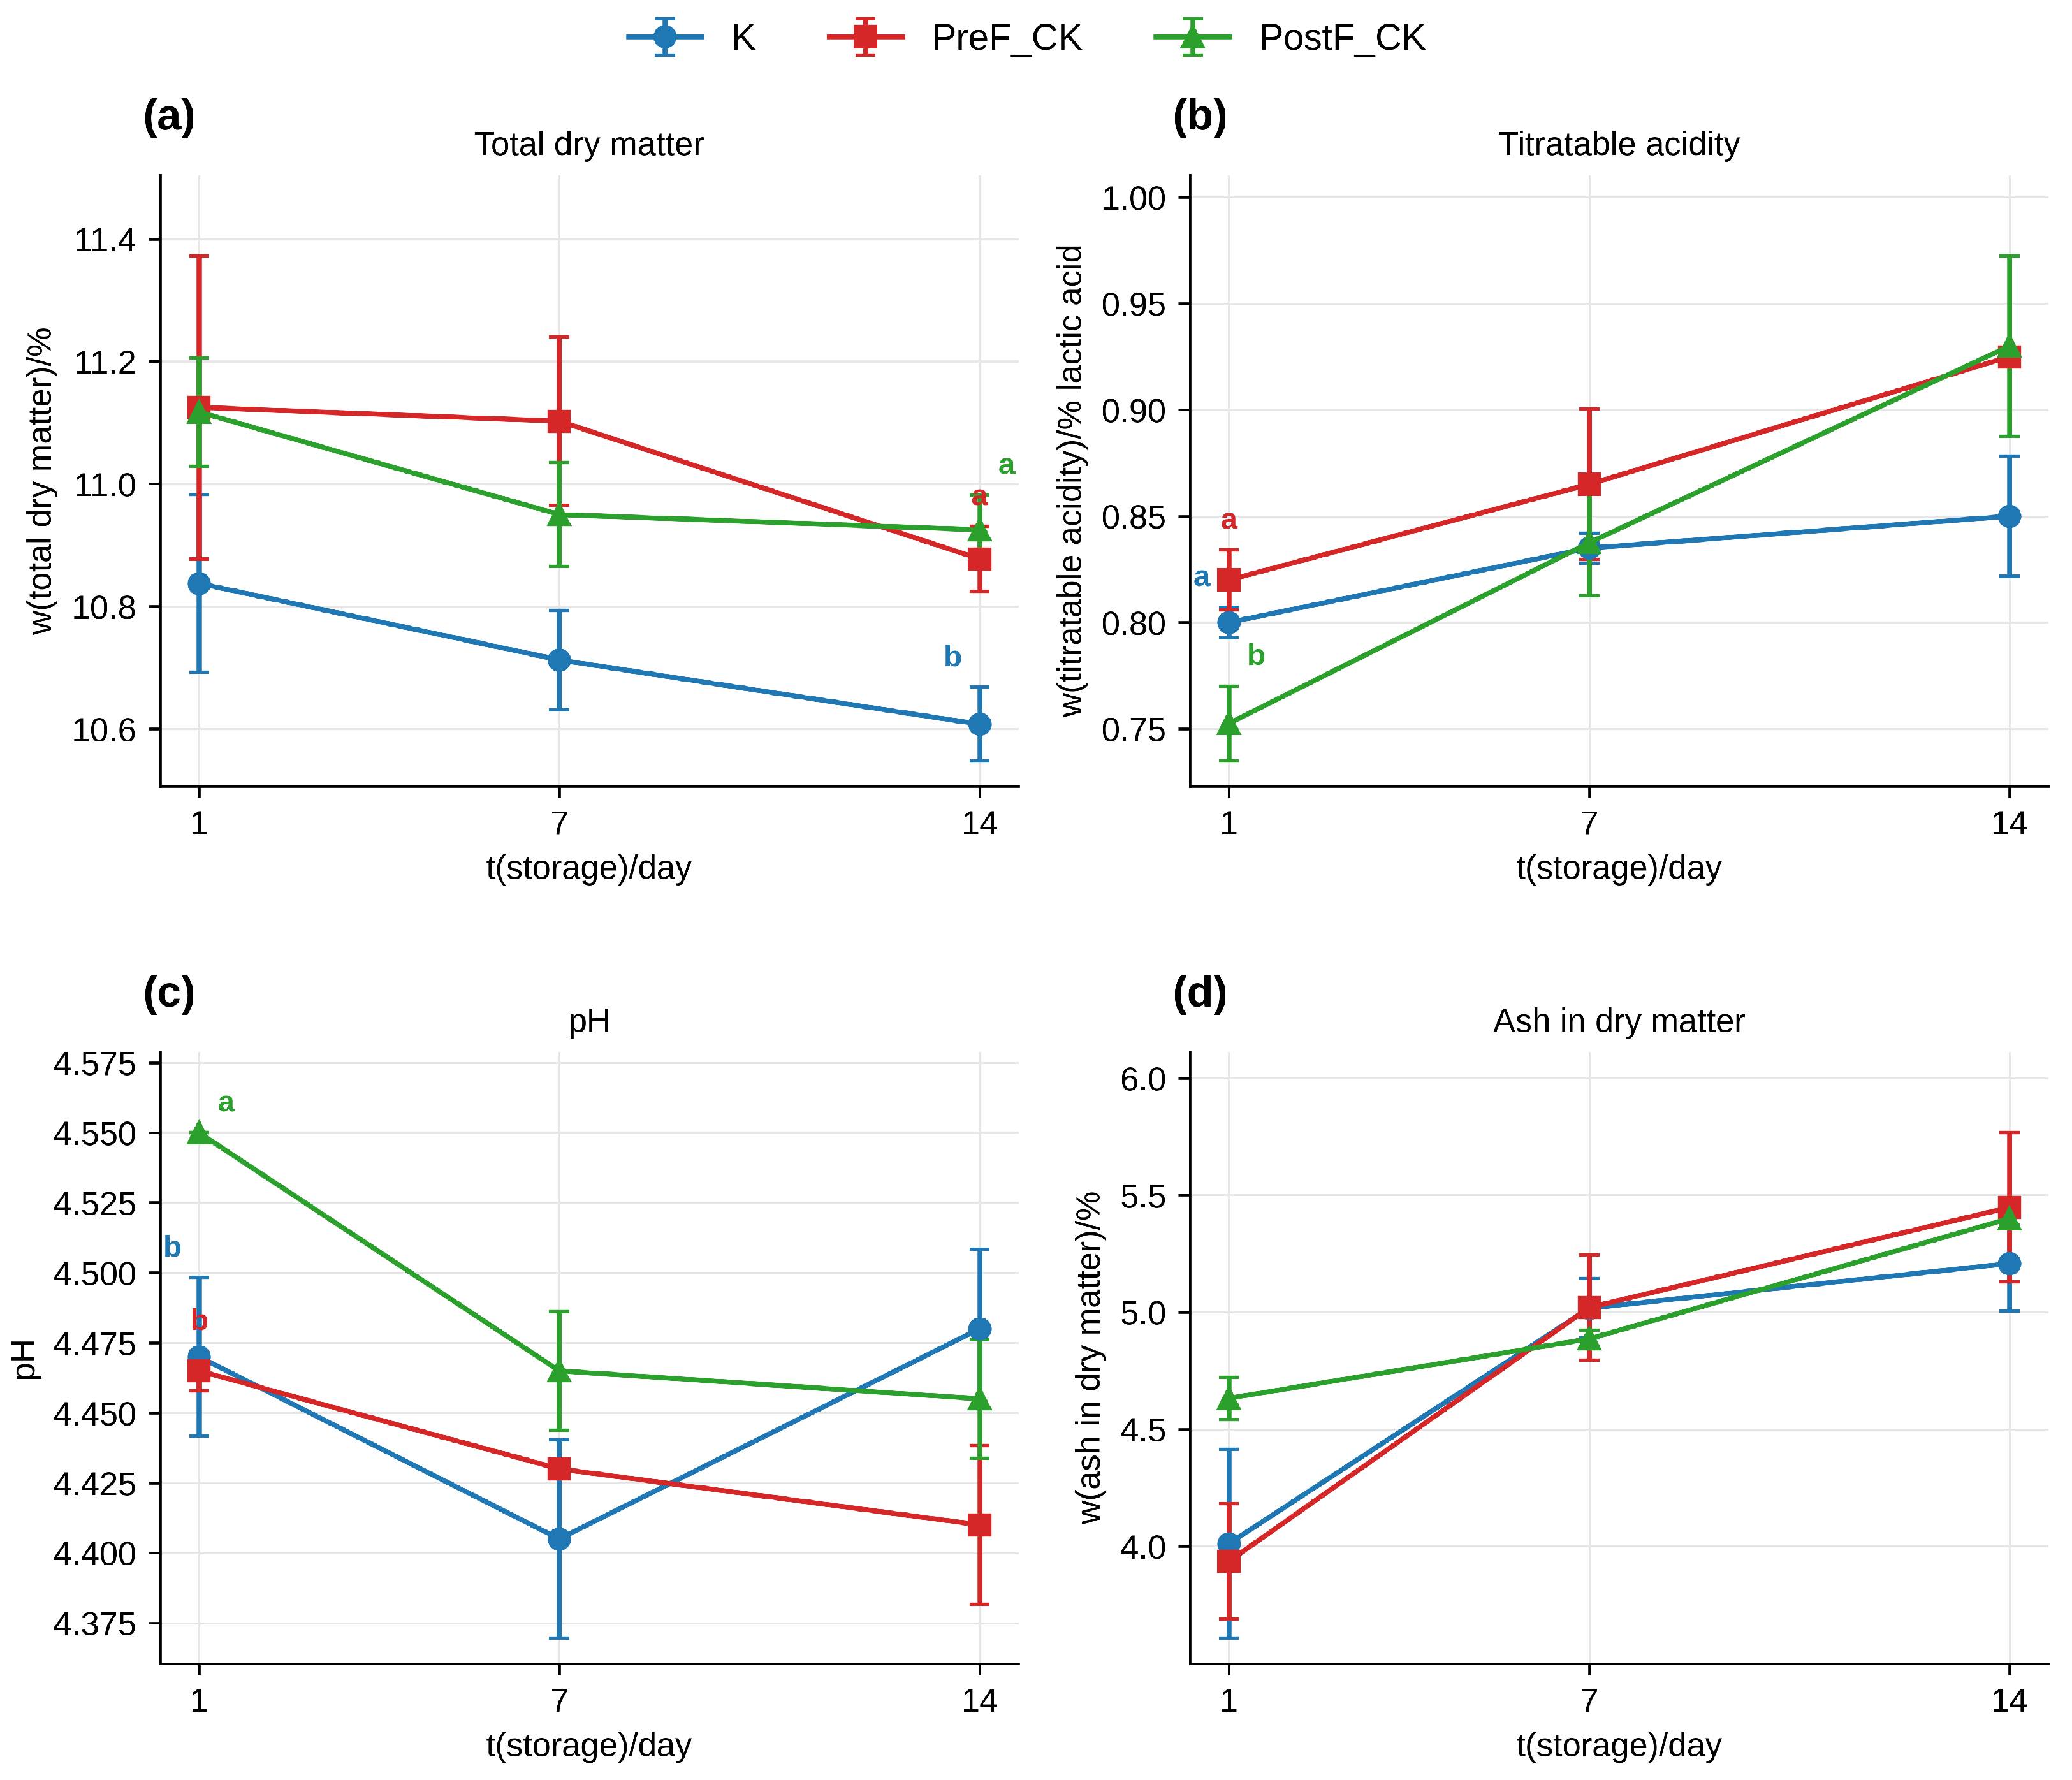
The physicochemical properties of the kefir samples during storage are illustrated in Figure 2 (the complete numerical data, mean ± S.D. with S.E.M., are provided in Table S1 of the Supplementary Materials). The total dry matter differed significantly among the samples (p < 0.01, η p 2 = 0.73, a large effect); both coffee-containing kefirs (PreF_CK = 11.04%, 95% confidence interval (CI) 10.85–11.22; PostF_CK = 11.00%, 95% CI 10.88–11.11) had a higher dry matter content than the control (K = 10.72%, 95% CI 10.58–10.86), reflecting the additional solids contributed by the 0.5% instant coffee (Table 2). The dry matter decreased slightly with storage in all samples (p < 0.05).
The titratable acidity differed significantly among the samples (p < 0.05) and increased markedly with storage (p < 0.001), rising from 0.79% on day 1 to 0.90% lactic acid on day 14 averaged across samples. The significant sample × day interaction (p < 0.05) indicates that the rate of post-acidification differed among treatments, with the coffee samples reaching the highest day-14 acidity (0.93%). Correspondingly, the pH differed among the samples (p < 0.01) and changed with storage (p < 0.01), remaining in the narrow range of 4.41–4.55 typical of mature kefir [1,2].
The ash content (expressed in dry matter) did not differ significantly among the samples (p > 0.05), confirming that the small amount of added coffee did not materially alter the mineral fraction; however, the ash in dry matter increased significantly with storage (p < 0.001), from 4.19% on day 1 to 5.35% on day 14, mirroring the relative concentration of minerals as other solids were metabolised. The fat content was held constant at 3.00% by the use of standardised milk. As demonstrated in Table 2, the large sample effect sizes for the dry matter ( η p 2 = 0.73), pH ( η p 2 = 0.68) and titratable acidity ( η p 2 = 0.52) indicate that the coffee treatments produced not merely statistically detectable but substantial shifts in these compositional parameters, whereas the large day and sample × day effect sizes confirm that storage was the dominant source of variation.

3.3. Microbiological Properties

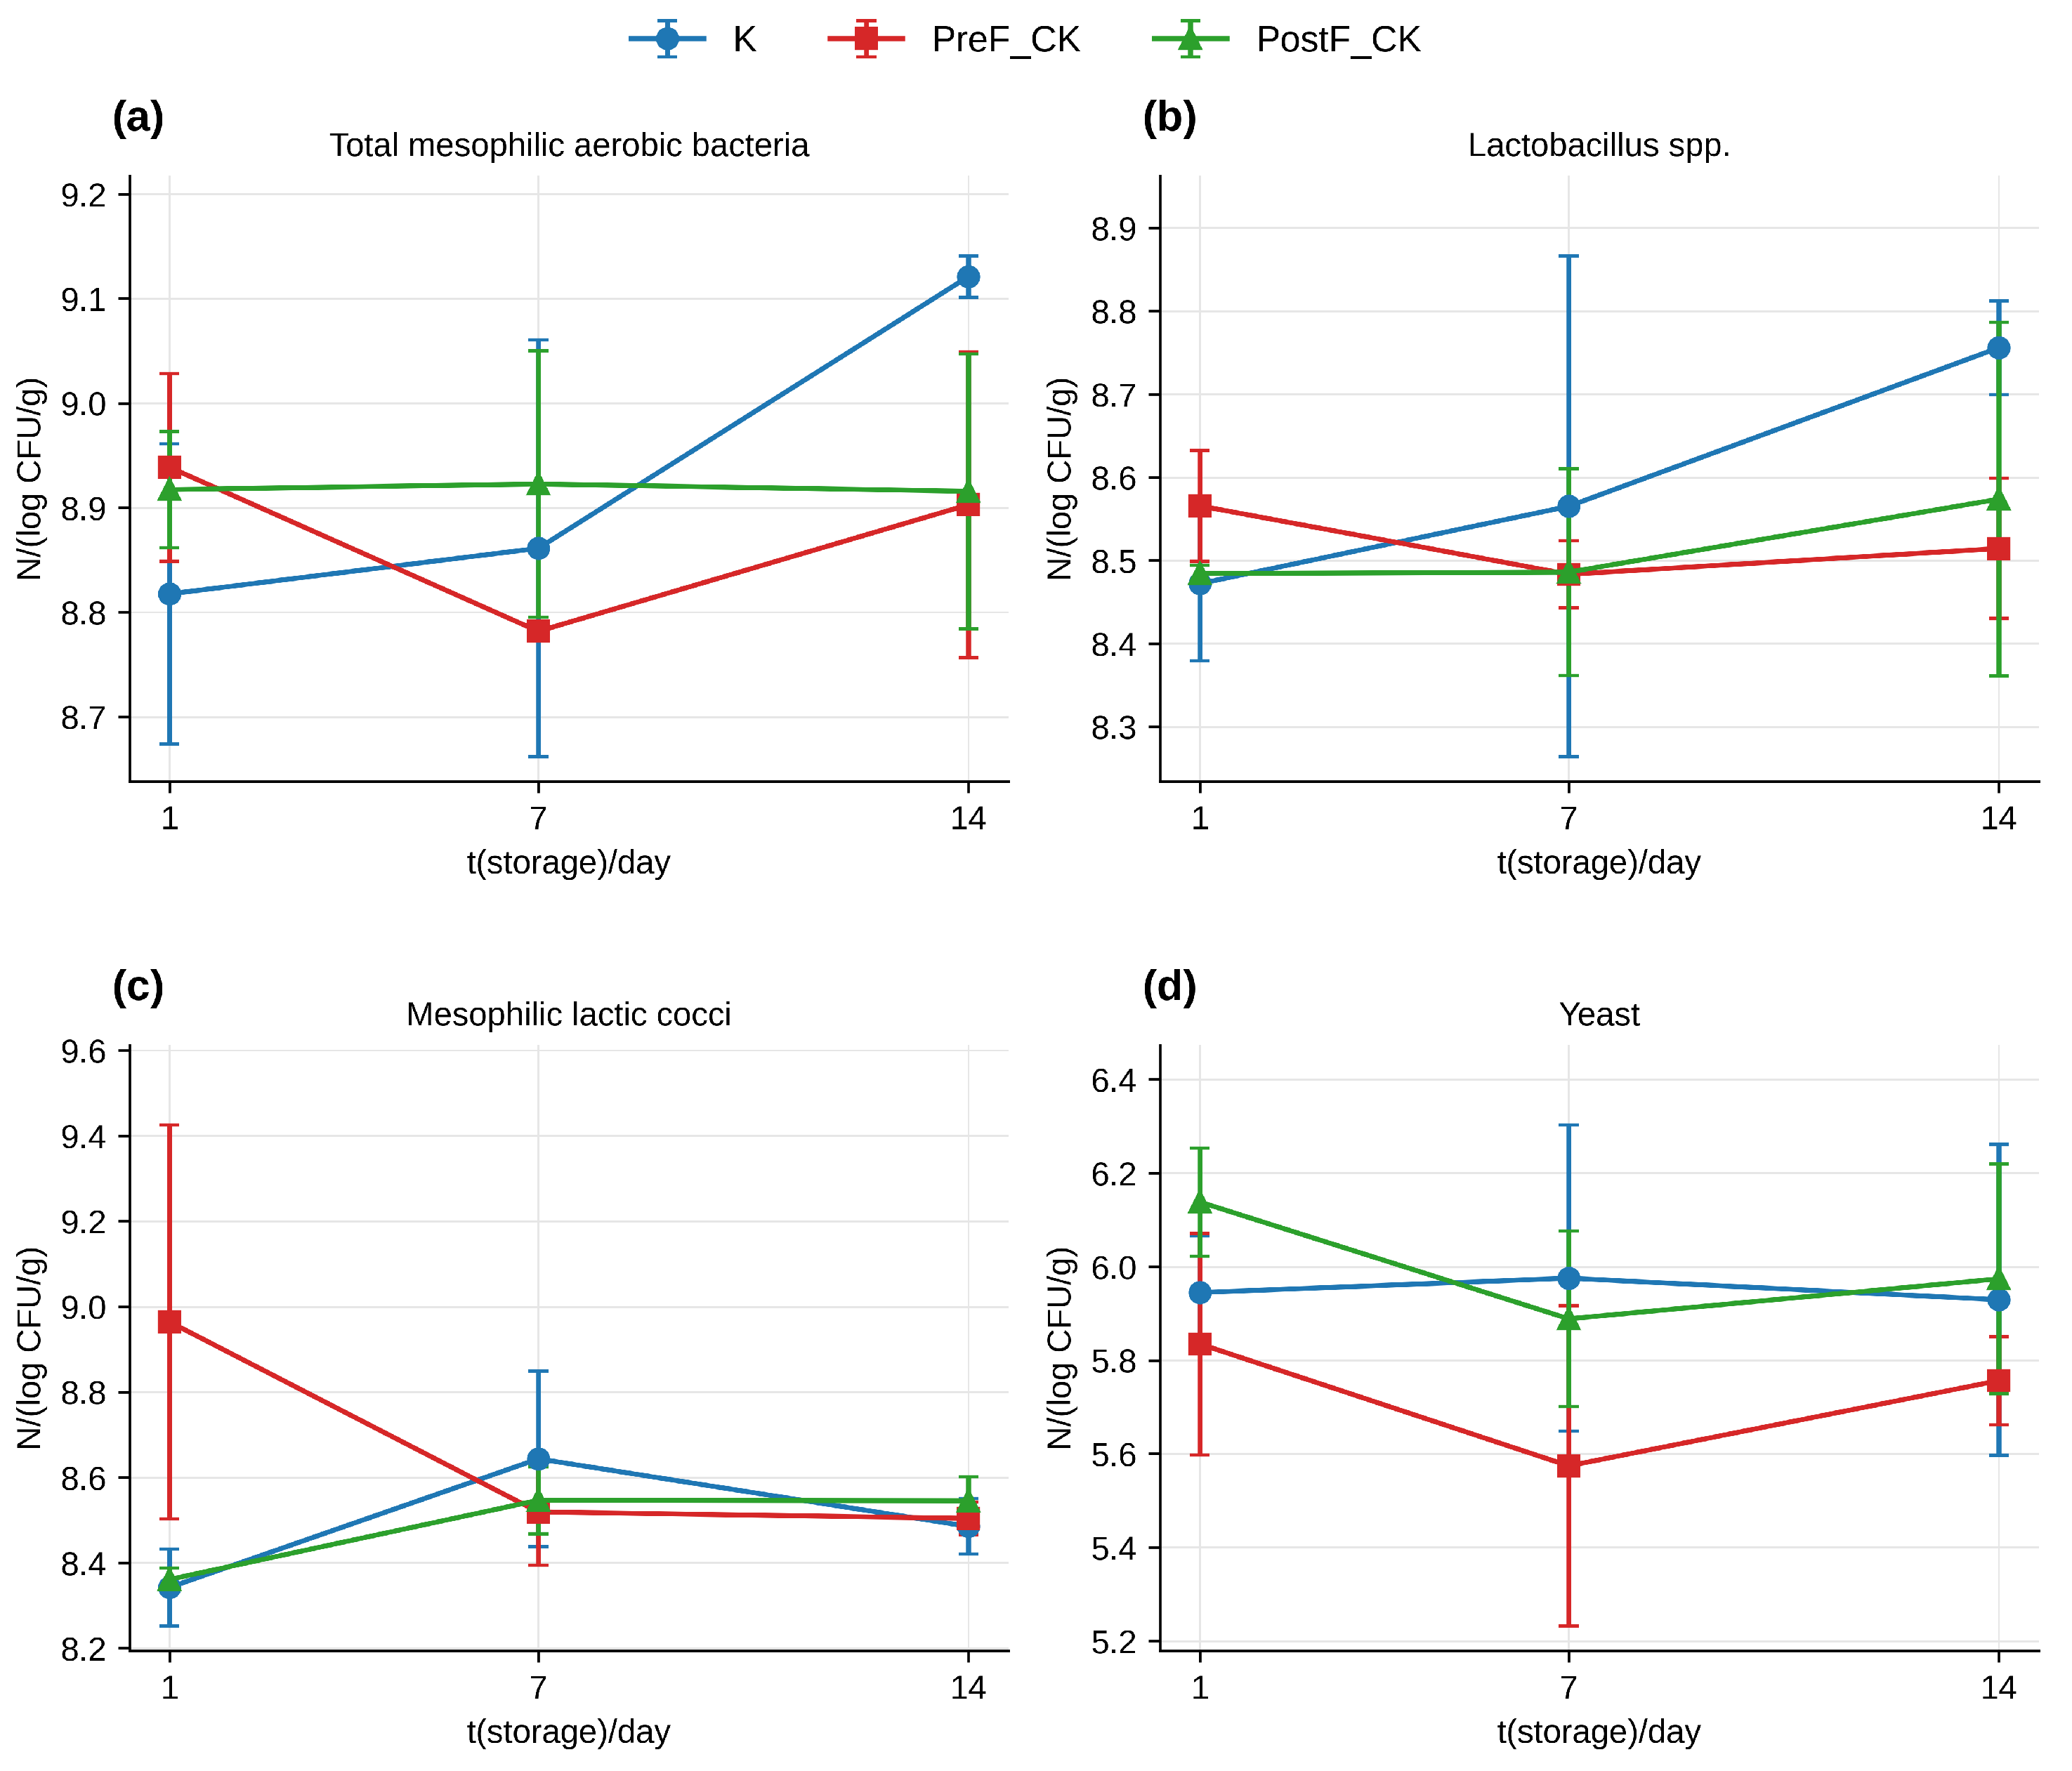
The microbiological results are illustrated in Figure 3 (the complete numerical data, mean ± S.D. with S.E.M., are provided in Table S2 of the Supplementary Materials). The two-way ANOVA p values and partial eta-squared effect sizes ( η p 2 ) for the microbiological counts are listed in Table 3. The central finding is that the addition of coffee, regardless of timing, did not significantly affect the viability of any group of the characteristic kefir microbiota: the counts of total mesophilic aerobic bacteria, Lactobacillus spp., mesophilic lactic cocci and yeast did not differ significantly among the K, PreF_CK and PostF_CK samples (p > 0.05 in all cases, Table 3).
Throughout the 14-day storage period, all samples maintained high microbial loads. The total mesophilic aerobic bacteria remained at approximately 8.9 log CFU/g, Lactobacillus spp. remained at 8.5–8.6 log CFU/g, and mesophilic lactic cocci remained at approximately 8.5 log CFU/g so that the lactic acid bacteria consistently exceeded 8 log CFU/g. The yeast counts remained at 5.7–6.0 log CFU/g in all samples. None of the microbial groups showed a significant change with the storage day (p > 0.05), indicating good stability of the microbiota under refrigeration. For every microbial group, the sample factor was both non-significant (p > 0.05) and accompanied by small-to-moderate effect sizes ( η p 2 = 0.08–0.34), reinforcing that the timing of the coffee addition did not meaningfully perturb the kefir microbiota.
A closer reading of the mesophilic lactic cocci data is nonetheless instructive. Although the differences did not reach statistical significance, the coffee-containing kefirs tended to carry higher mesophilic lactic cocci counts than the control on both day 1 (PreF_CK = 8.96 versus K = 8.34 log CFU/g) and across storage, with the largest separation being observed for the pre-fermentation sample.

3.4. Sensory Properties

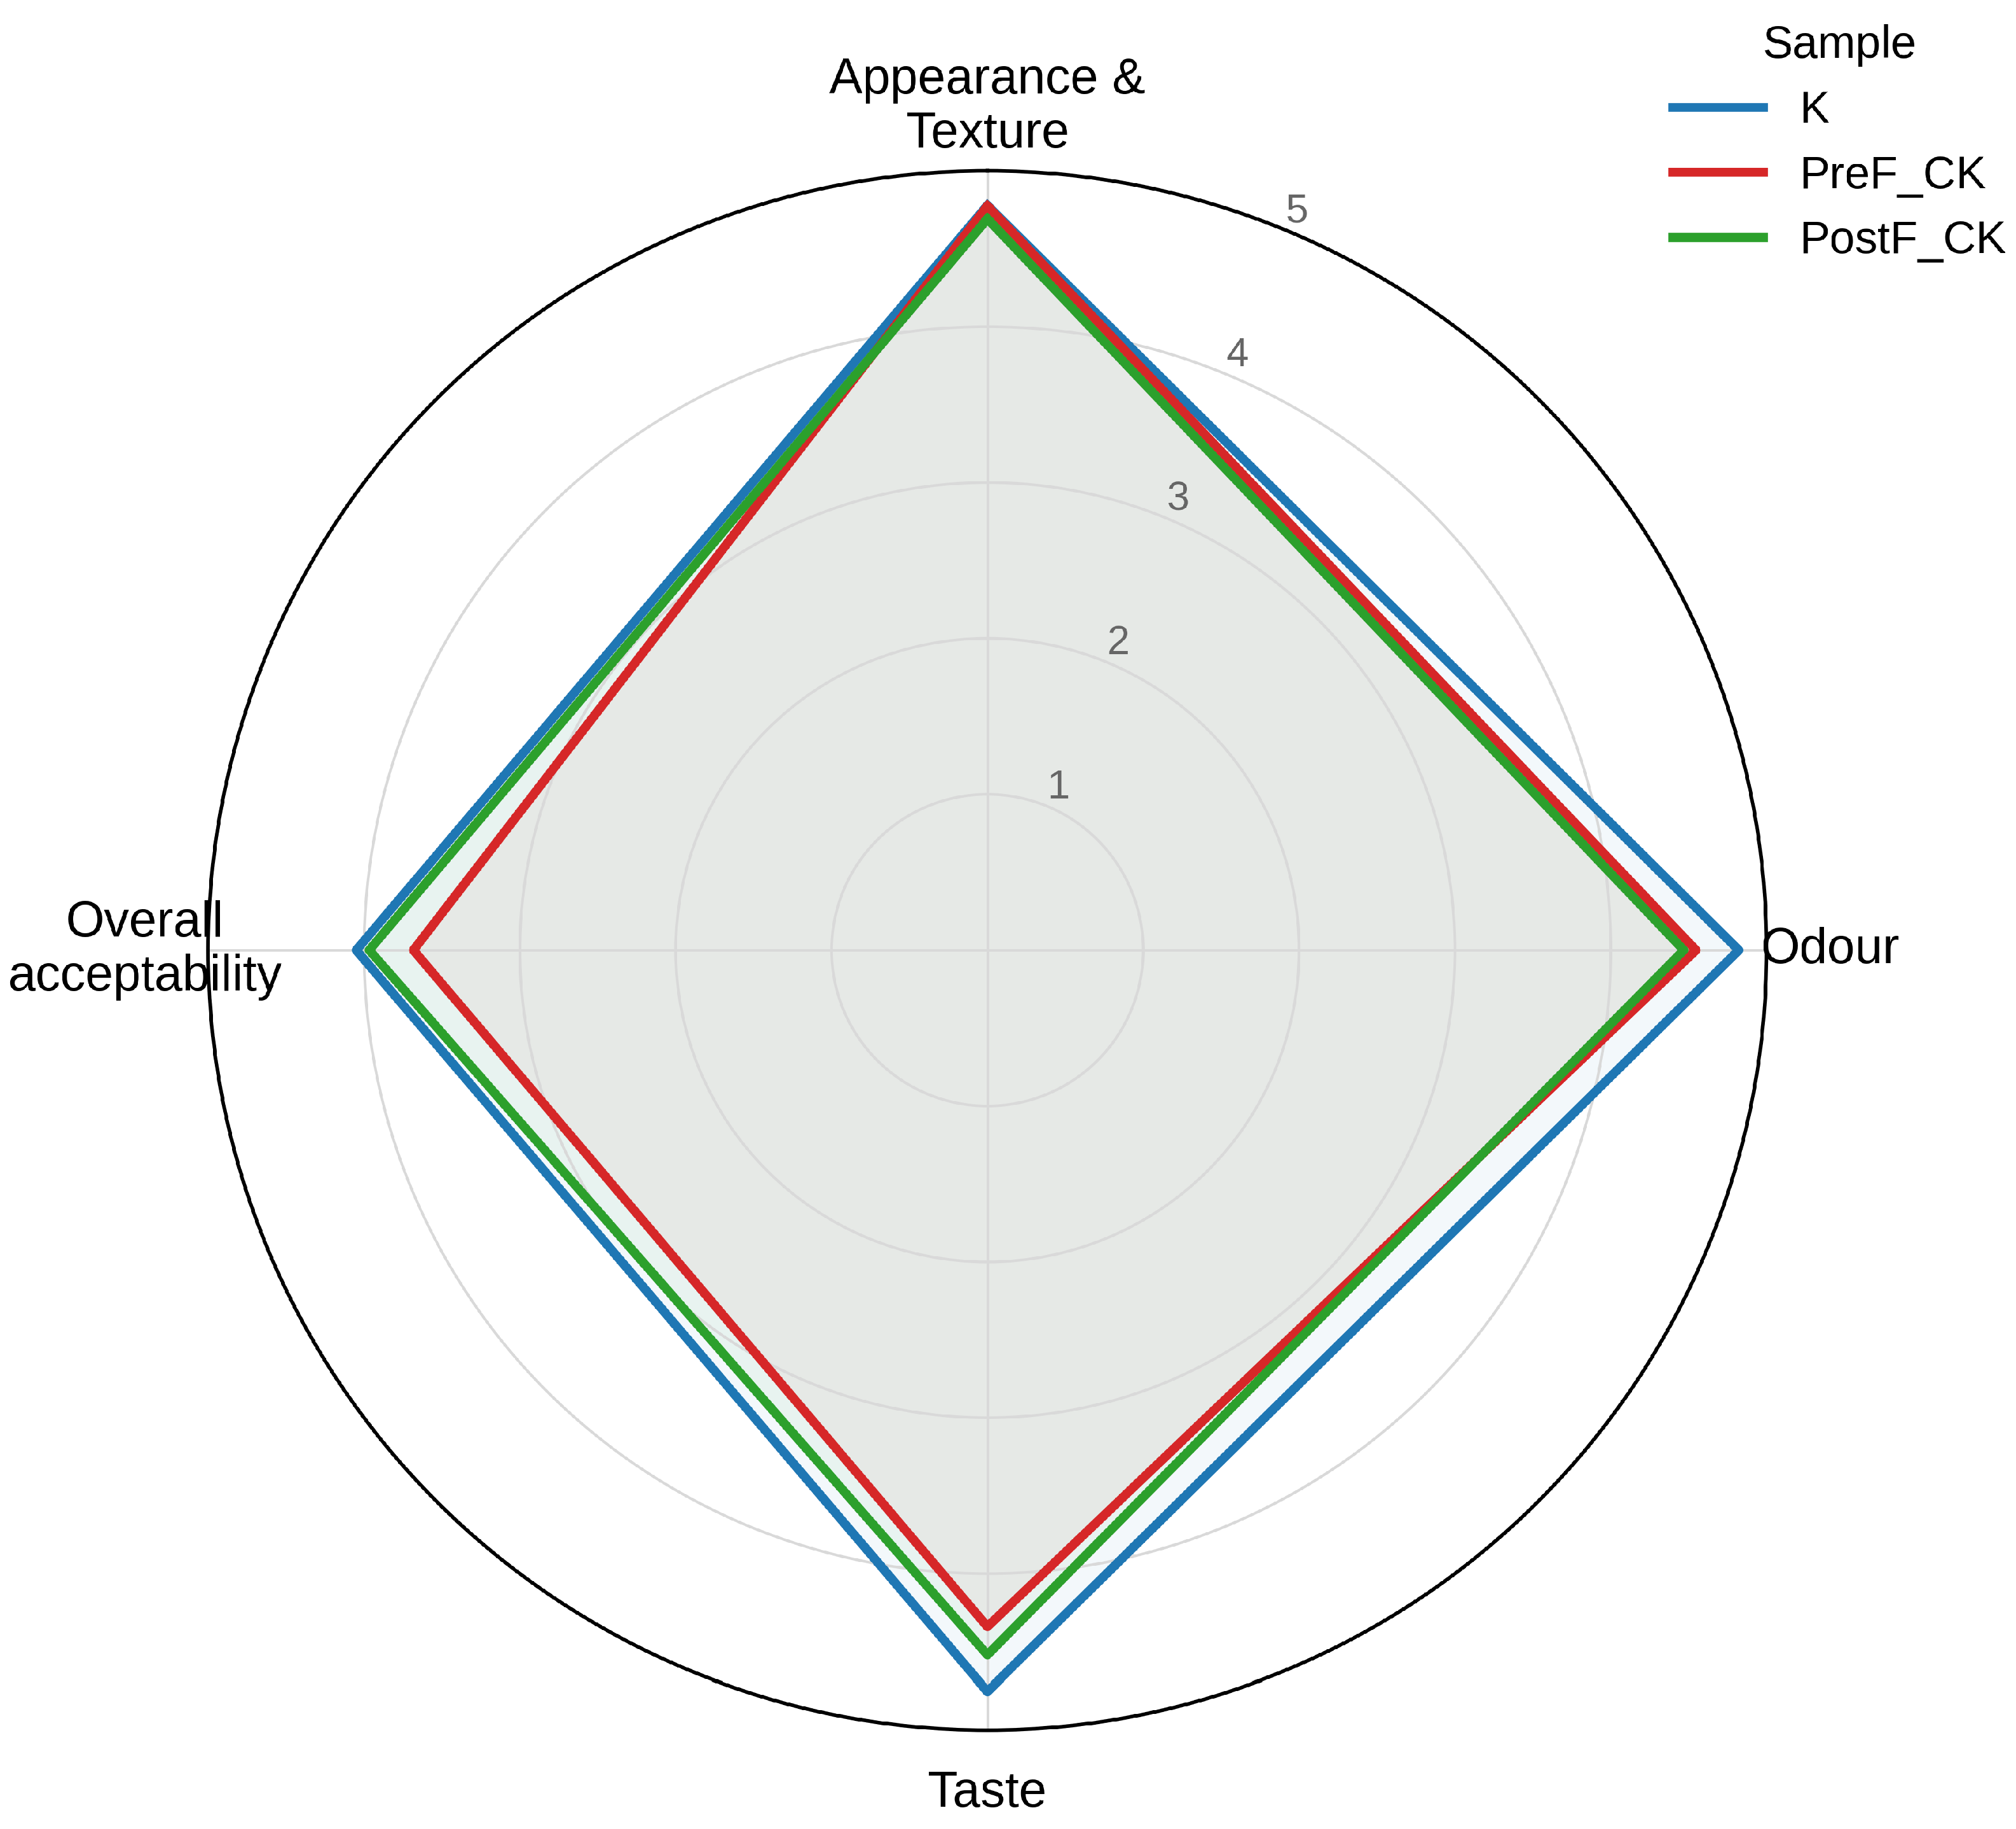
The sensory scores are presented in Table 4 and Figure 4. According to Table 5, the appearance and texture did not differ significantly among the samples (p > 0.05), indicating that the small amount of dissolved instant coffee did not produce a visually or texturally objectionable product. In contrast, both the odour and taste differed significantly among the samples (p < 0.001 for both). The control kefir (K) received the highest odour score (5.78) and the highest taste score (5.54). Among the coffee-containing samples, the odour scores were similar (PreF_CK = 5.46; PostF_CK = 5.37), and both were significantly lower than the control. In terms of taste, the post-fermentation sample (PostF_CK = 5.27) scored significantly higher than the pre-fermentation sample (PreF_CK = 5.09; Dunn, p = 0.024). Notably, PostF_CK did not differ significantly from K (Dunn, p = 0.073), whereas PreF_CK was the lowest-rated sample for taste (p < 0.001 versus K). A significant sample × day interaction for taste (p < 0.05) indicates that these differences varied over storage. The large effect size for the taste difference ( η p 2 = 0.14) confirms that the taste advantage of the post- over pre-fermentation addition is a substantial, reproducible effect; this advantage is specific to taste, as overall acceptability did not differ significantly among the samples.
Notwithstanding the differences in individual attributes, overall acceptability did not differ significantly among the three samples (p > 0.05; K = 4.05, PreF_CK = 3.68 and PostF_CK = 3.97 on the five-point scale). The Kruskal–Wallis test, applied because the ordinal sensory ratings departed from normality, fully reproduced the parametric pattern; the sample effect was highly significant for odour and taste (both p < 0.001) but not for appearance and texture or overall acceptability. Dunn’s post hoc comparisons (Bonferroni-corrected) showed that the control scored significantly higher than both coffee samples for odour, whereas for taste, the pre-fermentation sample (PreF_CK) was significantly lower than both the control (p < 0.001) and the post-fermentation sample (PostF_CK, p = 0.024). Critically, the post-fermentation sample did not differ significantly from the control in terms of taste (p = 0.073). The effect sizes were medium for odour ( ε 2 = 0.085; η p 2 = 0.09) and large for taste ( ε 2 = 0.125; η p 2 = 0.14) but small and non-significant for overall acceptability ( ε 2 = 0.017; η p 2 = 0.03).

3.5. Multivariate Analysis

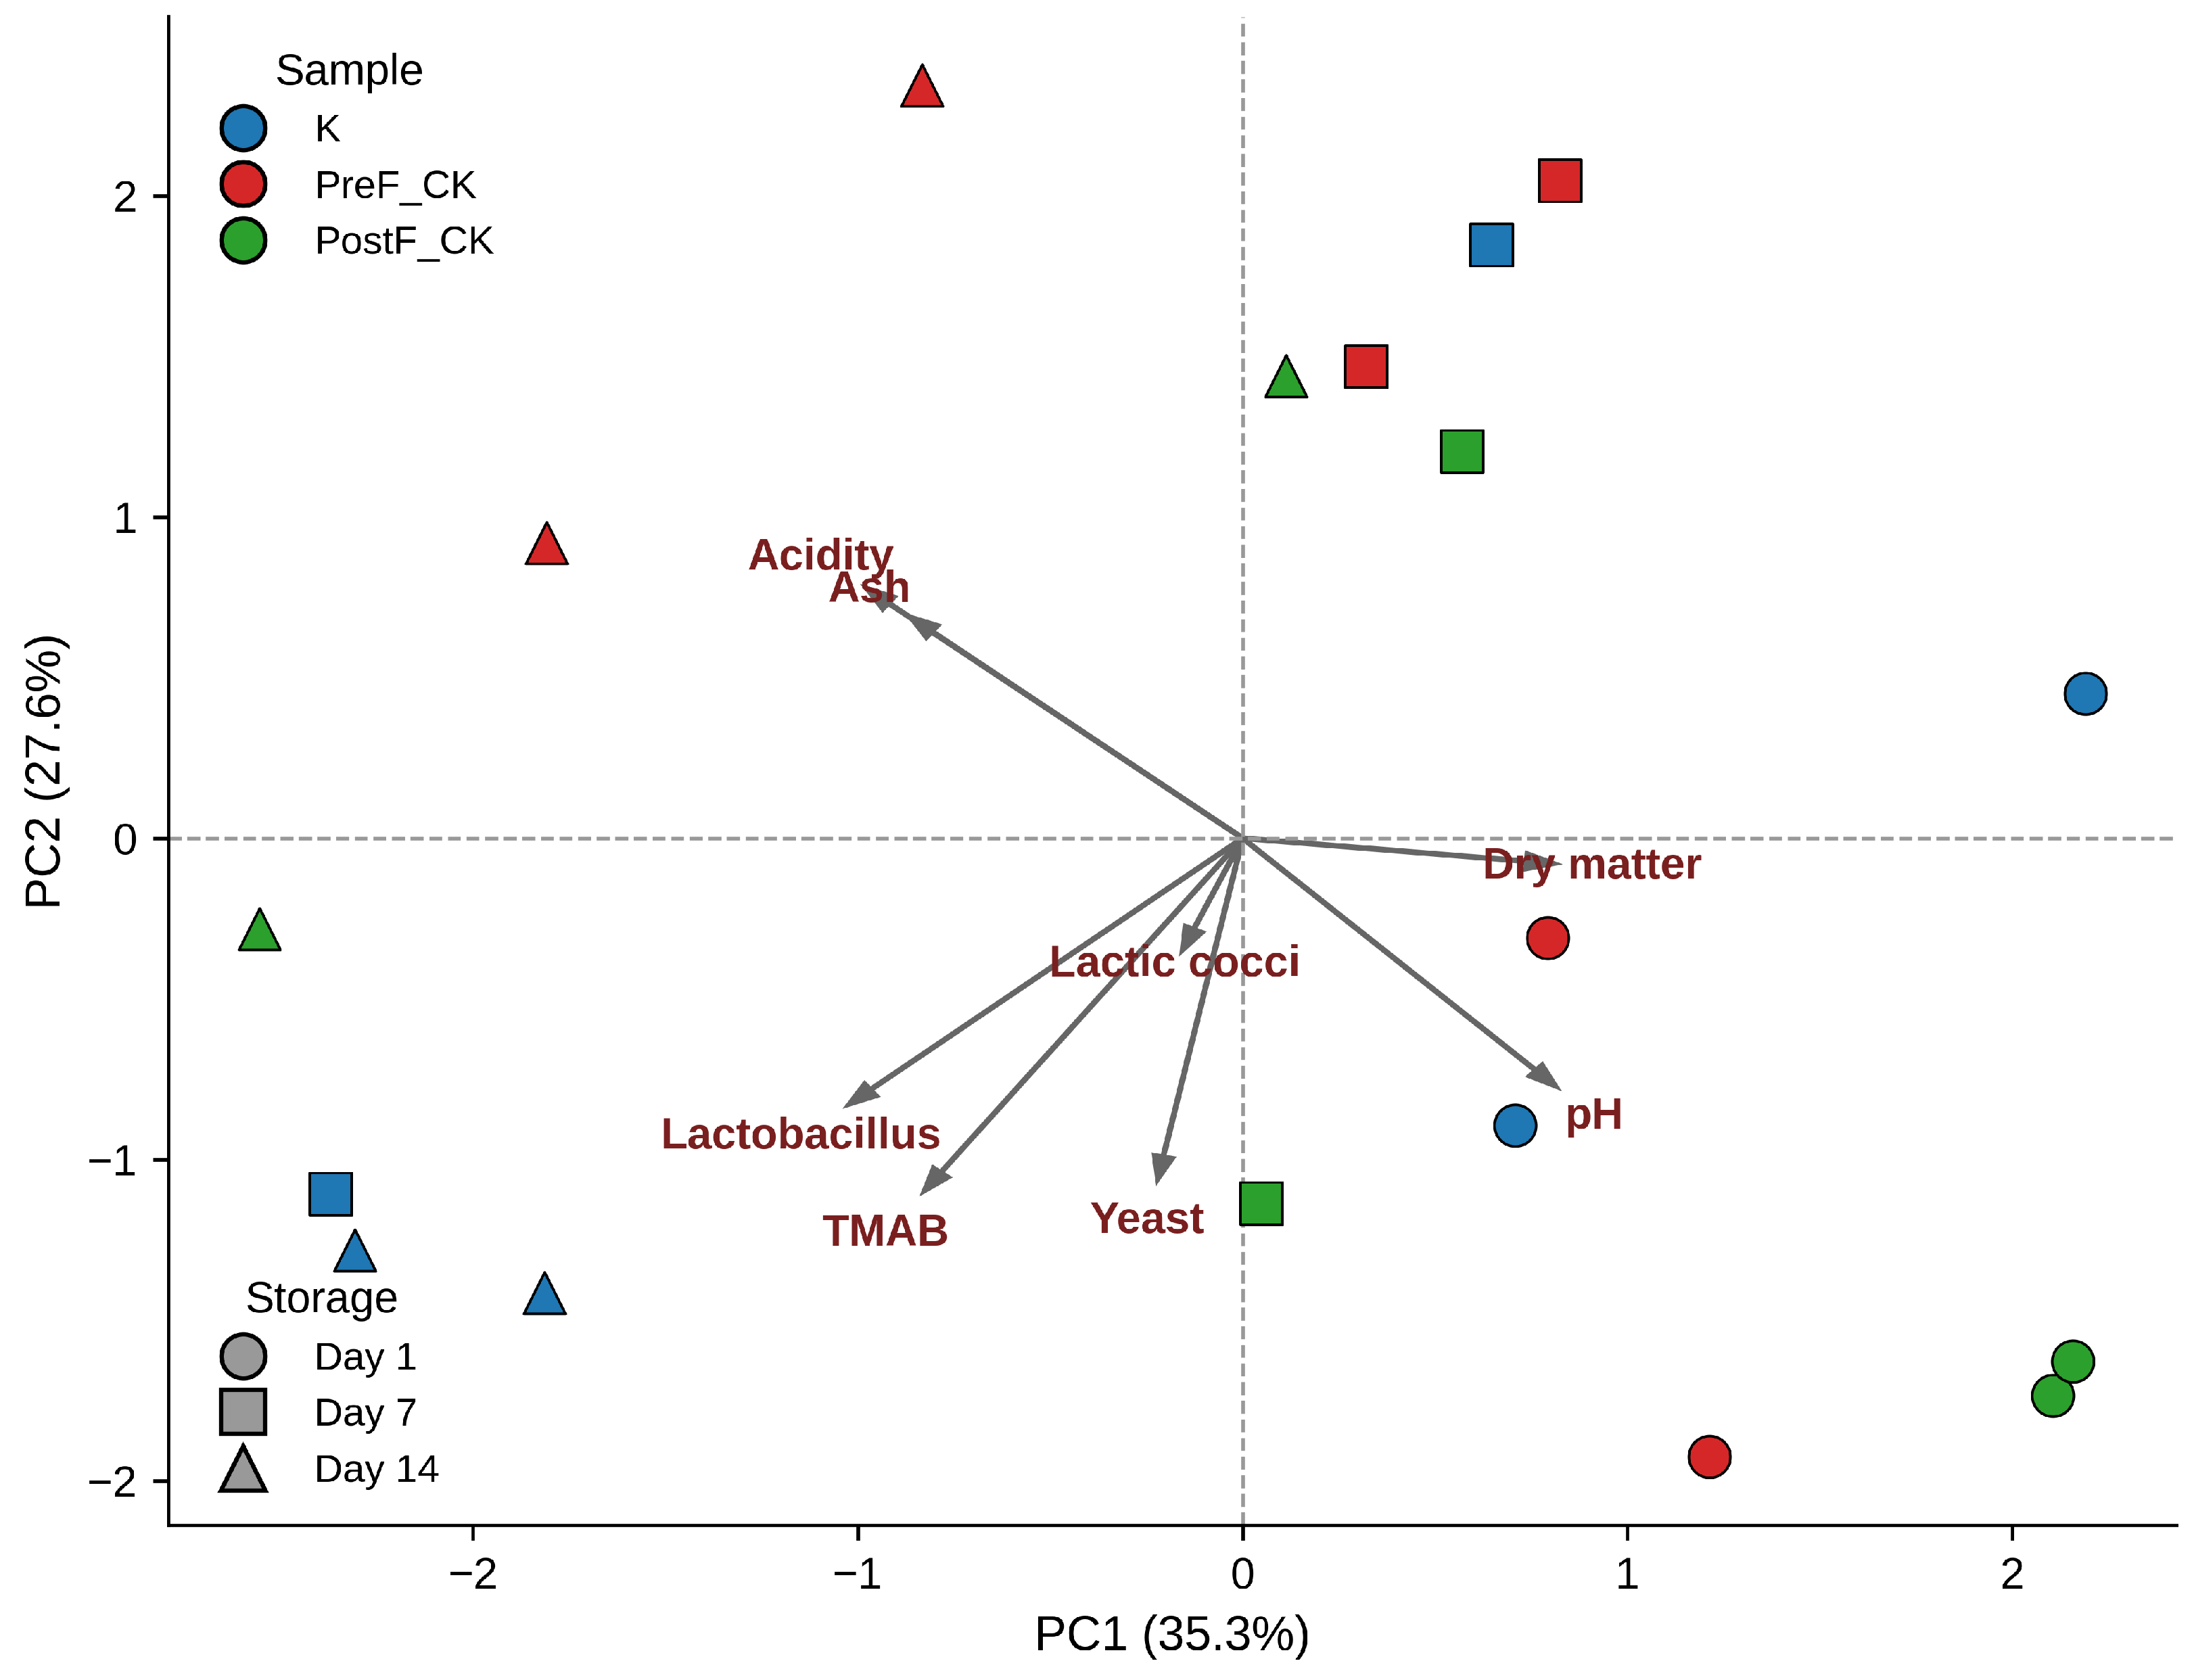
Principal component analysis (Figure 5) was used to summarise the joint variation of the physicochemical and microbiological variables. The first two principal components together explained 62.9% of the total variance (PC1 = 35.3%; PC2 = 27.6%). Samples were ordered primarily along PC1 according to storage day; the day-14 samples were displaced towards the titratable acidity and ash vectors, while the day-1 samples were associated with a higher pH and dry matter, confirming that storage time, rather than coffee treatment, was the dominant source of physicochemical variation. The three sample types were not sharply separated in the PCA space, which is consistent with the ANOVA results showing that the coffee additions produced only modest changes in composition and no change in the microbiota.

4. Discussion

The dry matter content of kefir is known to vary with the type of milk, its fat content and any dry matter-increasing ingredients added to the formulation; here, the sugar-free formulation relied on the milk solids and the small coffee addition alone, which accounts for the modest difference between the coffee-containing samples and the control. The progressive increase in acidity during cold storage is characteristic of kefir and reflects the residual metabolic activity of the lactic acid bacteria [2,11]. The modest differences in acidity and pH between the pre- and post-fermentation coffee treatments are consistent with coffee constituents exerting a minor modulating effect on the fermentation when present during the process (PreF_CK), without changing the overall acidification pattern. A mechanistic basis for this subtle treatment-dependent difference is provided by the way lactic acid bacteria handle dietary polyphenols. When present throughout fermentation (PreF_CK), coffee phenolics—mainly chlorogenic acids—are exposed to the kefir consortium’s full metabolic activity and can be biotransformed into smaller phenolic metabolites, subtly reshaping the pool of phenolic compounds present during fermentation [31,32]. In contrast, when the coffee is incorporated only after fermentation and maturation (PostF_CK), these constituents are not subjected to microbial conversion and instead enter an already-acidified, protein-rich matrix. This difference in the timing of exposure offers a plausible explanation for the slightly different post-acidification trajectories of the two coffee treatments, even though the final acidity and pH of all samples converged within the range typical of mature kefir.
The maintenance of high lactic acid bacteria counts is important given that coffee constituents such as caffeine and chlorogenic acids possess documented antimicrobial activity [15,17]; at the 0.5% level used here, these constituents were evidently not present in a sufficient concentration to inhibit the kefir consortium. The maintenance of high and stable lactic acid bacteria and yeast counts in the coffee-containing kefirs demonstrates that coffee can be added either before or after fermentation without jeopardising the microbiological quality of the product. These values are consistent with the study by Vimercati et al. [16] on the physicochemical, rheological, microbiological and sensory properties of coffee-flavoured kefir produced from 3% fat UHT cow’s milk fortified with refined sugar (6–12%), instant coffee (0.1–2%) and skim milk powder (0–13%). In that study, Lactobacillus spp. counts of 7.30–8.13 log CFU/mL and mesophilic cocci counts of 8.66–9.24 log CFU/mL were recorded; the Lactobacillus counts obtained here (8.5–8.6 log CFU/g) are comparable to and, in terms of probiotic viability, slightly higher than that benchmark, while the mesophilic lactic cocci counts fell within the same range, confirming that the phenolic constituents of coffee did not impair the characteristic kefir microbiota.
The following mechanistic interpretation should be regarded as a hypothesis, since the phenolic composition and its transformation were not measured in the present study. The absence of any inhibitory effect of coffee on the kefir microbiota merits closer mechanistic consideration, particularly for the pre-fermentation treatment (PreF_CK), in which the culture was exposed to coffee phenolics throughout the entire fermentation. Lactic acid bacteria are not merely passive bystanders to dietary phenolics; many strains possess esterases, phenolic acid decarboxylases, reductases and glycosidases that actively convert polyphenolic compounds into smaller, often less antimicrobial and sometimes growth-supporting metabolites, with the specific conversion routes being strongly strain-dependent [31]. In polyphenol-rich fermented foods more generally, phenolic compounds have been reported to act in a partly selective manner, tending to support the growth of beneficial lactic acid bacteria while restraining less desirable organisms such that a mutual phenolic–microbiota interaction rather than simple inhibition is established during fermentation [32]. At the low coffee level used here (0.5%) and embedded within the kefir matrix, these biotransformation effects plausibly explain why the characteristic lactic acid bacteria and yeast populations were preserved irrespective of the timing of the coffee addition.
The finding that the timing of the addition did not compromise the kefir microbiota can be placed in a broader context by comparison with studies in which non-coffee phenolic ingredients were supplemented before versus after fermentation, where the direction of the effect has been shown to depend strongly on both the phenolic source and its concentration. In yoghurt fortified with a polyphenol-enriched mulberry-pomace extract, addition before fermentation inhibited lactic acid bacteria, increased the particle size and suppressed proteolysis, whereas moderate addition (≤1.0%) after fermentation instead promoted bacterial growth, lowered the pH and enhanced proteolysis and bioactive peptide release [33]. In drinking yoghurts enriched with a berry polyphenol extract, the two strategies were both technologically feasible but functionally distinct; the pre-fermentation addition exposed the phenolics to fermentative modification and yielded a total extractable phenolic content 3.5–3.9 times higher than the post-fermentation addition while differentially affecting the colony numbers and appearance of the starter cultures and the rheology of the product [34]. Against this background, the absence of any significant microbiological difference between our pre-fermentation (PreF_CK) and post-fermentation (PostF_CK) kefirs is notable: at the low coffee dose used here (0.5%), and within the strongly buffered, protein-rich kefir matrix, neither timing produced the inhibition reported for high-dose pre-fermentation phenolic extracts, and the coffee behaved as a comparatively mild additive relative to concentrated fruit pomace or berry phenolic fractions.
The closest published analogue to the present design is a kefir study in which elderberry (Sambucus nigra L.) mash and dried elderberry fruit powder were added either to the milk before fermentation or to the finished kefir, providing a direct before-versus-after comparison within the kefir matrix itself [35]. In that study, incorporating elderberry before rather than after fermentation tended to raise the titratable acidity and the mesophilic lactic cocci count, while dried elderberry powder increased the dry matter, total phenolic content and antioxidant activity relative to the fresh fruit mash [35]. These trends mirror our own observations almost exactly, namely the higher dry matter and acidity in the fortified samples, the highest titratable acidity in the pre-fermentation coffee kefir (PreF_CK = 0.87% lactic acid), and the highest mesophilic lactic cocci count in PreF_CK on day 1, thereby corroborating, in the same product class, the compositional and microbiological behaviour we attribute to the timing of additive incorporation.
The stability of the microbiota over 14 days of refrigerated storage is also consistent with the wider kefir literature. In milk kefir, viable lactic acid bacteria counts to the order of 7–8 log CFU/mL are routinely maintained throughout refrigerated storage. For example, fruit by-product-enriched kefir maintained lactic acid bacteria populations of about 7.5 log CFU/mL and stable yeast counts across a 14-day refrigerated storage period closely matching the present design [36]. The lactic acid bacteria counts observed here (consistently ≥8 log CFU/g) and the absence of a significant decline with storage day (p > 0.05) therefore place the coffee-flavoured kefirs at the favourable end of this range. The maintenance of a viable yeast fraction (5.7–6.0 log CFU/g) is equally important, because the bacteria-yeast balance underpins the characteristic aroma, mild carbonation and symbiotic stability of kefir. These counts comfortably exceed the minimum requirements of the relevant fermented milk standards (≥7 log CFU/g for the total characteristic microbiota and ≥4 log CFU/g for kefir yeast) [9,10], confirming that all three products retained their probiotic-type microbial quality until the end of their shelf life.
These results also position the coffee-flavoured kefir within the broader and rapidly expanding effort to use coffee and its by-products as delivery matrices for viable probiotics. Coffee-based beverages have been successfully fermented with probiotic lactic acid bacteria and yeasts to yield products with high viable counts and improved functional profiles, demonstrating that the coffee matrix is compatible with, rather than hostile to, probiotic survival [37]. Lactic acid and yeast co-fermentation of coffee has further been shown to modulate flavour while maintaining microbial viability [38], and recent reviews have highlighted coffee and other plant-based substrates as promising, often under-exploited carriers for next-generation probiotic and synbiotic products [39]. The present sugar-free coffee kefir extends this concept in the opposite direction; rather than adding probiotics to a coffee beverage, it incorporates coffee into an established probiotic-type fermented dairy product. By retaining lactic acid bacteria counts above 8 log CFU/g and a viable yeast fraction throughout refrigerated storage, while introducing the phenolic, melanoidin and fibre-like constituents of coffee, the product unites a robust kefir consortium with the prebiotic-leaning chemistry of coffee in a single, sugar-free symbiotic beverage [37,39].
The somewhat lower odour and taste scores of the coffee samples relative to the control most likely reflect the inherent bitterness and roasted character of coffee superimposed on the already acidic kefir base, an effect that some panellists found less familiar than plain kefir. The perception of coffee phenolics in a fermented dairy matrix is, however, not governed by their bitterness and astringency alone but also by their interactions with milk proteins. Coffee phenolics, particularly chlorogenic acid, show a pronounced tendency to bind milk proteins such as α -lactalbumin, β -lactoglobulin and the caseins through predominantly non-covalent hydrophobic and hydrogen-bonding interactions [40,41]. Such protein–phenolic complexation can partially mask astringency and modulate the release of aroma-active and bitter compounds, thereby softening the sensory impact of the added coffee [42].
The absence of a significant difference in overall acceptability shows that an acceptable coffee-flavoured kefir can be produced regardless of the timing of the coffee addition. The fact that the overall acceptability scores of the coffee-flavoured kefirs remained at a level comparable to that of the control indicates that sensorially acceptable new kefir variants can be developed and that formulations incorporating probiotic yeasts or plant-based components could be optimised in a similar manner [18]. Moreover, the post-fermentation kefir (PostF_CK) generally matched or slightly outperformed the pre-fermentation kefir (PreF_CK) in the sensory attributes, indicating that adding coffee after fermentation is at least as favourable—and operationally simpler—than adding it before. The somewhat lower odour and taste scores of the coffee samples most likely reflect the unfamiliarity of a roasted coffee note on a sugar-free kefir base rather than an intrinsic sensory deficiency; familiarity is a recognised driver of liking for fermented products [43], and the few earlier studies on coffee-flavoured fermented dairy added sugar specifically to offset coffee bitterness [16,44].
The multivariate picture reinforces the conclusion that the main driver of change in these products is post-acidification during storage, and that coffee addition is a comparatively minor perturbation that leaves the essential kefir character intact. A comparable multivariate structure, in which an acidity- and lactic acid bacteria-related dimension was resolved separately from a sensory perception dimension, has been described for grain and industrial culture kefirs analysed in our laboratory, supporting the robustness of these quality axes across different kefir formulations [18].

Limitations of the Study

Several limitations should be acknowledged and taken into account when interpreting the present findings. First, the study was designed as a compositional, microbiological and sensory comparison of the timing of coffee’s addition, and the bioactive contribution of the coffee was not measured directly; the total phenolic content, antioxidant activity (for example, DPPH, ABTS or FRAP), individual chlorogenic acid and caffeine concentrations and short-chain fatty acids were not determined. Consequently, the phenolic- and melanoidin-related interpretations advanced in the Section 4 are mechanistic hypotheses consistent with the literature rather than conclusions demonstrated by direct measurement in this product. Second, the instrumental colour (CIELab L*, a*, b*), syneresis and viscosity or rheology were not quantified, and thus the effect of coffee on the appearance and physical stability is captured only through the sensory appearance and texture scores. Third, the volatile compound profile was not characterised by gas chromatography–mass spectrometry, and thus the extent to which fermentation modified the coffee-derived aroma compounds could not be assessed. Fourth, the microbiological analysis relied exclusively on culture-dependent enumeration of broad microbial groups; culture-independent approaches (for example, 16S rRNA and ITS amplicon sequencing or metagenomics) would be required to determine whether coffee’s addition shifted the composition of the kefir microbial community even when the total viable counts remained unchanged. Fifth, the design comprised two independent production replicates, which, although analysed with a full factorial ANOVA supported by effect sizes and non-parametric confirmation, limited the statistical power for detecting small between-sample differences; a larger number of independent batches would strengthen the reliability of the estimates. Finally, the storage period was restricted to 14 days, which is shorter than the shelf life commonly reported for commercial kefir; the microbiological and physicochemical stability observed here therefore cannot be extrapolated beyond this interval, and a longer storage trial is needed to confirm the end-of-shelf-life quality. These limitations are the direct consequence of the scope of the present proof-of-concept study and define a clear agenda for the confirmatory work outlined in the Conclusions.

5. Conclusions

This study evaluated the effect of the timing of instant coffee’s addition on the properties of kefir during refrigerated storage. The addition of 0.5% instant coffee, whether before or after fermentation, significantly increased the total dry matter and slightly modified the acidity and pH of kefir but did not alter its ash content. Most importantly, the coffee addition did not impair the characteristic kefir microbiota: the lactic acid bacteria and yeast counts remained high throughout the storage period, exceeding the requirements of the relevant fermented milk standards. Overall acceptability did not differ significantly among the three samples, and thus no general superiority of one processing strategy over the other can be claimed. The main sensory advantage of the post-fermentation addition was a specific one: the PostF_CK sample achieved a significantly higher taste score than the PreF_CK sample and, unlike the PreF_CK sample, did not differ significantly from the control in terms of taste. Adding coffee after fermentation is, in addition, operationally simpler. On this more limited basis—rather than on any difference in overall acceptability—the post-fermentation addition can be regarded as the preferable of the two coffee addition routes when a coffee-flavoured kefir is to be produced, while both coffee-flavoured kefirs were generally well received and remained fully compliant with the microbiological requirements for fermented milks. The product should nonetheless be regarded as a feasible starting point rather than an optimised one; its sensory scores remained below those of plain kefir, and confirmation under longer storage periods is still required. Future studies should quantify the phenolic, antioxidant and caffeine contribution of the coffee, optimise the coffee level, extend the storage period and add instrumental volatile and microbiota profiling, together with additional production replicates, to confirm and build on these findings.

Supplementary Materials

The following supporting information can be downloaded at https://www.mdpi.com/article/10.3390/fermentation12080346/s1. Table S1: Physicochemical properties (mean ± S.D. with S.E.M.) of the K, PreF_CK and PostF_CK samples on days 1, 7 and 14 of refrigerated storage. Table S2: Viable counts (log CFU/g; mean ± S.D. with S.E.M.) of the characteristic kefir microbiota in the K, PreF_CK and PostF_CK samples on days 1, 7 and 14 of refrigerated storage. File S1: data set.xlsx, primary dataset containing microbiological, physicochemical and sensory measurements for all kefir treatments and storage days.

Author Contributions

Conceptualization, D.K. and F.Ş.; methodology, C.A. and D.K.; software, C.A.; validation, D.K. and F.Ş.; formal analysis, C.A. and F.Ş.; investigation, C.A.; resources, D.K.; data curation, C.A.; writing—original draft preparation, C.A.; writing—review and editing, D.K. and F.Ş.; visualization, C.A. and F.Ş.; supervision, D.K.; project administration, D.K. All authors have read and agreed to the published version of the manuscript.

Funding

This research received no external funding.

Institutional Review Board Statement

The sensory analyses involved adult volunteers who participated voluntarily in the evaluation of safe, food-grade products without the collection or processing of sensitive personal data. Informed consent was obtained from all participants prior to the evaluation, and their privacy was strictly respected throughout the study. Therefore, the study does not fall within the scope of mandatory ethical review according to the Regulation on Clinical Trials of Human Medicinal Products in Türkiye (Beşeri Tıbbi Ürünlerin Klinik Araştırmaları Hakkında Yönetmelik, Official Gazette No. 32203, 27 May 2023). Under this statutory framework, official ethics committee approval is not required for the routine sensory evaluation of safe, food-grade products.

Informed Consent Statement

Informed consent was obtained from all subjects involved in the study.

Data Availability Statement

The data presented in this study are available on request from the corresponding author.

Acknowledgments

The authors thank the Department of Food Engineering at Aksaray University for the laboratory support and the sensory panellists for their participation. This work is based on the thesis of C. Acar (Aksaray University, 2023). During the preparation of this manuscript, the authors used a large language model (Gemini 1.5 Flash, Google) for the purposes of language editing and improving the readability of the English text, and used Perplexity (Perplexity AI, Inc.), with GPT Image (OpenAI) as the underlying image-generation model, to create the graphical abstract. The authors have reviewed and edited the output and take full responsibility for the content of this publication.

Conflicts of Interest

The authors declare no conflicts of interest.

References

  1. Prado, M.R.; Blandón, L.M.; Vandenberghe, L.P.S.; Rodrigues, C.; Castro, G.R.; Thomaz-Soccol, V.; Soccol, C.R. Milk kefir: Composition, microbial cultures, biological activities, and related products. Front. Microbiol. 2015, 6, 1177. [Google Scholar] [CrossRef] [PubMed]
  2. Bourrie, B.C.T.; Willing, B.P.; Cotter, P.D. The microbiota and health promoting characteristics of the fermented beverage kefir. Front. Microbiol. 2016, 7, 647. [Google Scholar] [CrossRef] [PubMed]
  3. Rosa, D.D.; Dias, M.M.S.; Grześkowiak, Ł.M.; Reis, S.A.; Conceição, L.L.; Peluzio, M.C.G. Milk kefir: Nutritional, microbiological and health benefits. Nutr. Res. Rev. 2017, 30, 82–96. [Google Scholar] [CrossRef] [PubMed]
  4. Farag, M.A.; Jomaa, S.A.; Abd El-Wahed, A.; El-Seedi, H.R. The many faces of kefir fermented dairy products: Quality characteristics, flavour chemistry, nutritional value, health benefits, and safety. Nutrients 2020, 12, 346. [Google Scholar] [CrossRef] [PubMed]
  5. Hertzler, S.R.; Clancy, S.M. Kefir improves lactose digestion and tolerance in adults with lactose maldigestion. J. Am. Diet. Assoc. 2003, 103, 582–587. [Google Scholar] [CrossRef] [PubMed]
  6. Fathi, Y.; Ghodrati, N.; Zibaeenezhad, M.J.; Faghih, S. Kefir drink causes a significant yet similar improvement in serum lipid profile, compared with low-fat milk, in a dairy-rich diet in overweight or obese premenopausal women: A randomized controlled trial. J. Clin. Lipidol. 2017, 11, 136–146. [Google Scholar] [CrossRef] [PubMed]
  7. Qaisrani, Z.N.; Lin, W.P.; Lay, B.B.; Phyo, K.Y.; San, M.M.; Awaeloh, N.; Aunsorn, S.; Pattanayaiying, R.; Na Ayudthaya, S.P.; Hongkulsup, C.; et al. The impact of kefir consumption on inflammation, oxidative stress status, and metabolic-syndrome-related parameters in animal models: A systematic review and meta-analysis. Foods 2025, 14, 2077. [Google Scholar] [CrossRef] [PubMed]
  8. Brasiel, P.G.A.; Dutra Medeiros, J.; Costa de Almeida, T.; Teodoro de Souza, C.; Ávila Alpino, G.C.; Ferreira Machado, A.B.; Dutra Luquetti, S.C.P. Preventive effects of kefir on colon tumor development in Wistar rats: Gut microbiota critical role. J. Dev. Orig. Health Dis. 2025, 16, e5. [Google Scholar] [CrossRef] [PubMed]
  9. Türk Gıda Kodeksi Fermente Süt Ürünleri Tebliği (Tebliğ No: 2022/44) [Turkish Food Codex Communiqué on Fermented Milk Products]; T.C. Tarım ve Orman Bakanlığı, Resmî Gazete: Ankara, Türkiye, 2022. Available online: https://www.resmigazete.gov.tr/eskiler/2022/11/20221130-5.htm (accessed on 19 June 2026). (In Turkish)
  10. Codex Alimentarius Commission. Standard for Fermented Milks (CXS 243-2003, Revised 2018); FAO/WHO: Rome, Italy, 2018. [Google Scholar]
  11. Sarkar, S. Potential of kefir as a dietetic beverage: A review. Br. Food J. 2007, 109, 280–290. [Google Scholar] [CrossRef]
  12. Travičić, V.; Šovljanski, O.; Tomić, A.; Perović, M.; Milošević, M.; Ćetković, N.; Antov, M. Augmenting functional and sensorial quality attributes of kefir through fortification with encapsulated blackberry juice. Foods 2023, 12, 4163. [Google Scholar] [CrossRef] [PubMed]
  13. Bielska, P.; Cais-Sokolińska, D.; Teichert, J.; Biegalski, J.; Kaczyński, Ł.; Chudy, S. Effect of honeydew honey addition on the water activity and water holding capacity of kefir in the context of its sensory acceptability. Sci. Rep. 2021, 11, 22956. [Google Scholar] [CrossRef] [PubMed]
  14. Ludwig, I.A.; Clifford, M.N.; Lean, M.E.J.; Ashihara, H.; Crozier, A. Coffee: Biochemistry and potential impact on health. Food Funct. 2014, 5, 1695–1717. [Google Scholar] [CrossRef] [PubMed]
  15. Farah, A.; de Paula Lima, J. Consumption of chlorogenic acids through coffee and health implications. Beverages 2019, 5, 11. [Google Scholar] [CrossRef]
  16. Vimercati, W.C.; da Silva Araújo, C.; Macedo, L.L.; Fonseca, H.C.; Guimarães, J.S.; de Abreu, L.R.; Pinto, S.M. Physicochemical, rheological, microbiological and sensory properties of newly developed coffee flavored kefir. LWT—Food Sci. Technol. 2020, 123, 109069. [Google Scholar] [CrossRef]
  17. Almeida, A.A.P.; Farah, A.; Silva, D.A.M.; Nunan, E.A.; Glória, M.B.A. Antibacterial activity of coffee extracts and selected coffee chemical compounds against enterobacteria. J. Agric. Food Chem. 2006, 54, 8738–8743. [Google Scholar] [CrossRef] [PubMed]
  18. Çınar, B.; Koçan, D.; Şahmurat, F. Saccharomyces boulardii CNCM I-745 as a probiotic adjunct in kefir: A proof-of-concept study comparing traditional grain and industrial starter cultures. Fermentation 2026, 12, 249. [Google Scholar] [CrossRef]
  19. AOAC. Official Method 941.08. Total solids (gravimetric method). In Official Methods of Analysis; AOAC International: Gaithersburg, MD, USA, 2005. [Google Scholar]
  20. AOAC. Official Method 945.46. Ash of milk (gravimetric method). In Official Methods of Analysis; Association of Official Analytical Chemists: Arlington, VA, USA, 1990. [Google Scholar]
  21. AOAC. Official Method 2000.18. Fat content of raw and pasteurised whole milk, Gerber method by weight. In Official Methods of Analysis; AOAC International: Gaithersburg, MD, USA, 2004. [Google Scholar]
  22. AOAC. Official Method 947.05. Acidity of milk (titrimetric method). In Official Methods of Analysis; Association of Official Analytical Chemists: Arlington, VA, USA, 1990. [Google Scholar]
  23. Cemeroğlu, B. Gıda Analizleri [Food Analyses]; Bizim Grup Basımevi: Ankara, Türkiye, 2013. (In Turkish) [Google Scholar]
  24. ISO 6887-1:2017; Microbiology of the Food Chain—Preparation of Test Samples, Initial Suspension and Decimal Dilutions for Microbiological Examination—Part 1: General Rules for the Preparation of the Initial Suspension and Decimal Dilutions. International Organization for Standardization: Geneva, Switzerland, 2017.
  25. ICMSF. Microorganisms in Foods 1. Their Significance and Methods of Enumeration, 2nd ed.; University of Toronto Press: Toronto, ON, Canada, 1978. [Google Scholar]
  26. De Man, J.C.; Rogosa, M.; Sharpe, M.E. A medium for the cultivation of lactobacilli. J. Appl. Bacteriol. 1960, 23, 130–135. [Google Scholar] [CrossRef]
  27. Terzaghi, B.E.; Sandine, W.E. Improved medium for lactic streptococci and their bacteriophages. Appl. Microbiol. 1975, 29, 807–813. [Google Scholar] [CrossRef] [PubMed]
  28. Harrigan, W.F. Laboratory Methods in Food Microbiology, 3rd ed.; Academic Press: San Diego, CA, USA, 1998. [Google Scholar]
  29. Lawless, H.T.; Heymann, H. Sensory Evaluation of Food: Principles and Practices, 2nd ed.; Food Science Text Series; Springer: New York, NY, USA, 2010. [Google Scholar] [CrossRef]
  30. Düzgüneş, O.; Kesici, T.; Kavuncu, O.; Gürbüz, F. Araştırma ve Deneme Metotları (İstatistik II) [Research and Experimental Methods (Statistics II)]; Publications No. 381; Ankara University, Faculty of Agriculture: Ankara, Türkiye, 1987. (In Turkish) [Google Scholar]
  31. Gaur, G.; Gänzle, M.G. Conversion of (poly)phenolic compounds in food fermentations by lactic acid bacteria: Novel insights into metabolic pathways and functional metabolites. Curr. Res. Food Sci. 2023, 6, 100448. [Google Scholar] [CrossRef] [PubMed]
  32. Yang, F.; Chen, C.; Ni, D.; Yang, Y.; Tian, J.; Li, Y.; Chen, S.; Ye, X.; Wang, L. Effects of fermentation on bioactivity and the composition of polyphenols contained in polyphenol-rich foods: A review. Foods 2023, 12, 3315. [Google Scholar] [CrossRef] [PubMed]
  33. Du, H.; Wang, X.; Yang, H.; Zhu, F.; Liu, J.; Cheng, J.; Lin, Y.; Tang, D.; Liu, X. Regulation on the quality of yogurt by phenolic fraction of mulberry pomace supplemented before and after fermentation. Food Control 2023, 144, 109333. [Google Scholar] [CrossRef]
  34. Sun-Waterhouse, D.; Zhou, J.; Wadhwa, S.S. Drinking yoghurts with berry polyphenols added before and after fermentation. Food Control 2013, 32, 450–460. [Google Scholar] [CrossRef]
  35. Barazi, Ü.; Arslan, S. Enhancement of kefir functionality by adding black elderberry and evaluation of its quality during storage. Food Sci. Nutr. 2024, 12, 9325–9339. [Google Scholar] [CrossRef] [PubMed]
  36. Stamenković Stojanović, S.; Živković, L.; Stanojević, J.; Danilović, B.; Mančić, S.; Karabegović, I. Enhancing kefir with raspberry pomace: Storage-dependent changes in quality and stability. Fermentation 2025, 11, 265. [Google Scholar] [CrossRef]
  37. Chan, M.Z.A.; Toh, M.; Liu, S.Q. Growth, survival, and metabolic activities of probiotic Lactobacillus spp. in fermented coffee brews supplemented with glucose and inactivated yeast derivatives. Food Res. Int. 2020, 137, 109746. [Google Scholar] [CrossRef] [PubMed]
  38. Chan, M.Z.A.; Toh, M.; Liu, S.Q. Growth, survival, and metabolic activities of probiotics Lactobacillus rhamnosus GG and Saccharomyces cerevisiae var. boulardii CNCM-I745 in fermented coffee brews. Int. J. Food Microbiol. 2021, 350, 109229. [Google Scholar] [CrossRef] [PubMed]
  39. Chan, M.Z.A.; Liu, S.Q. Coffee brews as food matrices for delivering probiotics: Opportunities, challenges, and potential health benefits. Trends Food Sci. Technol. 2022, 119, 227–242. [Google Scholar] [CrossRef]
  40. Wróblewska, B.; Kuliga, A.; Wnorowska, K. Bioactive dairy-fermented products and phenolic compounds: Together or apart. Molecules 2023, 28, 8081. [Google Scholar] [CrossRef] [PubMed]
  41. van de Langerijt, T.M.; O’Mahony, J.A.; Crowley, S.V. Structural, binding and functional properties of milk protein-polyphenol systems: A review. Molecules 2023, 28, 2288. [Google Scholar] [CrossRef] [PubMed]
  42. Suttikhana, I.; Matějková, K.; Dadáková, E. A review of polyphenol-protein interactions in fortified fermented whey beverages: Mechanisms, stability, and bioavailability. Int. J. Food Sci. Technol. 2026, 61, vvag103. [Google Scholar] [CrossRef]
  43. García-Barón, S.E.; Carmona-Escutia, R.P.; Herrera-López, E.J.; Leyva-Trinidad, D.A.; Gschaedler-Mathis, A. Consumers’ drivers of perception and preference of fermented food products and beverages: A systematic review. Foods 2025, 14, 713. [Google Scholar] [CrossRef] [PubMed]
  44. Tan, G.; Korel, F. Quality of flavored yogurt containing added coffee and sugar. J. Food Qual. 2007, 30, 342–356. [Google Scholar] [CrossRef]
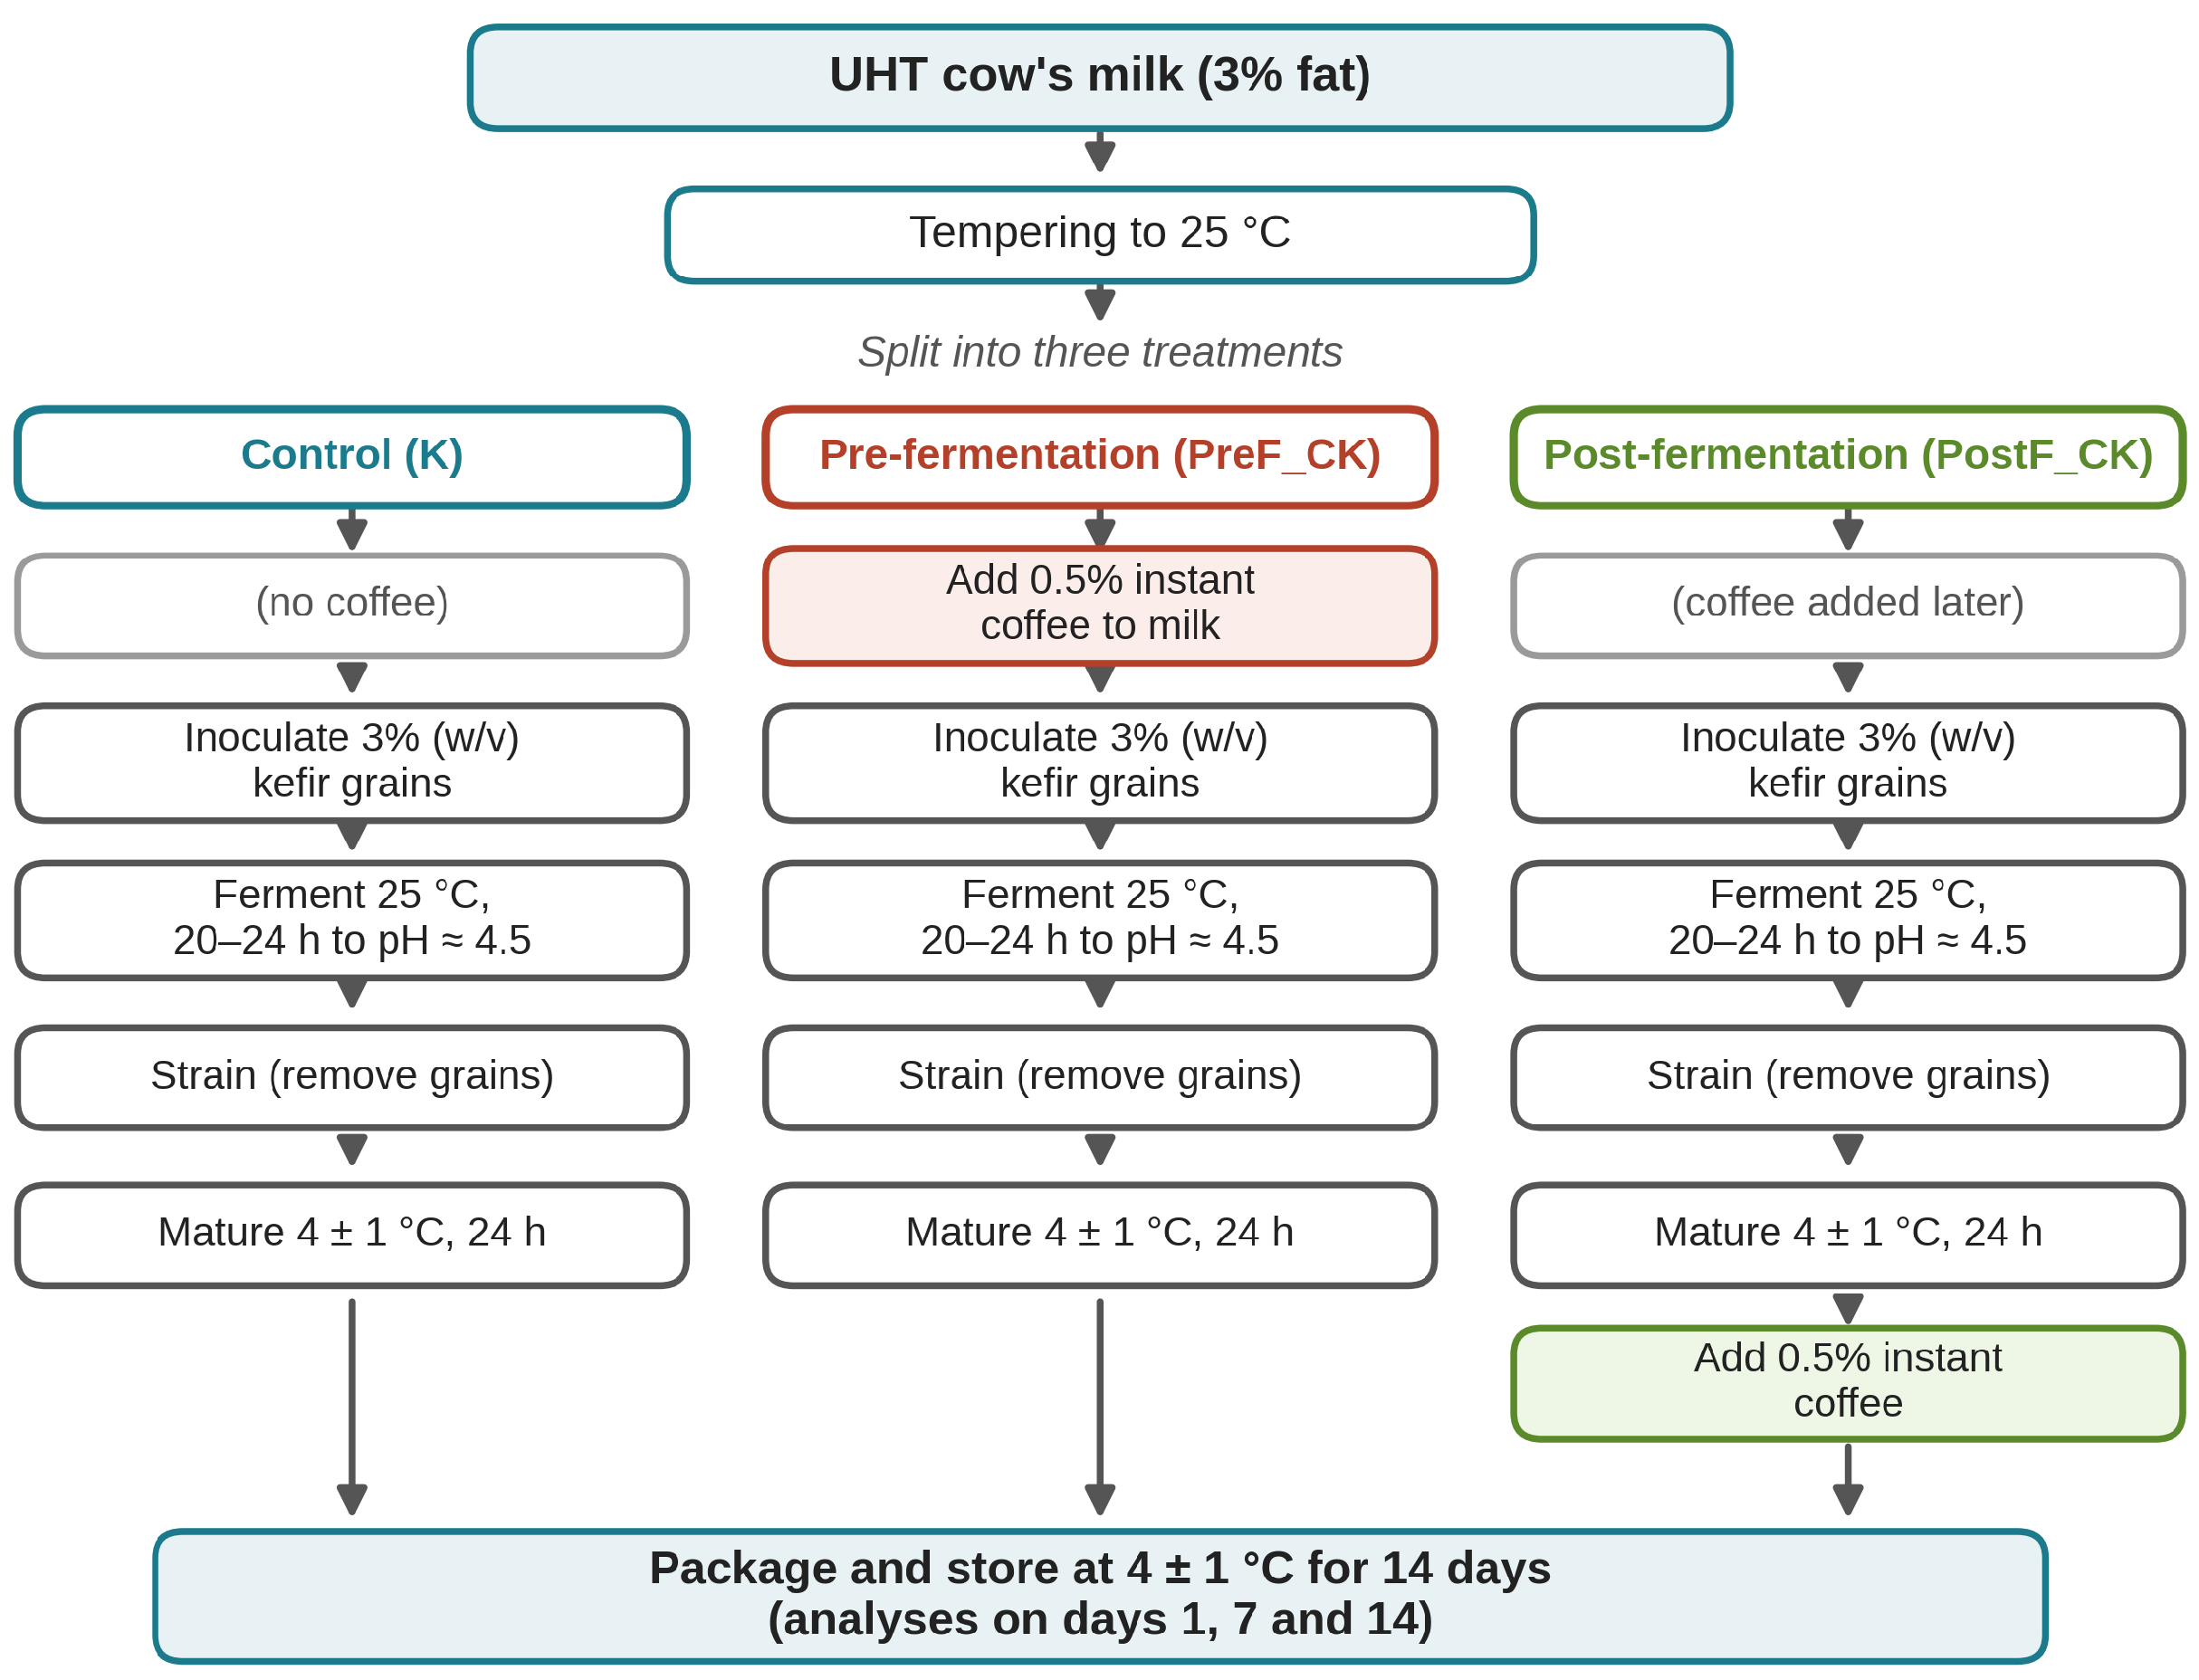
Figure 1. Production flow diagram of the three kefir treatments: control without coffee (K), kefir with 0.5% instant coffee added before fermentation (PreF_CK) and kefir with 0.5% instant coffee added after fermentation and maturation (PostF_CK).
Fermentation 12 00346 g001
Figure 2. Changes in the physicochemical properties of the kefir samples (K = control; PreF_CK = coffee added before fermentation; PostF_CK = coffee added after fermentation) over 14 days of refrigerated storage at 4 ± 1 °C: (a) total dry matter (%); (b) titratable acidity (% lactic acid); (c) pH and (d) ash in dry matter (%). Symbols are means, and error bars denote the standard deviation (n = 2). Within a given storage day, different lowercase letters next to the symbols indicate a significant difference among samples (Tukey HSD, p < 0.05); the absence of letters on a given day indicates no significant difference among samples on that day.
Fermentation 12 00346 g002
Figure 3. Viable counts (log CFU/g) in the kefir samples (K, PreF_CK and PostF_CK) during 14 days of refrigerated storage: (a) total mesophilic aerobic bacteria; (b) Lactobacillus spp.; (c) mesophilic lactic cocci and (d) yeast. Symbols are means, and error bars denote the standard deviation (n = 2). All counts remained above the minimum thresholds of the relevant fermented milk standards (≥7 log CFU/g for the total characteristic microbiota and ≥4 log CFU/g for kefir yeast) throughout storage. No significant differences were detected among the samples on any storage day for any microbial group (Tukey HSD, p > 0.05); significance letters are therefore not shown.
Fermentation 12 00346 g003
Figure 4. Sensory acceptance profiles of the kefir samples (K, PreF_CK and PostF_CK) across the four evaluated attributes—appearance and texture, odour, taste and overall acceptability—shown as a radar (spider) plot.Within each attribute, the constituent descriptors were normalised to their respective rating scales (six points for appearance and texture, odour and taste and five points for overall acceptability) and expressed on a common 1–5 scale to allow direct comparison among the attributes. Each line represents one sample and each vertex the mean acceptance score for that attribute averaged over the three sampling days (n = 60 scores per sample); a larger radius denotes greater acceptance.
Fermentation 12 00346 g004
Figure 5. Principal component analysis (PCA) biplot of the standardised physicochemical and microbiological variables. Symbols denote the samples (K, PreF_CK and PostF_CK) at each storage day (1, 7 and 14), and the arrows denote the variable loadings. The first two principal components (PC1 and PC2) explained 35.3% and 27.6% of the total variance, respectively. TMAB = total mesophilic aerobic bacteria.
Fermentation 12 00346 g005
Table 1. Composition of the ultra-high-temperature (UHT) treated cow’s milk used as the production medium for all three kefir treatments. Values are expressed as the mean ± standard deviation (S.D.).
PropertyValue (Mean ± S.D.)
Total dry matter (%)11.14 ± 0.23
Solids-not-fat (%)8.14 ± 0.23
Fat (%)3.00 ± 0.00
Ash (%)0.63 ± 0.01
Ash in dry matter (%)5.61 ± 0.18
pH6.60 ± 0.00
Titratable acidity (% lactic acid)0.17 ± 0.04
S.D. = standard deviation; UHT = ultra-high-temperature treated.
Table 2. Two-way ANOVA p values and partial eta-squared effect sizes ( η p 2 ) for the sample, storage day and sample × day (S × D) effects on the physicochemical parameters.
ParameterSample (p)Sample η p 2 Day (p)Day η p 2 S × D (p)S × D η p 2
Total dry matter0.0030.730.0330.530.8220.14
Titratable acidity0.0360.52<0.0010.880.0470.62
pH0.0060.680.0030.730.0390.64
Ash (in dry matter)0.2340.28<0.0010.900.1120.53
ANOVA = analysis of variance; η p 2 = partial eta-squared; S × D = sample × day interaction.
Table 3. Two-way ANOVA p values and partial eta-squared effect sizes ( η p 2 ) for the sample, storage day and sample × day (S × D) effects on the microbiological counts.
ParameterSample (p)Sample η p 2 Day (p)Day η p 2 S × D (p)S × D η p 2
Total mesophilic aerobic bacteria0.6820.080.2270.280.2770.40
Lactobacillus spp.0.5430.130.3650.200.5980.24
Mesophilic lactic cocci0.2080.300.8460.040.0760.58
Yeast0.1590.340.5400.130.8940.11
ANOVA = analysis of variance; η p 2 = partial eta-squared; S × D = sample × day interaction.
Table 4. Sensory acceptance scores (appearance and texture, odour, taste and overall acceptability) of the K, PreF_CK and PostF_CK samples on days 1, 7 and 14 of refrigerated storage, together with the storage period mean, as assigned by a 10-member semi-trained panel across two production replicates (n = 20 scores per sample × day). Values are the mean ± S.D. with the standard error of the mean (S.E.M. = S.D./ n ) in square brackets (n = 20 per sample × day cell; n = 60 for the storage-period mean).
ParameterSampleDay 1Day 7Day 14Mean
Appearance and textureK5.58 ± 0.30 [0.07]5.53 ± 0.61 [0.14]5.62 ± 0.30 [0.07]5.58 ± 0.42 [0.05] a
PreF_CK5.58 ± 0.35 [0.08]5.56 ± 0.58 [0.13]5.57 ± 0.33 [0.07]5.57 ± 0.43 [0.06] a
PostF_CK5.57 ± 0.32 [0.07]5.42 ± 0.58 [0.13]5.44 ± 0.57 [0.13]5.48 ± 0.50 [0.06] a
OdourK5.81 ± 0.33 [0.07]5.73 ± 0.56 [0.13]5.81 ± 0.28 [0.06]5.78 ± 0.40 [0.05] a
PreF_CK5.27 ± 0.75 [0.17]5.59 ± 0.56 [0.13]5.51 ± 0.44 [0.10]5.46 ± 0.60 [0.08] b
PostF_CK5.15 ± 0.73 [0.16]5.47 ± 0.62 [0.14]5.49 ± 0.74 [0.17]5.37 ± 0.70 [0.09] b
TasteK5.49 ± 0.40 [0.09]5.54 ± 0.54 [0.12]5.60 ± 0.30 [0.07]5.54 ± 0.42 [0.05] a
PreF_CK4.87 ± 0.76 [0.17]5.45 ± 0.43 [0.10]4.96 ± 0.43 [0.10]5.09 ± 0.61 [0.08] b
PostF_CK5.37 ± 0.48 [0.11]5.26 ± 0.64 [0.14]5.18 ± 0.78 [0.17]5.27 ± 0.64 [0.08] b
Overall acceptabilityK3.85 ± 0.81 [0.18]3.95 ± 0.76 [0.17]4.35 ± 0.67 [0.15]4.05 ± 0.77 [0.10] a
PreF_CK3.70 ± 0.98 [0.22]3.90 ± 0.91 [0.20]3.45 ± 0.69 [0.15]3.68 ± 0.87 [0.11] a
PostF_CK4.05 ± 1.00 [0.22]3.90 ± 0.97 [0.22]3.95 ± 1.15 [0.26]3.97 ± 1.02 [0.13] a
Appearance and texture, odour and taste were scored on a six-point scale; overall acceptability was scored on a five-point scale. Different lowercase letters in the Mean column indicate significant differences among samples (p < 0.05). K = control without coffee; PreF_CK = kefir with coffee added before fermentation; PostF_CK = kefir with coffee added after fermentation; S.D. = standard deviation; S.E.M. = standard error of the mean (shown in square brackets).
Table 5. Two-way ANOVA p values and partial eta-squared effect sizes ( η p 2 ) for the sensory attributes, together with the non-parametric Kruskal–Wallis (K–W) confirmation of the sample effect, the epsilon-squared ( ε 2 ) effect size and the Dunn post hoc grouping.
ParameterANOVA Sample (p)Sample η p 2 Day (p)S × D (p)K–W (p)K–W ε 2 /Post-Hoc
Appearance and texture0.4040.010.6440.8920.4320.00; ND
Odour<0.0010.090.0710.244<0.0010.085; K > PreF_CK, PostF_CK
Taste<0.0010.140.0570.011<0.0010.125; K, PostF_CK > PreF_CK
Overall acceptability0.0650.030.9390.1890.0790.017; ND
ANOVA = analysis of variance; η p 2 = partial eta-squared; S × D = sample × day interaction; K–W = Kruskal–Wallis test; ε 2 = epsilon squared; K = control without coffee; PreF_CK = kefir with coffee added before fermentation; PostF_CK = kefir with coffee added after fermentation; ND = no difference.
Disclaimer/Publisher’s Note: The statements, opinions and data contained in all publications are solely those of the individual author(s) and contributor(s) and not of MDPI and/or the editor(s). MDPI and/or the editor(s) disclaim responsibility for any injury to people or property resulting from any ideas, methods, instructions or products referred to in the content.