3.3.1. Composition of Real and Synthetic Hydrolysates of Canola Fines
As expected, there were notable differences in the composition of the defined SHCF and the more complex RHCF (
Table 4). In contrast to RHCF, the SHCF did not contain unmeasured chemical variables such as alternative organic substrates and inhibitors, allowing the effects of C:N ratio and O
2 limitation on growth and PHB/PHV production by
G. lacunae BS2
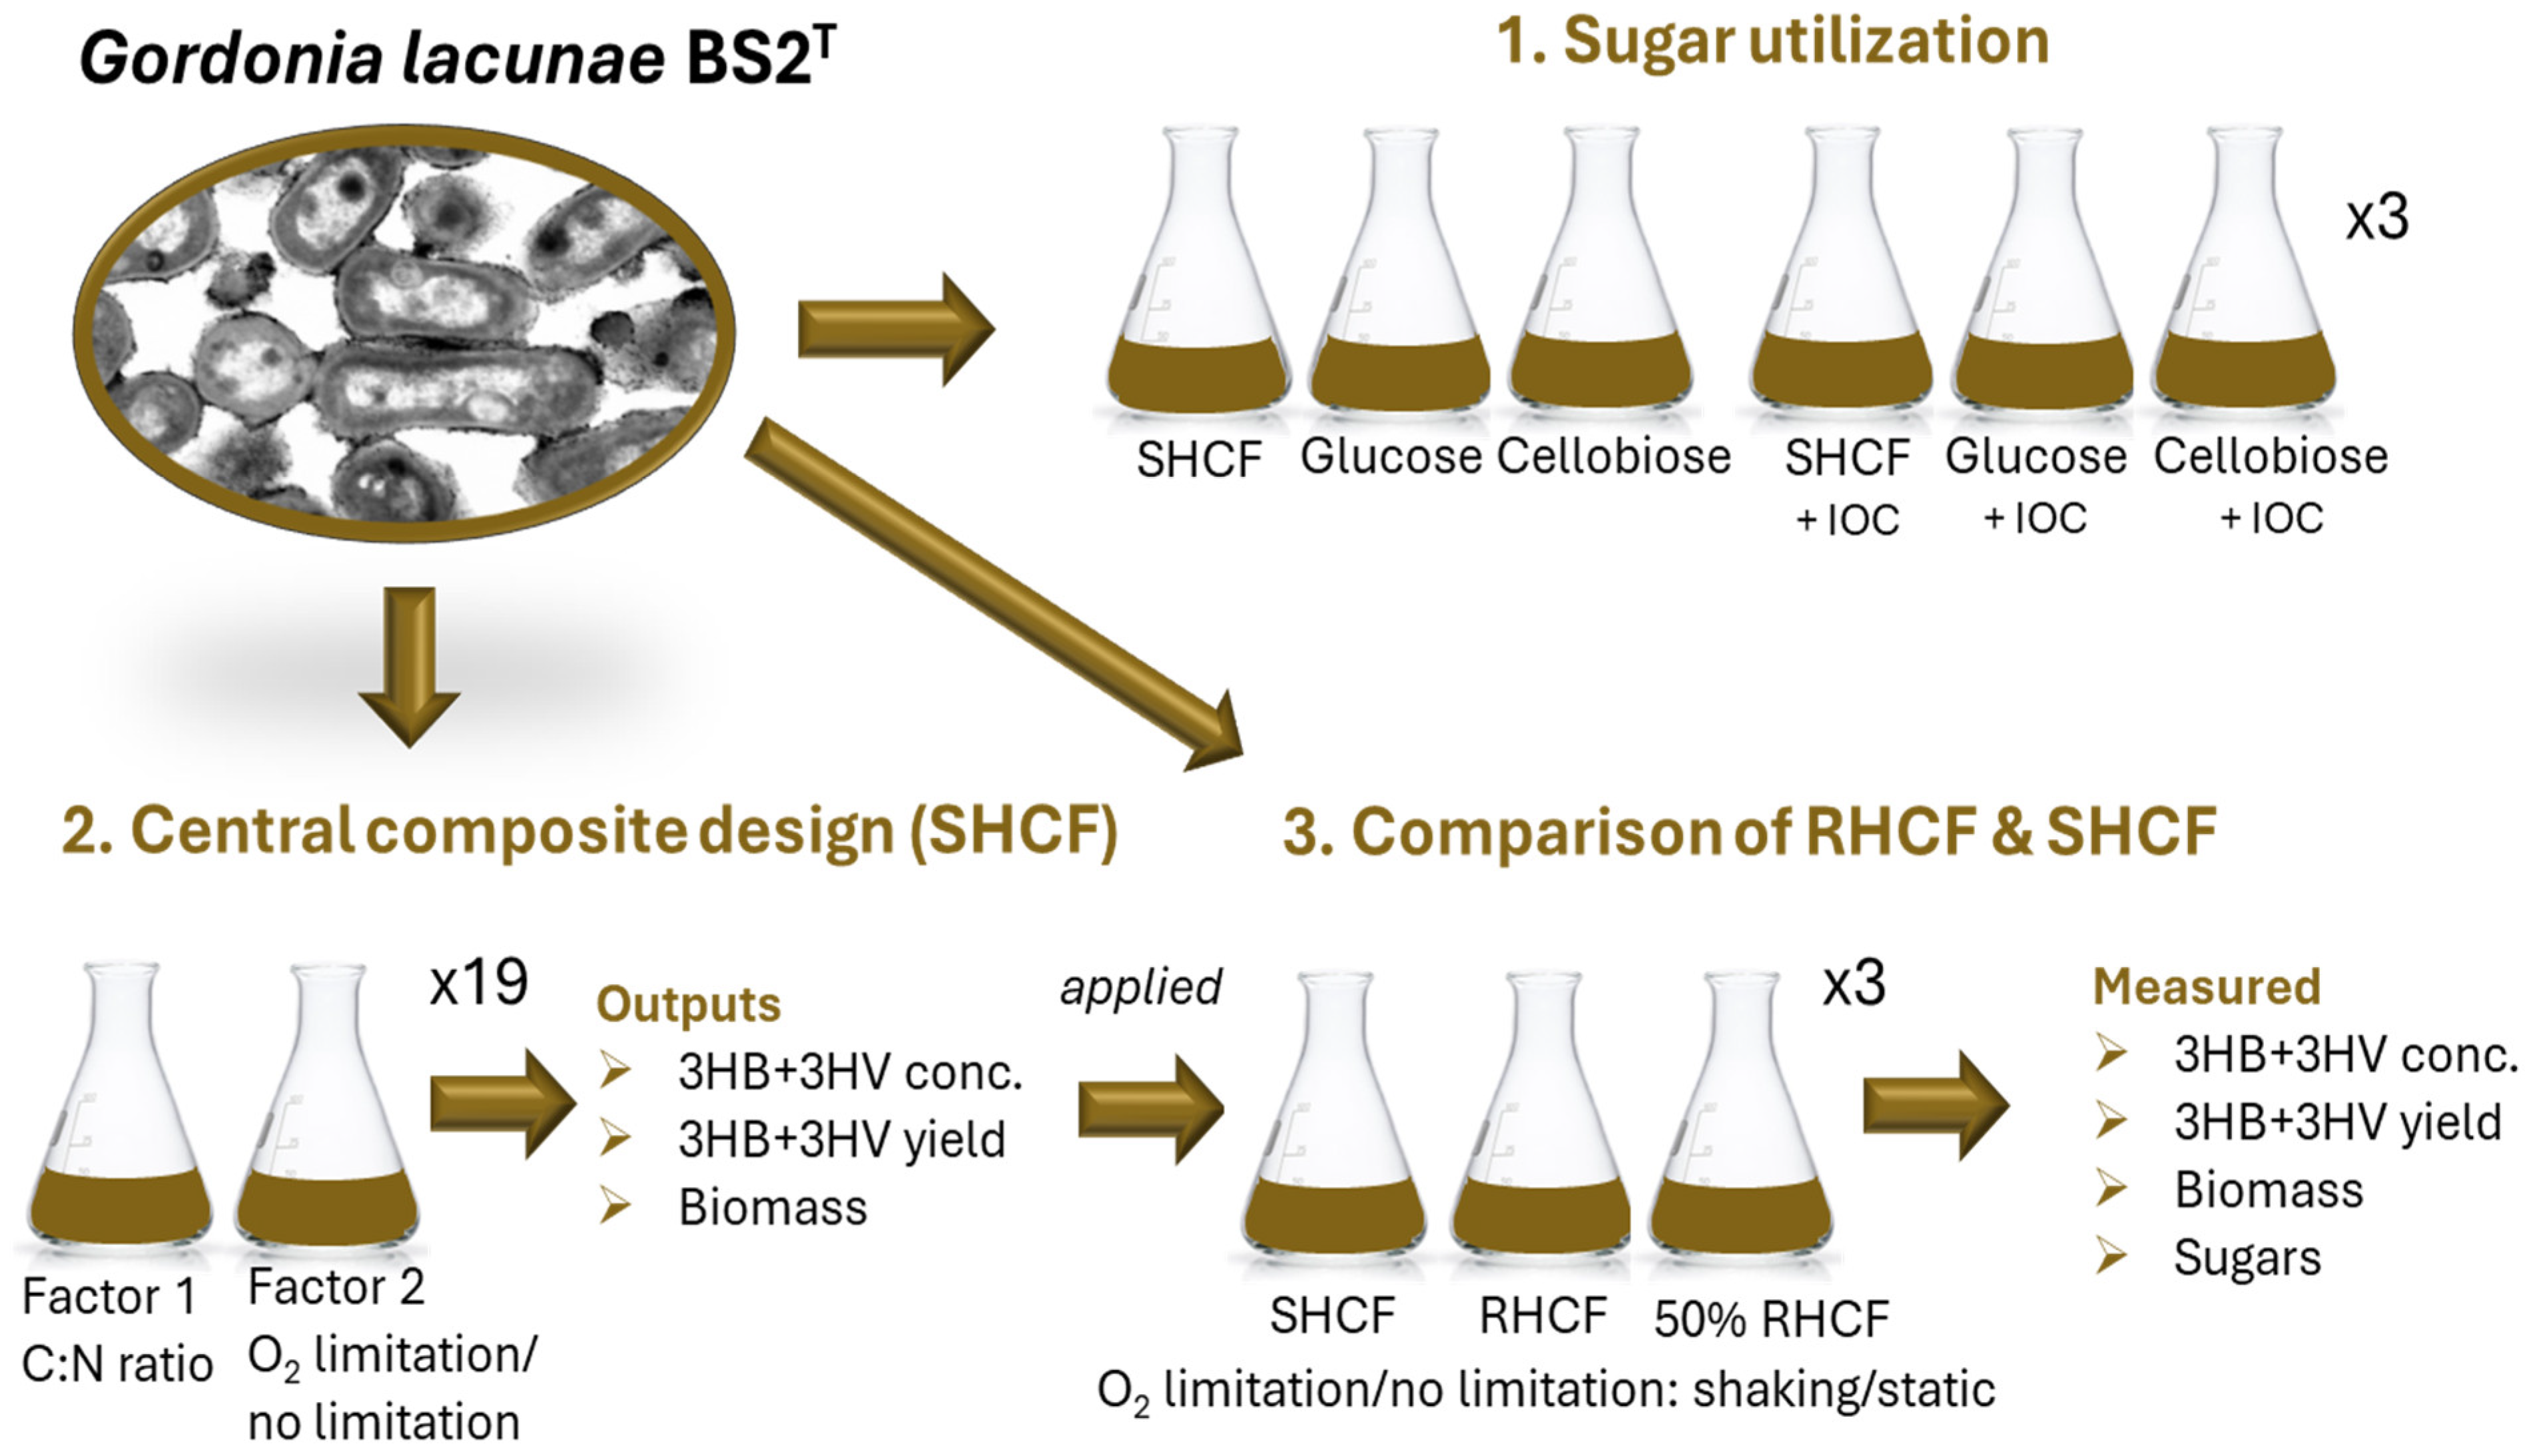
T to be definitively established. It was understandably more difficult to isolate and assess causal effects with RHCF. The second set of experiments included SHCF as a control, but the main intention was to ascertain the plausibility of using real hydrolysates from a readily available, low-value, and non-seasonal agri-industrial waste for PHA production using
G. lacunae BS2
T. The composition of the SHCF and the method used to prepare the RHCF used in this study were based on a previously published optimized protocol [
14]. The characteristics of SHCF and RHCF are shown in
Table 4. The RHCF was used in filtered raw form with no addition of nutrients. Overall, the sugars and macronutrients in the RHCF filtrate and whole RHCF were not sufficiently different to warrant using the whole samples for PHB and PHV production. Not only is it difficult to observe bacterial growth in the presence of particulates, but this fraction is also more likely to contain inhibitors released during steam-explosion, such as furan aldehydes, aliphatic acids, phenolic compounds, and aromatics [
34]. The RHCF was therefore filtered for use in the ensuing study.
The C:N ratio with inorganic N in the filtered RHCF was 2.5 times higher than in the SHCF and almost 30 times higher than the highest C:N ratio used in the CCD experiment. However, organic N was present in the form of protein in the RHCF. Protein concentrations are often estimated stoichiometrically by multiplying the amount of N by a factor of 5.8, as first described in 1984 [
35]. In the whole RHCF, the amount of protein was underestimated by a factor of 3 using this conversion factor, while for the filtrate, the protein estimate (0.30 g/L) closely approximated the measured value (0.28 g/L). These results suggest that the majority of N was protein-based but was not released from the particulate fraction during hydrolysis.
3.3.2. Growth Profiles
The growth of
G. lacunae BS2
T was measured using TS as a proxy as previously described (
Figure 5a) [
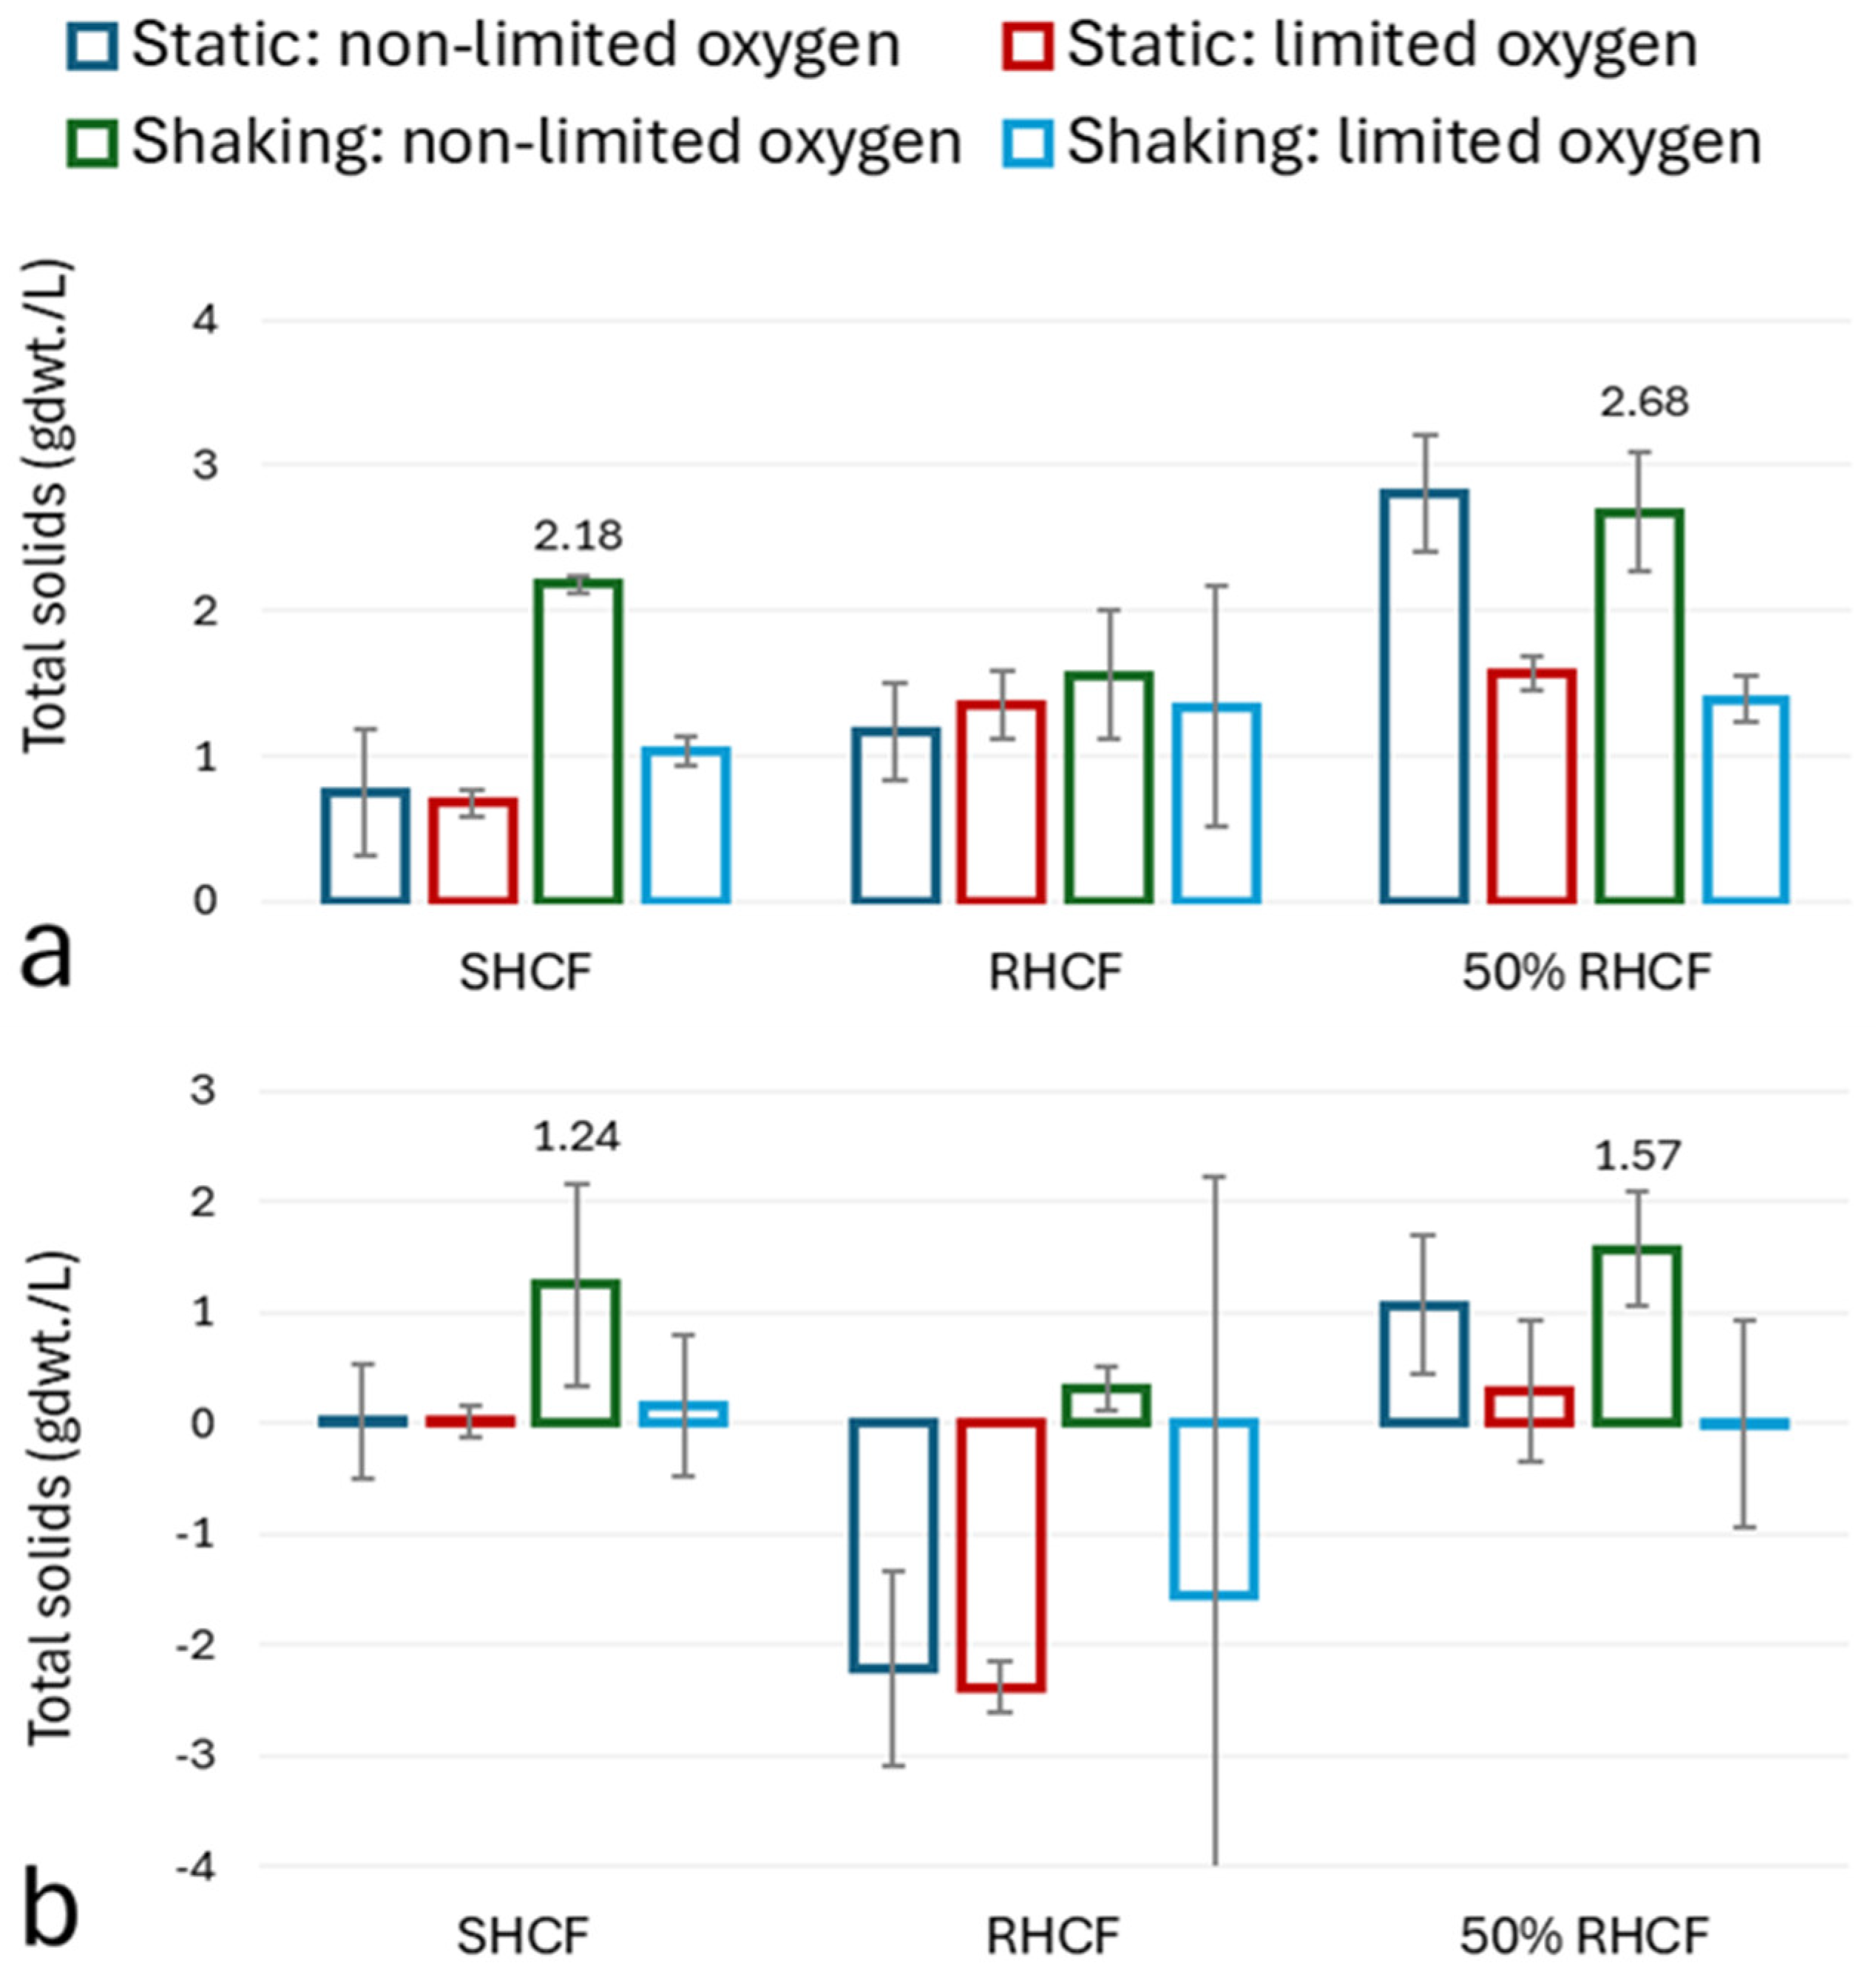
8]. However, solids present in the SHCF and the RHCF hydrolysates confounded the results even though the RHCF was filtered (
Figure 5b), giving negative values in some instances, especially with 100% RHCF. It is also possible that some solids were hydrolyzed during the experiment. Nonetheless, it was clear that 50% RHCF is a good growth medium for
G. lacunae BS2
T, especially when O
2 is not limited. Despite the high C:N ratios (
Table 4), and the fact that addition of N appeared to promote growth of
G. lacunae BS2
T with C:N ratios of 40 to 60, the highest TS concentrations of 1.24 g/L and 1.57 g/L in SHCF and RHCF after correction for TWW solids (
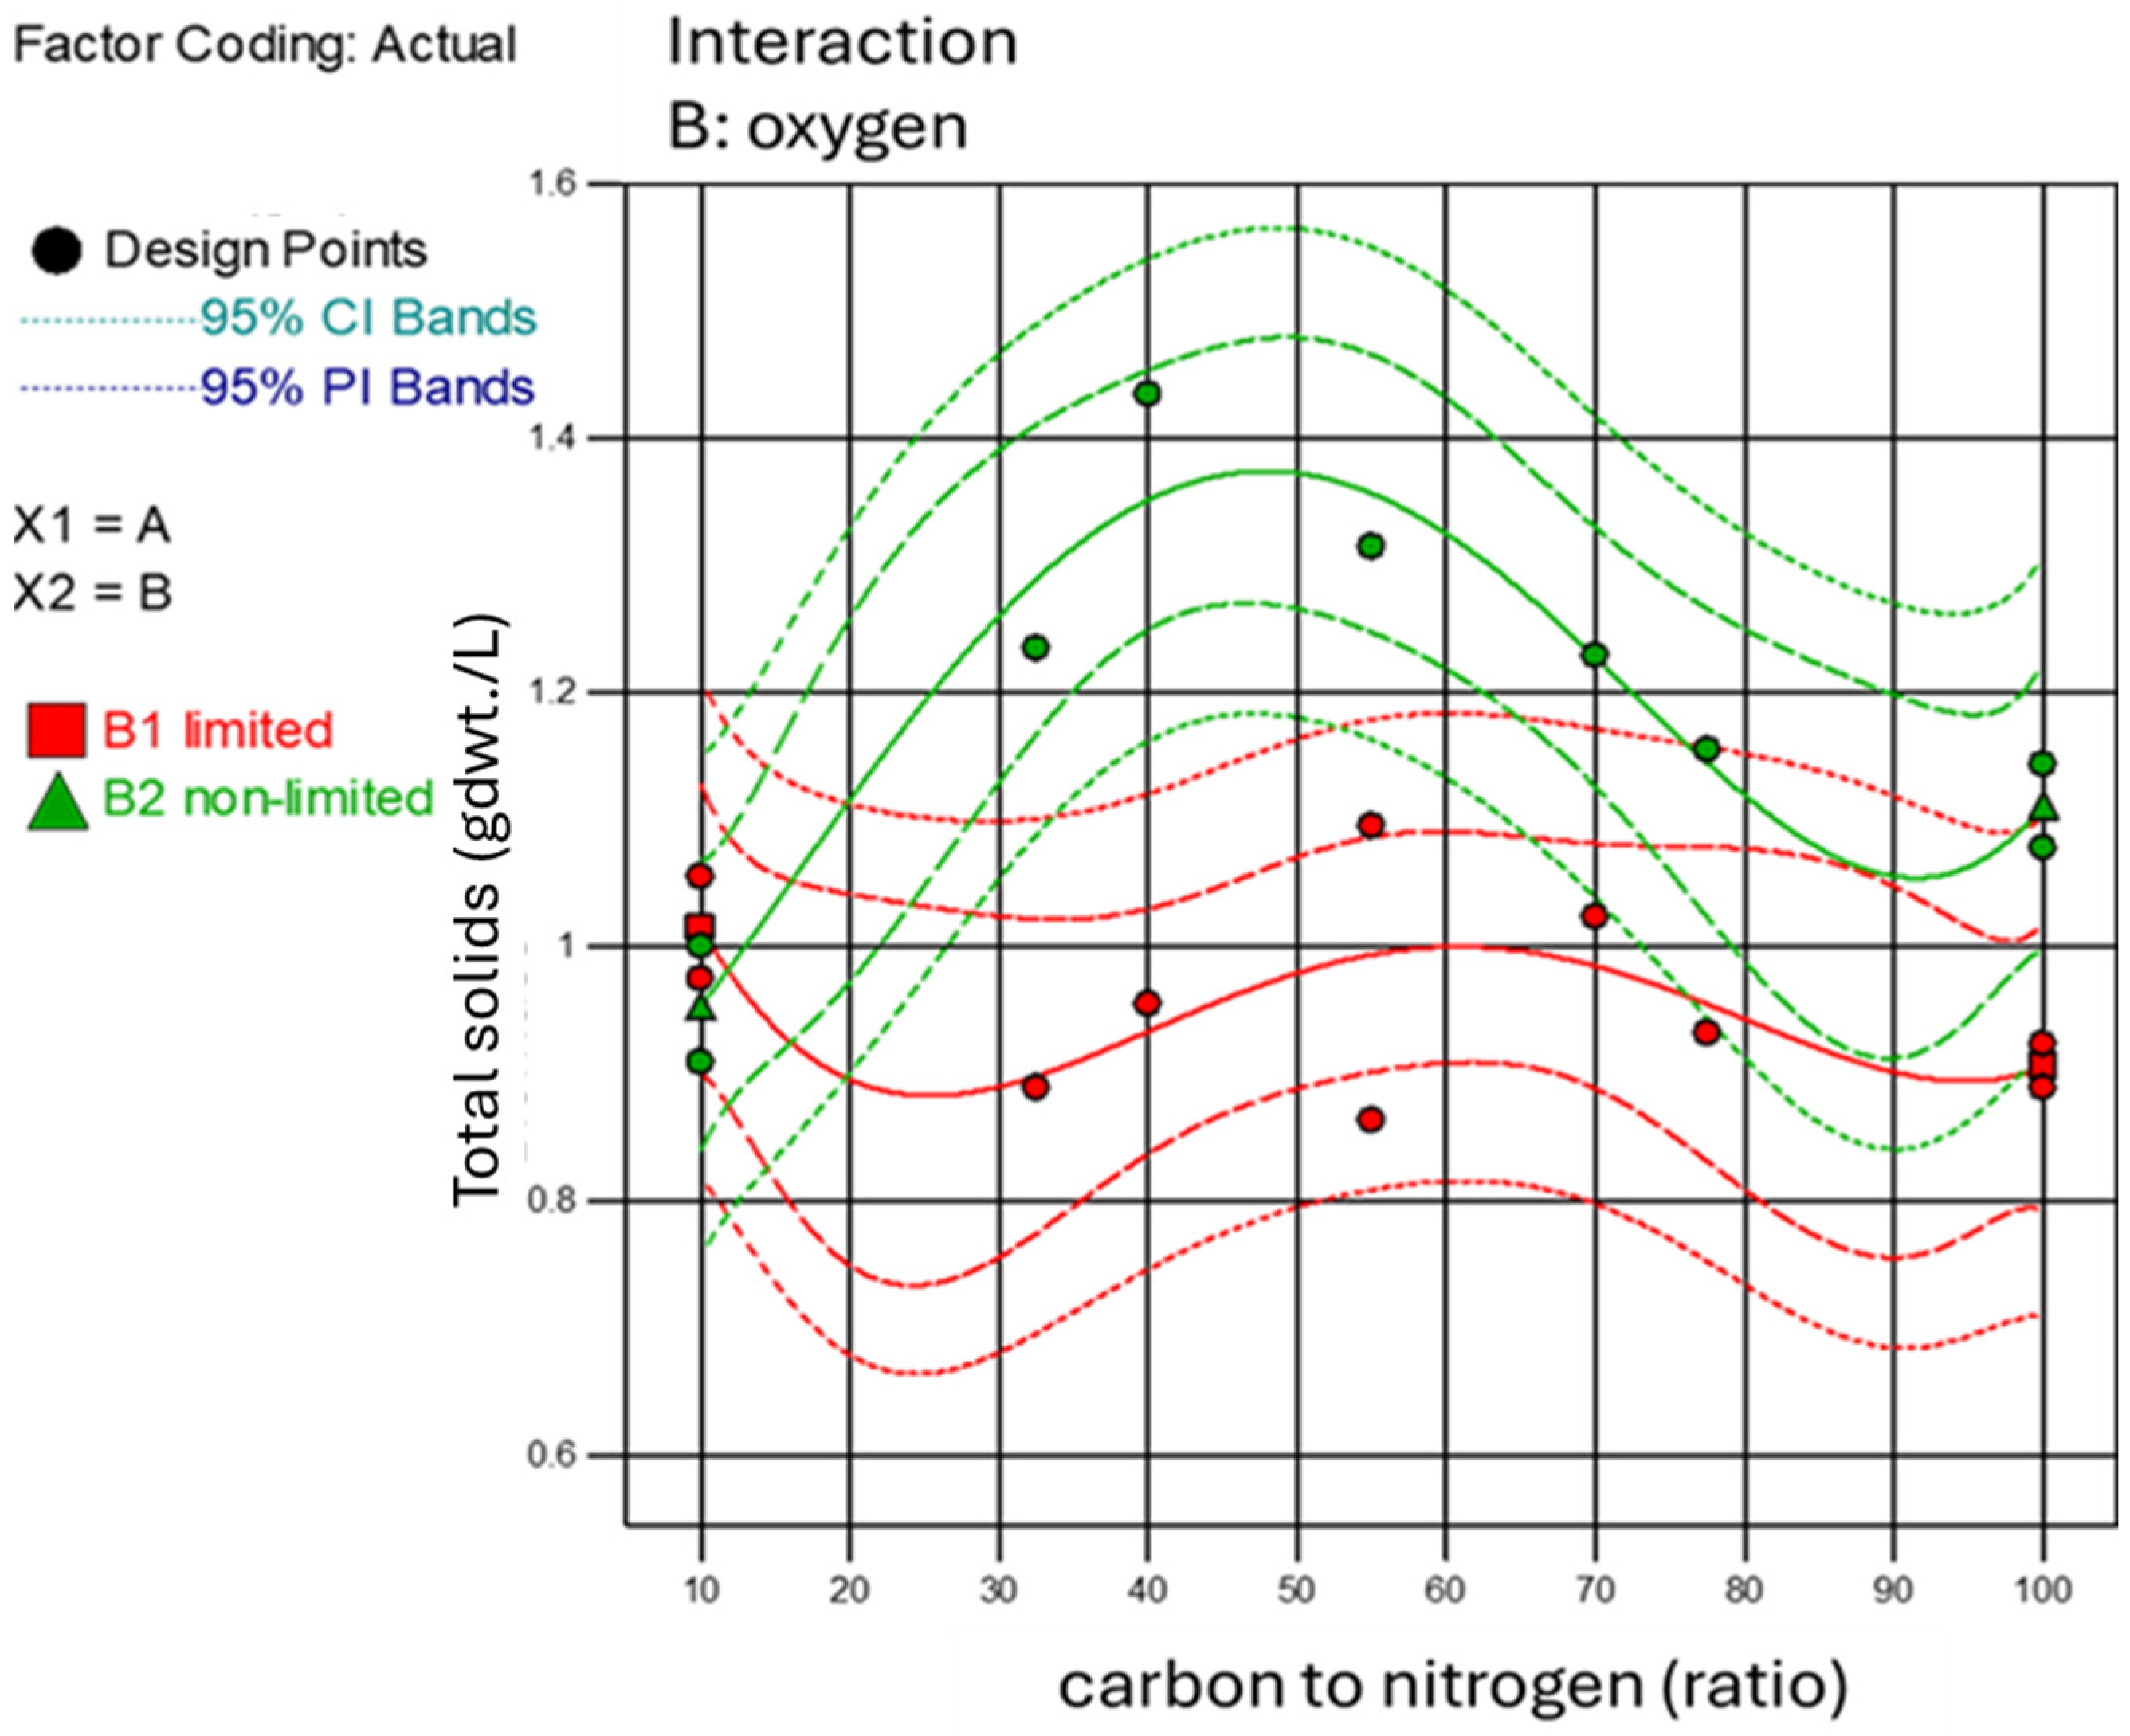
Figure 5b) were similar to those measured during the CCD experiment with SHCF under the same conditions (
Figure 3). It is possible that N was obtained from the protein fraction in the RHCF, which will be monitored in future studies. In contrast, poor growth was obtained in 100% RHCF, possibly due to the presence of higher concentrations of inhibitors released from the fines during hydrolysis than in the more dilute substrate [
34]. Many potential microbial growth inhibitors may be released from lignocellulosic feedstocks during pre-treatment, including furan aldehydes (e.g., furfural and 5-hydroxymethylfurfural), weak organic acids (e.g., acetic and formic acid), and phenolic compounds (e.g., p-hydroxybenzaldehyde, vanillin, and syringaldehyde) [
34,
36]. Detoxification methods are available [
36], but interventions add to the processing costs of producing PHA from lignocellulosic hydrolysates, so they were not considered during this study. In contrast to SHCF, shaking did not appear to promote better growth than static conditions in RHCF when O
2 was not limited.
3.3.3. Sugar Utilization
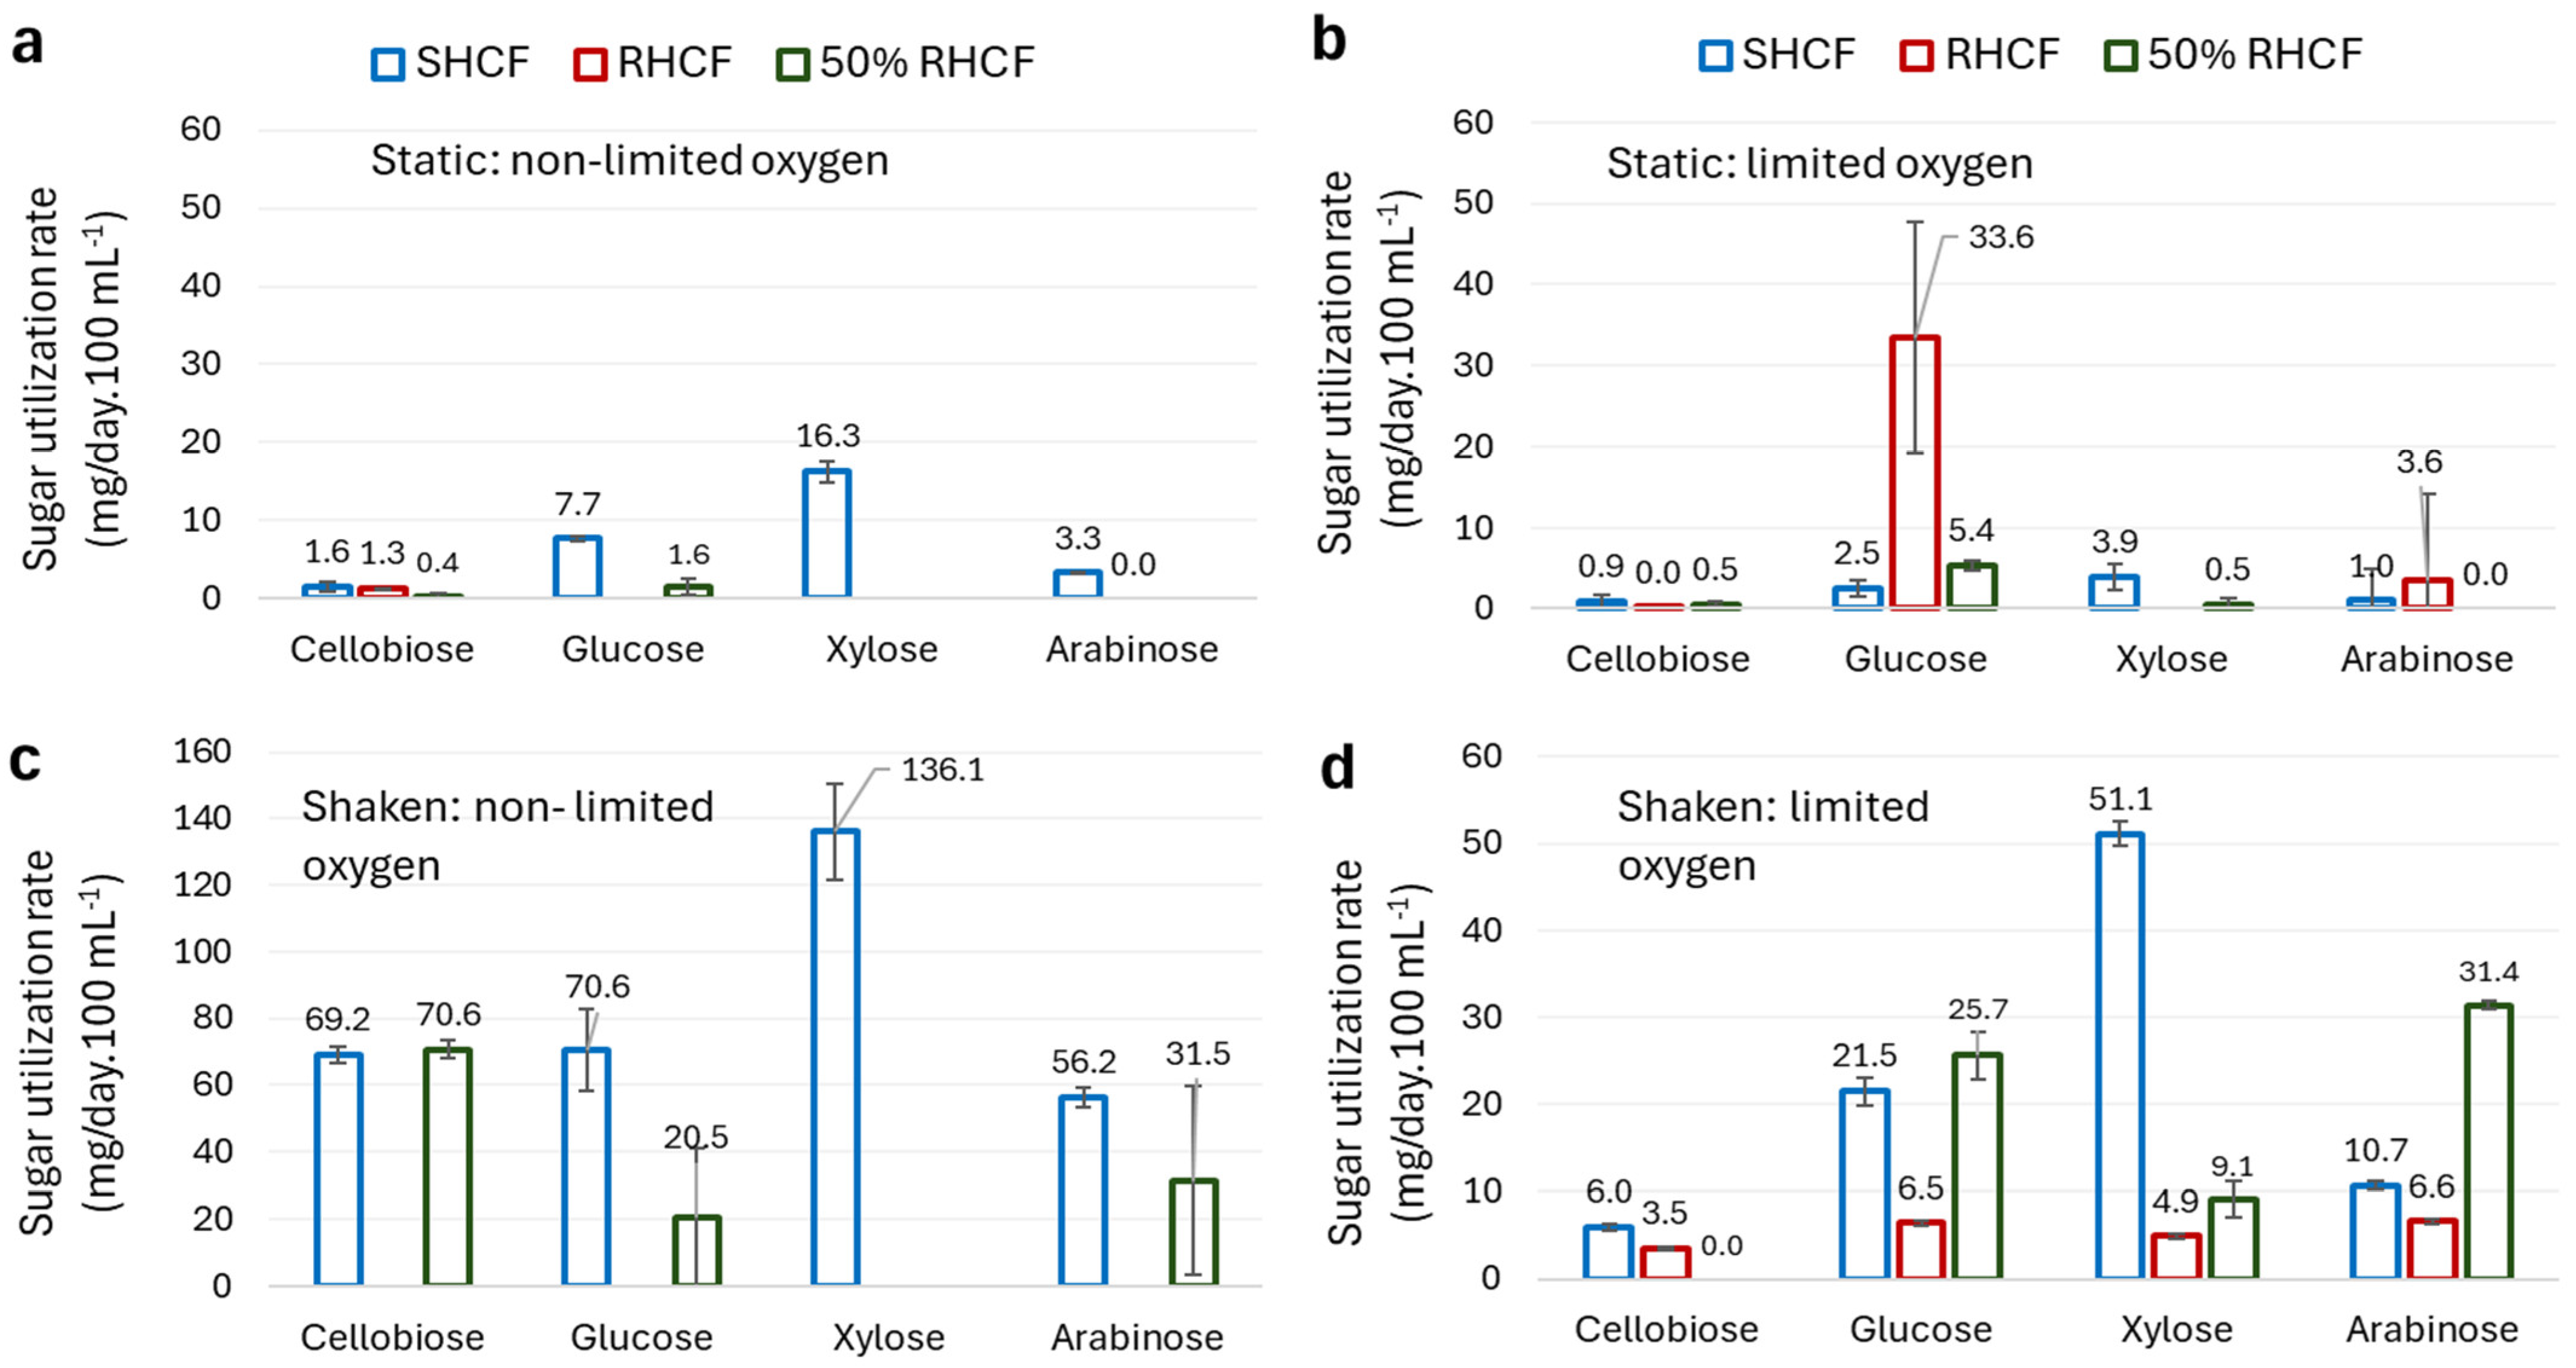
Utilization of sugars under the four culture conditions is shown in
Figure 6a–d. In contrast to SHCF and 50% RHF, O
2 limitation and static conditions promoted sugar utilization, especially glucose degradation, in 100% RHCF, suggesting that shaking may impact distribution of inhibitors and/or the use of fermentative rather than oxidative pathways for glucose and arabinose degradation. In contrast, static conditions reduced sugar utilization in SHCF and 50% RHCF in most instances (
Figure 6a,b). The highest utilization rates of all sugars in SHCF were found under shaking conditions when O
2 was not limited, implying the use of preferential oxidative degradation pathways, as shaking also promotes oxygenation. It was unclear whether O
2 limitation promoted or inhibited utilization of glucose and arabinose when the flasks were shaken. However, under these conditions, much of the cellobiose in SHCF and 50% RHCF was utilized (93% and 69%, respectively), while only a fraction was utilized when O
2 was limited. Notably, high utilization of xylose from SHCF occurred, while no xylose from 50% RHCF was utilized, indicating possible inhibition of enzymes involved in xylose degradation in RHCF.
Although higher sugar utilization was measured in SHCF than 50% RHCF, higher growth rates were found in 50% RHCF, possibly due to utilization of other growth substrates present in the RHCF that were not added to the defined medium (SHCF). This hypothesis merits further experimental validation. These results underscore the complexity of understanding the mechanistic patterns behind the growth of G. lacunae BS2T under different conditions, and how the use of defined or synthetic media can influence study outcomes when used as proxies for real hydrolysates.
3.3.4. Polyhydroxybutyrate and Polyhydroxyvalerate Production
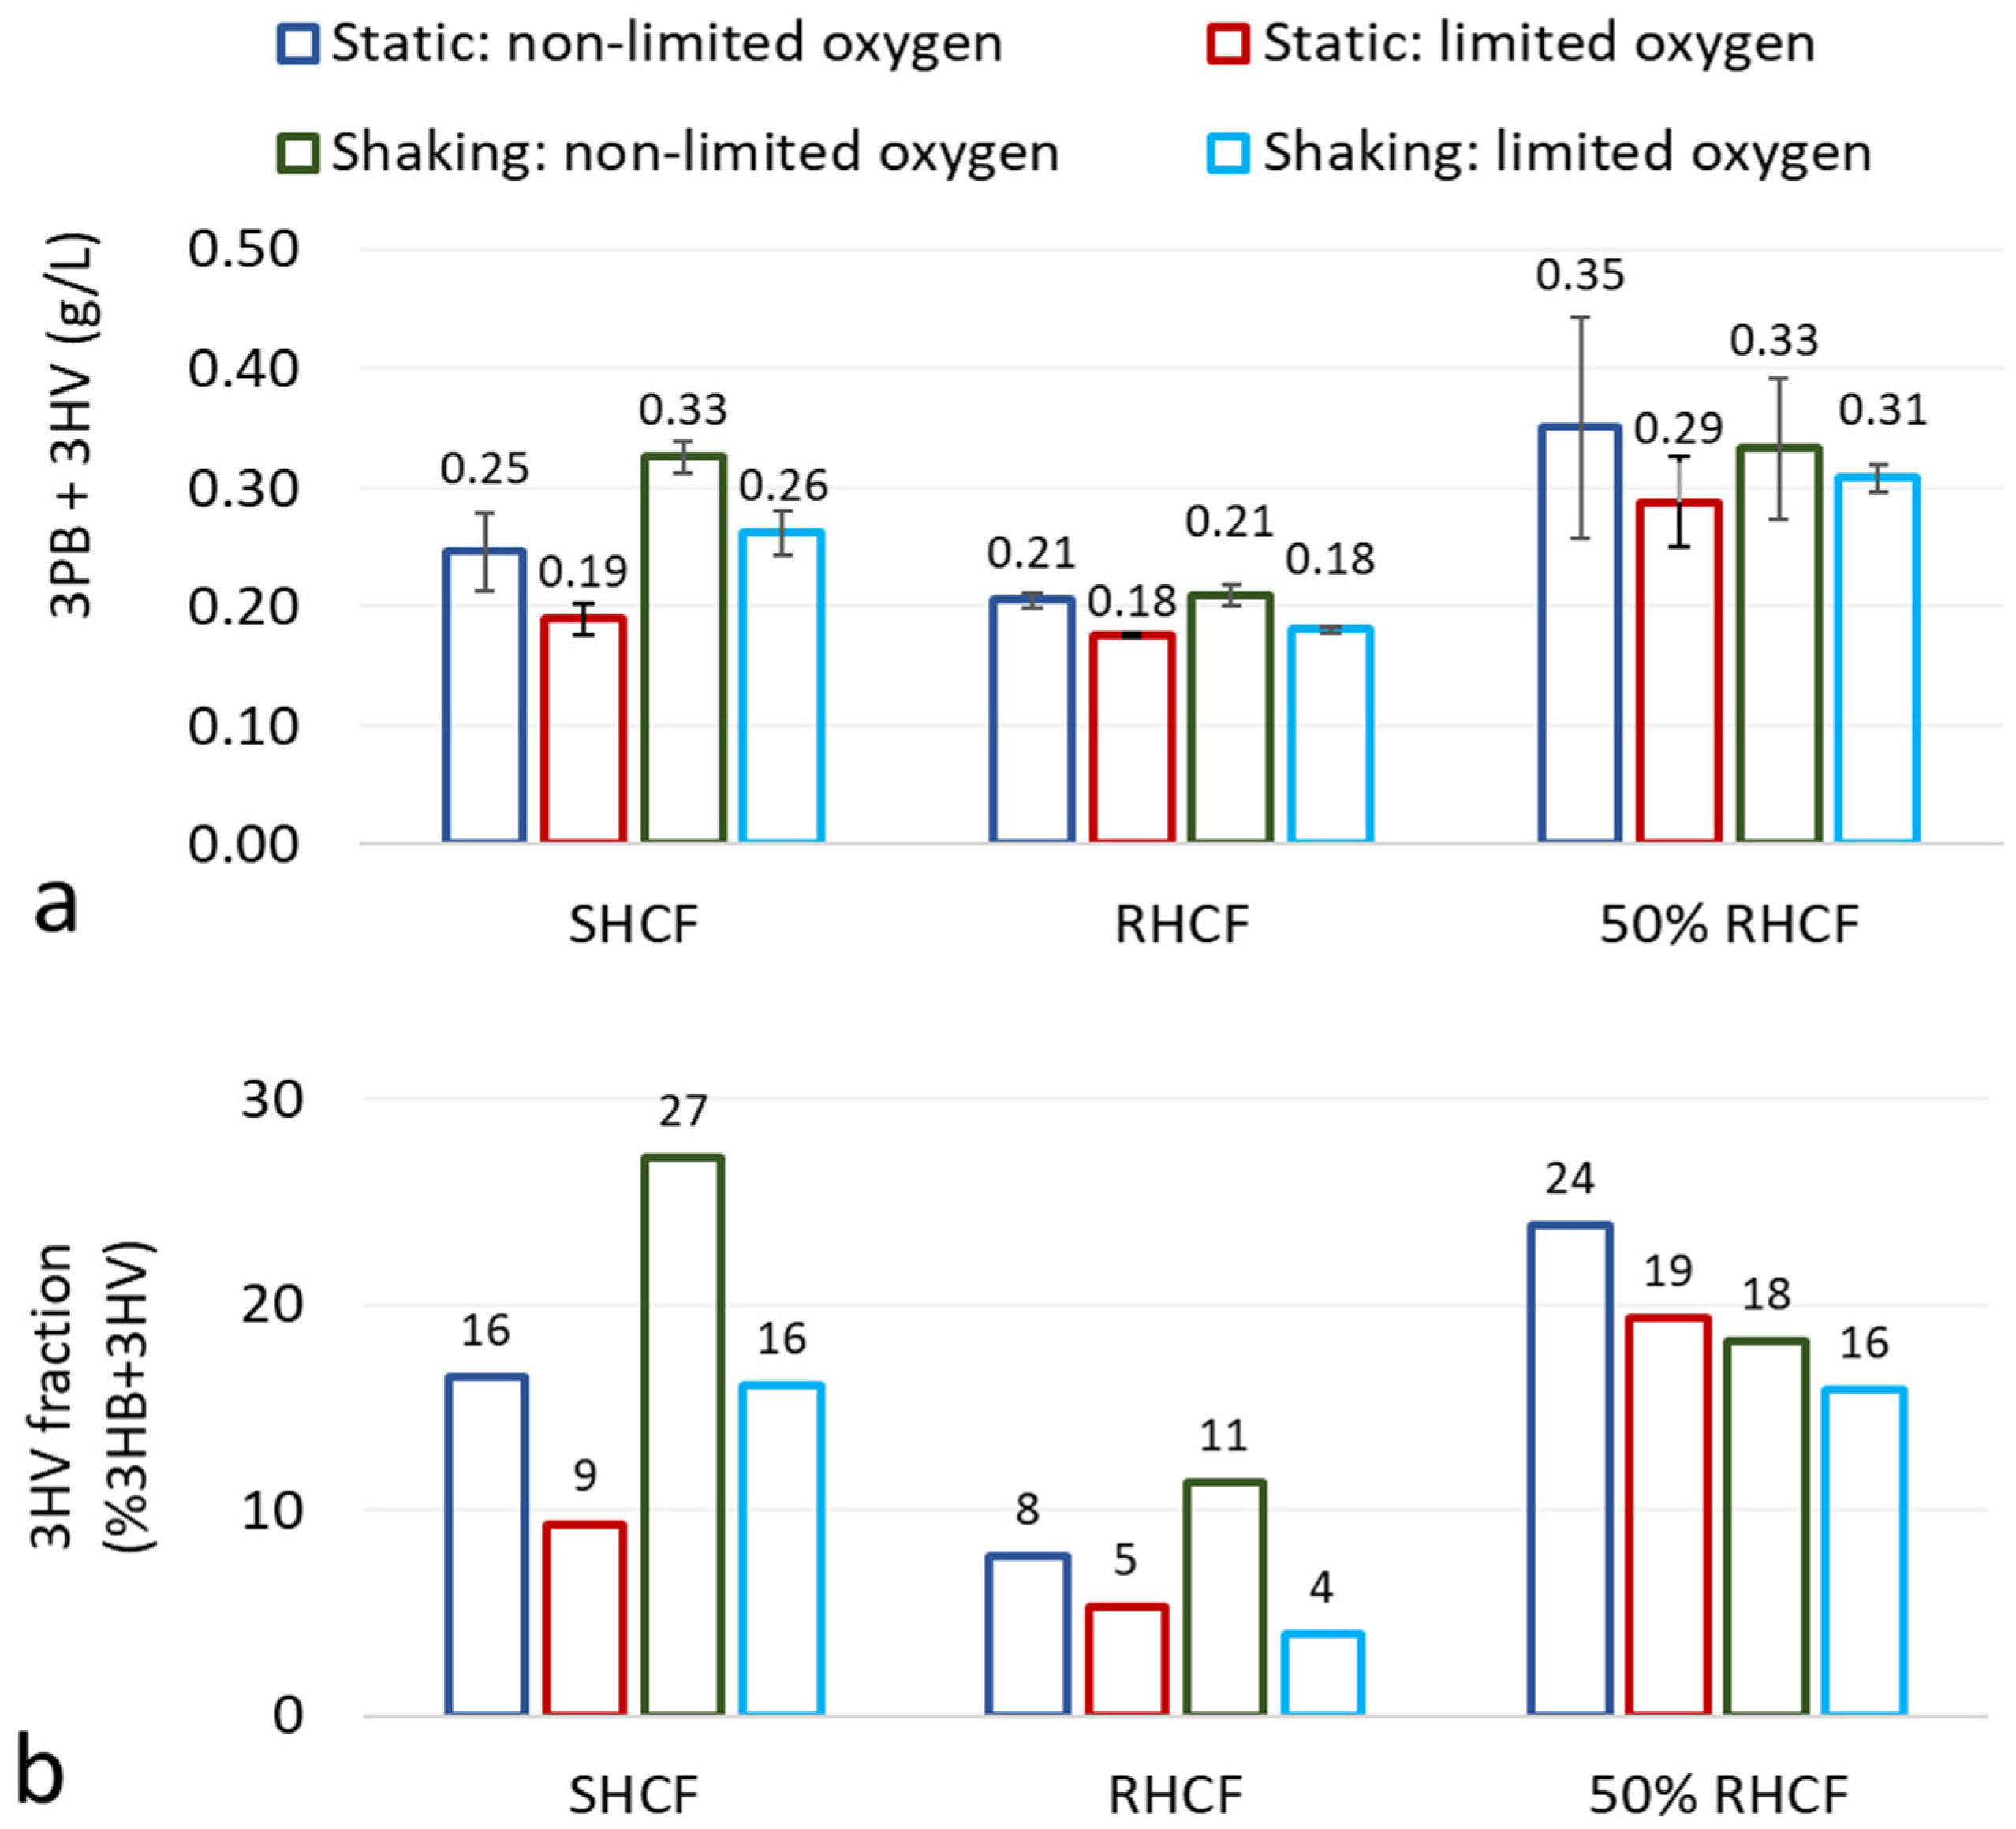
In terms of preferred substrate, the 3HB and 3HV concentrations were significantly higher when
G. lacunae BS2
T grew: (i) in 50% RHCF rather than 100% RHCF under all process combinations, (ii) in 50% RHCF rather than SHCF when O
2 was limited, and (iii) in SHCF rather than 100% RHCF under shaking conditions (
Figure 7a;
p < 0.05; paired t-test). Notably, 50% RHCF was the most suitable medium for 3HB+3HV production, while 100% RHCF was the least suitable. It was hypothesized that inhibition of 3HB+3HV production along with microbial growth (
Section 3.2.2) was adversely affected by inhibitors in undiluted RHCF at high concentrations. This was supported by the fact that 3HB+3HV concentrations were higher in SHCF under shaking conditions that can promote contact between microbial cells and inhibitors.
In terms of process conditions, the 3HB+3HV concentrations were significantly higher when: (i) O2 was not limited (v/s limited) under both static and shaking conditions, and (ii) when flasks were shaken (v/s static), but only when O2 was limited. These process differences were noted when all substrates were analyzed simultaneously. However, there were no significant differences in 3HB+3HV concentrations related to process conditions when 50% RHCF was analyzed separately.
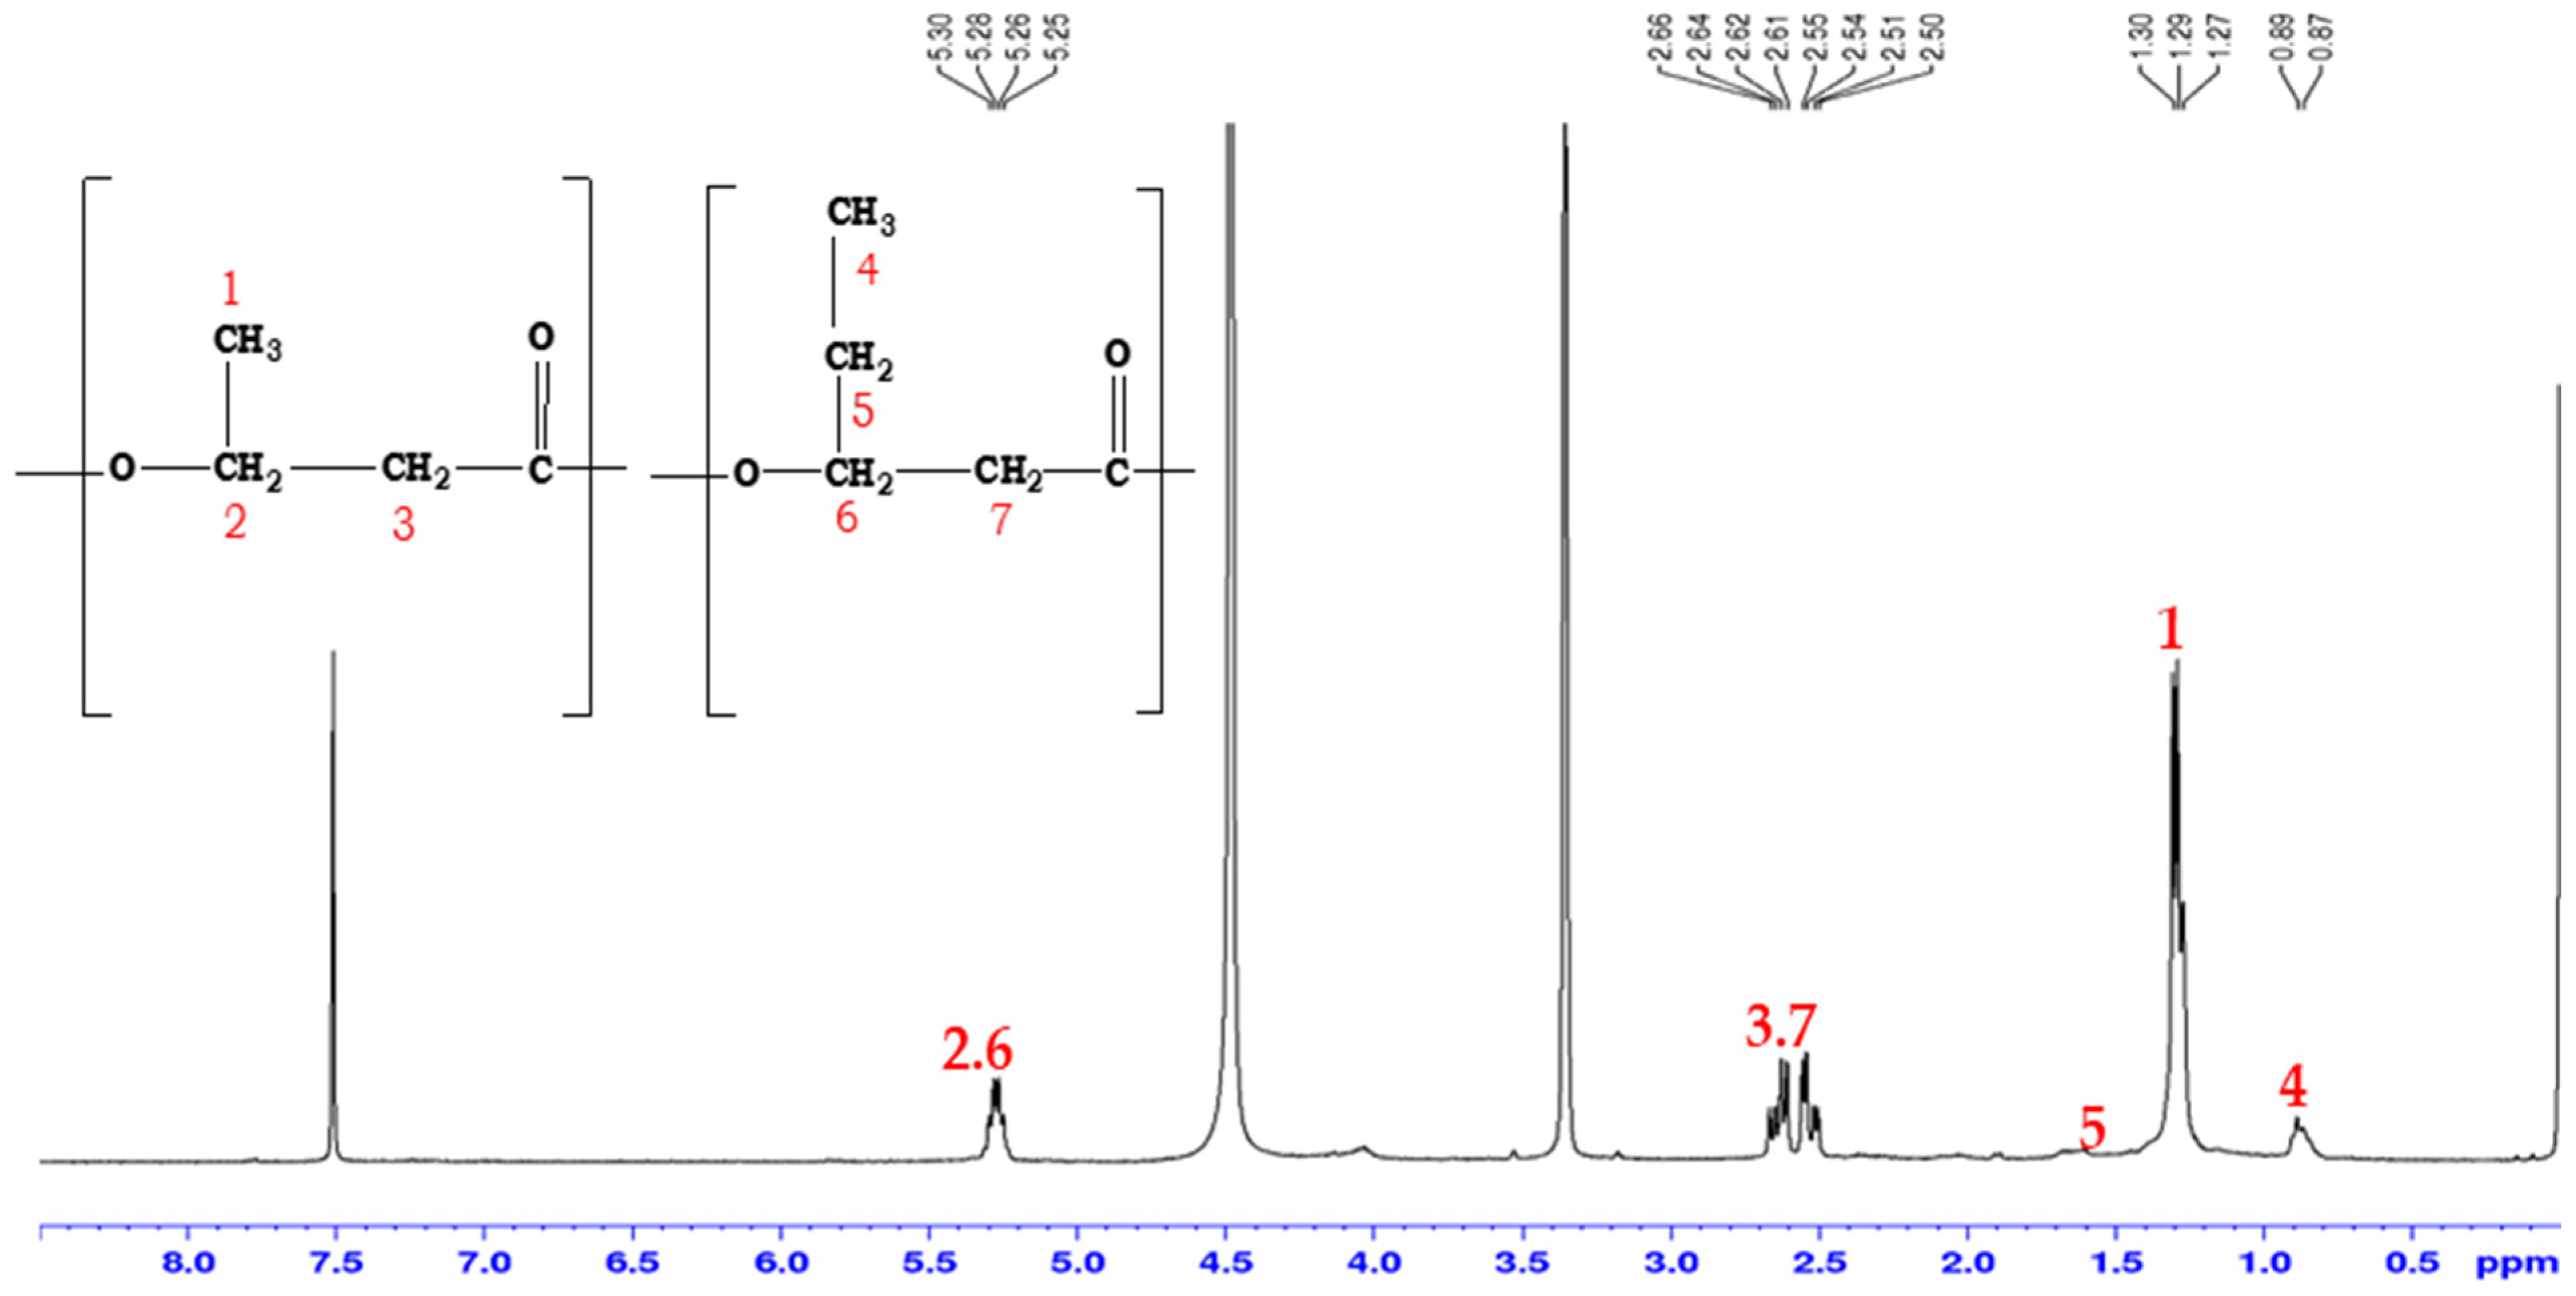
The fractions of 3HV in the combined 3HB+3HV (
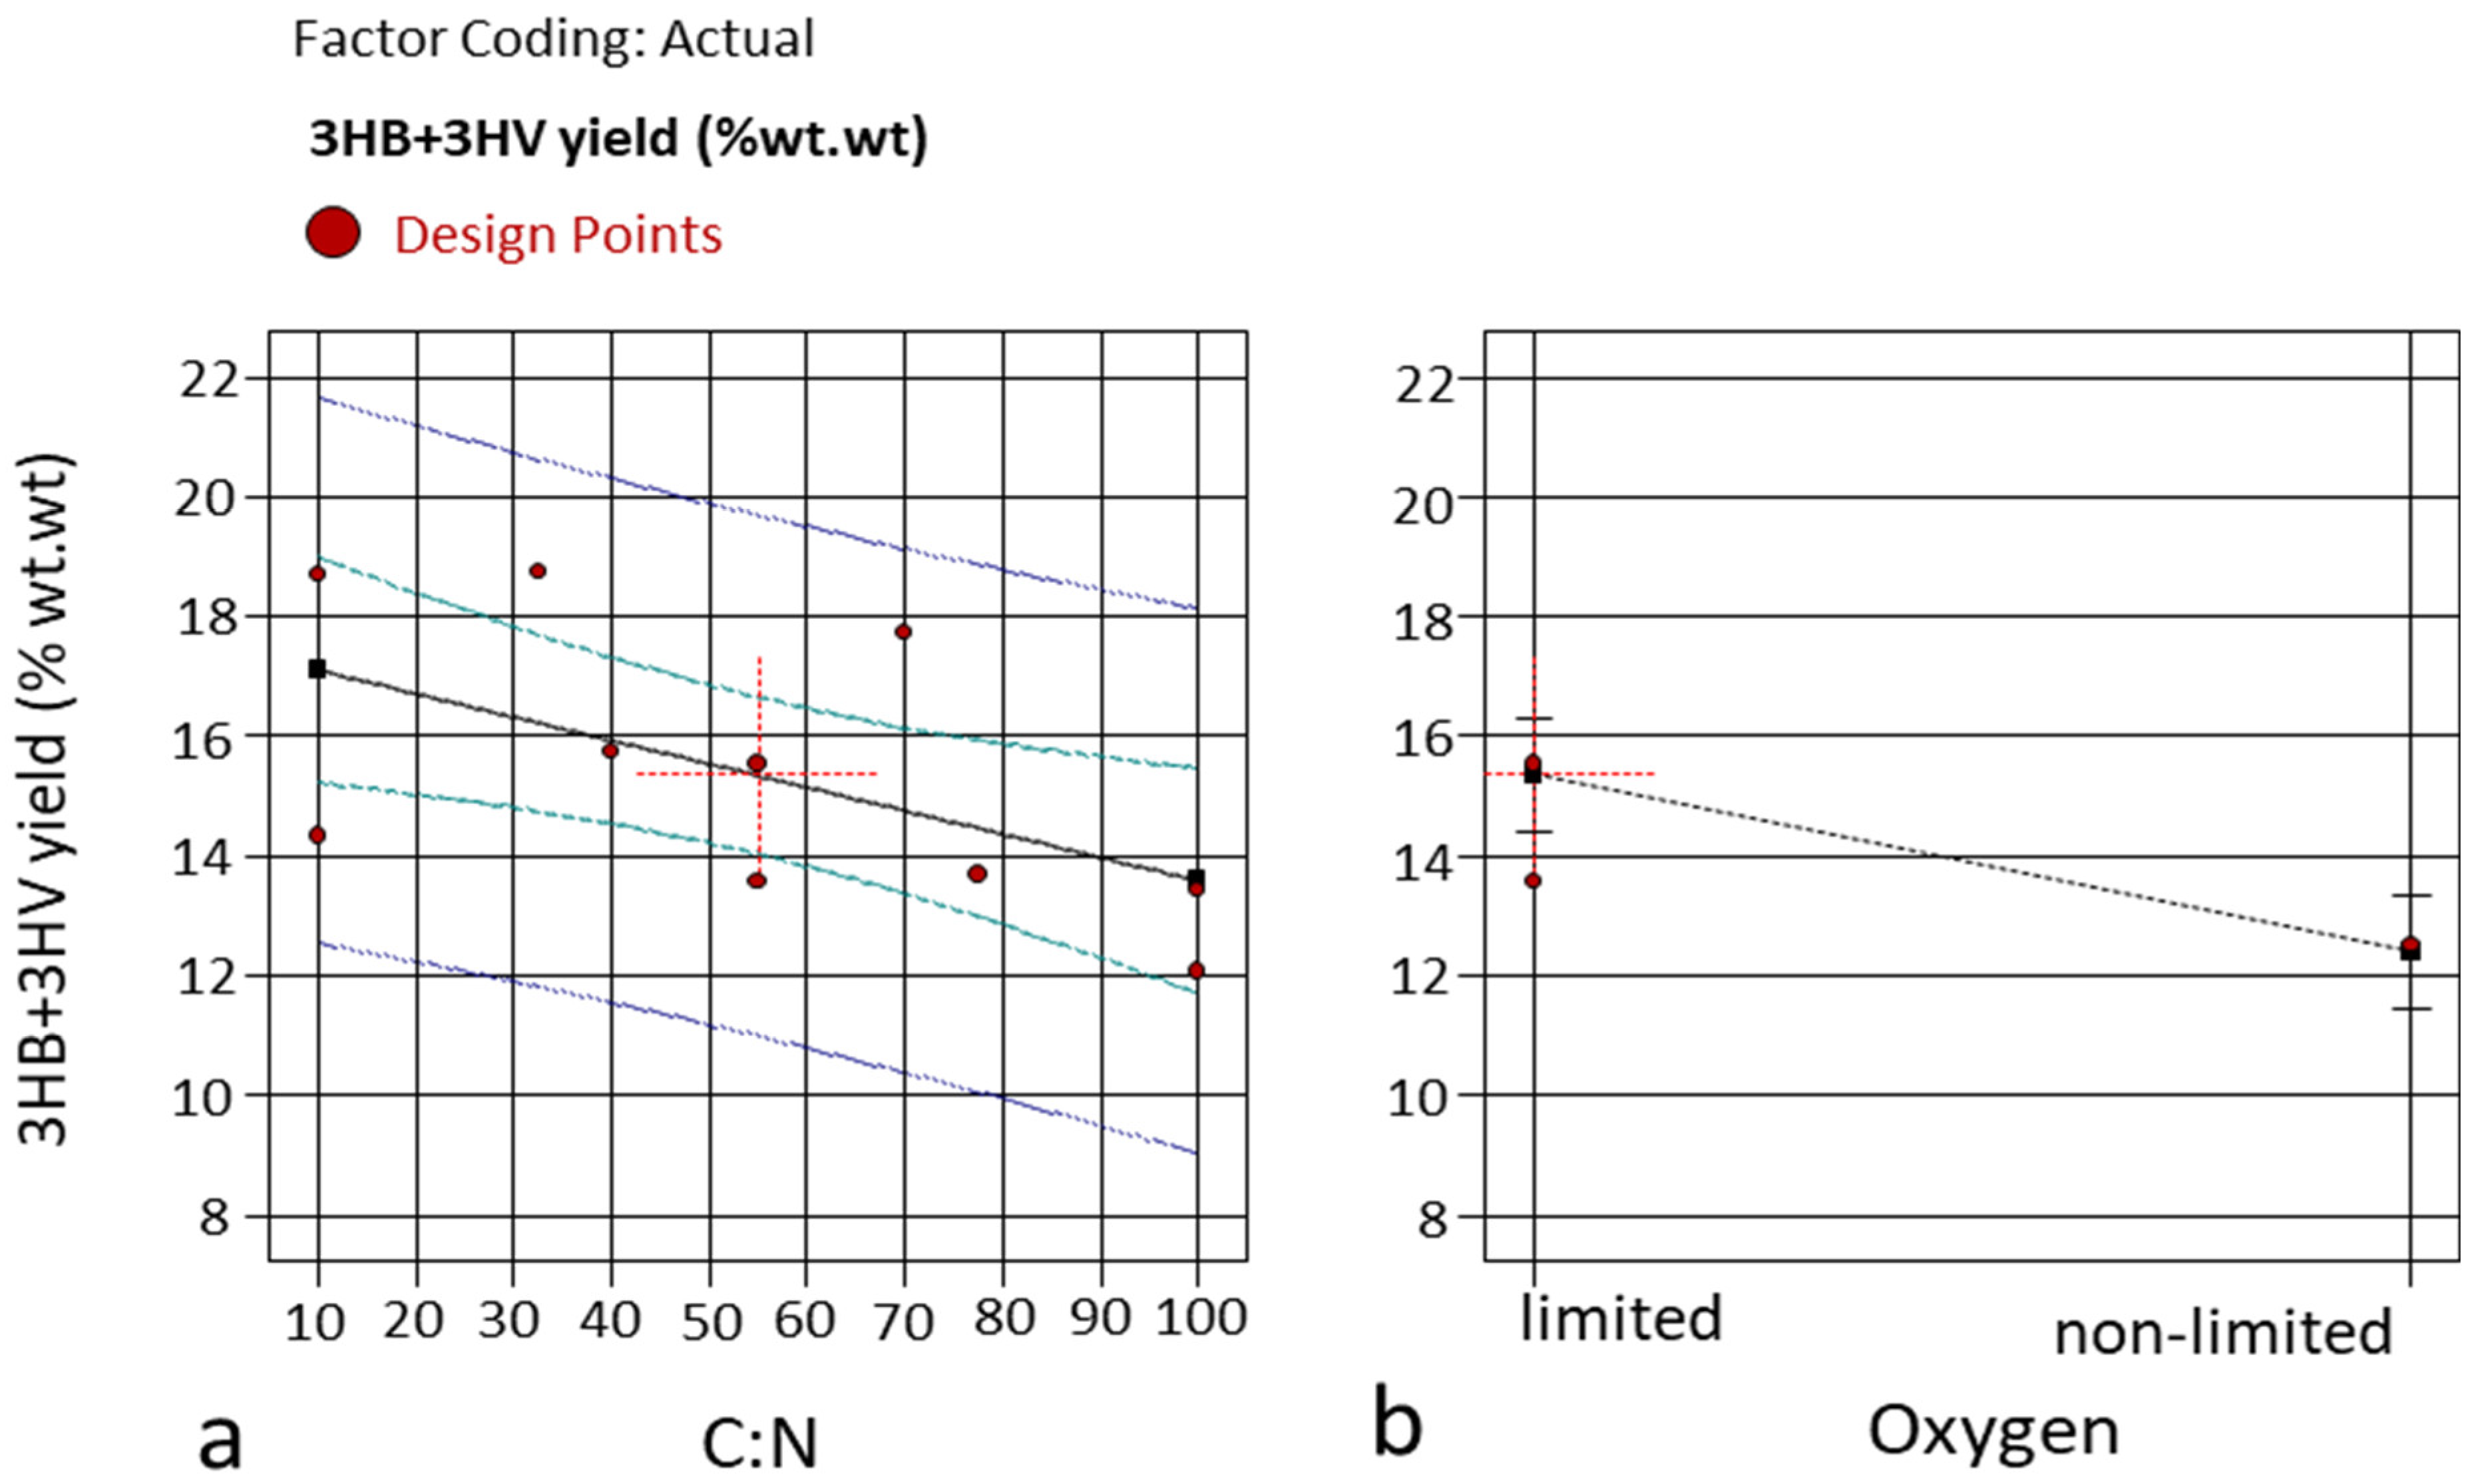
Figure 7b) were lower than those found with lower C:N ratios in the CCD experiment (4% to 27% and 37 to 52%, respectively). This was attributed to the lower amounts of N that were present in the substrates in this study in comparison with the CCD study, which showed that 3HV production was enhanced with decreased C:N ratios in SHCF (
Section 3.2.2).
In a recent review of 22 studies [
37], PHB yields and concentrations ranging from 11.4% (0.11 g/L) in
Pseudomonas sp. phDVI [
38] grown in phenol to 99% in a mutant
Escherichia coli LSBJ [
39] grown in fatty acids, and 106.6 g/L in
Cupriavidus necator Re2058/pCB113 grown in fructose [
40] were reported. It is possible that methodological differences could account for some of the discrepancies between the yields and concentrations achieved in this study. For example, some researchers have used the crotonic acid method, quantified PHA using non-specific fluorescent dyes such as Nile red [
41] or Sudan black [
42], or quantified the entire biomass extract gravimetrically and assumed it to be pure PHA [
43]. Nevertheless, it is acknowledged that extensive work is still required to increase the growth and PHA accumulation kinetics of
G. lacunae BS2
T in RHCF. For example, researchers were able to increase PHBV synthesis from negligible amounts to 2.3 g/L by optimising the pH, the amount of co-substrate, and the C:N ratio by a mixed consortium sourced from activated sludge grown in hydrolysates obtained from poplar biomass over seven reactor cycles [
33].
Table 5 shows the results of other recent studies where lignocellulosic hydrolysates were used for bacterial production of PHA. Without exception, Gram-negative strains were used, including the commonly researched
Cupriavidus and
Ralstonia genera, and other Gram-negative rods. The advantage of using Gram-positive genera such as
Gordonia for PHA production is that the inherent risk posed by endotoxins in Gram-negative cell walls is removed, rendering the polymers more desirable for high-value medical and veterinary applications [
44].
All studies shown in
Table 5 used the gravimetric method as a proxy for determining the dry cell weight (DCW) of the biomass, either by freeze-drying or heat-assisted evaporation of the liquid fraction. However, other researchers did not account for non-biomass solids or allude to any inaccuracies. While measurement of TS is the method of choice for such studies, there are inherent flaws associated with this and other commonly used methods for approximating biomass in small-scale studies [
45]. To improve the accuracy of biomass measurements, it is highly recommended that researchers account for non-biomass solids in future studies involving hydrolysates, wastewater, and other culture media containing non-biomass solids [
45].
Unlike this study, the other researchers used GC to quantify 3HB, 3HV, and GC-MS for identification and/or quantification of other monomers. The highest concentrations achieved under optimized conditions range from 0.44 g/L (3HB+3HV) in rice husk straw hydrolysate [
46] to 2.9 g/L 3HB in Eucalyptus bark hydrolysate [
47], while the highest yields achieved range from 25% (wt.wt.) in Eucalyptus bark hydrolysate [
47] to an anomalous >100% (3HB+3HV) (1049.30 mg/g) in poplar biomass hydrolysate [
33]. The latter result points to methodological uncertainty with either the biomass and/or PHBV quantification in that study.
Strategies for increasing PHB and/or PHV production in these studies include digesting rice straw hydrolysates, a “feast–famine” approach [
46], or co-culturing with acetate [
33] to increase the amount of volatile fatty acids precursors for PHA production. Addition of P and trace elements can also be beneficial [
33], but it would increase production costs and decrease feasibility. Other researchers have engineered bacterial strains to increase sugar utilization profiles. Yuan [
48] and Wang [
49] and their respective co-workers inserted xylose degradation genes to increase PHA synthesis by
Halomonas cupida J9 and
Halomonas bluephagenesis, respectively, grown in hydrolysates of corn straw and wheat straw, respectively.
Table 5.
Bacterial polyhydroxyalkanote production in various lignocellulosic hydrolysates.
Table 5.
Bacterial polyhydroxyalkanote production in various lignocellulosic hydrolysates.
| Hydrolysate | Microbial Strain | Polyhydroxyalkanoates | Ref. |
|---|
| Conc. (g/L) | Yield (%wt.wt.) |
|---|
| Poplar | Mixed culture from activated sludge | 2.3 (3HB+3HV) | >100% | [33] |
| Rice husk | Cupriavidus necator DSM 454 | 0.44 (3HB+3HV) | 65 | [46] |
| Eucalyptus bark | Burkholderia thailandensis DSM 13276 | 1.6 (3HB) | 25 | [47] |
| Eucalyptus bark | Pseudomonas sp. | 2.9 (3HB) | 39 | [47] |
| Wheat straw | Halomonas bluephagenesis T39 | >10 (3HB) | 61 | [48] |
| Corn straw | Halomonas cupida J9 | 2.5 (NS) | 35 | [49] |
| Barely * | Ralstonia eutropha 5119 | 1.8 (3HB+3HV) | 63 | [50] |
| Miscanthus * | Ralstonia eutropha 5119 | 2.0 (3HB+3HV) | 44 | [50] |
| Pine * | Ralstonia eutropha 5119 | 1.7 (3HB+3HV) | 54 | [50] |
| Bamboo | Halomonas alkalicola M2 | 2.1 (3HB+3HV+3HD) | 52 | [51] |
| Eucalyptus bark | Burkholderia thailandensis DSM 13276 | 4.6 (3HB) | 60 | [52] |
| Pine sawdust | Cupriavidus necator ATCC 17699 | 1.0 (3HB+3HV) | 62 | [53] |
| Canola straw | G. lacunae BS2T | 0.35 (3HB+3HV) | 24 | This study |