Article

Polyhydroxyalkanoate Production by Gordonia lacunae BS2T in Hydrolysates of Canola Fines

Applied Microbial and Health Biotechnology Institute, Cape Peninsula University of Technology, Bellville Campus, Symphony Way, Bellville, Cape Town 7530, South Africa
*
Author to whom correspondence should be addressed.
Fermentation 2026, 12(5), 250; https://doi.org/10.3390/fermentation12050250
Submission received: 2 April 2026 / Revised: 18 May 2026 / Accepted: 19 May 2026 / Published: 21 May 2026

Abstract

Microbial polyhydroxyalkanoates (PHAs) are biodegradable biopolymers that are gaining traction as replacements for conventional petroleum-based plastics. In this study, sugar utilization, growth and polyhydroxybutyrate (PHB) and polyhdroxyvalerate (PHV) production in synthetic and real hydrolysates of Canola fines (SHCF, RHCF) by Gordonia lacunae BS2T were evaluated: (i) in SHCF under different C:N ratios and O2 availability, and (ii) in SHCF and RHCF (50% and 100%) under shaking v/s static conditions with limited or non-limited O2. The bacterium was able to utilize glucose, cellobiose, arabinose, and xylose. Athough O2 limitation reduced growth, higher measured concentrations of 3-hydroxyvalerate (3HV) were achieved under O2 limitation, translating into slightly higher 3-hydroxybutyrate (3HB)+3HV yields (15.4 ± 2.36%wt.wt.) than under non-O2 limited conditions (12.4 ± 2.26%wt.wt.). Notably, 50% RHCF was the most suitable medium for growth and PHB+PHV production, while 100% RHCF was the least suitable. The 3HV+3PV concentration (0.35 g/L), 3HV fraction (24%), and yield (15.4%wt.wt.) in 50% RHCF were highest under static, O2-limited conditions, corresponding with negligible sugar utilization (1.6 mg/day.100 mL−1 glucose) and suggesting alternative metabolic pathways using other substrates in the RHCF for growth. Nuclear magnetic resonance results indicated that Gordonia lacunae BS2T produces a desirable co-polymer (PHBV), paving the way for ongoing research using this bacterium.

1. Introduction

Polyhydroxyalkanotes (PHAs) are environmentally friendly alternatives to conventional plastics that are gaining traction for a variety of applications, including agricultural films, food packaging, cosmetics, and medical devices [1,2,3].
Polyhydroxyalkanoate synthases (pha) encoded by phaA, phaB, and phaC genes are responsible for catalyzing bacterial synthesis of PHA using fatty acids or fermentable sugars as primary substrates [1,4,5]. The biopolymer products are classified according to the number of carbon (C) atoms in the hydroxyalkanoic monomers as short-chain length (SCL, 3–5 C), medium-chain length (MCL, 6–14 C), or long-chain length (LCL, >14 C) [6]. The SCL biopolymer, polyhydroxybutyrate (PHB), and, to a lesser extent, polyhydroxyvalerate (PHV), which consist of 3-hydroxybutyrate (3HB) and 3-hydroxyvalerate (3HV) monomers, respectively, are commonly produced by microorganisms in homo- and hetero-polymeric forms as intracellular storage products [1,6]. Co-polymers such as poly(3HB-co-3HV) (PHBV) or 3HB and (R)-3-hydroxy-hexanoate (3HHx), P(3HB-co-3HHx) have superior structural properties when compared with homo-polymeric PHB [1,6].
Members of the large group of bacteria from the Class Actinomycetes, commonly referred to as “actinobacteria”, harbour sizeable genomes that enable some genera to produce various primary and secondary metabolites, including PHAs [7,8]. Many studies have been conducted on synthesis of PHAs by a range of Streptomyces and Rhodococcus species, but detailed studies of PHA production by other actinobacterial genera are limited [9]. Members of the genus Gordonia are robust actinobacteria that have been used as recombinant vectors for PHA production and a variety of other industrial applications [10,11]. To the best of our knowledge, PHA production by Gordonia spp. is rare, only being previously described in Gordonia amarae [12] and more recently in Gordonia lacunae BS2T and 2 other species [9]. In the latter study, G. lacunae BS2T proved to be the most promising candidate for PHB production from synthetic hydrolysates of Canola fines (SHCF). The genome of this strain contains three phaA genes and single phaB and phaC genes that are not clustered together in a defined operon [9].
With the move towards a circular bioeconomy, many agricultural by-products previously classified as waste are now perceived as resources. Canola fines (also referred to as straw) are the low-value lignocellulosic debris removed from Canola oilseeds prior to crushing [13]. In South Africa, harvested Canola crops are stored in silos and processed throughout the year at large edible oilseed processing facilities [13]. The non-seasonal, high-volume, and geographically concentrated nature of Canola fines makes it a promising candidate for valorization. A hypothesis that hydrolysates may contain sufficient sugars and nutrients for growth of PHA-producing actinobacteria has already been validated [9,14]. It was also found that Gordonia lacunae BS2T and Gordonia sp. BG1.3 could utilize sugars found in SHCF to produce PHB [9,14].
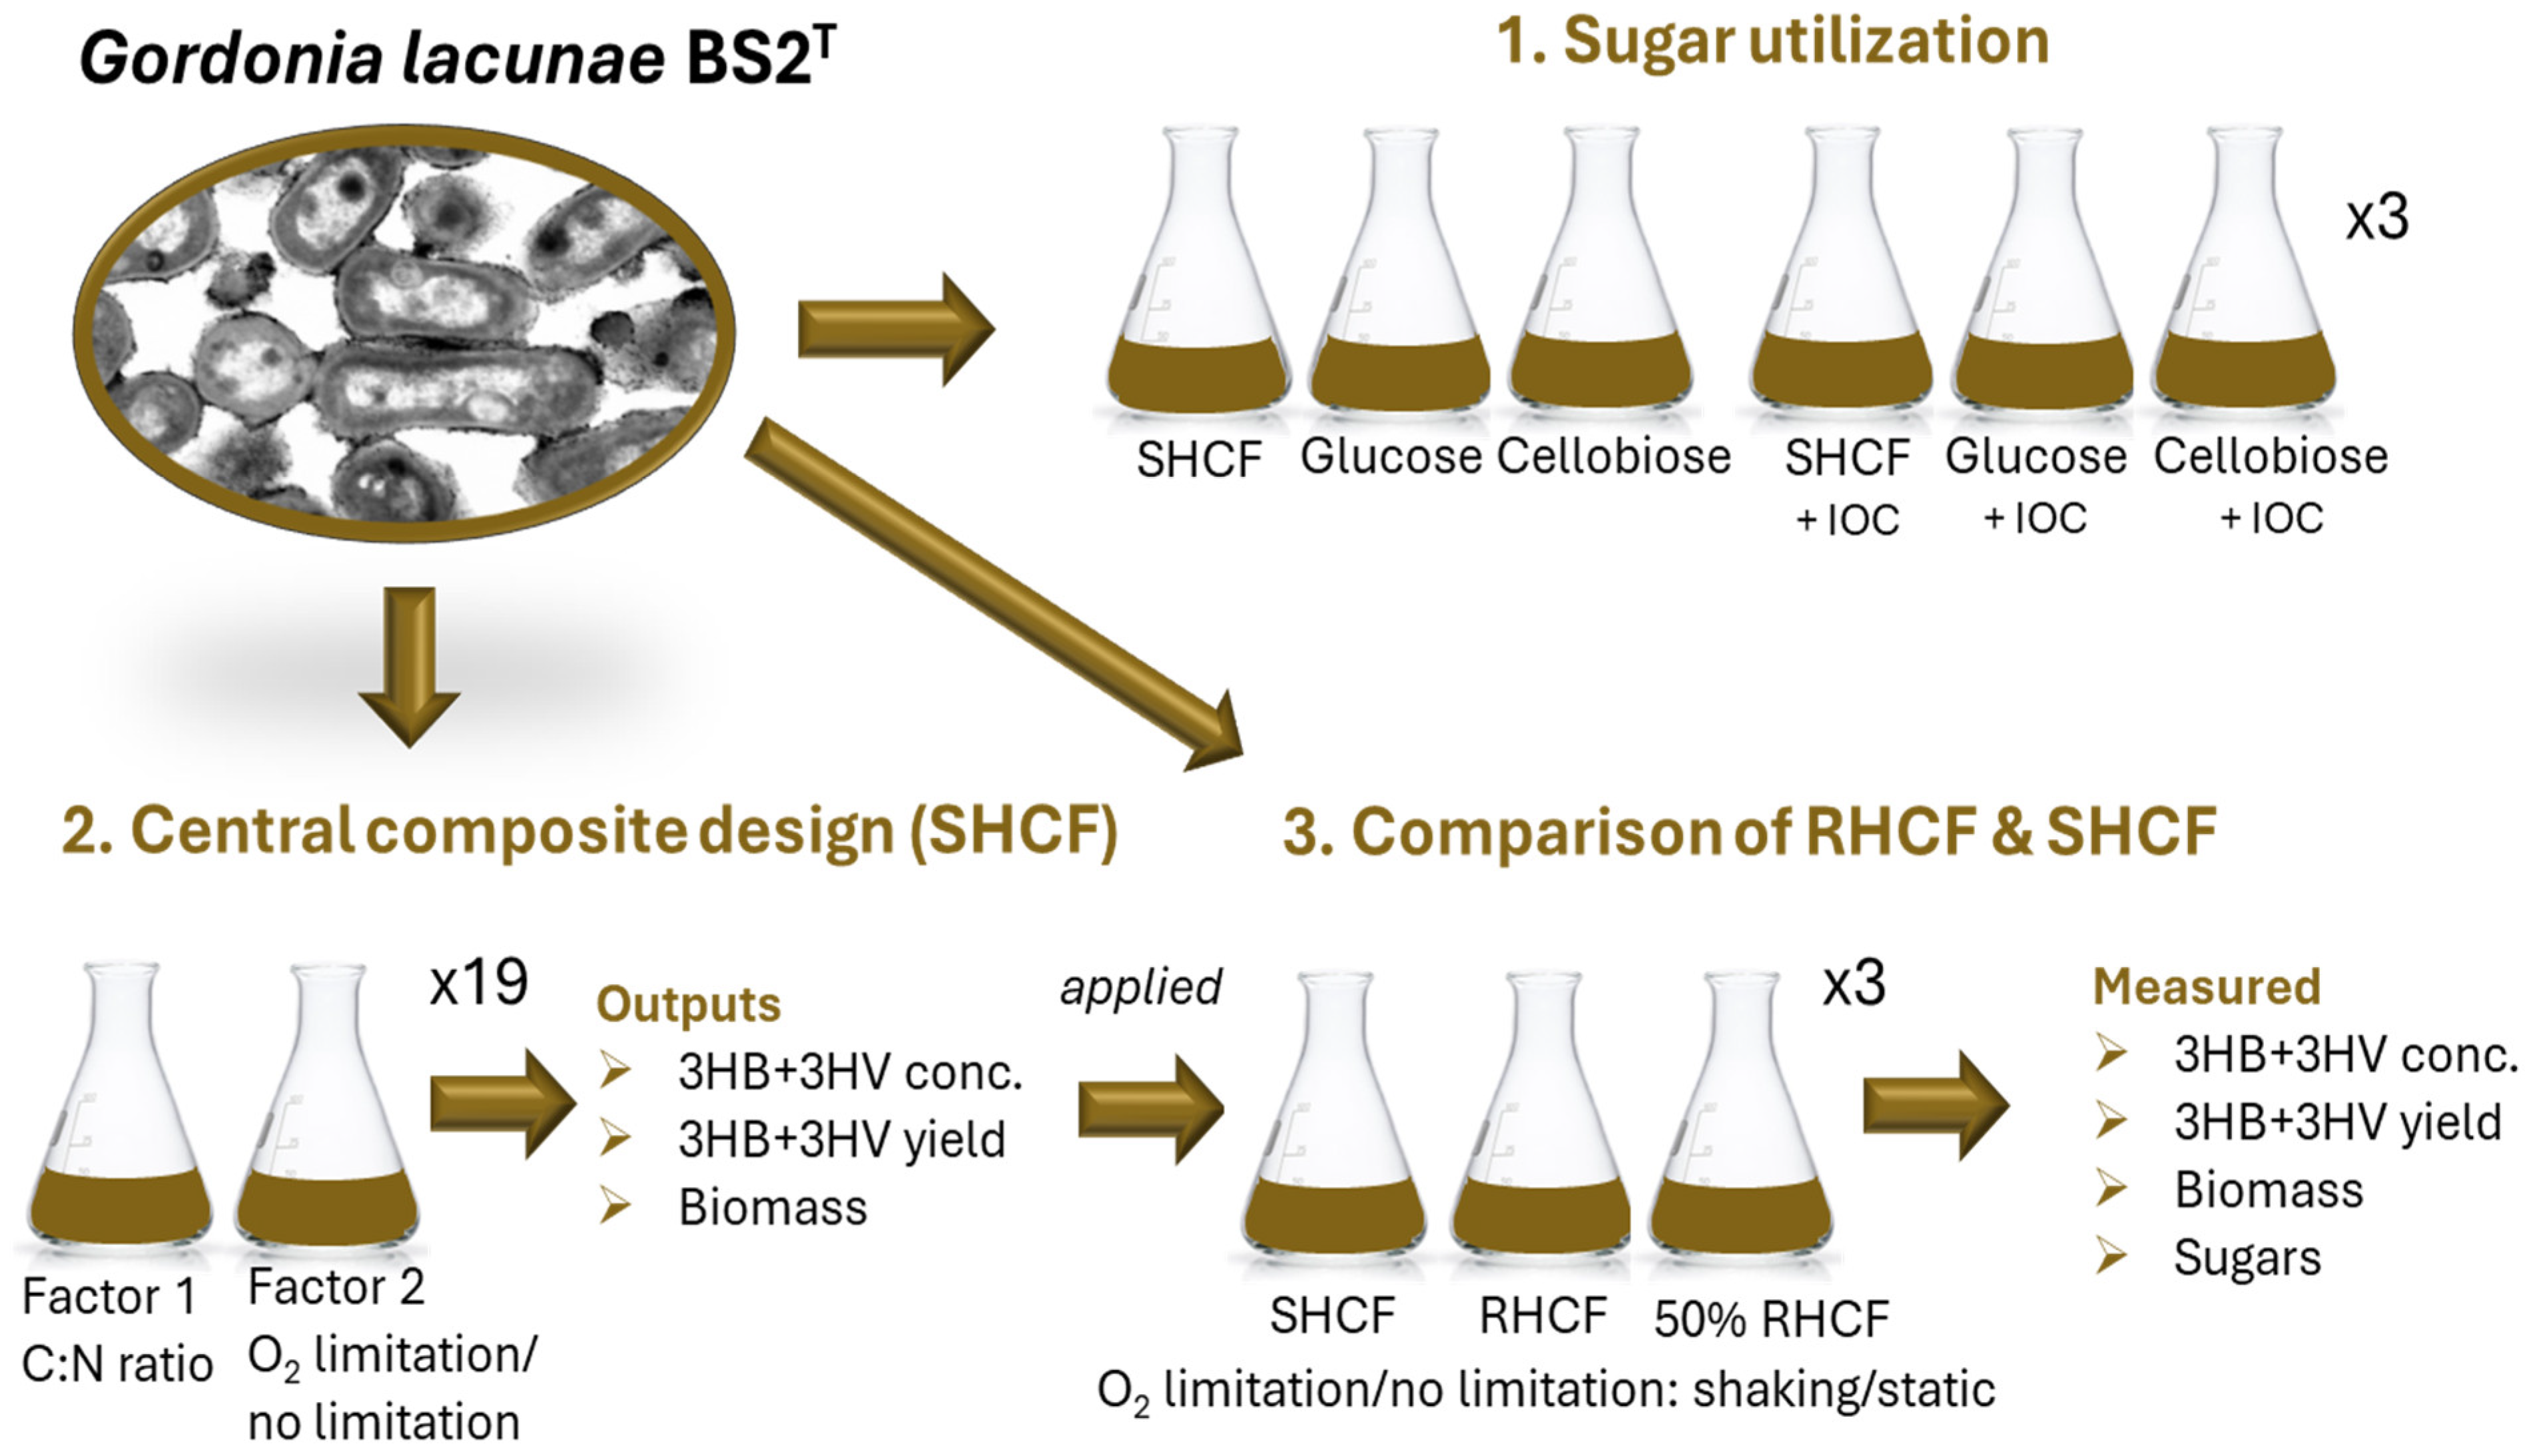
To further advance the technology, this study focused on: (i) determining sugar utilization rates in SHCF by G. lacunae BS2T, (ii) increasing the production of PHBV by G. lacunae BS2T in SHCF by optimizing the C to nitrogen ratio (C:N) ratio and oxygen (O2) supply, and (iii) comparing growth, sugar utilization, and the quality and quantity of PHBV produced by G. lacunae BS2T in SHCF and diluted (50%, v/v) and undiluted (100%) RHCF under different growth conditions (Figure 1).

2. Materials and Methods

2.1. Gordonia lacunae BS2T Experimental Cultures

The experiments described in this Section were conducted using an in-house strain of G. lacunae BS2T (culture collection strain assignments: DSM 45085T, JCM 14873T, NRRL B-24551T). The study consisted of three separate experiments: (i) utilization of sugars found in RHCF with and without inorganic nutrients, (ii) optimization of O2 (limited/non-limited) and C:N ratio for PHB and PHV production from SHCF, and (iii) comparison of PHB and PHV production in RHCF and SHCF under shaking and static conditions with limited and non-limited O2 (Figure 1).
Figure 1. Schematic of the experimental outline showing the relationships between the three main experimental protocols with G. lacunae BS2T, namely: (1) sugar utilization with different carbon sources, (2) a central composite design experiment used to assess the effects of carbon to nitrogen ratio and oxygen availability on polyhydroxybutyrate and polyhydroxyvalerate yields in synthetic hydrolysates of Canola fines, and (3) a replicated experiment to compare growth and polyhydroxybutyrate and polyhydroxyvalerate yields with different Canola fine substrates (real and synthetic) under different growth conditions. SHCF = synthetic hydrolysate of Canola fines, RHCF = real hydrolysate of Canola fines, IOC = inorganic chemicals.
Fermentation 12 00250 g001

2.1.1. Sugar Utilization and Inorganic Chemical Requirements with Defined Substrates

Utilization of sugars that were previously found in significant concentrations in RHCF were determined by measuring their concentrations in culture supernatant fluid (SNF) by high-performance liquid chromatography (HPLC) (Section 2.4.2). In addition, the requirement for inorganic chemicals (IOC) found in RHCF was determined by adding IOC in concentrations mimicking those previously measured in RHCF (Section 2.1.1).
The pre-culture was prepared by aseptically emulsifying 4–5 bacterial colonies of G. lacunae BS2T grown on nutrient agar (Liofilchem®, Roseto degli Abruzzi, Italy) at 30 °C for 3 days in 150 mL of sterile nutrient broth (Liofilchem) in 250 mL flasks and incubating in a Bioase (Jinan, China) BJPX-2102C shaking incubator at 30 °C at 160 revolutions per minute (rpm) for 3 days. The experiments were conducted in triplicate in sterilized 100 mL flasks containing 45 mL of substrate and 5 mL of pre-culture, which were incubated in shaking incubators (Bioase BJPX-2102C) at 30 °C at 160 rpm for 5 days. The flasks contained either: (i) glucose in the same concentration as the SHCF with and without IOC, (ii) cellobiose in the same concentration as the SHCF with and without IOC, and (iii) SHCF with and without IOC.
The composition of the SHCF solution was based on the sugar profile and inorganic composition of hydrolysates obtained from optimized conditions for sugar extraction from 5% (vol./vol.) Canola fines, namely steam-assisted extraction in 1.7% (v/v) sulfuric acid (H2SO4), were followed by enzyme hydrolysis [14]. The SHCF consisted of 900 mL of a sugar solution (10 g xylose, 6 g glucose, 4 g cellobiose, 2 g arabinose) and 100 mL of a stock solution of IOC (9.6 g K2CO3, 5.0 g CaCO3, 2.4 g MgSO4, 1.0 g NaNO3, 0.3 g K2HPO4, 0.06 g FeSO4 · 7H2O, and 0.01 g ZnC4H6O4, made up to in 1 L in distilled water) as previously described [9].

2.1.2. Optimization of Polyhydroxybutyrate Production in Synthetic Hydrolysates of Canola Fines

The effects of selected parameters on PHB and PHV production by G. lacunae BS2T were determined using a custom central composite design (CCD) experiment with one numerical variable: C:N ratio, and one categorical factor: O2 limitation/non-limitation. The PHB and PHV concentrations were measured after conversion to monomeric forms (3HB and 3HV, respectively). The experimental protocol was determined using Design Expert (Stat-Ease, Minneapolis, MN, USA) software version 23.1, which generated 19 experimental runs (Table 1).
The pre-culture was prepared as described in Section 2.1.1. The customized CCD experiments were conducted in sterilized 100 mL flasks containing 45 mL of SHCF (as described in Section 2.1.1) and 5 mL of pre-culture, which were incubated in shaking incubators (Bioase BJPX-2102C) at 30 °C at 160 rpm for 5 days. The C:N ratio was adjusted by adding urea (CH4N2O) (Merck, Darmstadt, Germany) to the flasks in appropriate amounts from a stock solution of 36.0 g/L. The O2 limited conditions were created by adding one AnaeroPack®-Anaero sachet (Mitsubishi Gas Chemical company, Tokyo, Japan) to a 5 L air-tight container (Mitsubishi Gas Chemical company), which contained the designated flasks.

2.1.3. Comparison of Sugar Utilization and Polyhydroxybutyrate and Polyhydroxyvalerate Production in Real and Synthetic Hydrolysates of Canola Fines

Real hydrolysates of Canola fines were made using steam-assisted acid hydrolysis with 1.7 (%vol.vol.) H2SO4, for 24 h at 55 °C, followed by enzyme hydrolysis with cellulases after adjusting the pH to 6.0–7.0 as described in detail previously [14]. The hydrolysates were pre-filtered using coffee filters, followed by filtration using Whatman #1 filter papers.
The experiments were conducted in triplicate in 36 500 mL flasks containing 200 mL of either: (i) 100% SHCF, (ii) 100% RHCF, or (iii) 50% RHCF as substrates, all under shaking or static conditions with limited or non-limited O2 as described in Section 2.1.2. The pre-culture was prepared as previously (Section 2.1.1), and 10 mL were added aseptically to 190 mL of sterile substrate.
Prior to incubation (t = day 0), 50 mL of the contents of each flask were extracted to establish baseline values of total solids (TS) (Section 2.2) and sugars (Section 2.4.1). Flasks were incubated in a shaking incubator (Bioase BJPX-2102C) at 30 °C at 160 rpm for 5 days. At the end of the experimental period (t = day 5), samples were taken for measurement of TS, sugars, and 3HB and 3HV quantification (Section 2.4). Data obtained from the triplicates were used crosswise in paired t-tests (2 sample for means) in Microsoft Excel (version 2603) to determine whether either of the factors (O2 limitation/non-limitation, shaking/static) had significant effects on 3PV and 3HV concentrations in each of the three substrates (SHCF, 100% and 50% RHCF), and, secondly, whether there were significant differences in the 3PV and 3HV concentrations between SHCF, 100% RHCF, and 50% RHCF under each of the four growth conditions (O2 limitation/shaking, O2 limitation/static, O2 non-limitation/shaking, O2 non-limitation/static).

2.2. Measurement of Total Solids

Bacterial growth was measured using TS as a proxy to quantify biomass as previously described [9]. Briefly, after discarding the SNF, centrifugates from 35–50 mL of cultures were dried at 70 °C for 36 h in polypropylene tubes. The TS was determined by deducting the weights of the empty tubes from the weights of the tubes containing the dried solids. Results were converted into grams dry weight per L (gdwt./L) or TS/L.

2.3. Extraction of Polyhydroxyalkanoates

Extraction of PHA from centrifuged pellets of 10 mL of culture medium in glass tubes was conducted using a previously described chloroform extraction method [9]. Briefly, pellets were lysed in 2.5 mL of 12.5 (%wt.vol.) sodium hypochlorite (NaOCl), then washed in 5 mL of distilled water (dH2O), 2.5 mL of absolute ethanol, and 2.5 mL of acetone. After drying, the contents were extracted into 5 mL of chloroform (CHCl3) at 100 °C with regular vortexing until the contents were homogenous, and the CHCl3 was then evaporated off in a fume hood.

2.4. Analytical Procedures

2.4.1. Determination of Sugar Concentrations

Sugars in the fermentates were identified and quantified using HPLC with a Phenomenex (Torrance, CA, USA) Rezex RHM monosaccharide Hþ (8% cross-linkage) column and an Agilent Technologies (Santa Clara, CA, USA) 1100 series instrument as previously described [15].

2.4.2. Quantitative and Qualitative Analysis of Polyhydroxyalkanoates

  • Spectrophotometry
The 3HB concentrations in the dried extracts were determined using a modification of the traditional spectroscopic crotonic acid method [16] as previously described [9]. The method involves converting 3HB to crotonic acid using heated concentrated (conc.) H2SO4 and measuring the crotonic acid concentration at absorbances between 0.1 and 1.0 by comparing with a standard curve prepared from dilutions of PHB (Sigma-Aldrich, St. Louis, MO, USA cat. no. 363502) and H2SO4.
  • High-performance liquid chromatography
For the quantification of 3HB and 3HV, calibration curves were prepared with commercial PHBV containing 8 mol % PHV (Sigma-Aldrich, St. Louis, MO, USA). The PHB and PHV in the samples and standards were digested into crotonic acid and 2-pentanoic acid, respectively, in 1 mL of conc. H2SO4 at 100 °C for 1 h. After cooling to room temperature, each sample or standard was diluted with 4 mL of 0.014 N H2SO4. The solutions were then filtered through 0.45 µm polyvinylidene fluoride (PVDF) membrane filters prior to HPLC analysis for crotonic acid and 2-pentanoic acid. The analyses were conducted using an Agilent (Santa Clara, CA, USA) 1260 HPLC instrument using Bio-Rad (Hercules, CA, USA) Aminex HPX-87H (300 mm × 7.8 mm I.D., Bio-Rad), an ion-exclusion column at 40 °C for separation with 0.014 N H2SO4 as a mobile phase at a flow rate of 0.6 mL/min. The chromatograms were recorded at 210 nm using a UV detector.
  • Nuclear magnetic resonance
The 1H nuclear magnetic resonance (NMR) spectrum was recorded on a Bruker (Ettlingen, Germany) Avance 400 MHz instrument using a mixture of methanol and deuterated chloroform (CDCl3) as the solvent.

2.4.3. Characterization of Real Hydrolysates of Canola Fines

The total and soluble protein concentrations were performed on whole and filtered hydrolysates using the PierceTM bicinchoninic acid (BCA) protein assay kit (Thermo Scientific, Waltham, MA, USA) protein after extraction with the Compat-AbleTM Protein assay preparation reagent kit (Thermo Scientific), according to the manufacturer’s instructions.
The glucose, arabinose, cellobiose, and xylose concentrations were determined as described in Section 2.4.1. The total organic carbon (TOC), total nitrogen (TN), total phosphorus (TP), nitrate as N (NO32−-N), nitrite as N (NO22−-N), ammonia as N (NH3-N), and alkalinity were determined using a Merck (Darmstadt, Germany) Spectroquant Pharo instrument, as well as relevant Merck kits, standards, and controls as per the manufacturer’s instructions as previously described [17].

2.5. Genome Sequence Analysis

The genome sequence of G. lacunae BS2T (GenBank assembly number: GCA_002149015.1) was submitted to the Rapid Annotation using Subsystem Technology (RAST) server [18]. The amino acid fasta file was downloaded and submitted to BlastKOALA [19]. The KEGG Mapper Reconstruct Pathway function was used to determine the metabolic pathways and enzymes used by G. lacunae BS2T for the utilization of the sugars, arabinose, cellobiose, glucose, and xylose found in RHCF. In addition, the genome sequence was submitted to the dbCAN3 server for the prediction of the presence of carbohydrate active enzymes that may be involved in the utilization of the target sugars [20].

3. Results and Discussion

3.1. Utilization of Sugars in Defined Media by Gordonia lacunae BS2T

Gordonia lacunae BS2T failed to grow in cultures without IOC after 5 days of incubation, indicating that the IOC solution based on the composition of RHCF contained essential growth nutrients. The isolate partially utilized all the sugars in the SHCF within 5 days, with arabinose being utilized at the lowest rate (Table 2). It was previously hypothesized that measurement of glucose utilization by G. lacunae BS2T in SHCF may be confounded by the fact that cellobiose is hydrolyzed to glucose, thereby contributing to the total amount of glucose in the cultures at any given time. This hypothesis was investigated by assessing the utilization of glucose and cellobiose separately (glucose-only and cellobiose-only cultures) and comparing the results with those from SHCF cultures (Table 2). It was found that the cellobiose utilization rates were similar in the flasks containing SHCF and those containing only cellobiose as a source of carbohydrate, while the glucose utilization rate was notably lower in SHCF than in the glucose-only cultures, supporting the hypothesis. It is also possible that cellobiose is a preferential substrate over glucose for G. lacunae BS2T, as shown with Geobacillus stearothermophilus [21].
Table 2. Utilization of sugars in Canola fines hydrolysates by Gordonia lacunae BS2T.
Concentration
(g/L)
Utilization Rate *
(mg/day.100 mL−1)
Glucose6.0654
Glucose in SHCF6.0222
Cellobiose4.0530
Cellobiose in SHCF4.0434
Xylose in SHCF10.0262
Arabinose in SHCF2.021.6
Total in SHCF22560
* 50 mL medium, SHCF = synthetic hydrolysates of canola fines.
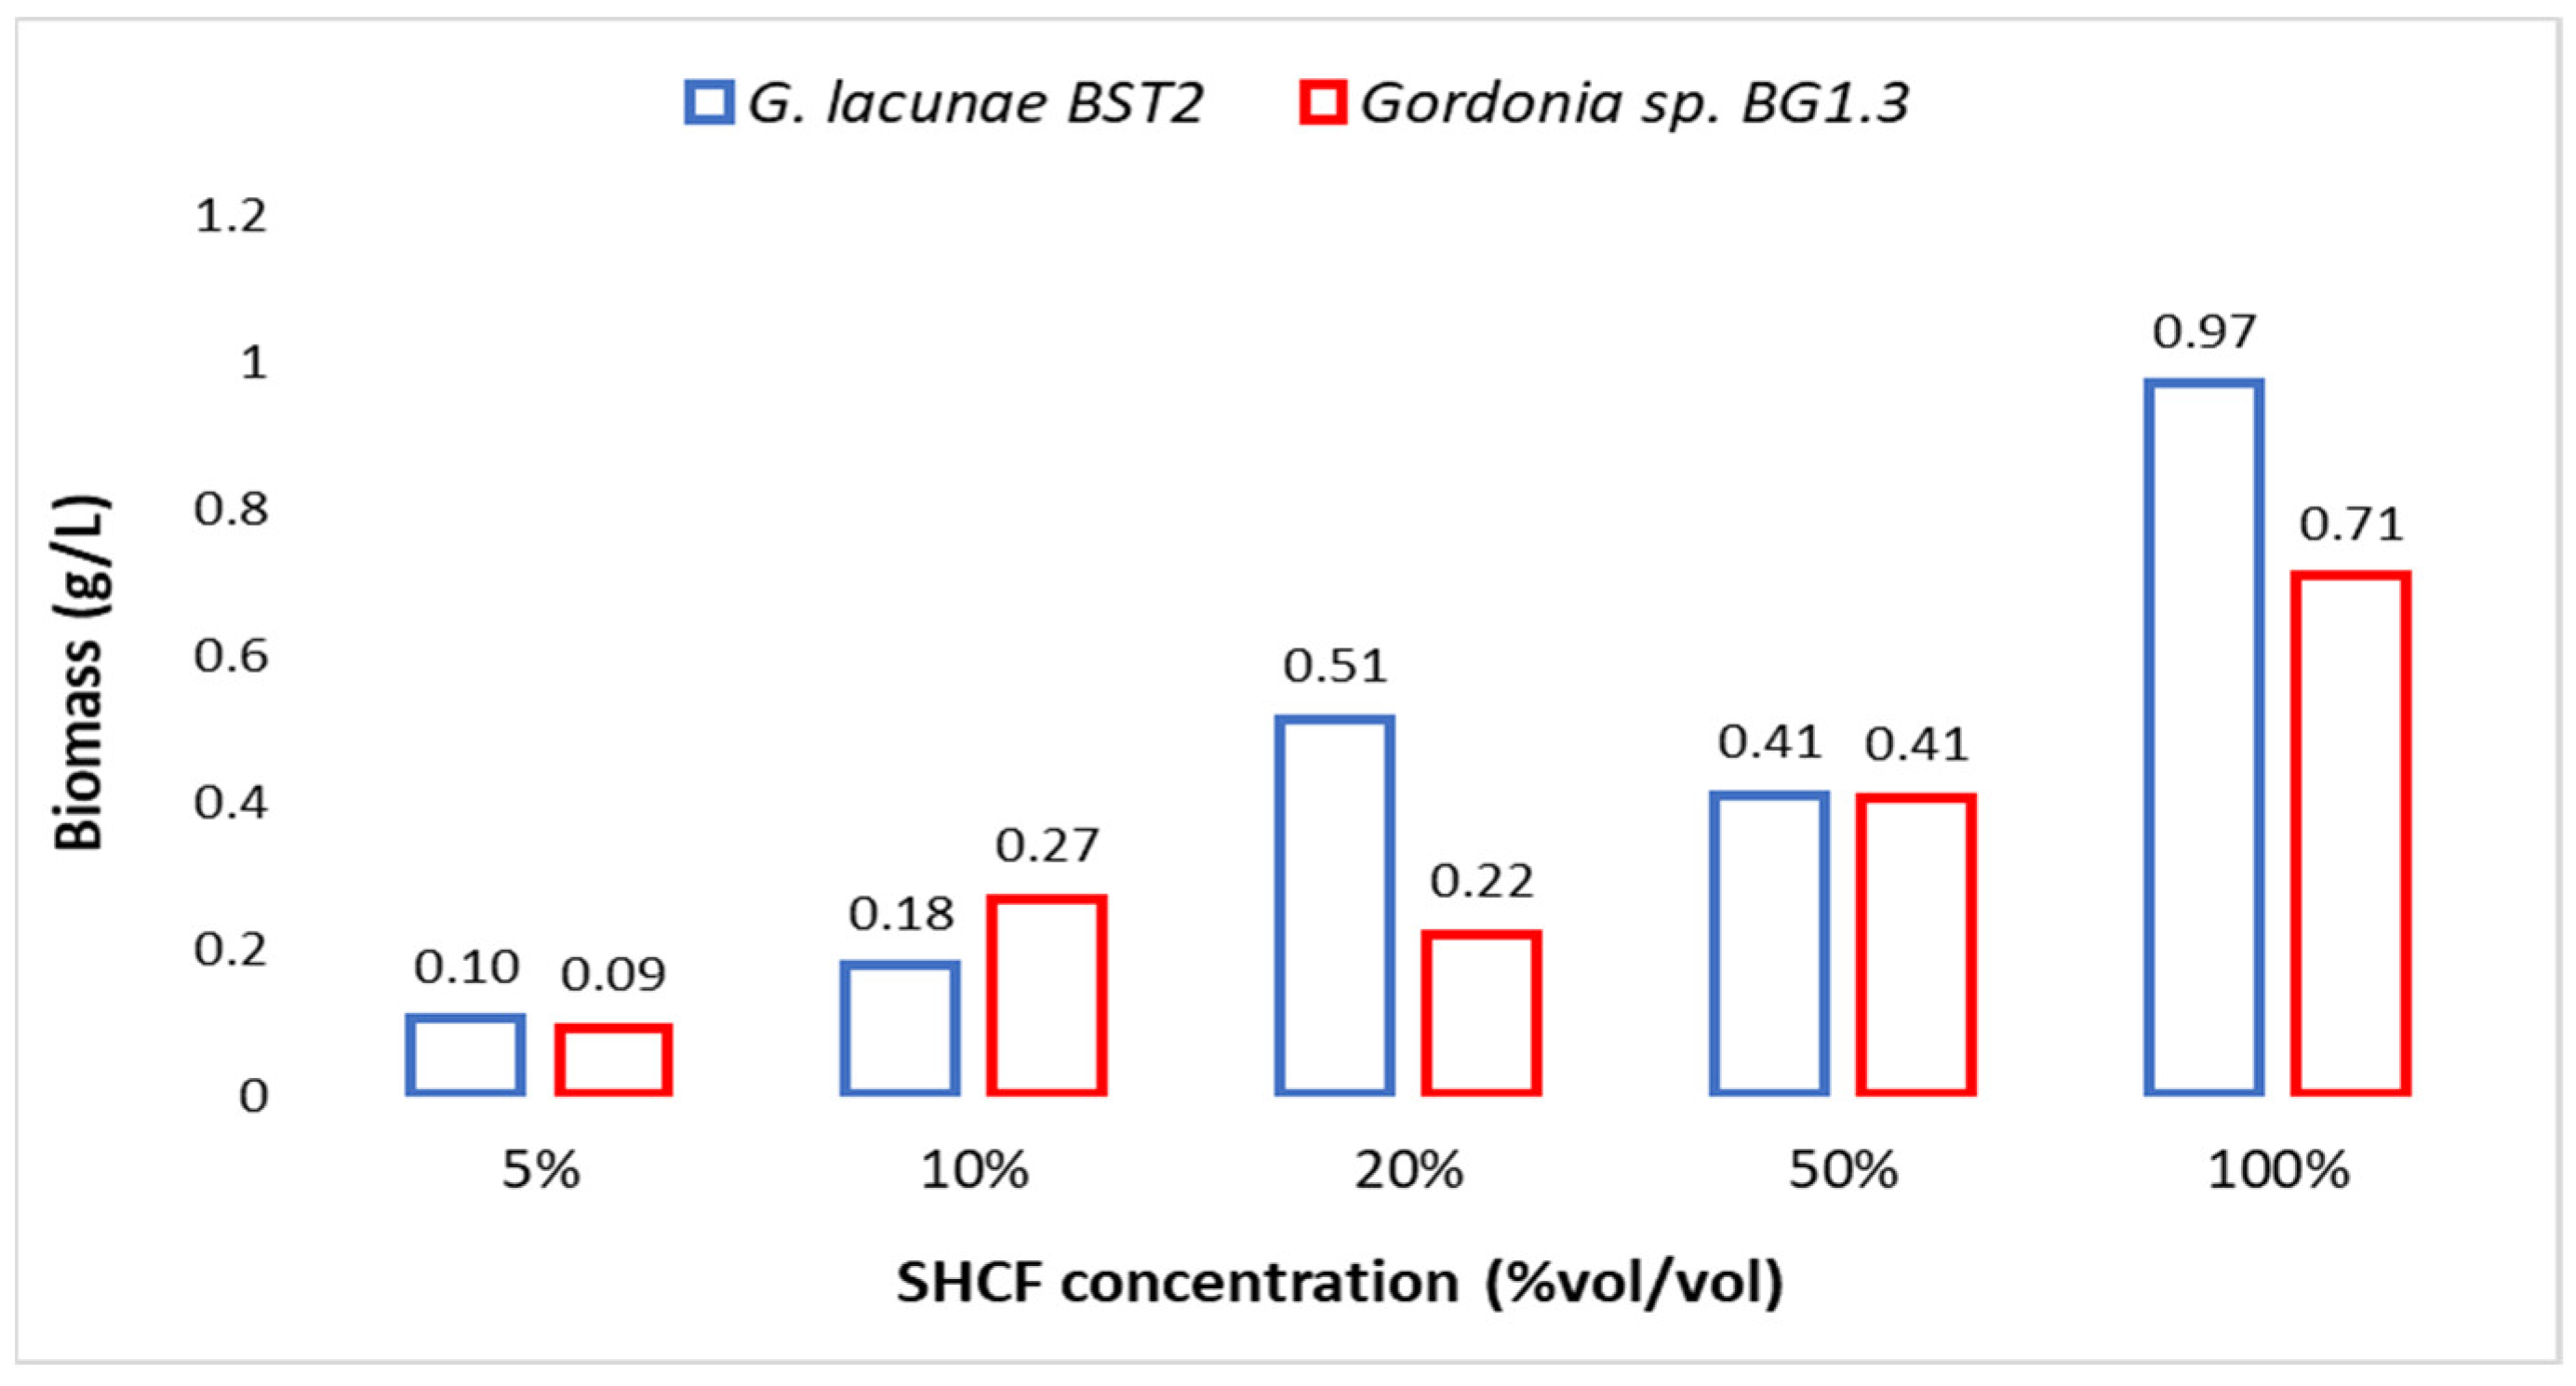
At the end of the experiment, residual sugars were present, suggesting that Canola fines could be diluted at an industrial scale, thereby saving on the financial and environmental costs of substrate production. However, dilution of sugars also leads to dilution of essential macro- and micro-nutrients, which could negatively affect microbial growth. Indeed, the high C:N ratio of the SHCF may have been a primary reason for incomplete sugar utilization. Preliminary studies with G. lacunae BS2T and Gordonia sp. BG1.3 confirmed this hypothesis as higher amounts of biomass were obtained in undiluted cultures (Appendix A Figure A1). To test this further, additional studies were conducted with both diluted (50%) and undiluted RHCF (Section 3.3).
Genome sequence analysis using KEGG Mapper Reconstruction detected 256 possible pathways, including 15 carbohydrate metabolism pathways. The presence of specific functional genes provides an indication whether G. lacunae BS2T has the genetic potential to utilize cellobiose, glucose, xylose, and/or arabinose via previously elucidated degradation pathways. To be certain which pathways were involved, experimental validation using gene manipulation, proteomics, transcriptomics [22], and/or isotope labelling [23], or a combination thereof, is required, which was beyond the scope of this study at this point.
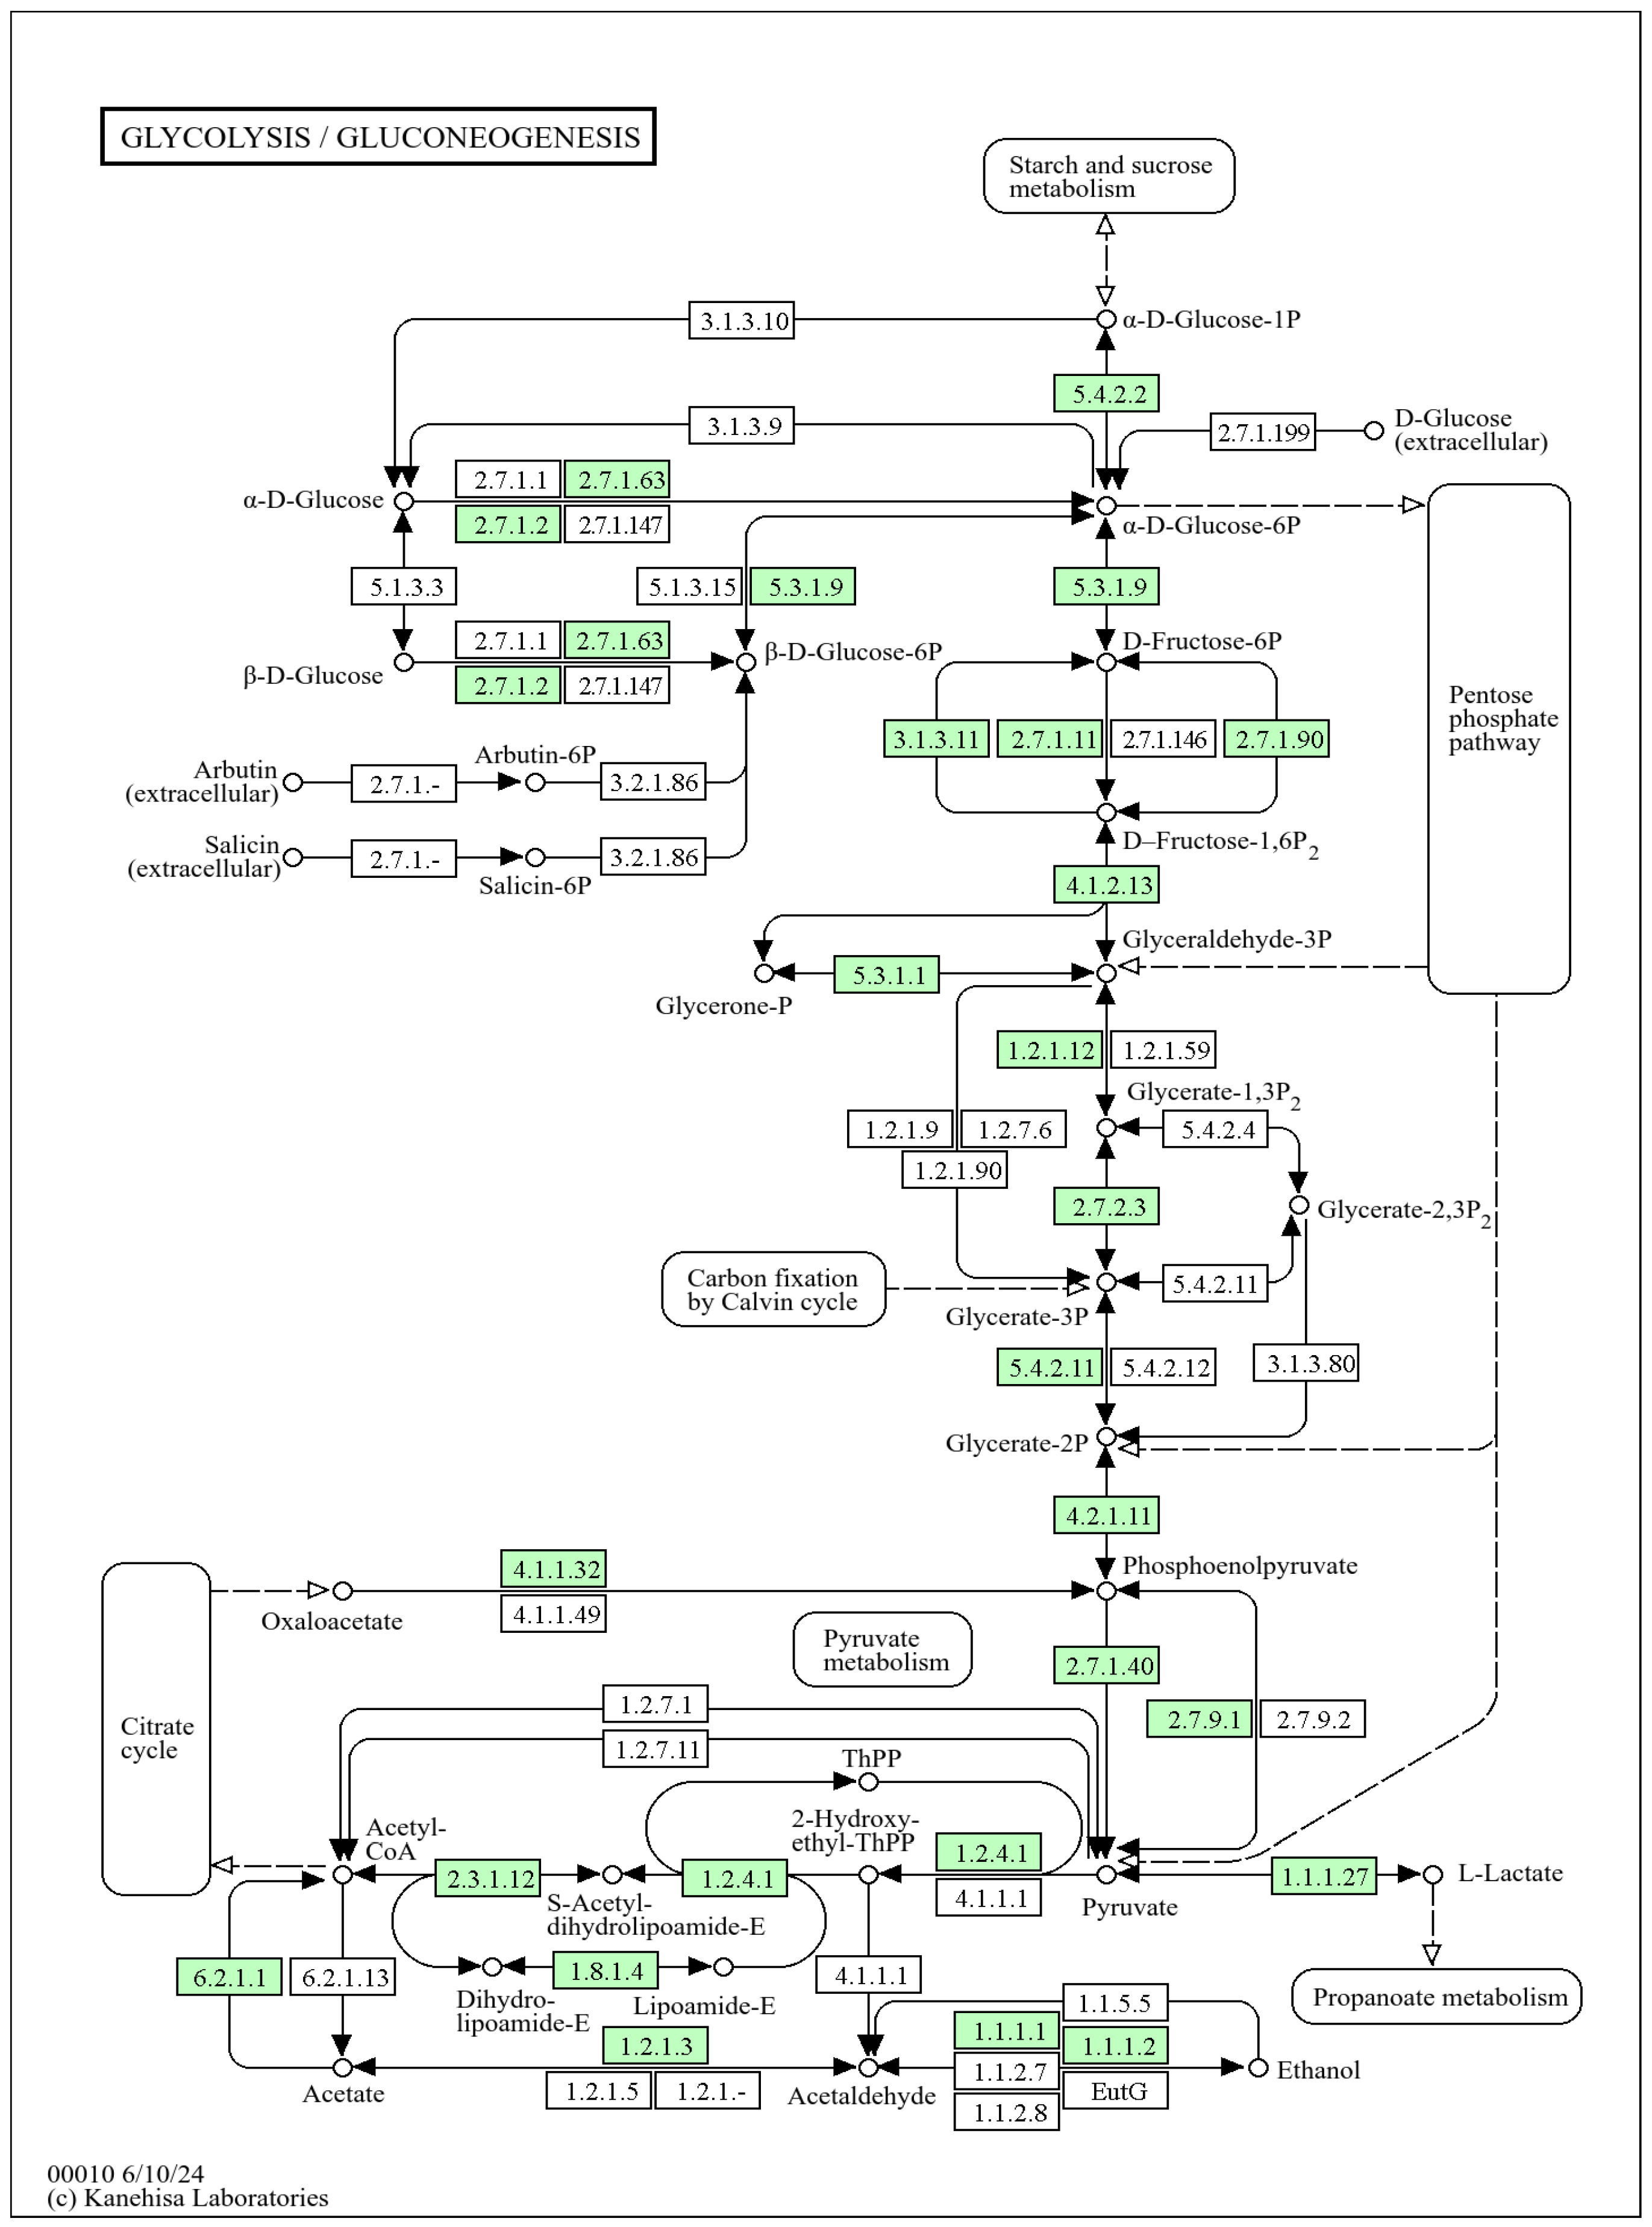
Results showed that, as with most bacteria, glucose is most likely to be utilized via the glycolysis/gluconeogenesis pathway for conversion into pyruvate for energy production (ATP and NADH) [24]. All the enzymes involved in this process (Embden-Meyerhof pathway; KEGG Module M0001) were predicted to be present in the genome of G. lacunae BS2T (Appendix C, Figure A2). Alternatively, the analysis showed that glucose utilization may occur via the pentose–phosphate pathway, starch and sucrose metabolism, or pyruvate metabolism (Appendix C, Figure A3). The ability to utilize multiple glucose degradation pathways supports the high glucose utilization rate of G. lacunae BS2T (Table 2).
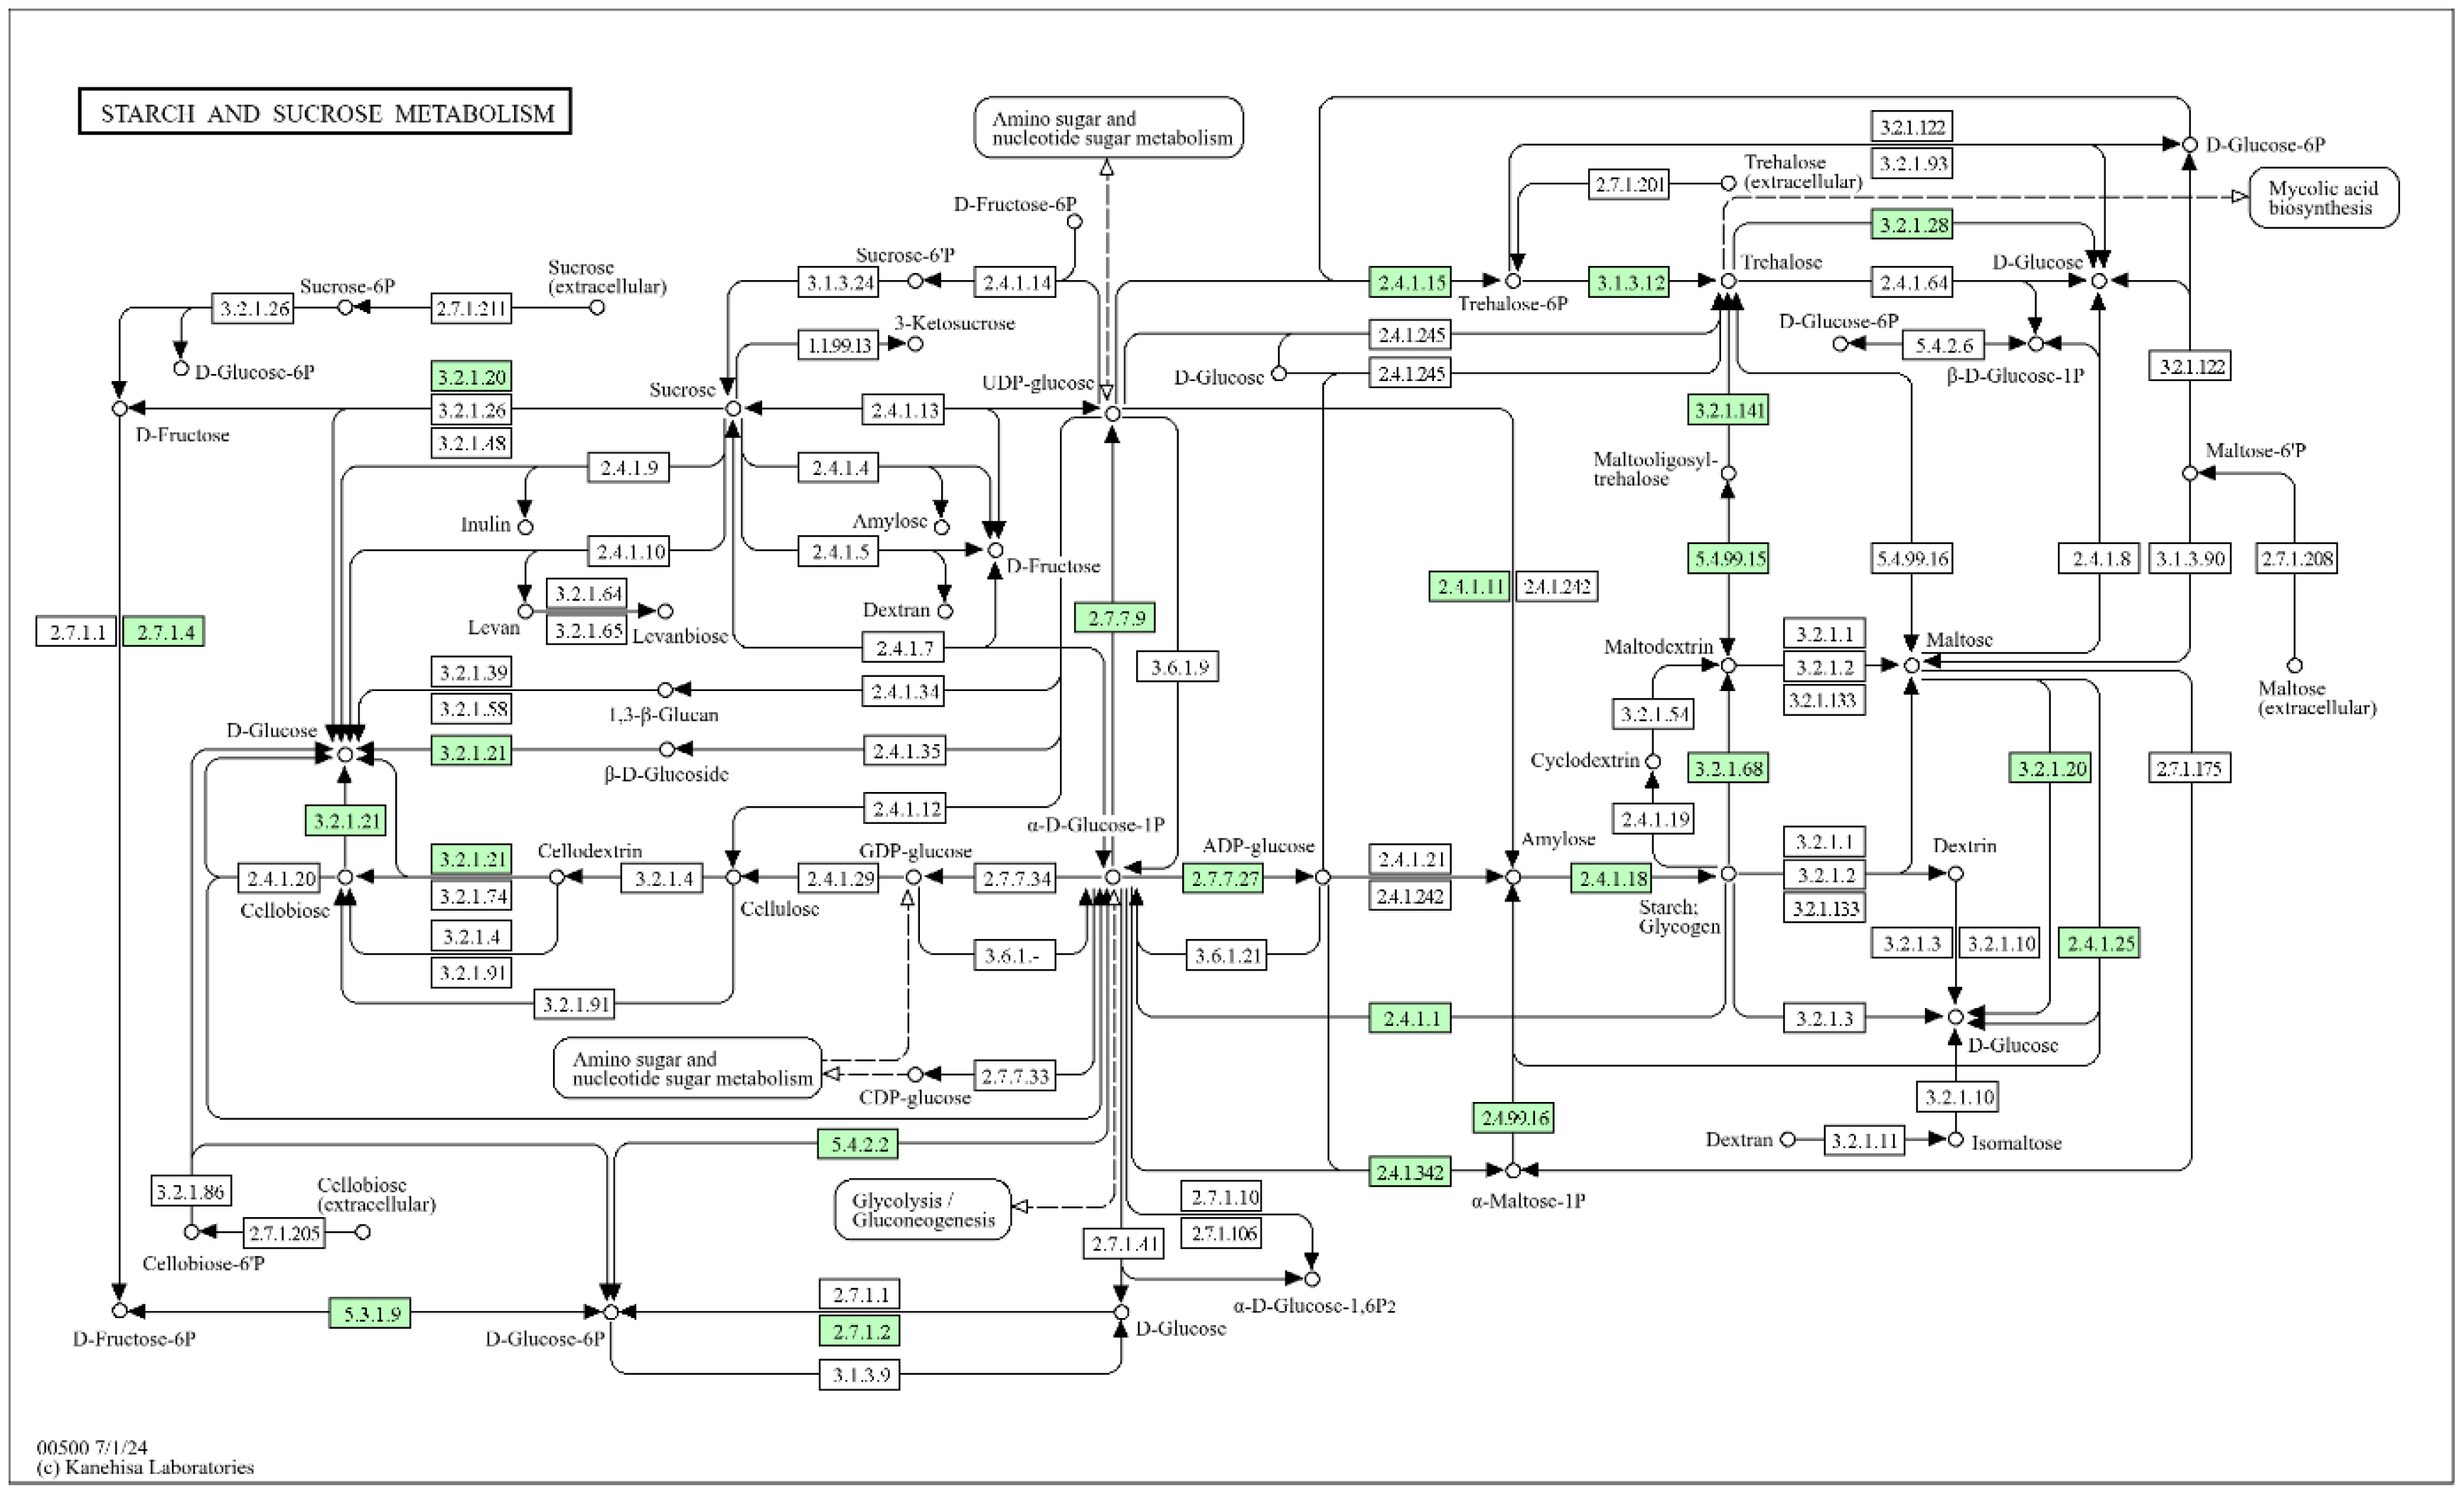
Cellobiose is primarily utilized via the KEGG metabolic pathway, starch, and sucrose metabolism. A β-glucosidase (EC 3.2.1.21) functions as a cellobiose glucohydrolase, resulting in the conversion of cellodextrin (originating from cellulose) into cellobiose, and cellobiose into glucose [25]. Two β-glucosidases were predicted to be present in the G. lacunae BS2T genome, bglB and bglx, both with the predicted ability to act as cellobiose glucohydrolases, supporting the potential of the strain to utilize cellobiose as a source of C and the hypothesis that glucose utilization was masked to some extent by conversion of cellobiose to glucose.
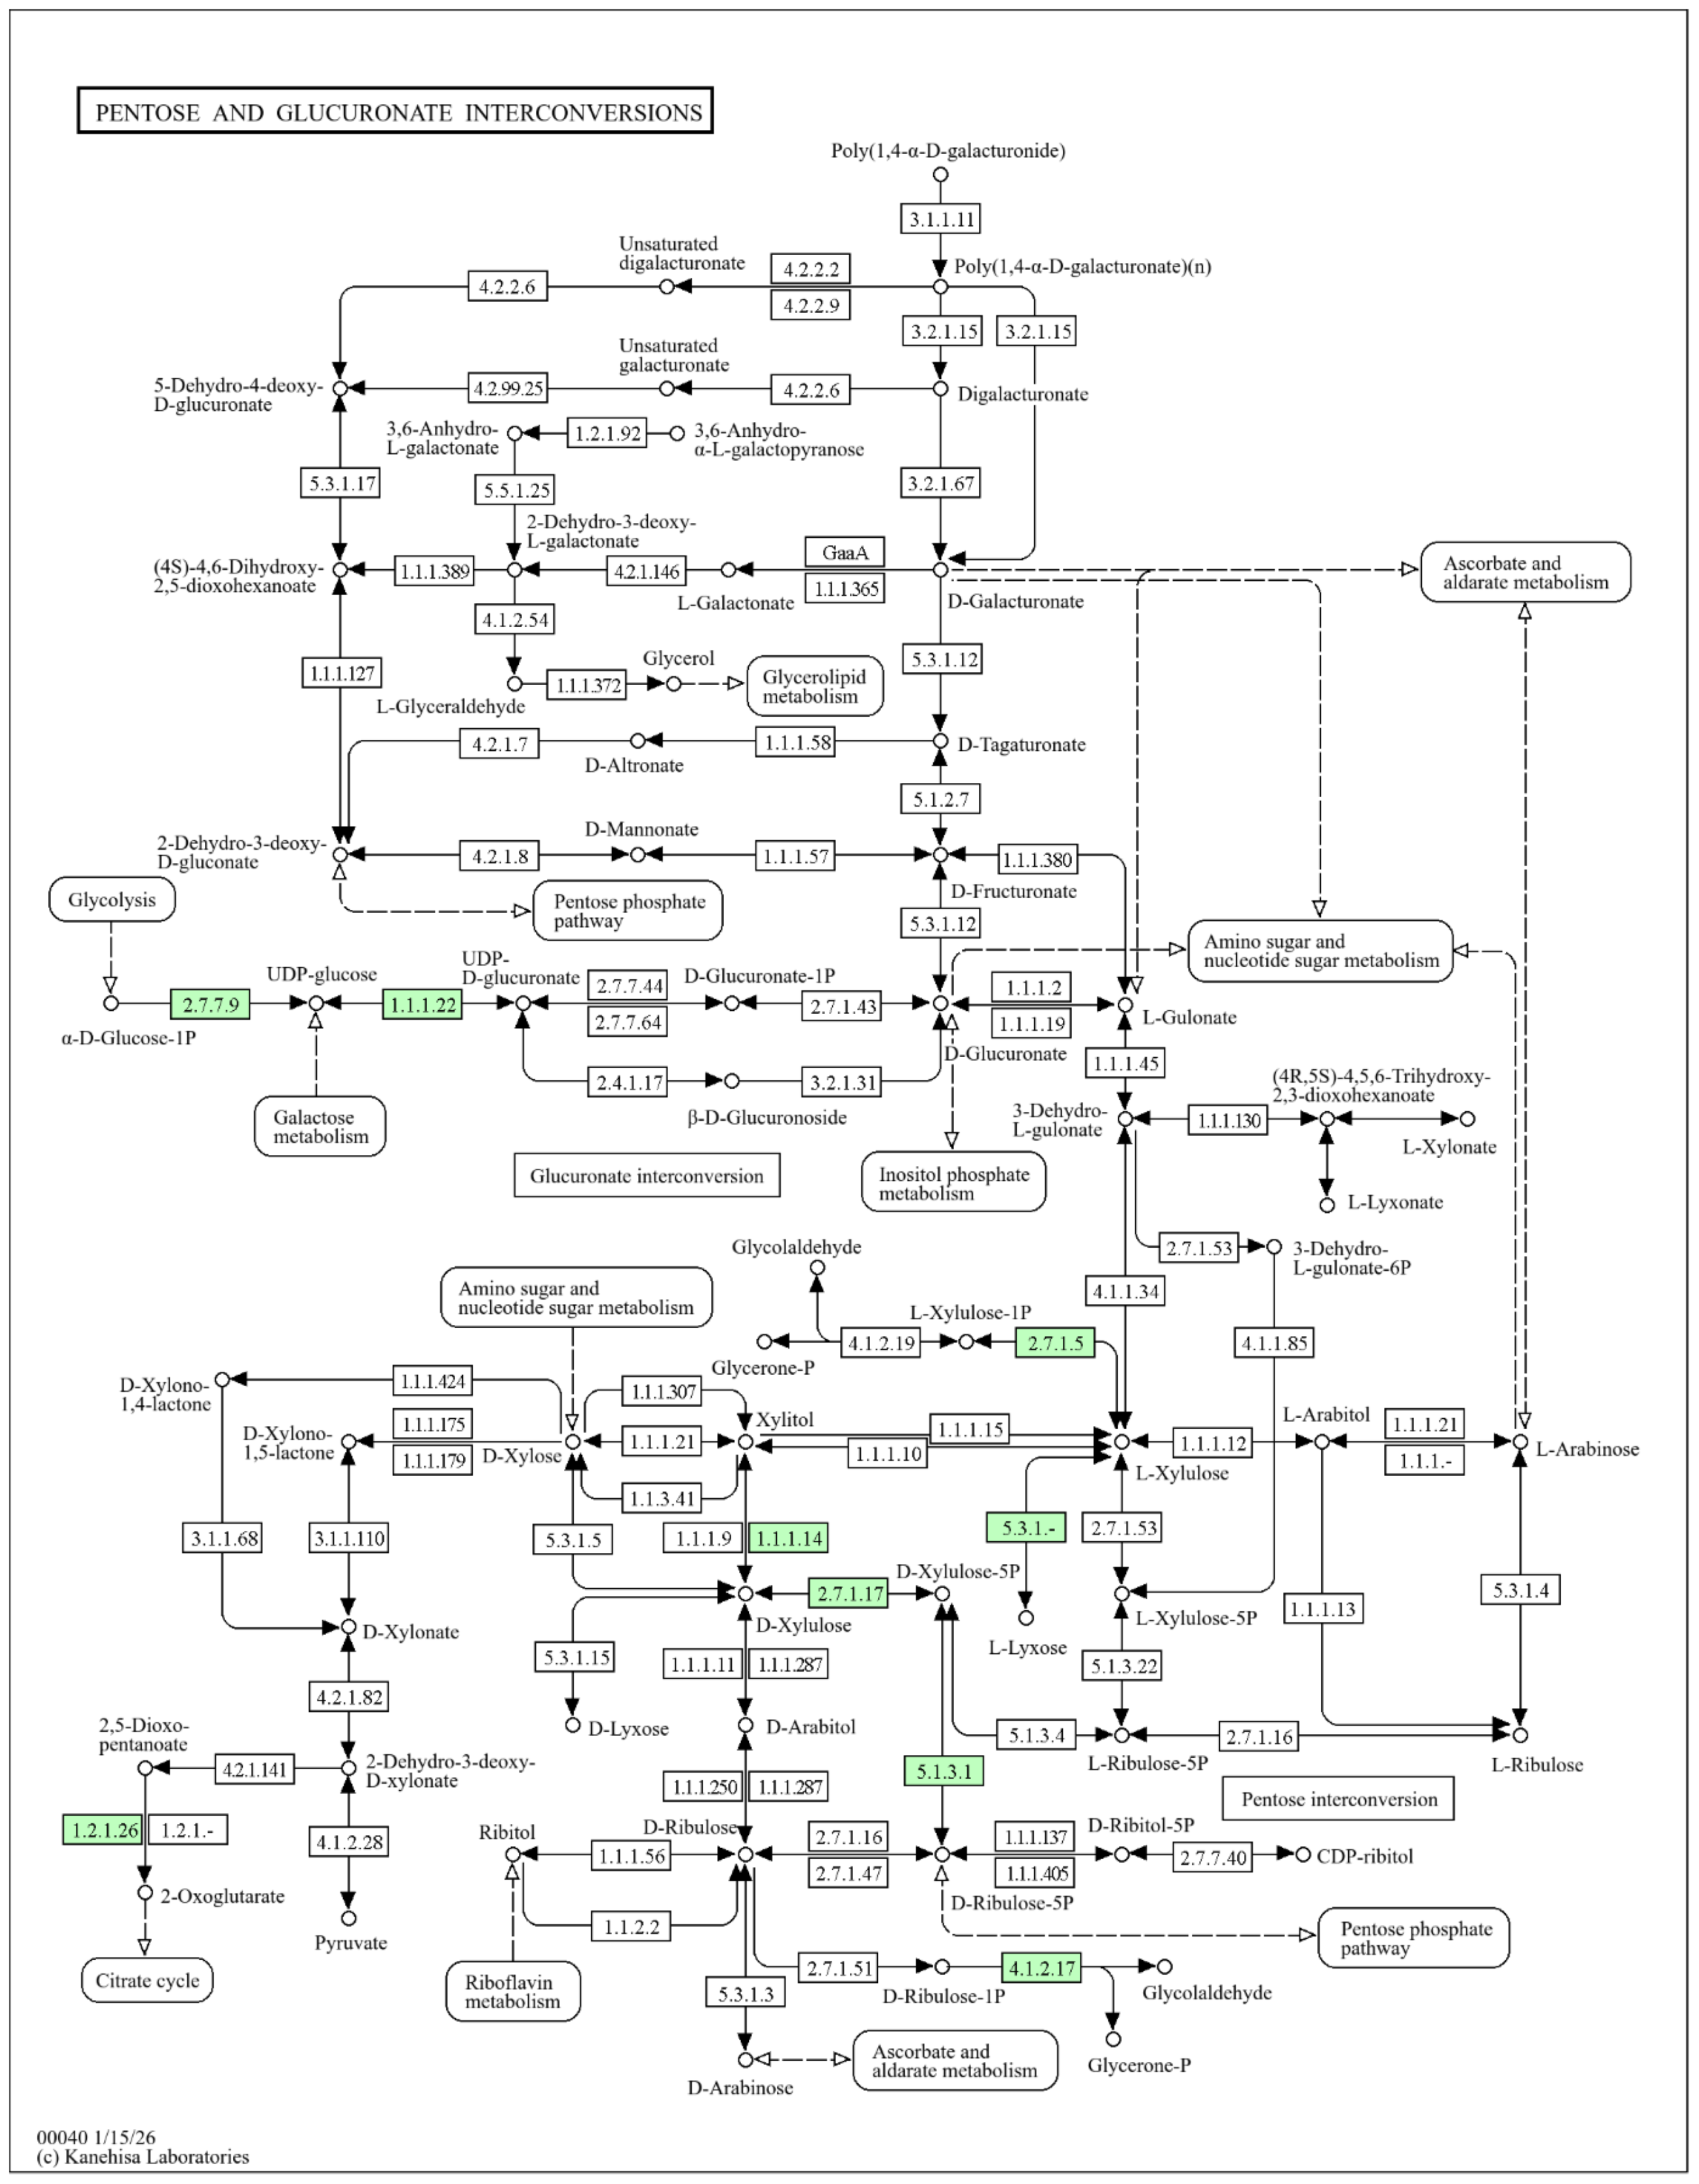
Xylose is primarily utilized in bacteria via the pentose and glucuronate interconversions pathway (KEGG map00040) (Appendix C, Figure A4). The conversion of xylose into D-xylulose allows for phosphorylation to xylulose-5-phosphate, which then enters the pentose–phosphate pathway, linking up with glycolysis and the tricarboxylic acid (TCA) cycle for energy production [26,27]. The enzyme required for the conversion of D-xylulose to xylulose-5-phosphate (EC 2.7.1.17) is predicted to be present in the G. lacunae BS2T genome, but not the enzyme required for the conversion of xylose to D-xylulose (EC 5.3.1.5) (also confirmed via dbCAN3). The enzymes involved in the alternative route to D-xylulose production via xylitol formation (D-xylose reductase, EC 1.1.1.307; aldehyde reductase, EC 1.1.1.21) are also not predicted to be present, while the enzyme involved in the conversion of xylitol to D-xylulose (EC 1.1.1.14) is predicted to be present. Although the CheckM genome quality tool predicted that the G. lacunae BS2T genome is 100% complete (90 contigs), there may still be genes that are incomplete and therefore were not annotated via RAST. Even the potential alternative enzymatic conversion via a xylose dehydrogenase, as reported in Caulobacter crescentus [26], could not be detected. Similarly, based on protein prediction by RAST and dbCAN3, none of the enzymes required for the utilization of arabinose are present in the G. lacunae BS2T genome. Besides potential incomplete sequence data, it is also possible that G. lacunae BS2T may have a unique metabolic pathway for the utilization of xylose and arabinose.

3.2. Effects of Carbon to Nitrogen Ratio and Oxygen Availability on Growth and Polyhydroxyalkanoate Production by Gordonia lacunae BS2T

The capex and processing costs (energy and chemicals) affect the financial viability of PHA production from waste substrates. In the case of lignocelluosic waste, such as RHCF, pre-treatment to obtain hydrolysates can already be a cost bottleneck for downstream production of value-added products such as biofuels and PHA [28,29]. The major objective of this study was to ascertain whether RHCF may be a suitable substrate for PHA production from G. lacunae BS2T with minimal energy and chemical manipulations.
The most important factors affecting microbial PHA production are the temperature, the source of C, and the amount of available O2, nitrogen (N), and phosphorus (P) [1,4,30,31]. In most instances, PHA production is stimulated by O2 and/or N and/or P limitation, but in some instances, the converse is true [4,6,30,31]. For industrial processes, aeration requires energy. Gordonia lacunae BS2T is aerobic, so it was important to establish whether the organism can grow and produce PHA under O2 limitation, and, indeed, whether PHA production is stimulated by decreasing the amount of available O2. It is not possible to set a range of O2 levels at flask scale, so this factor was applied as a categorical variable to ascertain whether there was any merit to the hypotheses that O2 limitation may hamper growth and/or stimulate PHA production by Gordonia lacunae BS2T as a prelude to future studies in reactors where the O2 levels can be carefully controlled. As the C:N ratio of RHCF is >1000, the effect of C:N ratio was investigated to establish whether PHB and/or PHB production was stimulated by N limitation or not. The effect of C:P ratio was not investigated because P is a limited resource globally [32], so addition of P industrially is not viable.

3.2.1. Growth

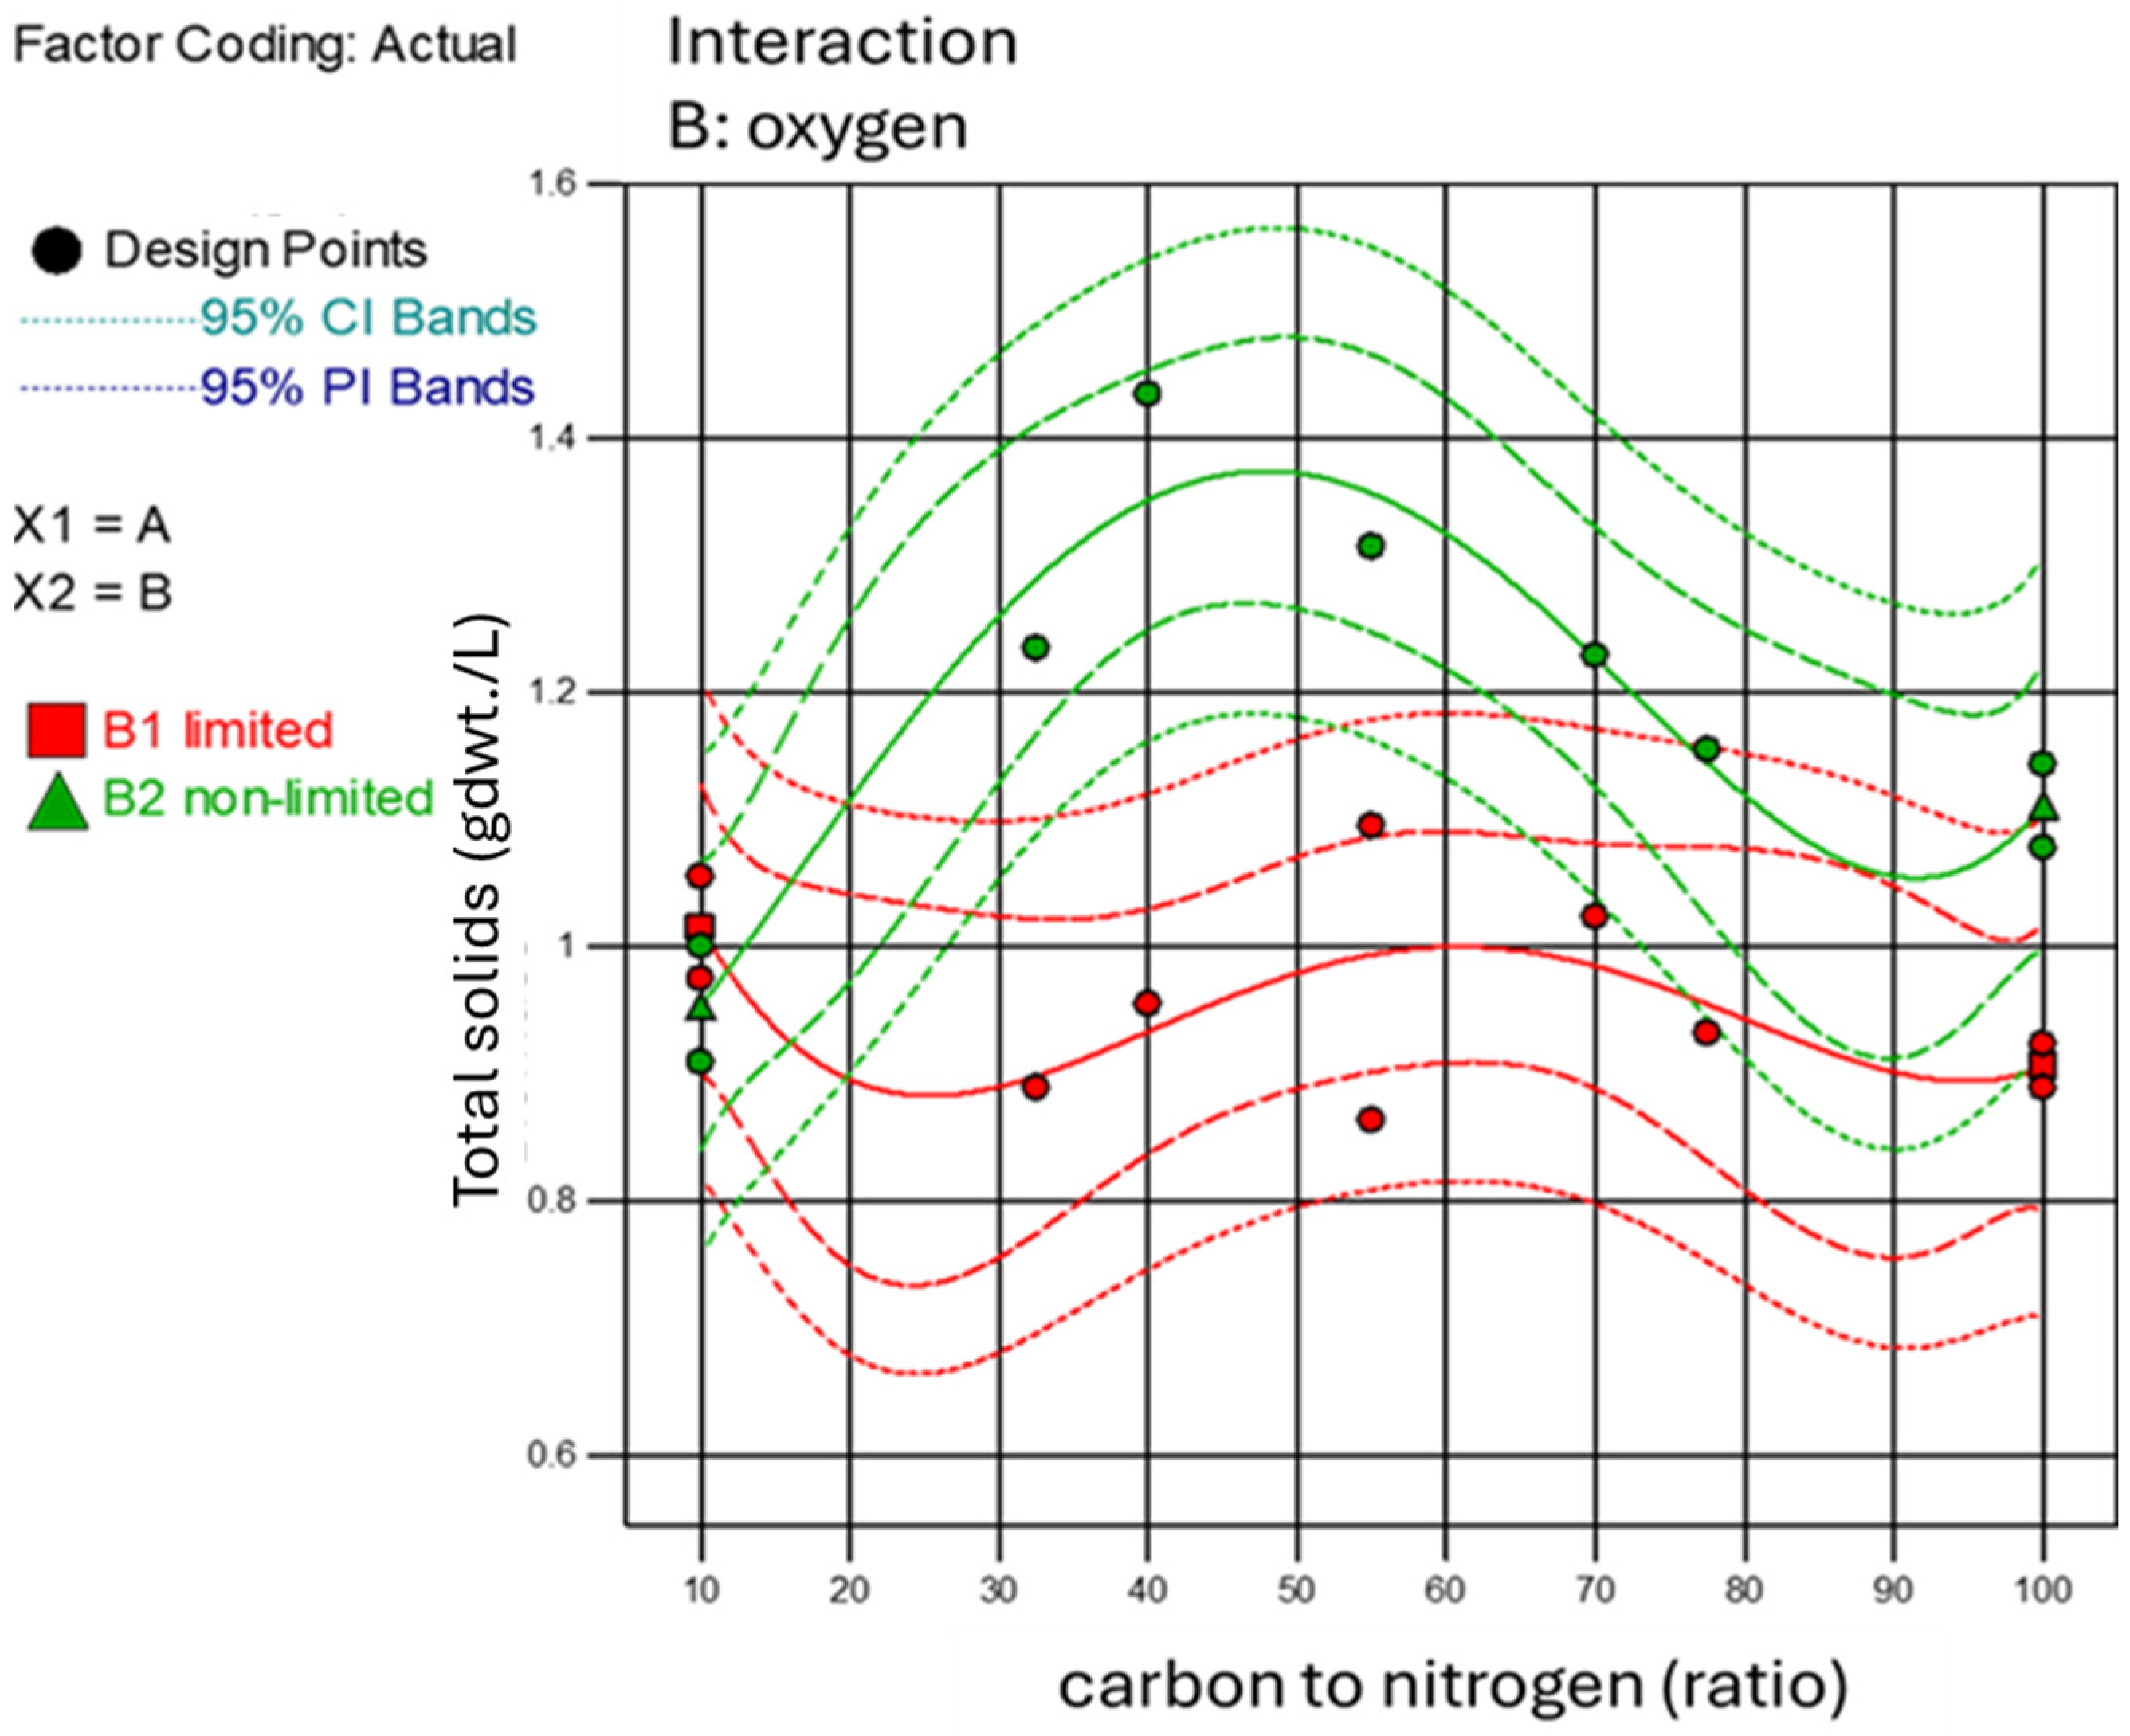
Overall, O2 limitation resulted in significantly lower growth rates of G. lacunae BS2T (average TS: 0.976 ± 0.077 gdwt./L) when compared with non-limited conditions (average TS: 1.155 ± 0.155 gdwt./L). The analysis of variance (ANOVA) (Appendix B, Table A1) showed that the quartic model for the biomass response from the CCD experimental data was highly significant (p < 0.001), with only a 0.007% chance that the large F value (9.89) could be due to noise. The predicted and adjusted R2 values of 0.6679 and 0.7980 were in reasonable agreement with one another, and the high adequate precision (9.272) indicated that the model could be used to navigate the design space. The growth model was only significant for O2 limitation/non-limitation (p < 0.001), not the C:N ratio (p > 0.5). However, analyses of the results shown on the interactive plot suggested that O2 availability was a confounding variable, and that the C:N ratio affected the bacterial growth patterns differently under conditions of limited and non-limited O2, with little to no effects under O2 limitation, but appearing to promote growth at ratios between 40 and 60 when O2 was not limited (Figure 2).

3.2.2. Polyhydroxybutyrate and Polyhydroxyvalerate Production

The 3HB concentrations from PHB were measured using the widely reported crotonic acid spectrophotometric method and an established HPLC method. The former grossly overestimated the 3HB concentration as evidenced by yields > 100% (Table 3). These results bring into question studies that primarily rely on the crotonic acid method for quantification of 3HB. We have included the crotonic acid results to caution researchers about using this method if realistic quantification values are required, unless pre-validated against a more reliable method, such as HPLC or gas chromatography (GC), for each microbial strain being tested. Although the 3HB and 3HV yields measured by HPLC were relatively low (Table 3), the HPLC results suggested that other polymers were synthesized as consistent peaks were obtained on the HPLC chromatograms that were not identified due to a lack of commercially available standards. When growth and PHA production by G. lacunae BS2T have been optimized further, intensive qualitative and quantitative investigations on the co-polymer will be undertaken. This will include determining the presence or absence of other PHA monomers. In addition, the gravimetric measurement of TS almost certainly over-estimated the amount of biomass due to the presence of insoluble precipitates from the IOC that were inseparable from the biomass, so yields were likely underestimated [9]. Of interest was the relatively high fraction of 3HV. Although O2 limitation reduced the biomass yield, higher concentrations of 3HV were achieved under O2 limitation, which translated into slightly higher 3HB+3HV yields (15.4 ± 2.36%wt.wt.) than under non-O2-limited conditions (12.4 ± 2.26%wt.wt.) [1,6] (Table 3).
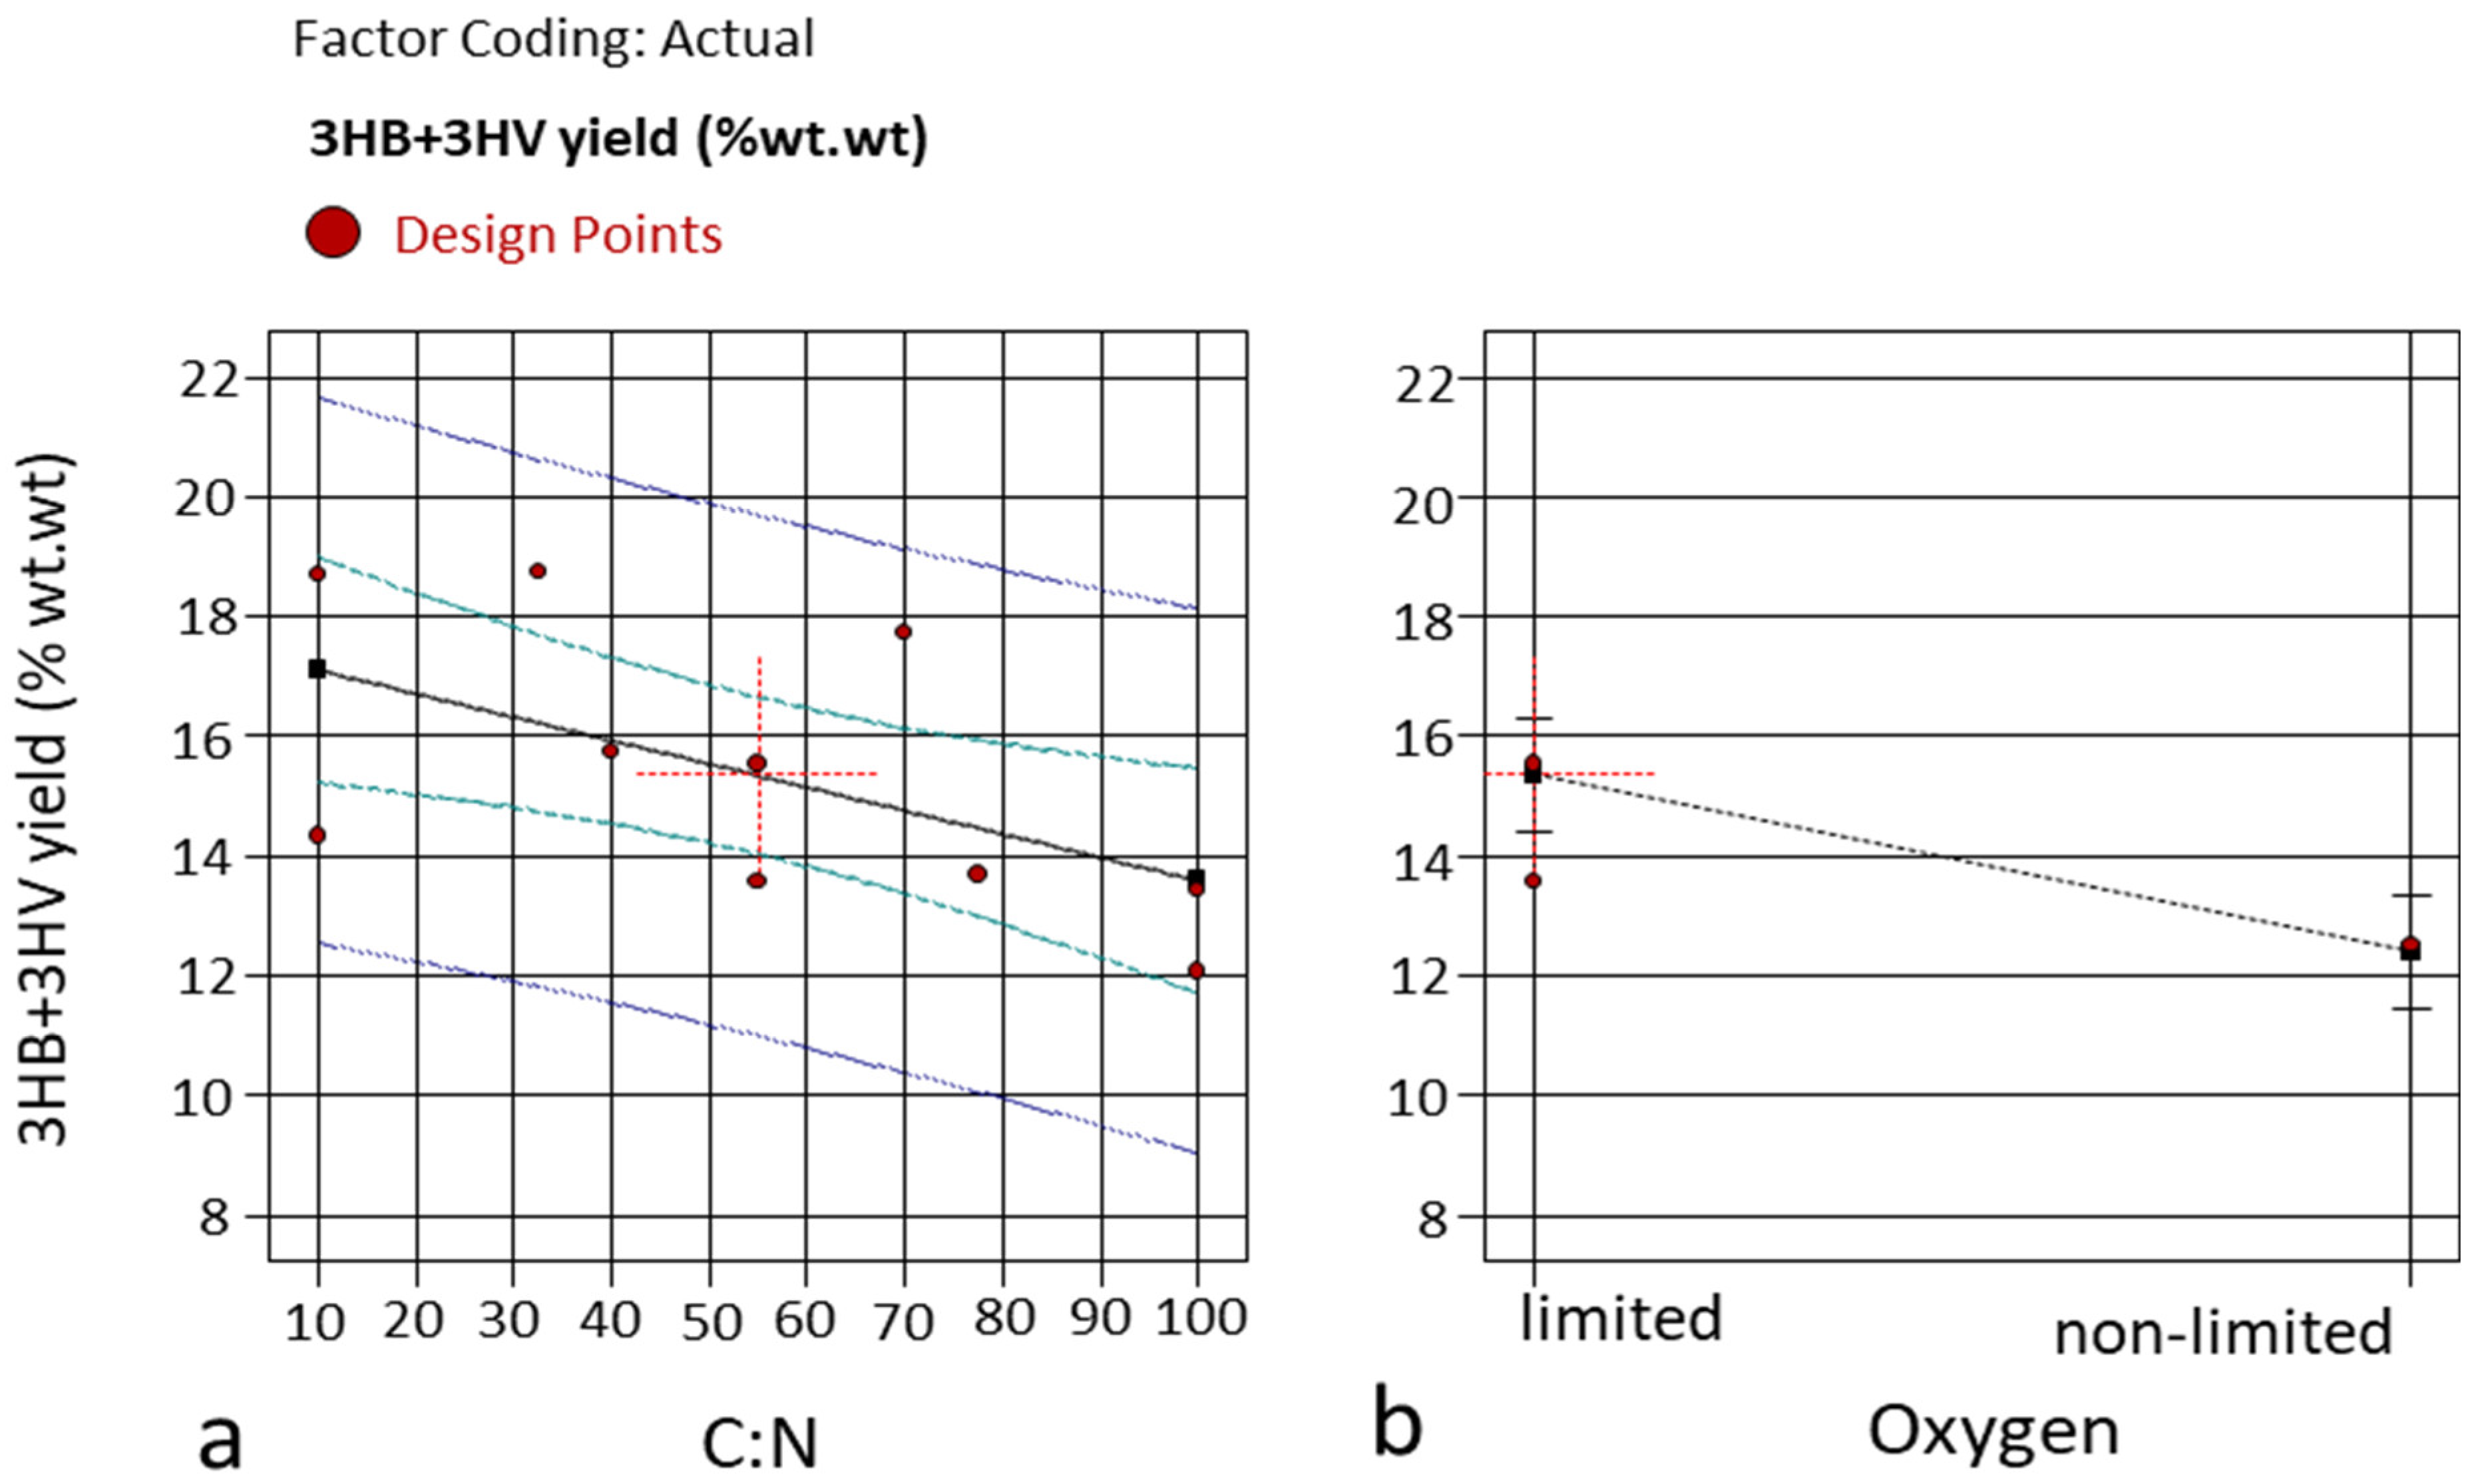
Although yields and concentrations measured using HPLC appear low (Table 3), monomers other than 3HB and 3HV were not quantified, and the yields were not corrected for the presence of non-biomass solids. Sub-optimal extraction efficiency and conversion of polymers to monomers could also result in anomalously lower measurements. In a previous study, large PHA inclusions taking up >50% of the cells were visualized using scanning electron microscopy [9], leading to the expectation of high yields. It has been shown that PHBV production can be improved by applying an optimized C:N ratio [33]. This scoping study was conducted to assess the conditions in terms of O2 availability, and the C:N ratio was likely to result in good 3HB and 3HV yields (Figure 3) and to assess the potential of RHCF for PHB and PHV production by G. lacunae BS2T. In-depth characterization of the large number of samples with small volumes was not feasible. Future studies will build on these results and aim to identify and quantify all PHA monomers using gas chromatography mass spectroscopy (GC-MS) after more sophisticated (Soxhlet) extraction methodology under optimized conditions when sample numbers are reduced and more biomass is available for analyses. The mechanical properties of the co-polymer, such as indirect tensile strength, elongation at break, thermogravimetric analyses, and moisture absorption, will also be determined.
The ANOVA results for the best fit (quadratic model) indicated that the model and variables had no significant (p > 0.05) effect on the 3HB concentration measured using HPLC (Appendix B, Table A2). In contrast, the ANOVA linear model results for 3HV production and 3HV+3HV yield were both significant (p < 0.05) (Appendix B, Table A3 and Table A4). For 3HV concentration, the model was significant for the C:N ratio (p < 0.05), but not O2 limitation/no limitation (p > 0.05). However, for yield, the linear model was significant for both the C:N ratio (p < 0.05) and O2 limitation/no limitation (p < 0.01). Although O2 had a positive effect on the growth of G. lacunae BS2T, higher cellular yields and enhanced 3HV production were promoted by O2 limitation. This may have positive implications, not only for the structure of material made with higher amounts of 3HV in the co-polymers, but also for downstream processing, as lower amounts of residuals would theoretically be present after extraction in cells with higher yields. These results merit further investigation with more sophisticated equipment to accurately control levels of O2 during bacterial growth.
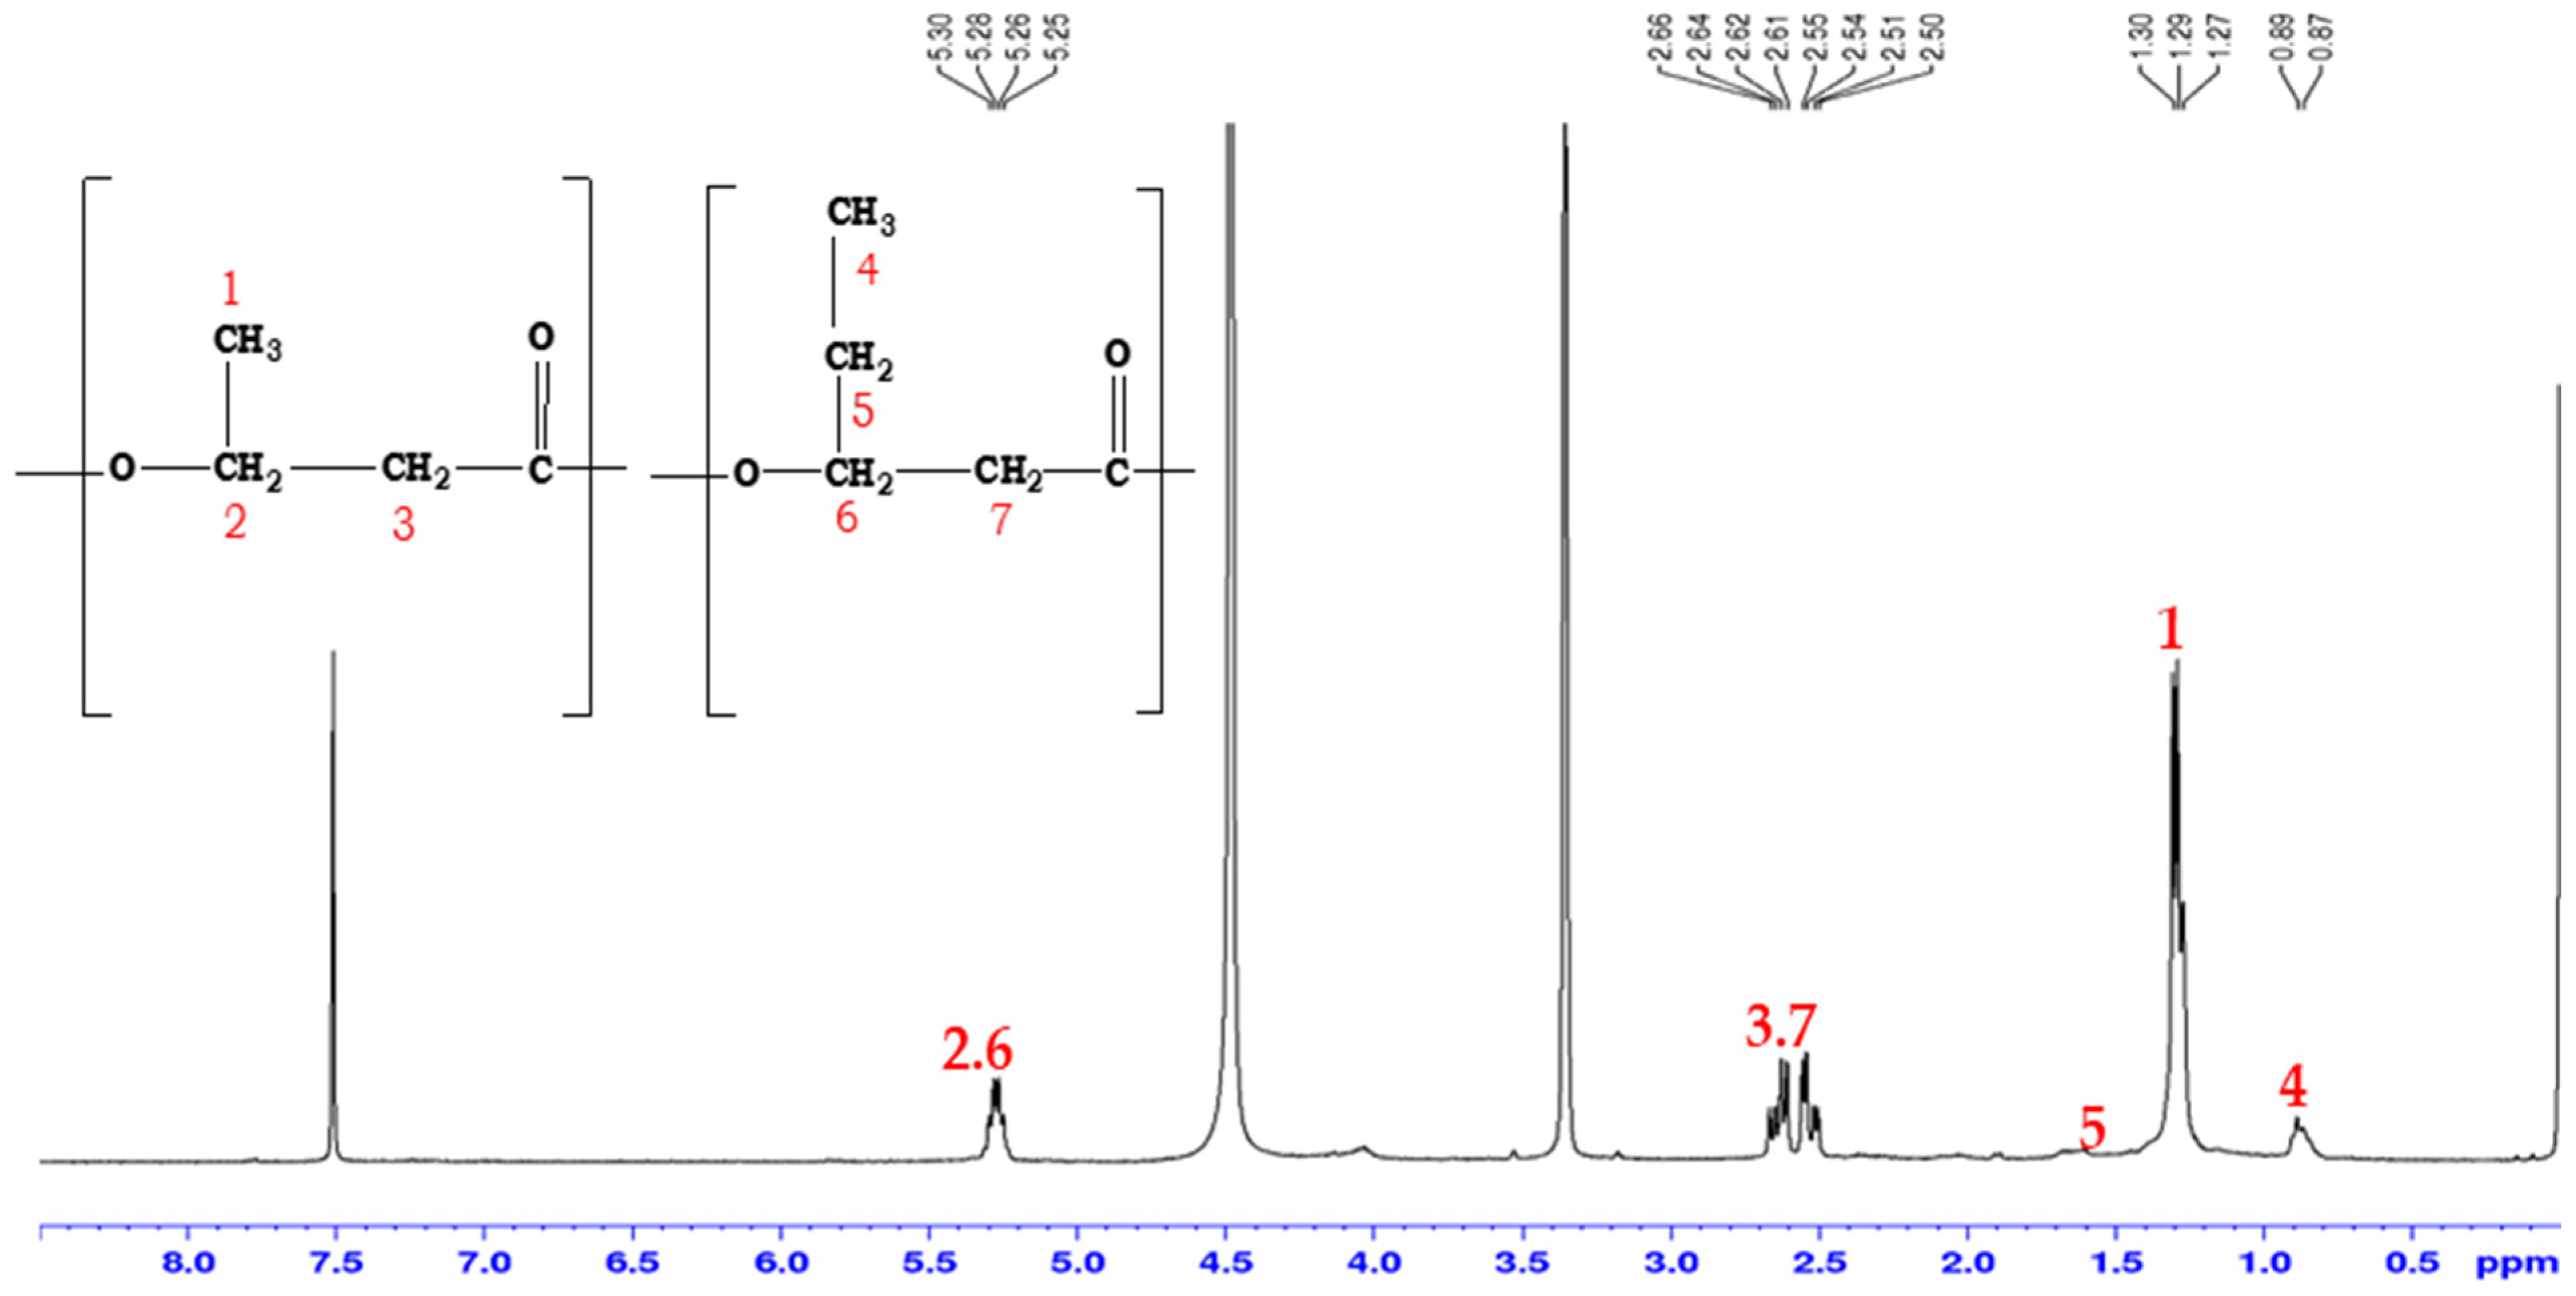
It was confirmed using NMR that an extract of G. lacunae BS2T grown in SHCF under shaking conditions without O2 limitation contained a co-polymer of 3HB and 3HV. Figure 4 depicts the 1H NMR spectrum of PHBV in MeOH/CDCl3. All signals were assigned to protons in the monomer repeating unit. The spectrum showed the methyl protons (–CH3) of the 3HB side chain corresponded at 1.29 ppm, while the methyl protons (–CH3) of the 3HV side chain were represented at 0.89 ppm. The methylene protons (–CH2) of the 3HV side chain corresponded to the signal at 1.6 ppm, and the presence of methylene protons (–CH2) of the 3HB–3HV main chains was indicated by another signal observed at about 2.5 ppm. The methines (–CH) of the 3HB and 3HV structure chains were observed at about 5.26 ppm.

3.3. Comparison of Growth, Sugar Utilization and Polyhydroxyalkanoate Production of Gordonia lacunae BS2T in Real and Synthetic Canola Fines

3.3.1. Composition of Real and Synthetic Hydrolysates of Canola Fines

As expected, there were notable differences in the composition of the defined SHCF and the more complex RHCF (Table 4). In contrast to RHCF, the SHCF did not contain unmeasured chemical variables such as alternative organic substrates and inhibitors, allowing the effects of C:N ratio and O2 limitation on growth and PHB/PHV production by G. lacunae BS2T to be definitively established. It was understandably more difficult to isolate and assess causal effects with RHCF. The second set of experiments included SHCF as a control, but the main intention was to ascertain the plausibility of using real hydrolysates from a readily available, low-value, and non-seasonal agri-industrial waste for PHA production using G. lacunae BS2T. The composition of the SHCF and the method used to prepare the RHCF used in this study were based on a previously published optimized protocol [14]. The characteristics of SHCF and RHCF are shown in Table 4. The RHCF was used in filtered raw form with no addition of nutrients. Overall, the sugars and macronutrients in the RHCF filtrate and whole RHCF were not sufficiently different to warrant using the whole samples for PHB and PHV production. Not only is it difficult to observe bacterial growth in the presence of particulates, but this fraction is also more likely to contain inhibitors released during steam-explosion, such as furan aldehydes, aliphatic acids, phenolic compounds, and aromatics [34]. The RHCF was therefore filtered for use in the ensuing study.
The C:N ratio with inorganic N in the filtered RHCF was 2.5 times higher than in the SHCF and almost 30 times higher than the highest C:N ratio used in the CCD experiment. However, organic N was present in the form of protein in the RHCF. Protein concentrations are often estimated stoichiometrically by multiplying the amount of N by a factor of 5.8, as first described in 1984 [35]. In the whole RHCF, the amount of protein was underestimated by a factor of 3 using this conversion factor, while for the filtrate, the protein estimate (0.30 g/L) closely approximated the measured value (0.28 g/L). These results suggest that the majority of N was protein-based but was not released from the particulate fraction during hydrolysis.

3.3.2. Growth Profiles

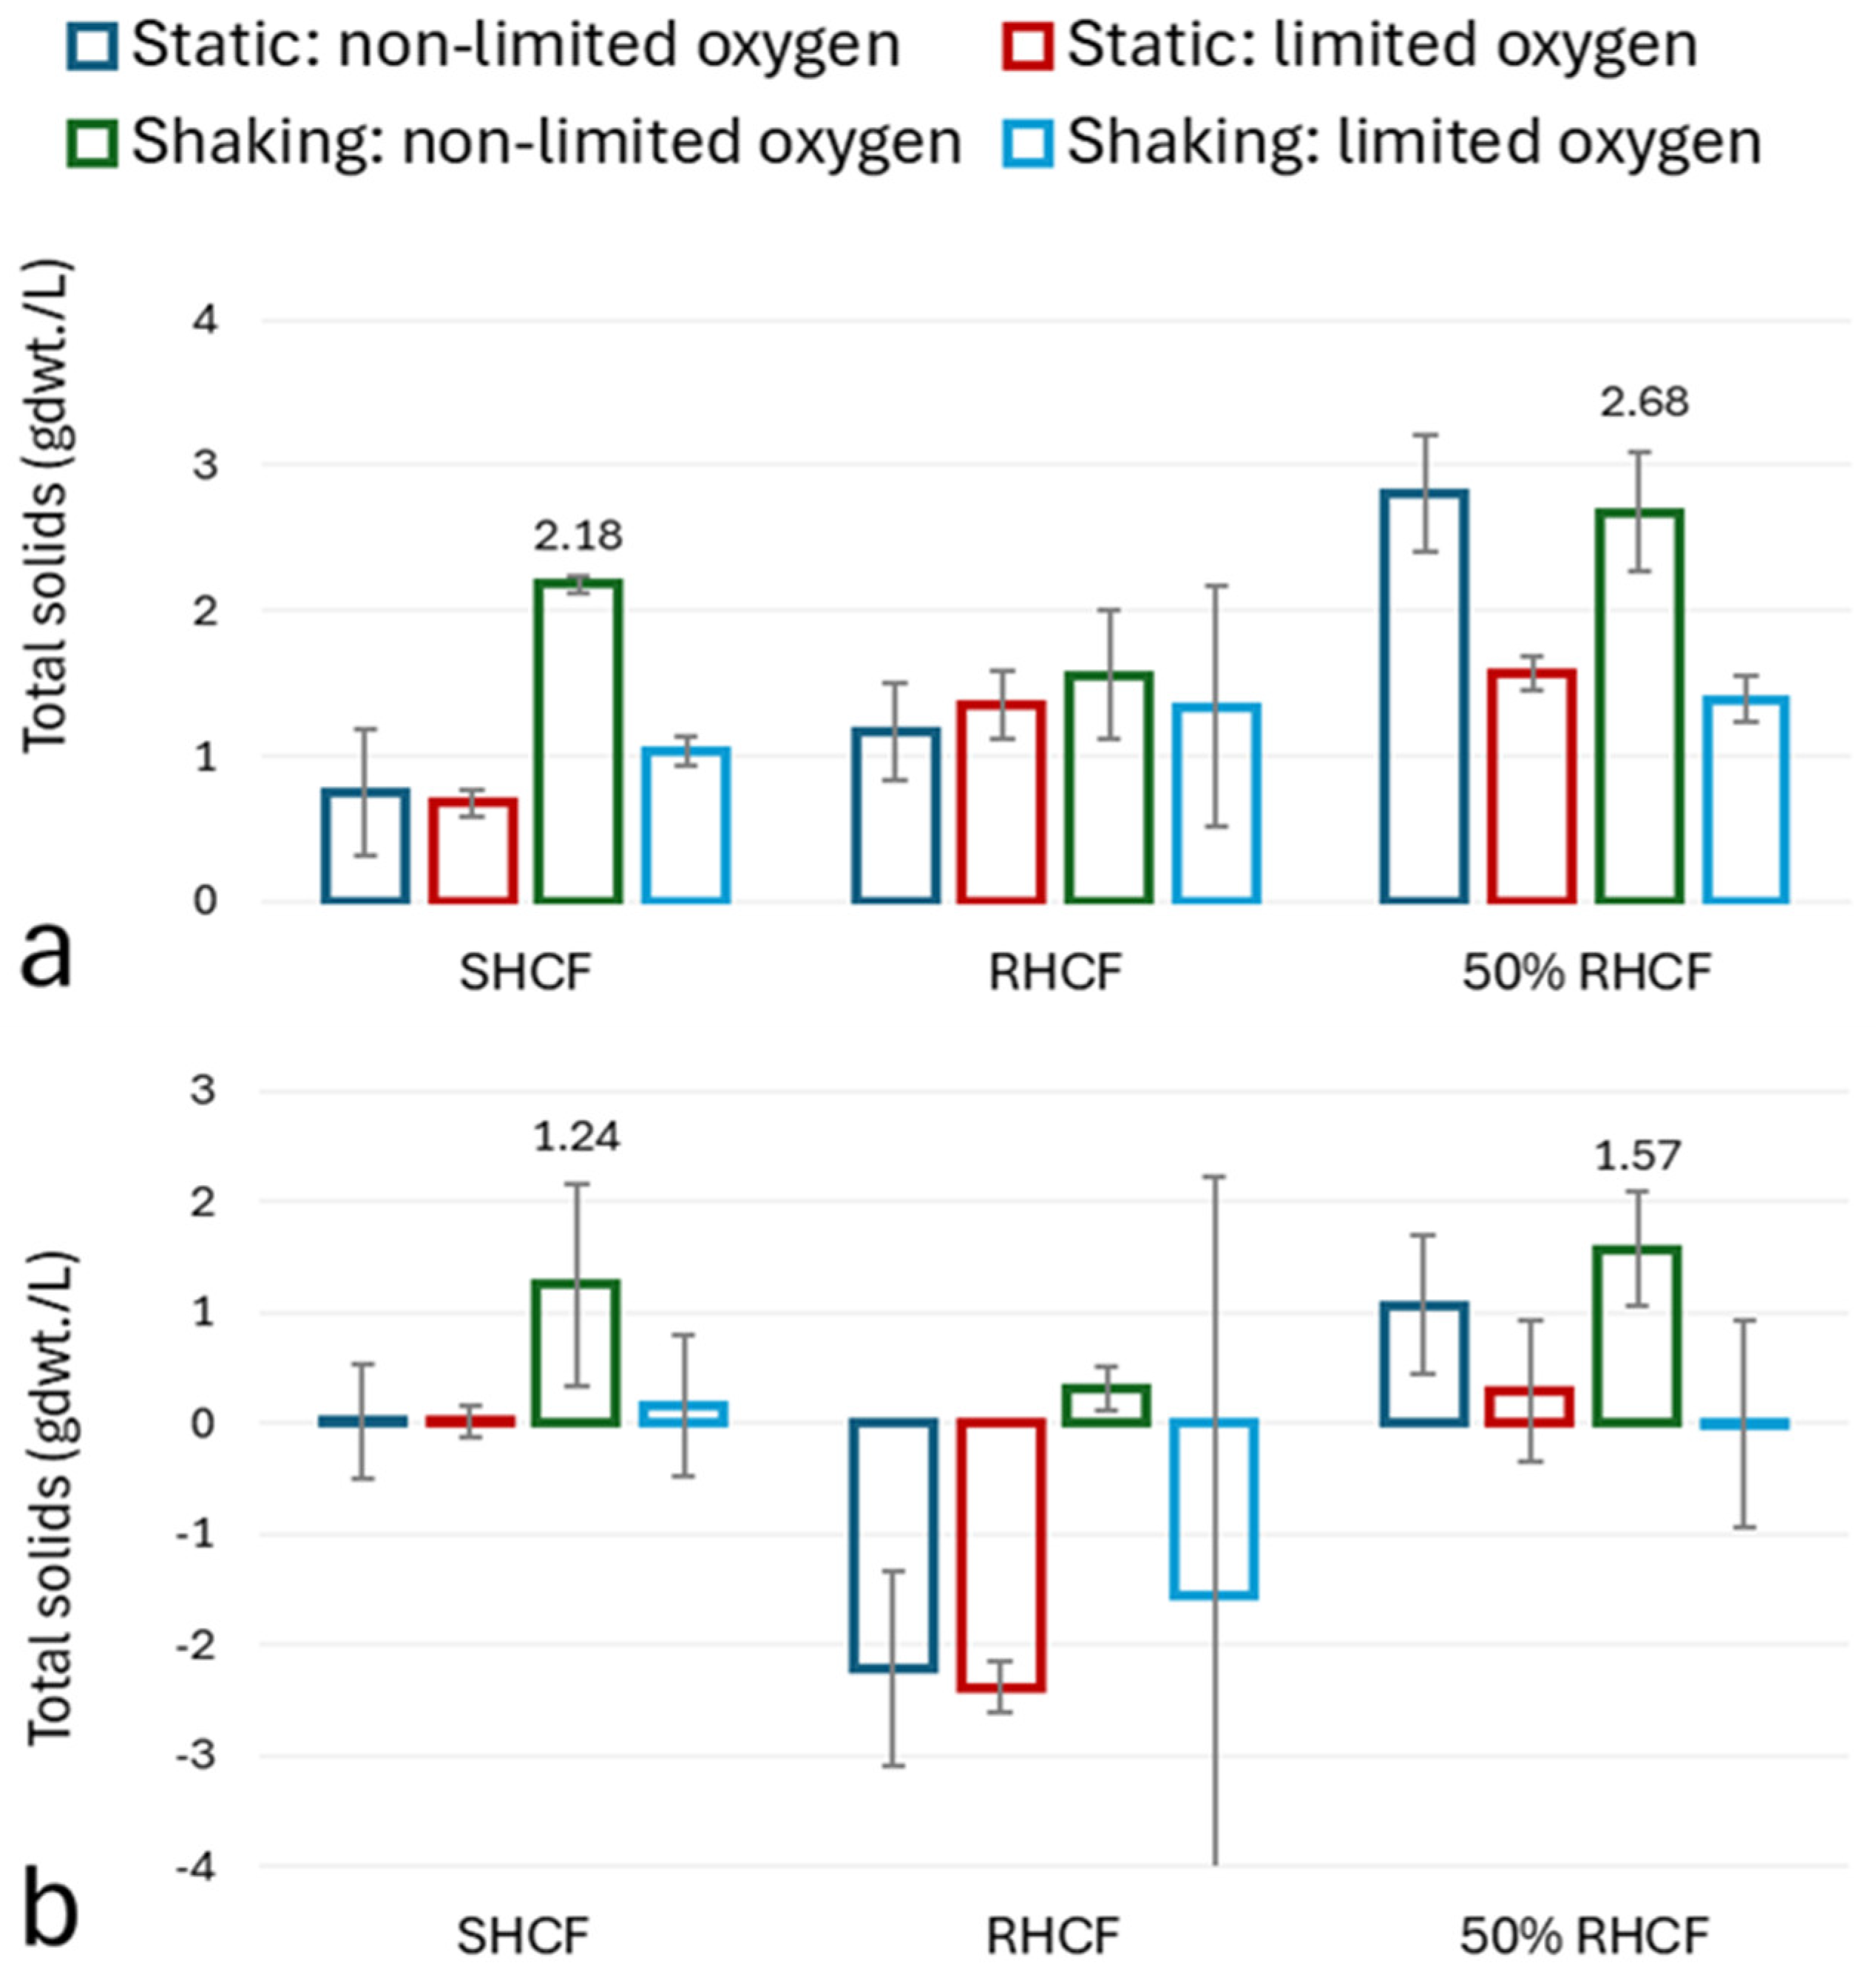
The growth of G. lacunae BS2T was measured using TS as a proxy as previously described (Figure 5a) [8]. However, solids present in the SHCF and the RHCF hydrolysates confounded the results even though the RHCF was filtered (Figure 5b), giving negative values in some instances, especially with 100% RHCF. It is also possible that some solids were hydrolyzed during the experiment. Nonetheless, it was clear that 50% RHCF is a good growth medium for G. lacunae BS2T, especially when O2 is not limited. Despite the high C:N ratios (Table 4), and the fact that addition of N appeared to promote growth of G. lacunae BS2T with C:N ratios of 40 to 60, the highest TS concentrations of 1.24 g/L and 1.57 g/L in SHCF and RHCF after correction for TWW solids (Figure 5b) were similar to those measured during the CCD experiment with SHCF under the same conditions (Figure 3). It is possible that N was obtained from the protein fraction in the RHCF, which will be monitored in future studies. In contrast, poor growth was obtained in 100% RHCF, possibly due to the presence of higher concentrations of inhibitors released from the fines during hydrolysis than in the more dilute substrate [34]. Many potential microbial growth inhibitors may be released from lignocellulosic feedstocks during pre-treatment, including furan aldehydes (e.g., furfural and 5-hydroxymethylfurfural), weak organic acids (e.g., acetic and formic acid), and phenolic compounds (e.g., p-hydroxybenzaldehyde, vanillin, and syringaldehyde) [34,36]. Detoxification methods are available [36], but interventions add to the processing costs of producing PHA from lignocellulosic hydrolysates, so they were not considered during this study. In contrast to SHCF, shaking did not appear to promote better growth than static conditions in RHCF when O2 was not limited.

3.3.3. Sugar Utilization

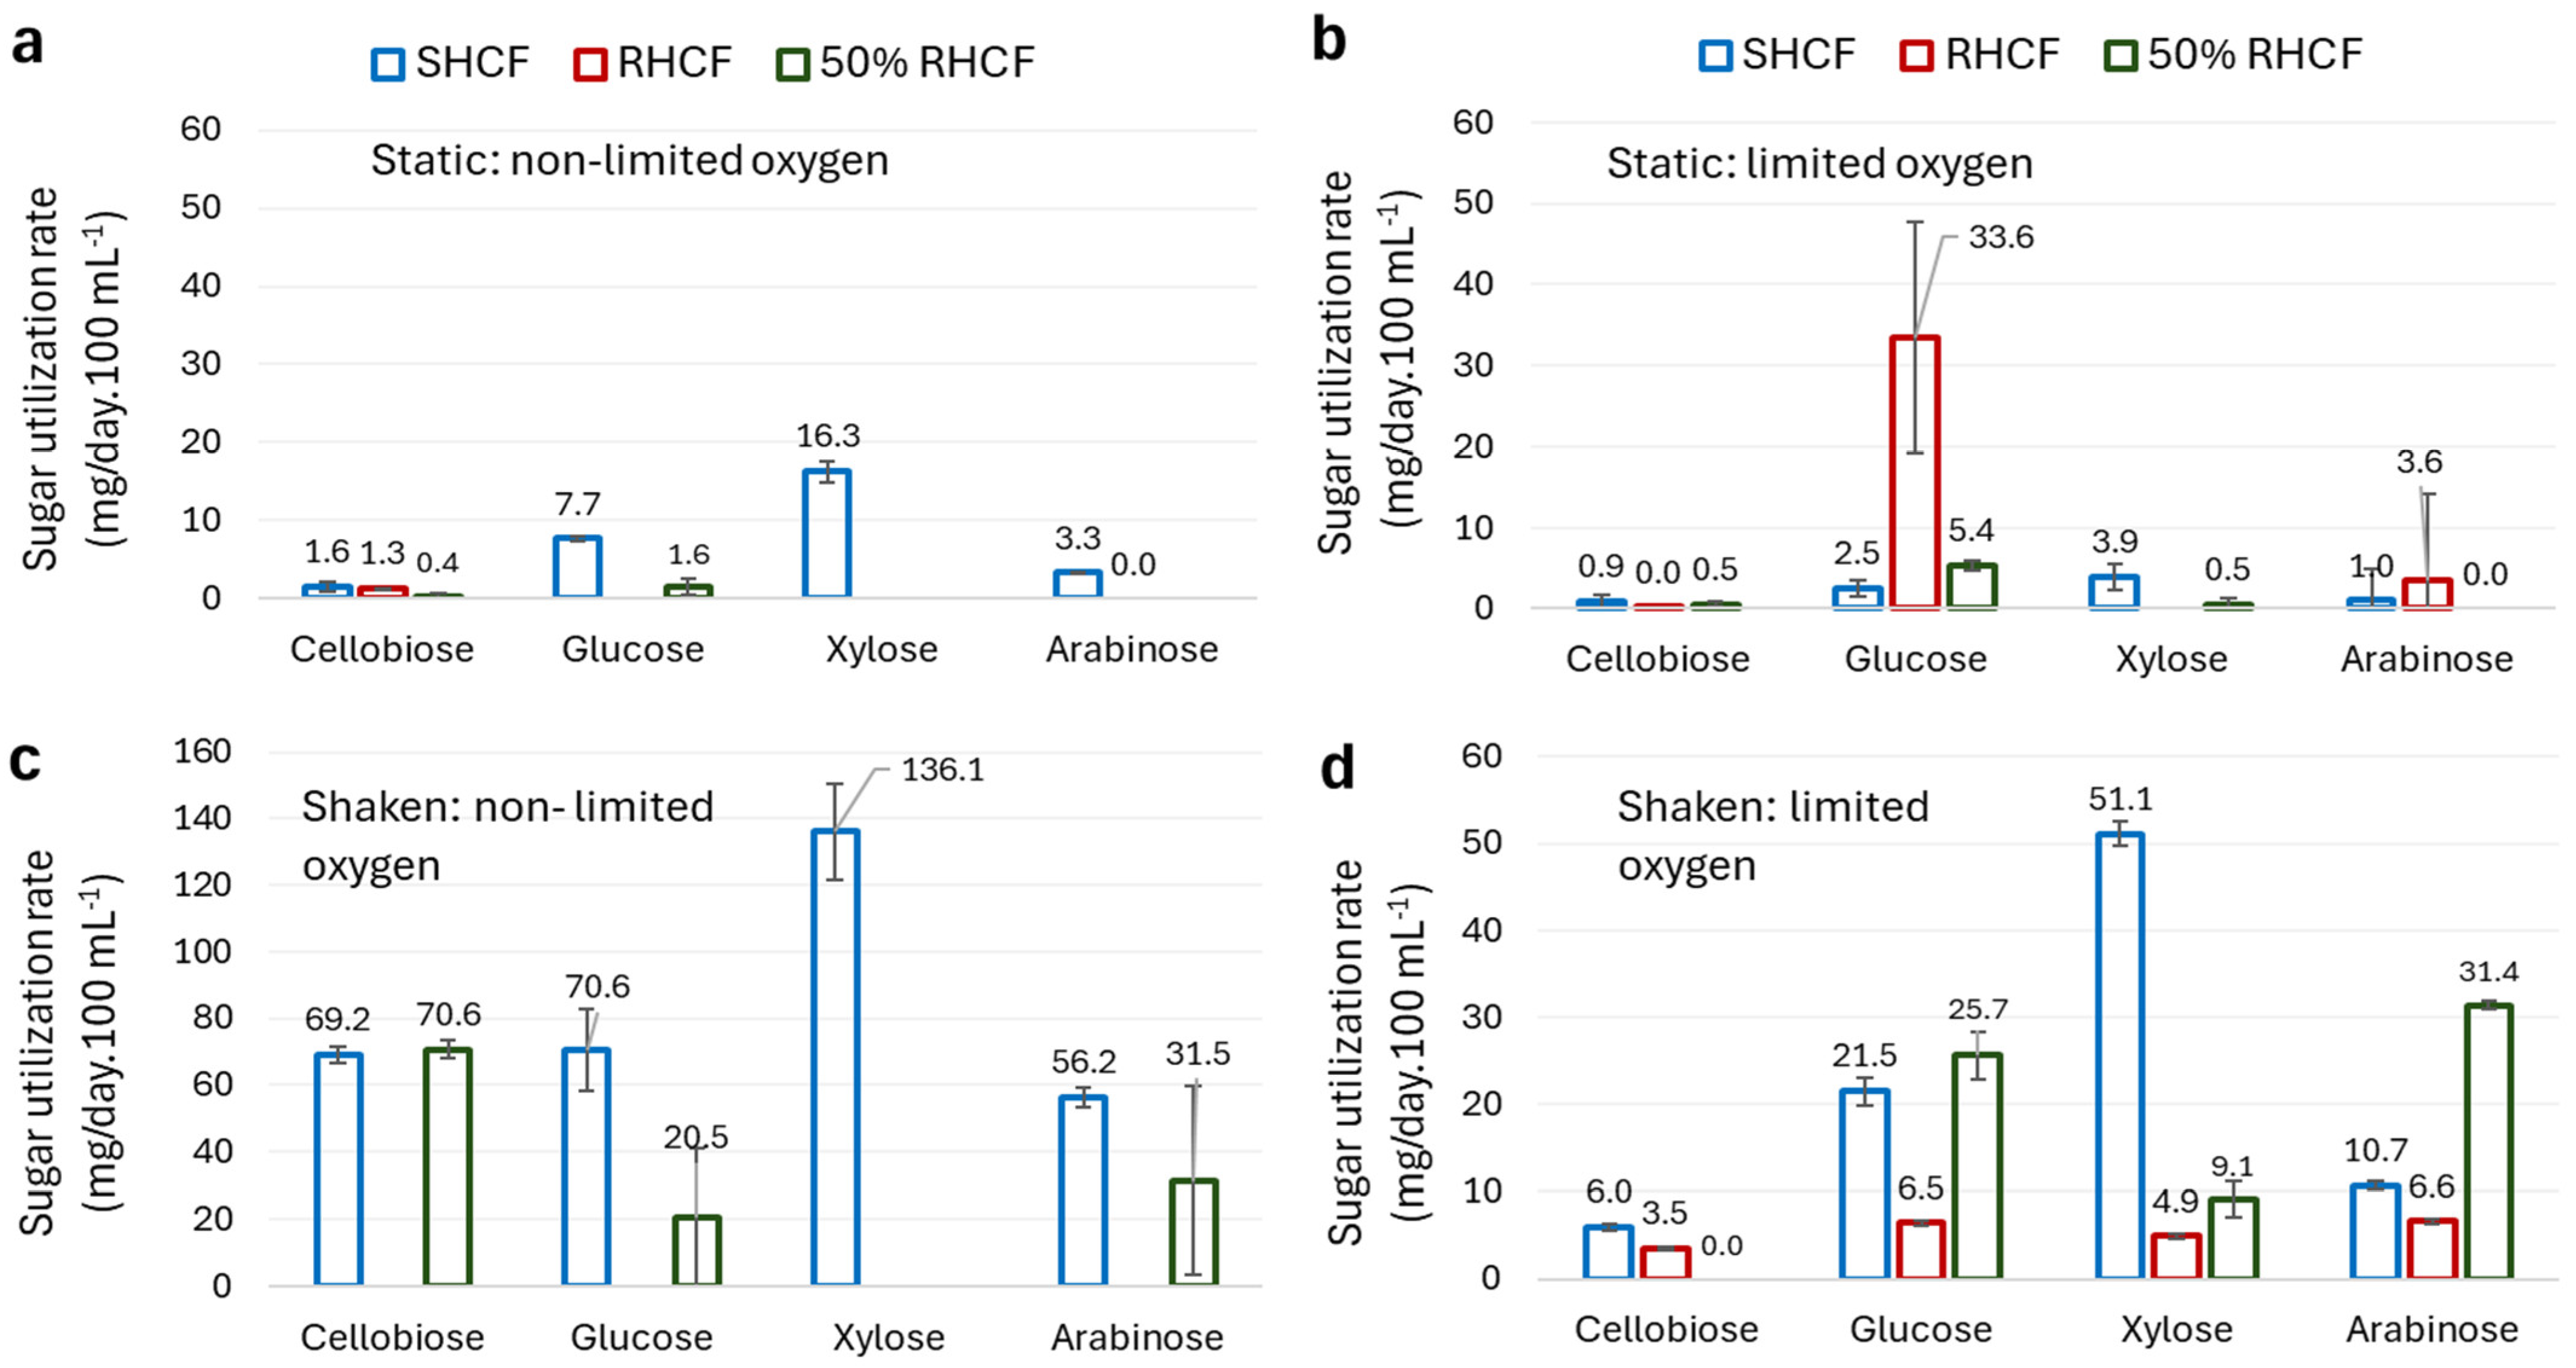
Utilization of sugars under the four culture conditions is shown in Figure 6a–d. In contrast to SHCF and 50% RHF, O2 limitation and static conditions promoted sugar utilization, especially glucose degradation, in 100% RHCF, suggesting that shaking may impact distribution of inhibitors and/or the use of fermentative rather than oxidative pathways for glucose and arabinose degradation. In contrast, static conditions reduced sugar utilization in SHCF and 50% RHCF in most instances (Figure 6a,b). The highest utilization rates of all sugars in SHCF were found under shaking conditions when O2 was not limited, implying the use of preferential oxidative degradation pathways, as shaking also promotes oxygenation. It was unclear whether O2 limitation promoted or inhibited utilization of glucose and arabinose when the flasks were shaken. However, under these conditions, much of the cellobiose in SHCF and 50% RHCF was utilized (93% and 69%, respectively), while only a fraction was utilized when O2 was limited. Notably, high utilization of xylose from SHCF occurred, while no xylose from 50% RHCF was utilized, indicating possible inhibition of enzymes involved in xylose degradation in RHCF.
Although higher sugar utilization was measured in SHCF than 50% RHCF, higher growth rates were found in 50% RHCF, possibly due to utilization of other growth substrates present in the RHCF that were not added to the defined medium (SHCF). This hypothesis merits further experimental validation. These results underscore the complexity of understanding the mechanistic patterns behind the growth of G. lacunae BS2T under different conditions, and how the use of defined or synthetic media can influence study outcomes when used as proxies for real hydrolysates.

3.3.4. Polyhydroxybutyrate and Polyhydroxyvalerate Production

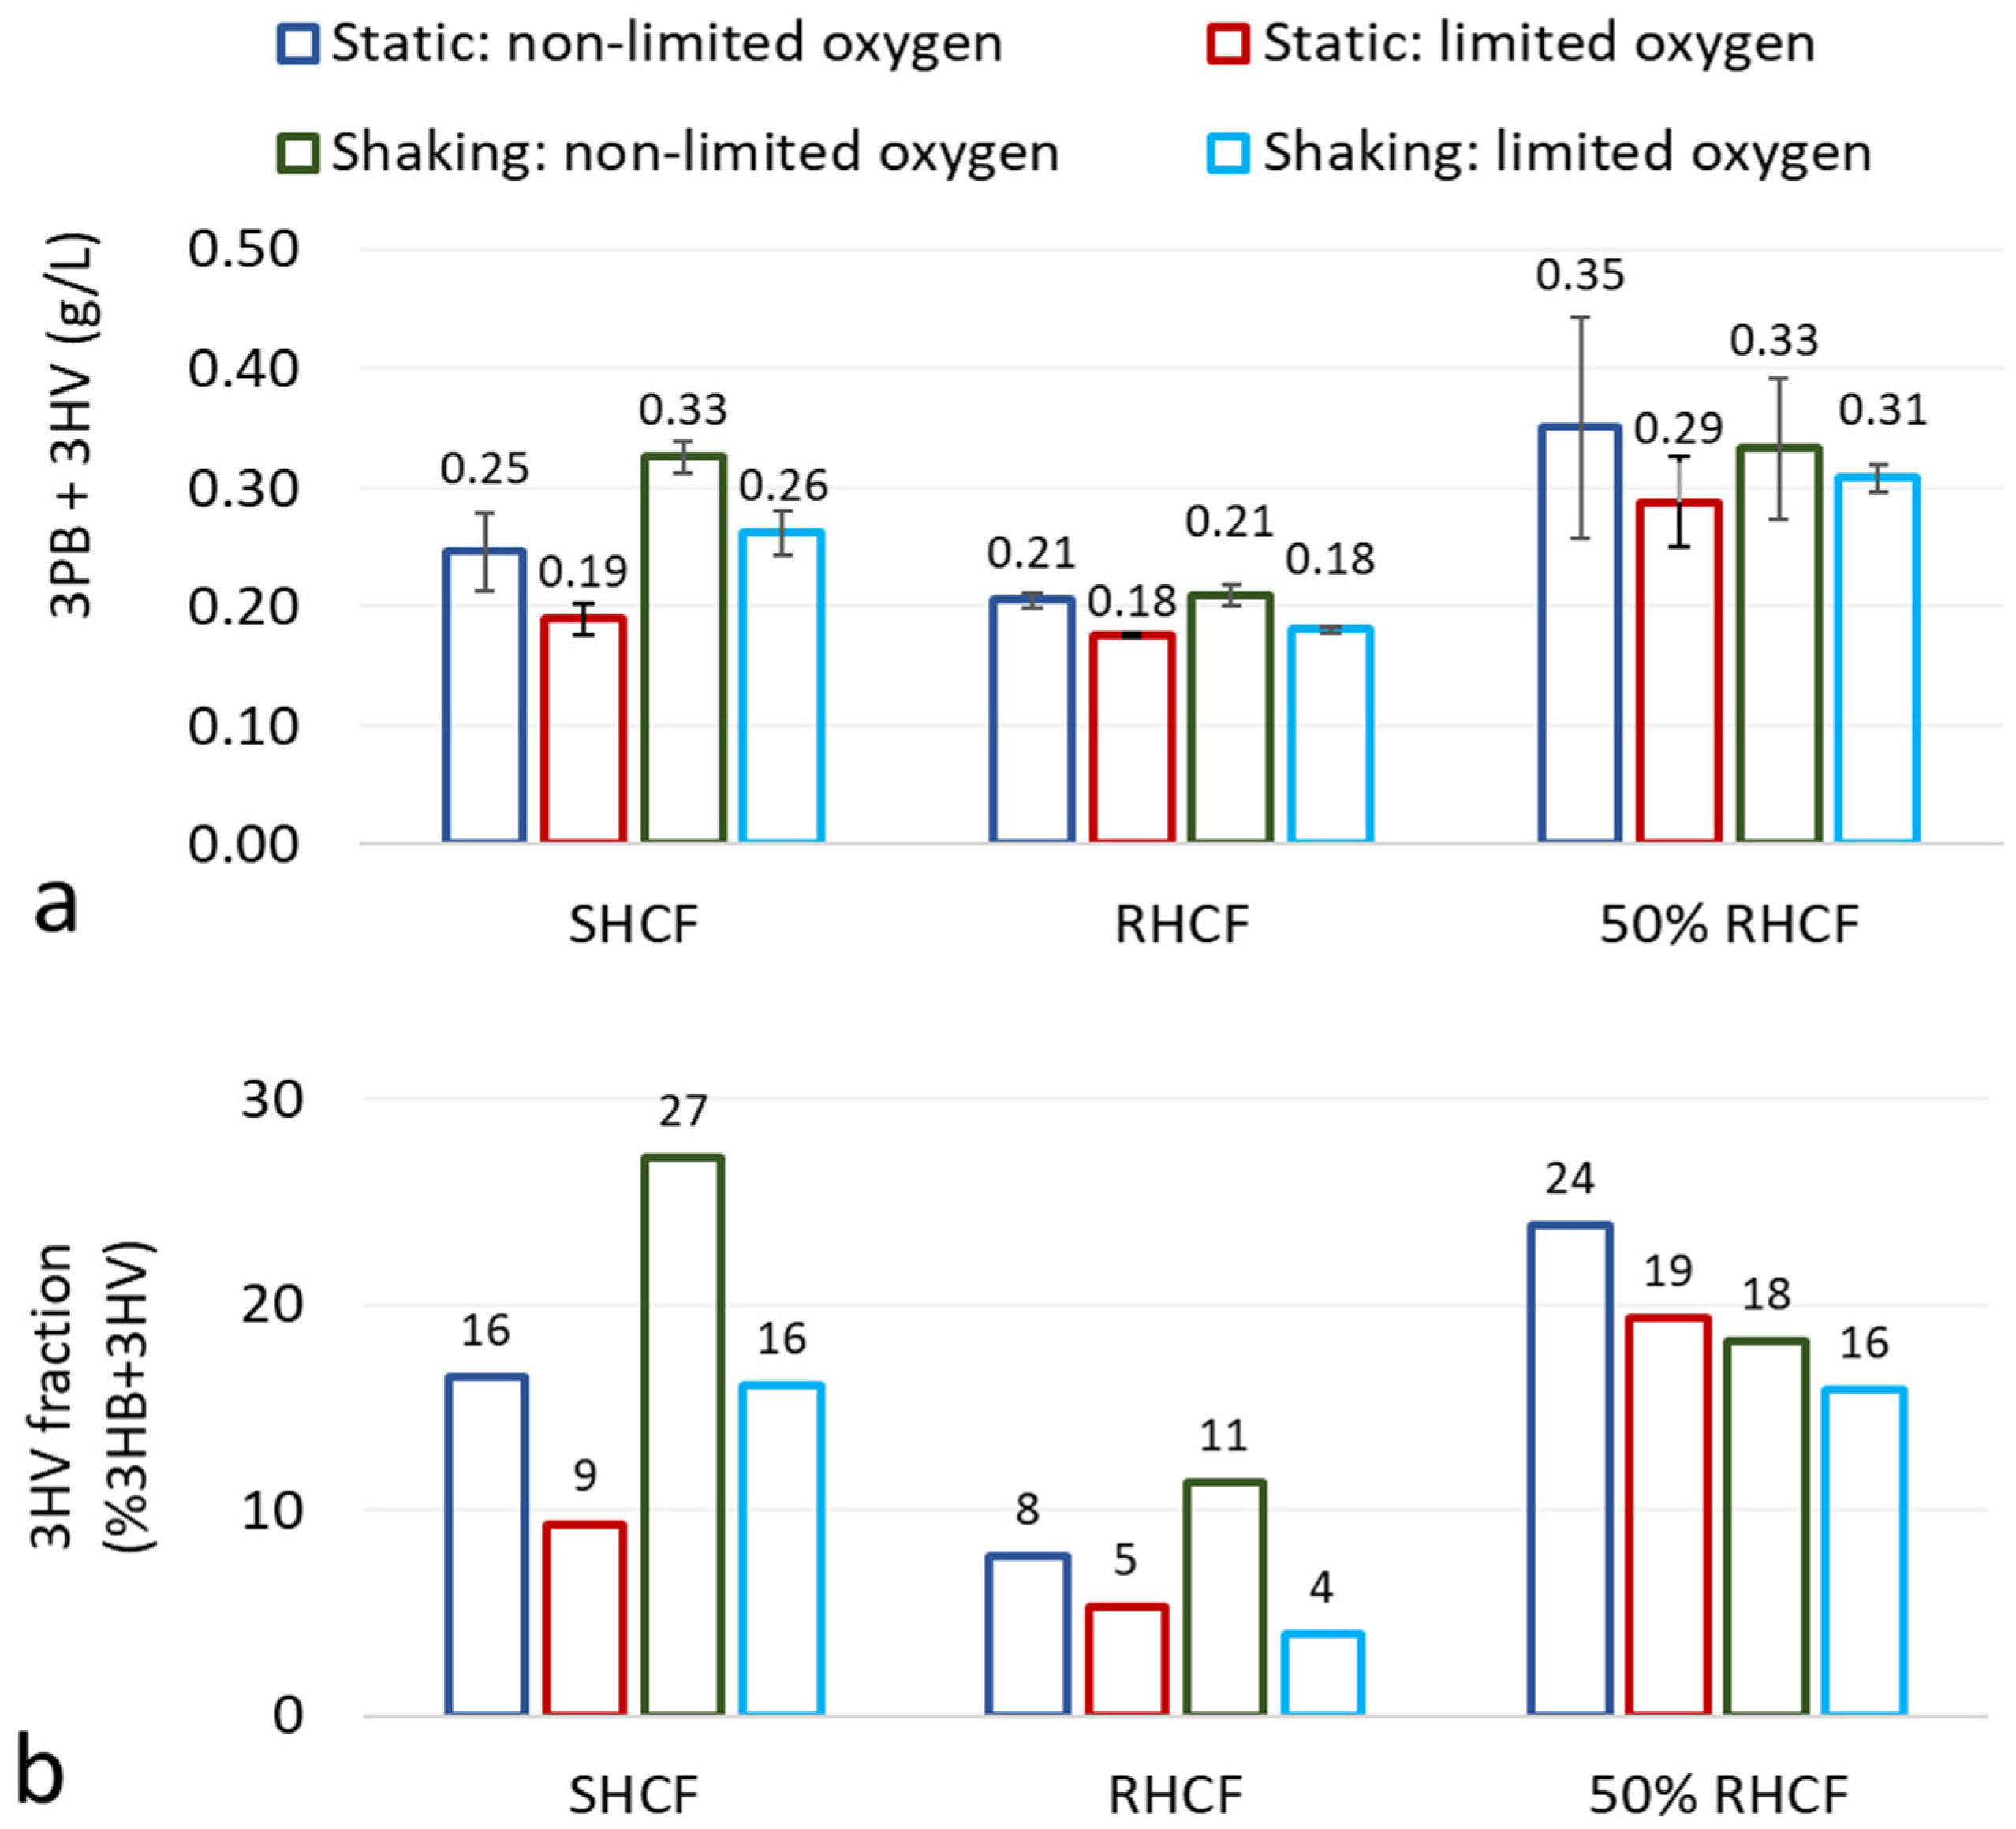
In terms of preferred substrate, the 3HB and 3HV concentrations were significantly higher when G. lacunae BS2T grew: (i) in 50% RHCF rather than 100% RHCF under all process combinations, (ii) in 50% RHCF rather than SHCF when O2 was limited, and (iii) in SHCF rather than 100% RHCF under shaking conditions (Figure 7a; p < 0.05; paired t-test). Notably, 50% RHCF was the most suitable medium for 3HB+3HV production, while 100% RHCF was the least suitable. It was hypothesized that inhibition of 3HB+3HV production along with microbial growth (Section 3.2.2) was adversely affected by inhibitors in undiluted RHCF at high concentrations. This was supported by the fact that 3HB+3HV concentrations were higher in SHCF under shaking conditions that can promote contact between microbial cells and inhibitors.
In terms of process conditions, the 3HB+3HV concentrations were significantly higher when: (i) O2 was not limited (v/s limited) under both static and shaking conditions, and (ii) when flasks were shaken (v/s static), but only when O2 was limited. These process differences were noted when all substrates were analyzed simultaneously. However, there were no significant differences in 3HB+3HV concentrations related to process conditions when 50% RHCF was analyzed separately.
The fractions of 3HV in the combined 3HB+3HV (Figure 7b) were lower than those found with lower C:N ratios in the CCD experiment (4% to 27% and 37 to 52%, respectively). This was attributed to the lower amounts of N that were present in the substrates in this study in comparison with the CCD study, which showed that 3HV production was enhanced with decreased C:N ratios in SHCF (Section 3.2.2).
In a recent review of 22 studies [37], PHB yields and concentrations ranging from 11.4% (0.11 g/L) in Pseudomonas sp. phDVI [38] grown in phenol to 99% in a mutant Escherichia coli LSBJ [39] grown in fatty acids, and 106.6 g/L in Cupriavidus necator Re2058/pCB113 grown in fructose [40] were reported. It is possible that methodological differences could account for some of the discrepancies between the yields and concentrations achieved in this study. For example, some researchers have used the crotonic acid method, quantified PHA using non-specific fluorescent dyes such as Nile red [41] or Sudan black [42], or quantified the entire biomass extract gravimetrically and assumed it to be pure PHA [43]. Nevertheless, it is acknowledged that extensive work is still required to increase the growth and PHA accumulation kinetics of G. lacunae BS2T in RHCF. For example, researchers were able to increase PHBV synthesis from negligible amounts to 2.3 g/L by optimising the pH, the amount of co-substrate, and the C:N ratio by a mixed consortium sourced from activated sludge grown in hydrolysates obtained from poplar biomass over seven reactor cycles [33].
Table 5 shows the results of other recent studies where lignocellulosic hydrolysates were used for bacterial production of PHA. Without exception, Gram-negative strains were used, including the commonly researched Cupriavidus and Ralstonia genera, and other Gram-negative rods. The advantage of using Gram-positive genera such as Gordonia for PHA production is that the inherent risk posed by endotoxins in Gram-negative cell walls is removed, rendering the polymers more desirable for high-value medical and veterinary applications [44].
All studies shown in Table 5 used the gravimetric method as a proxy for determining the dry cell weight (DCW) of the biomass, either by freeze-drying or heat-assisted evaporation of the liquid fraction. However, other researchers did not account for non-biomass solids or allude to any inaccuracies. While measurement of TS is the method of choice for such studies, there are inherent flaws associated with this and other commonly used methods for approximating biomass in small-scale studies [45]. To improve the accuracy of biomass measurements, it is highly recommended that researchers account for non-biomass solids in future studies involving hydrolysates, wastewater, and other culture media containing non-biomass solids [45].
Unlike this study, the other researchers used GC to quantify 3HB, 3HV, and GC-MS for identification and/or quantification of other monomers. The highest concentrations achieved under optimized conditions range from 0.44 g/L (3HB+3HV) in rice husk straw hydrolysate [46] to 2.9 g/L 3HB in Eucalyptus bark hydrolysate [47], while the highest yields achieved range from 25% (wt.wt.) in Eucalyptus bark hydrolysate [47] to an anomalous >100% (3HB+3HV) (1049.30 mg/g) in poplar biomass hydrolysate [33]. The latter result points to methodological uncertainty with either the biomass and/or PHBV quantification in that study.
Strategies for increasing PHB and/or PHV production in these studies include digesting rice straw hydrolysates, a “feast–famine” approach [46], or co-culturing with acetate [33] to increase the amount of volatile fatty acids precursors for PHA production. Addition of P and trace elements can also be beneficial [33], but it would increase production costs and decrease feasibility. Other researchers have engineered bacterial strains to increase sugar utilization profiles. Yuan [48] and Wang [49] and their respective co-workers inserted xylose degradation genes to increase PHA synthesis by Halomonas cupida J9 and Halomonas bluephagenesis, respectively, grown in hydrolysates of corn straw and wheat straw, respectively.
Table 5. Bacterial polyhydroxyalkanote production in various lignocellulosic hydrolysates.
HydrolysateMicrobial StrainPolyhydroxyalkanoatesRef.
Conc. (g/L)Yield (%wt.wt.)
Poplar Mixed culture from activated sludge2.3 (3HB+3HV)>100%[33]
Rice husk Cupriavidus necator DSM 4540.44 (3HB+3HV)65[46]
Eucalyptus barkBurkholderia thailandensis DSM 132761.6 (3HB)25[47]
Eucalyptus barkPseudomonas sp.2.9 (3HB)39[47]
Wheat strawHalomonas bluephagenesis T39>10 (3HB)61[48]
Corn strawHalomonas cupida J9 2.5 (NS)35[49]
Barely * Ralstonia eutropha 51191.8 (3HB+3HV)63[50]
Miscanthus *Ralstonia eutropha 51192.0 (3HB+3HV)44[50]
Pine *Ralstonia eutropha 51191.7 (3HB+3HV)54[50]
BambooHalomonas alkalicola M22.1 (3HB+3HV+3HD)52[51]
Eucalyptus barkBurkholderia thailandensis DSM 132764.6 (3HB)60[52]
Pine sawdustCupriavidus necator ATCC 176991.0 (3HB+3HV)62[53]
Canola strawG. lacunae BS2T0.35 (3HB+3HV)24This study
3HB = 3-hydroxybutyrate3HD; 3HV = 3-hydroxyvalerate; 3HD = 3-hydroxydodecanoate * commercial hydrolysates.

4. Conclusions

Building on results of previous studies conducted with SHCF, this work showed that RHCF is a good substrate for production of PHBV from G. lacunae BS2T, provided the hydrolysate is diluted. When diluted (50% RHCF), biomass growth was significantly reduced when O2 was limited, while under non-limited conditions, the amount of biomass attained was similar, irrespective of whether the flasks were shaken or kept static. However, under static conditions, sugar utilization was negligible (total 2 mg/day, 100 mL−1), in comparison with shaking conditions (total 122 mg/day, 100 mL−1). It is possible that neither glucose, cellobiose, arabinose, nor xylose was a preferred substrate for G. lacunae BS2T under static conditions, a hypothesis that merits further metabolic investigation. Under these conditions (static, non-limited O2), the highest amounts of 3HB+3PV (0.31 ± 0.09 g/L) were achieved, with the highest fraction of 3PV (24%) ostensibly the most desirable co-polymer. Future work consists of scaling up production using different concentrations of RHCF and assessing the mechanical and physicochemical properties of the polymers obtained.

Author Contributions

Conceptualization: P.J.W. and A.R.; Methodology: P.J.W., A.R. and T.M.; Software: P.J.W. and M.l.R.-H.; Validation: P.J.W. and T.M.; Formal analysis: P.J.W., A.R., T.M. and M.l.R.-H.; Investigation: P.J.W.; Resources: P.J.W., T.M. and M.l.R.-H.; Data curation: P.J.W. and M.l.R.-H.; Writing—original draft preparation: P.J.W. and M.l.R.-H.; writing—review and editing: P.J.W., A.R., T.M. and M.l.R.-H.; Project administration: P.J.W.; Funding acquisition: P.J.W. and T.M. All authors have read and agreed to the published version of the manuscript.

Funding

This research was funded by the Department of Science and Technology (DST) and the Council for Scientific and Industrial Research (CSIR) in South Africa. Waste Research Development and Innovation (RDI) Roadmap Grant CSIR/BEI/WRIU/2020/033. Any opinions, findings, and conclusions or recommendations expressed in this material are those of the authors, and the funding entities do not accept any liability in this regard.

Institutional Review Board Statement

Not applicable.

Informed Consent Statement

Not applicable.

Data Availability Statement

The original contributions presented in this study are included in the article. Further inquiries can be directed to the corresponding author.

Conflicts of Interest

There are no conflicts of interest to declare. The funders had no role in the design of the study; in the collection, analyses, or interpretation of data; in the writing of the manuscript; or in the decision to publish the results.

Abbreviations

IOCinorganic chemicals
SHCFsynthetic hydrolysates of Canola fines
RHCFreal hydrolysates of Canola fines

Appendix A

Figure A1. Growth of selected Gordonia strains in different concentrations of SHCF after 2 weeks of incubation at 30 °C. SHCF = synthetic hydrolysate of Canola fines.
Fermentation 12 00250 g0a1

Appendix B

Table A1. ANOVA for Quartic model Response: Biomass.
SourceSum of SquaresdfMean SquareF-Valuep-Value
Model0.408480.05119.890.0007significant
A-C:N0.003610.00360.69360.4244
B-Oxygen0.263110.263150.973.14 × 10−5
AB0.022210.02224.290.0651
A20.015410.01542.990.1146
A2B0.074910.074914.510.0034
A30.004410.00440.84680.3791
A3B0.038610.03867.470.0211
A40.007610.00761.480.2518
Residual0.0516100.0052
Lack of Fit0.014750.00290.39880.8321not significant
Pure Error0.036950.0074
Cor Total0.460118
Table A2. ANOVA for Quadratic model Response: 3HB.
SourceSum of SquaresdfMean SquareF-Valuep-Value
Model0.000740.00022.970.0571not significant
A-C:N0.000210.00023.420.0857
B-Oxygen2.77 × 10−812.77 × 10−80.00050.9825
AB0.000110.00011.290.2759
A20.000410.00047.160.0181
Residual0.0008140.0001
Lack of Fit0.000590.00010.84350.6125not significant
Pure Error0.000350.0001
Cor Total0.001418
Table A3. ANOVA for Linear model Response: 3HV.
SourceSum of SquaresdfMean SquareF-Valuep-Value
Model0.001520.00083.660.0492significant
A-C:N0.001410.00146.830.0188
B-Oxygen0.000110.00010.49110.4935
Residual0.0033160.0002
Lack of Fit0.0021110.00020.75170.6790not significant
Pure Error0.001250.0002
Cor Total0.004818
Table A4. ANOVA for Linear model Response: 3HB+3HV yield.
SourceSum of SquaresdfMean SquareF-Valuep-Value
Model70.84235.429.230.0022significant
A-C:N29.23129.237.620.0139
B-Oxygen41.60141.6010.840.0046
Residual61.40163.84
Lack of Fit45.30114.121.280.4170not significant
Pure Error16.1153.22
Cor Total132.2418

Appendix C

Figure A2. KEGG Glycolysis/gluconeogenesis metabolic pathway. Enzymes present in the genome of Gordonia lacunae BS2T are highlighted in green, indicating a full complement of enzymes required for utilization of glucose for energy generation.
Fermentation 12 00250 g0a2
Figure A3. KEGG Starch and sucrose metabolism pathway. Enzymes present in the genome of Gordonia lacunae BS2T are highlighted in green, indicating the presence of the β-glucosidase required for the conversion of cellobiose to glucose.
Fermentation 12 00250 g0a3
Figure A4. KEGG Pentose and Glucuronate Interconversion metabolic pathway. Enzymes responsible for the utilization of xylose and arabinose are not predicted to be present in the genome of Gordonia lacunae BS2T (enzymes present are highlighted in green). This may be due to an annotation error or truncated gene sequences, especially since utilization has been detected in experimental work.
Fermentation 12 00250 g0a4

References

  1. Guimarães, T.C.; Araújo, E.S.; Hernández-Macedo, M.L.; López, J.A. Polyhydroxyalkanoates: Biosynthesis from Alternative Carbon Sources and Analytic Methods: A Short Review. J. Polym. Environ. 2022, 30, 2669–2684. [Google Scholar] [CrossRef]
  2. Pandey, A.; Adama, N.; Adjallé, K.; Blais, J.-F. Sustainable applications of polyhydroxyalkanoates in various fields: A critical review. Int. J. Biol. Macromol. 2022, 221, 1184–1201. [Google Scholar] [CrossRef]
  3. Welz, P.J.; Linganiso, L.Z.; Murray, P.; Kumari, S.; Arthur, G.D.; Ranjan, A.; Collins, C.; Bakare, B.F. Status quo and sector readiness for (bio)plastic food and beverage packaging in the 4IR. S. Afr. J. Sci. 2022, 118, 1–9. [Google Scholar] [CrossRef] [PubMed]
  4. Alves, A.A.; Siqueira, E.C.; Barros, M.P.S.; Silva, P.E.C.; Houllou, L.M. Polyhydroxyalkanoates: A review of microbial production and technology application. Int. J. Environ. Sci. Technol. 2023, 20, 3409–3420. [Google Scholar] [CrossRef]
  5. Gao, Q.; Yang, H.; Wang, C.; Xie, X.Y.; Liu, K.X.; Lin, Y.; Han, S.-Y.; Zhu, M.; Neureiter, M.; Lin, Y.; et al. Advances and trends in microbial production of polyhydroxyalkanoates and their building blocks. Front. Bioeng. Biotechnol. 2022, 10, 966598. [Google Scholar] [CrossRef] [PubMed]
  6. Alsaadi, A.; Ganesen, S.S.K.; Amelia, T.S.M.; Moanis, R.; Peeters, E.; Vigneswari, S.; Bhubalan, K. Polyhydroxyalkanoate (PHA) Biopolymer Synthesis by Marine Bacteria of the Malaysian Coral Triangle Region and Mining for PHA Synthase Genes. Microorganisms 2022, 10, 2057. [Google Scholar] [CrossRef]
  7. Boukhatem, Z.F.; Merabet, C.; Tsaki, H. Plant growth promoting Actinobacteria, the most promising candidates as bioinoculants? Front. Agron. 2022, 4, 849911. [Google Scholar] [CrossRef]
  8. van Bergeijk, D.A.; Terlouw, B.R.; Medema, M.H.; van Wezel, G.P. Ecology and genomics of Actinobacteria: New concepts for natural product discovery. Nat. Rev. Microbiol. 2020, 18, 546–558. [Google Scholar] [CrossRef]
  9. Mabasa, D.; Ranjan, A.; Le Roes-Hill, M.; Mthethwa, T.; Welz, P.J. Polyhydroxyalkanote production by actinobacterial isolates in lignocellulosic hydrolysate. Processes 2024, 12, 1112. [Google Scholar] [CrossRef]
  10. Andler, R.; Vivod, R.; Steinbüchel, A. Synthesis of polyhydroxyalkanoates through the biodegradation of poly(cis-1,4-isoprene) rubber. J. Biosci. Bioeng. 2019, 127, 360–365. [Google Scholar] [CrossRef]
  11. Arenskötter, M.; Baumeister, D.; Kalscheuer, R.; Steinbüchel, A. Identification and application of plasmids suitable for transfer of foreign DNA to members of the genus Gordonia. Appl. Environ. Microbiol. 2003, 69, 4971–4974. [Google Scholar] [CrossRef]
  12. Alvarez, H.M. Relationship between β-oxidation pathway and the hydrocarbon-degrading profile in actinomycetes bacteria. Int. Biodeterior. Biodegrad. 2003, 52, 35–42. [Google Scholar] [CrossRef]
  13. Welz, P.J. Edible seed oil waste: Status quo and future perspectives. Water Sci. Technol. 2019, 80, 2107–2116. [Google Scholar] [CrossRef] [PubMed]
  14. Ranjan, A.; Welz, P.J.; Mthethwa, T. Investigation of an effective acid pre-treatment method for the valorisation of Canola fines. Biomass Convers. Biorefin. 2024, 14, 12013–12026. [Google Scholar] [CrossRef]
  15. Welz, P.J.; Ramond, J.B.; Cowan, D.A.; Prins, A.; Burton, S.G. Ethanol degradation and the value of incremental priming in pilot scale constructed wetlands. Ecol. Eng. 2011, 37, 1453–1459. [Google Scholar] [CrossRef]
  16. Law, J.H.; Slepcky, R.A. Assay of Poly-β-hydroxybutyric acid. J. Bacteriol. 1961, 82, 33–36. [Google Scholar] [CrossRef]
  17. Kibangou, V.A.; Lilly, M.; Mpofu, A.B.; de Jonge, N.; Oyekola, O.O.; Welz, P.J. Sulfate-reducing and methanogenic microbial community responses during anaerobic digestion of tannery effluent. Bioresour. Technol. 2022, 347, 126308. [Google Scholar] [CrossRef]
  18. Aziz, R.K.; Bartels, D.; Best, A.A.; DeJongh, M.; Disz, T.; Edwards, R.A.; Formsma, K.; Gerdes, S.; Glass, E.M.; Kubal, M.; et al. The RAST server: Rapid annotations using subsystems technology. BMC Genom. 2008, 9, 75. [Google Scholar] [CrossRef]
  19. Kanehisa, M.; Sato, Y.; Morishima, K. BlastKOALA and GhostKOALA: KEGG tools for functional characterization of genome and metagenome sequences. J. Mol. Biol. 2016, 428, 726–731. [Google Scholar] [CrossRef] [PubMed]
  20. Zheng, J.; Ge, Q.; Yan, Y.; Zhang, X.; Huang, L.; Yin, Y. dbCAN3: Automated carbohydrate-active enzyme and substrate annotation. Nucleic Acids Res. 2023, 51, W115–W121. [Google Scholar] [CrossRef]
  21. Shalumi, S.; Zehavi, A.; Belakhov, V.; Salama, R.; Lansky, S.; Baasov, T.; Shoham, G.; Shoham, Y. Cross-utilization of B-galactosides and cellobiose in Geobacillus stearothermophilus. J. Biol. Chem. 2020, 295, 10766–10780. [Google Scholar] [CrossRef]
  22. Koh, H.G.; Yook, S.; Oh, H.; Rao, C.V.; Jin, Y.-S. Toward raped and efficient utilization of nonconventional substrates by nonconventional yeast strains. Curr. Opin. Biotechnol. 2024, 85, 103059. [Google Scholar] [CrossRef]
  23. Hoyt, K.O.; Woolston, B.M. Adapting isotopic tracer and metabolic fluxes analysis approaches to study C1 metabolism. Curr. Opin. Biotechnol. 2022, 75, 102695. [Google Scholar] [CrossRef]
  24. Zhang, Y.; Qin, C.; Yang, L.; Lu, R.; Zhao, X.; Nie, G. A comparative genomics study of carbohydrate/glucose metabolic genes: From fish to mammals. BMC Genom. 2018, 19, 246. [Google Scholar] [CrossRef]
  25. Yin, X.; Bi, Y.; Niu, J.; Shao, W.; Liang, G.; Lin, W.; Xu, C. Metabolic pathway analysis of the biodegradation of cellulose by Bacillus venezelensis. Heliyon 2024, 10, e38375. [Google Scholar] [CrossRef]
  26. Stephens, C.; Christen, B.; Fuchs, T.; Sundaram, V.; Watanabe, K.; Jenal, U. Genetic analysis of a novel pathway for D-xylose metabolism in Caulobacter crescentus. J. Bacteriol. 2006, 189, 2181–2185. [Google Scholar] [CrossRef]
  27. Liu, D.; Zhang, Y.; Li, J.; Sun, W.; Yao, Y.; Tian, C. The weimberg pathway: An alternative for Myceliophthora thermophila to utilize D-xylose. Biotechnol. Biofules Bioprod. 2023, 16, 13. [Google Scholar] [CrossRef] [PubMed]
  28. Kululo, W.W.; Habtu, N.G.; Abera, M.K.; Sendekie, B.; Fanta, S.W.; Yemata, T.A. Advances in various pretreatment strategies of lignocellulosic substrates for the production of bioethanol: A comprehensive review. Discov. Appl. Sci. 2025, 7, 476. [Google Scholar] [CrossRef]
  29. Nambissan, V.D.; Singh, S.; Gummadi, S.N. Exploring the Impact of Emerging Pretreatment Technologies on Effective Lignocellulosic Biomass Utilization. In Value Addition and Utilization of Lignocellulosic Biomass; Mukherjee, G., Dhiman, S., Eds.; Springer: Singapore, 2025. [Google Scholar] [CrossRef]
  30. Tulipan, J.U.; Unlayao, J.R.C.; Punzalan, G.M.L.; Ventura, J.R. Biosynthesis of polyhydroxyalkanoate (PHA) by Cupriavidus necator KCTC 2649 using coconut (Cocos nucifera L.) water as carbon source. Prep. Biochem. Biotechnol. 2026, 1–10. [Google Scholar] [CrossRef]
  31. Zhu, J.; Tian, Q.; Zhu, Y.; Yang, J.; Wang, M. Factors for Promoting Polyhydroxyalkanoate (PHA) Synthesis in Bio-Nutrient-Removal and Recovery System. IOP Conf. Ser. Earth Environ. Sci. 2018, 178, 012021. [Google Scholar] [CrossRef]
  32. Yuan, Z.; Tian, H.; Xu, S.; Liu, X.; Olayide, O.; Li, L.; Zaytsev, A.; Rodionov, D. Soil phosphorus deficient and trade exacerbate African food shortage. Resour. Environ. Sustain. 2025, 21, 100230. [Google Scholar] [CrossRef]
  33. Yin, F.; Dongna, L.; Ma, X.; Li, J.; Qiu, Y. Poly(3-hydroxybutyrate-3-hydroxyvalerate production from waste lignocellulosic hydrolysates and acetate co-substrate. Bioresour. Technol. 2020, 316, 123911. [Google Scholar] [CrossRef] [PubMed]
  34. Brandt, A.B.; Jansen, T.; Görgens, J.F.; van Zyl, W.H. Overcoming lignocellulose-derived microbial inhibitors: Advancing the Saccharomyces cerevisiae resistance toolbox. Biofuels Bioprod. Biorefin. 2019, 13, 1520–1536. [Google Scholar] [CrossRef]
  35. Gnaiger, E.; Bitterlich, G. Proximate biochemical composition and caloric content calculated from elemental CHN analysis: A stoichiometric approach. Oecologia 1984, 62, 289–298. [Google Scholar] [CrossRef]
  36. Wang, A.; Han, T.; Zhang, B.; Bao, J. Minor phenolic compounds in detoxified lignocellulosic hydrolysates are the determinant factor on cell growth and metabolic activity of Escherichia coli. Biotechnol. J. 2025, 20, e70155. [Google Scholar] [CrossRef] [PubMed]
  37. Siegu, W.M.; Drożdżyński, P.; Kumaravel, V.; Marchut-Mikołajczk, O. Advances in microbial strain selection and carbon source valorization for polyhydroxyalkanoates (PHA) production. New Biotechnol. 2026, 93, 44–53. [Google Scholar] [CrossRef]
  38. Kanavaki, I.; Drakonaki, A.; Geladas, E.D.; Spyros, A.; Xie, H.; Tsiotis, G. Polyhydroxyalkanoate (PHA) production in Pseudomonas sp. phDV1 strain grown on phenol as carbon sources. Microorganisms 2021, 9, 1636. [Google Scholar] [CrossRef]
  39. Scheel, R.A.; Ho, T.; Kageyama, Y.; Masisak, J.; McKenney, S.; Lundgren, B.R.; Nomura, C. Optimizing a fed-batch high-density fermentation process for medium chain-length poly(3-hydroxyalkanoates) in Escherichia coli. Front. Bioeng. Biotechnol. 2021, 9, 618259. [Google Scholar] [CrossRef]
  40. Santolin, L.; Waldburger, S.; Neubauer, P.; Riedel, S.L. Substrate-flexible two-stage fed- batch cultivations for the production of the PHA copolymer P(HB-co-HHx) with Cupriavidus necator Re2058/pCB113. Front. Bioeng. Biotechnol. 2021, 9, 623890. [Google Scholar] [CrossRef]
  41. Ramadoss, R.; Siddique, A.; Rashid, N.; Liberski, A.R.; Vincent, A.S.; Mackey, H.R. Effects of nitrogen and phosphorus concentrations of PHA synthesis by PNSB enriched phototrophic mixed microbial culture. Bioprocess Biosyst. Eng. 2026, 49, 621–636. [Google Scholar] [CrossRef]
  42. Porras, M.A.; Villar, M.A.; Cubitto, M.A. Improved intracellular PHA determinations with novel spectrophotometric quantification methodologies based on Sudan black dye. J. Microbiol. Methods 2018, 148, 1–11. [Google Scholar] [CrossRef]
  43. Porras, M.A.; Vitale, C.; Villar, M.A.; Cubitto, M.A. Bioconversion of glycerol to poly (HB-co-HV) copolymer in an inexpensive medium by a Bacillus megaterium strain isolated from marine sediments. J. Environ. Chem. Eng. 2017, 5, 1–9. [Google Scholar] [CrossRef]
  44. Bai, X.; Xu, L.; Li, K.; Zhang, G.; Zhang, M.; Huang, Y. Unlocking efficient polyhydroxyalkanoate production by Gram-positive Priestia megaterium using waste-derived feedstocks. Microb. Cell Factories 2025, 30, 210. [Google Scholar] [CrossRef] [PubMed]
  45. Ranjan, A.; Ngobeni, P.V.; Welz, P.J. Measurement of biomass in small-scale microalgal and micro-algal-bacterial systems for wastewater treatment: Mini review and experimental evaluation. Processes 2026, 14, 1145. [Google Scholar] [CrossRef]
  46. Andhalkar, V.V.; Montané, D.; Medina, F.; Constanti, M. Biorefinery design with combined deacetylation and microwave pretreatment for enhanced production of polyhydroxyalkanoates and efficient carbon utilization from lignocellulose. Chem. Eng. J. 2024, 486, 149754. [Google Scholar] [CrossRef]
  47. Rodrigues, T.; Torres, C.A.V.; Marques, S.; Girio, F.; Freitas, F.; Reis, M.A.M. Polyhydroxyalkanoate production from Eucalyptus bark’s enzymatic hydrolysate. Materials 2024, 8, 1773. [Google Scholar] [CrossRef]
  48. Yuan, Y.; Wang, H.; He, H.; Zhang, A.; Yang, F.; Chen, Y.; Wu, F.; Wu, Q.; Chen, G.-Q. Polyhydroxyalkanoate production by engineered Halomonas grown in lignocellulosic hydrolysate. Bioresour. Technol. 2025, 425, 132313. [Google Scholar] [CrossRef]
  49. Wang, S.; Liu, Y.; Gou, H.; Meng, Y.; Xiong, W.; Liu, R.; Yang, C. Establishment of low-cost production platforms of polyhydroxyalkanoate bioplastics from Halomonas cupida J9. Biotechnol. Bioeng. 2024, 21, 2106–2120. [Google Scholar] [CrossRef]
  50. Bhatia, S.K.; Gurav, R.; Choi, T.-R.; Jung, H.-R.; Yang, S.-Y.; Moon, Y.-M.; Song, H.-S.; Jeon, J.-M.; Choi, K.-Y.; Yang, Y.-H. Bioconversion of plant biomass hydrolysate into bioplastic (polyhydroxyalkanoates) using Ralstonia eutropha 5119. Bioresour. Technol. 2019, 271, 306–315. [Google Scholar] [CrossRef]
  51. Luo, C.-B.; Li, H.-C.; Li, D.-Q.; Nawaz, H.; You, T.-T.; Xu, F. Efficiently unsterile polyhydroxyalkanoate production from lignocellulose by using alkali-halophilic Halomonas alkalicola M2. Bioresour. Technol. 2022, 351, 126919. [Google Scholar] [CrossRef]
  52. Matias, J.; Rodrigues, T.; Torres, C.A.V.; Marques, S.; Ribiero, B.; Girio, F.; Reis, M.A.M.; Freitas, F. Sustainable production of poly(3-hydroxybutyrate) using Eucalyptus bark: Integration with green downstream processing. ACS Sustain. Chem. Eng. 2026, 14, 3749–3757. [Google Scholar] [CrossRef] [PubMed]
  53. Mohan, G.; Johnson, R.L.; Yu, J. Conversion of pine sawdust into polyhydroxyalkanoate bioplastics. ACS Sustain. Chem. Eng. 2021, 9, 8383–8392. [Google Scholar] [CrossRef]
Figure 2. Interactive plot showing the relationship between oxygen availability and carbon to nitrogen ratio on the growth of Gordonia lacunae BS2T.
Fermentation 12 00250 g002
Figure 3. Interactive plots showing the effects of carbon-to-nitrogen ratio (a) and oxygen availability (b) on 3-hydroxybutyrate plus 3-hydroxyvalerate yields from Gordonia lacunae BS2T. Black lines denote the predicted trends, while green and blue lines denote the prediction interval and 95% confidence interval, respectively.
Fermentation 12 00250 g003
Figure 4. 1H nuclear magnetic resonance spectrum of the polyhydroxybutyrate-co-polyhydroxyvalerate polymer from Gordonia lacunae BS2T in chloroform and methanol.
Fermentation 12 00250 g004
Figure 5. Total solids at the end of the experiment (a) and after adjustment for solids present in the hydrolysates. (b) Error bars indicate standard deviation from the mean (n = 3).
Fermentation 12 00250 g005
Figure 6. Sugar utilization by G. lacunae BS2T in real and synthetic Canola fines under static, non-oxygen-limited (a), static, oxygen-limited (b), shaken, non-oxygen-limited (c), and shaken, oxygen-limited (d) growth conditions. Note the difference in the scale of the y-axis in Figure 6c. Error bars indicate standard deviation from the mean (n = 3).
Fermentation 12 00250 g006
Figure 7. Combined 3-hydroxybutyrate and 3-hydroxyvalerate production (a) and 3-hydroxyvalerate fraction (b) under different culture conditions in synthetic hydrolysate of canola fines (SHF) and real hydrolysates of canola fines (RHCF). Error bars indicate standard deviation from the mean (n = 3).
Fermentation 12 00250 g007
Table 1. Central composite design experimental protocol for the optimization of polyhydroxybutyrate and polyhydroxyvalerate production by Gordonia lacunae BS2T.
RunC:NO2RunC:NO2
1100limited1140non-limited
255limited12100non-limited
332.5non-limited13100non-limited
440limited14100limited
555limited1577.5limited
670limited1610limited
710non-limited1710non-limited
877.5non-limited1832.5limited
955non-limited1910limited
1070non-limited
C:N = carbon to nitrogen ratio.
Table 3. Average polyhydroxyalkanoate concentrations and yields.
ConcentrationYield
MethodCrotonic acidHPLCHPLCCrotonic acidHPLC
Parameter3HB (g/L)3HB (g/L)3HV (g/L)3HB (%wt.wt.)3HV+3HV (%wt.wt.)
O2 limited2.63 ± 0.650.078 ± 0.0100.070 ± 0.019272 ± 57.715.4 ± 2.36
O2 not limited2.80 ± 0.660.077 ± 0.0100.066 ± 0.013250 ± 98.212.4 ± 2.26
3HB = 3-hydroxybutyrate, 3HV = 3 hydroxyvalerate, HPLC = high-pressure liquid chromatography.
Table 4. Comparison of real and synthetic hydrolysates of Canola fines.
Real (n = 3)Synthetic
ParameterWhole Sample Filtrate
Total organic carbon (g/L)86.0 ± 2.1968.6 ± 9.338.88
Glucose (g/L)-7.7 ± 0.116.00
Cellobiose (g/L)-7.6 ± 0.024.00
Xylose (g/L)-9.9 ± 0.0710.0
Arabinose (g/L)-5.6 ± 0.022.00
Volatile organic acids (g/)-4.33 ± 0.71-
Total phosphorus (mg/L-P)26.5 ± 2.0023.3 ± 1.805.34
Total nitrogen (mg/L-N)68.0 ± 5.7051.5 ± 4.9016.5
Protein (g/L)1.25 ± 0.010.28 ± 0.03-
Nitrate (mg-N/L)-22.5 ± 0.7172.9
Nitrite (mg-N/L)-0.60 ± 0.00-
Ammonia (mg-N/L)-16.0 ± 11.0-
Alkalinity (mgCaCO3/L)-1572 ± 32.0-
Sulfides (mg/L-S)-1.01 ± 0.01-
C:N1265:11332:1538:1
C:N:P ratio3245:2.6:12944:2.2:11663:3.1:1
Disclaimer/Publisher’s Note: The statements, opinions and data contained in all publications are solely those of the individual author(s) and contributor(s) and not of MDPI and/or the editor(s). MDPI and/or the editor(s) disclaim responsibility for any injury to people or property resulting from any ideas, methods, instructions or products referred to in the content.