Article

Microaeration for Enhancement of Methane Productivity from Cassava Wastewater and Digestibility of Added Cassava Residue

by
Kessara Seneesrisakul
1,2,
Oijai Khongsumran
3,
Krittiya Pornmai
3,
Ee Ling Yong
4,
Malinee Leethochawalit
5 and
Sumaeth Chavadej
3,*
1
School of Engineering and Technology, Walailak University, Nakhon Si Thammarat 80160, Thailand
2
Center of Excellence on Wood and Biomaterials, Walailak University, Nakhon Si Thammarat 80160, Thailand
3
The Petroleum and Petrochemical College, Chulalongkorn University, Bangkok 10330, Thailand
4
Department of Water and Environmental Engineering, Faculty of Civil Engineering, Universiti Teknologi Malaysia, Skudai 81310, Malaysia
5
Innovative Learning Center, Srinakharinwirot University, Bangkok 10110, Thailand
*
Author to whom correspondence should be addressed.
Fermentation 2026, 12(5), 212; https://doi.org/10.3390/fermentation12050212
Submission received: 9 March 2026 / Revised: 17 April 2026 / Accepted: 23 April 2026 / Published: 25 April 2026
(This article belongs to the Special Issue Process Intensification in Microbial Biotechnology for Fermentation)

Abstract

Microaeration has been applied to enhance anaerobic digestion (AD), although the underlying mechanisms remain unclear. This work proposes that improving methanogenic activity can be achieved by alleviating micronutrient deficiencies and enhancing digestibility. The microaeration technique was employed to enhance the methanogenic activity of cassava wastewater (CW) both with and without added cassava residue (CR) and to improve CR digestibility in a continuous stirred tank reactor (CSTR) at 37 °C. The sole CW had the optimal COD loading rate of 1.71 kg/m3d. The addition of CR at 1000 mg/L to the CW resulted in the greatest methanogenic improvement of 88% compared with the sole CW and provided the greatest digestibility of CR. Under the optimal specific O2 dosage rate (3 mL/LRd), the improvements in CH4 yields were 251% and 140% in comparison to those of the sole CW and the CW with added CR, respectively. Additionally, it achieved substantial improvements in digestibility for the cellulose (59%), hemicellulose (61%), and remaining starch (67%) fractions of added CR. However, lignin degradation remained unaffected, a potential area for future optimization. This work opens new avenues for enhancing biogas production from wastewater by adding agricultural residue in conjunction with microaeration.

1. Introduction

Thailand is the world’s top exporter of cassava starch, accounting for approximately 62% (3.23 million tons) of the global market for native cassava starch and 31% (1.07 million tons) for modified cassava starch [1]. However, cassava starch production also generates substantial wastewater with high organic loading [2]. For every ton of cassava starch produced, approximately 8.4 m3 of cassava wastewater (CW) and 2.6 tons of cassava residue (CR), including wet pulp and peel, are generated [3].
Anaerobic digestion (AD) for biogas production from CW delivers a practical and sustainable solution for waste management and renewable energy generation [4]. Over the past decade, about 90% of cassava starch factories in Thailand have transitioned from fuel oil to biogas generated on-site for steam production. This shift has significantly reduced operational energy costs and dependency on imported fossil fuels [5]. While CW is readily digestible, CR represents a more complex biomass resource [6]. It comprises both readily biodegradable fractions (residual starch, cellulose, and hemicellulose) and recalcitrant components (lignin), which can lead to lower methanogenic activity than in liquid wastewaters [7,8,9].
The integration of agricultural residues into wastewater—a process known as co-digestion—has emerged as an effective approach to improving biogas productivity. Its success depends on feedstock characteristics and operational conditions, such as biomass type, dosage, temperature, and nutrient balance [10]. For instance, co-digesting food waste with cattle dung increased methane production by 41.1% compared to using sole food waste [7], while mixing food waste with rain tree leaves enhanced biogas yield by 13% [11]. Moreover, co-digestion with straw led to CH4 yield increases of 39.5% and 149.7% compared to sole food waste and straw, respectively [12]. Building on these findings, this work evaluated the co-digestion of CW and CR to provide a circular integrated solution for cassava solid waste management.
Cassava-based waste typically contains not only high organic content but also sulfur compounds and trace metals such as manganese (Mn), iron (Fe), zinc (Zn), copper (Cu), molybdenum (Mo), nickel (Ni), and cobalt (Co), which originate from cassava roots and soil. These metals are vital cofactors for methanogenic archaea but can become unavailable due to precipitation with sulfide produced under anaerobic conditions, leading to micronutrient limitations that hinder biogas production [13].
One serious problem in AD is the generation of hydrogen sulfide (H2S), resulting from the anaerobic degradation of sulfur-containing organic compounds and the biological reduction of sulfate [14]. The produced H2S exists in both water-soluble (ionized) and water-insoluble (unionized or free acid) forms, depending on the system pH. As the solution pH increases, the proportion of the ionized form also rises, causing both greater contents of HS and S2− in the solution or a higher H2S solubility. Conversely, the lower the system pH, the higher the portion of created H2S in the free acid form (unionized form), causing a larger portion of created H2S to partition in the gaseous phase (produced biogas) [15,16]. At neutral pH, the ratio of unionized to ionized forms is approximately unity [17]. Equations (1) and (2) show the dissociation of H2S as ionization equilibrium reactions [16].
H 2 S H S   +   H +     p K a 1     7.0
H S S 2   +   H +     p K a 2     12
Both the ionized forms of HS and S2− can effectively react with micronutrients, mostly in divalent cations, to form various metal sulfide precipitates, leading to a deficit of some micronutrients for AD, as shown in Equations (3) and (4) [18,19,20].
2 H S   +   M 2 + M ( H S ) 2
S 2   +   M 2 + M S
From the values of the solubility product constant (Ksp), H2S mostly dissociates to S2−, leading to the prominence of metal sulfide (MS) precipitates. Consequently, some micronutrients can be deficient in AD. Hence, it is of great interest to develop any new approach to prevent micronutrient insufficiency, resulting in the improvement of methanogenic activities of wastewaters and/or cellulosic materials, as well as in the increase of the digestibility of added cellulosic materials.
Microaeration is the controlled addition of oxygen (O2) to eliminate sulfide in the system, thereby preventing micronutrient deficiency. Under microaerobic conditions, sulfide-oxidizing bacteria convert HS into elemental sulfur (S0). This is because, under microaeration conditions, water-soluble sulfides have strong affinities for O2, leading to the predominant reactions of biological sulfide oxidation to elemental sulfur, as indicated in Equation (5) [21,22].
H S + 1 2 O 2 S 0 + O H
This chemical reaction lowers the sulfide levels and helps prevent micronutrient precipitation, thereby remains supporting microbial activity and enhancing the biodegradability of added residues [19]. However, excessive O2 can lead to further oxidation of H2S to sulfate (SO42−), as shown in Equation (6) [21].
H 2 S + 5 2 O 2 S O 4 2 + H 2 O
Moreover, in the presence of high O2 levels, facultative anaerobes switch to aerobic metabolism, and strictly anaerobic methanogens may be inactivated or killed by O2 toxicity [23].
The augmentation of the methanogenic productivity of CW by microaeration was first reported by our research group [24]. Later, the microaeration process was tested with several wastewaters and cellulosic materials, including municipal solid waste [25,26], Napier grass [27], wheat straw [28], cellulose [29], and corn straw [30,31]. However, these investigations were limited to batch experiments. In contrast, this investigation implements microaeration in a continuous stirred-tank reactor (CSTR), a more industrially relevant mode. Continuous AD systems involve complex microbial dynamics and are sensitive to long-term operational conditions. Factors such as hydromechanical behavior, mass transfer efficiency, and microbial adaptation differ markedly between batch and continuous systems [32]. Thus, exploring the effects of microaeration in a continuous AD setup provides a more comprehensive understanding of its practical viability.
This research hypothesizes that microaeration can improve the methanogenic activity of CW co-digested with CR by mitigating micronutrient deficiencies and enhancing CR digestibility. The novelty of this work lies in its continuous operation mode, which more closely reflects real-world behavior in biogas production systems. Moreover, under the optimal COD loading rate of CW with and without the best addition of CR, the O2 rate was varied. At the same time, both the concentrations of O2 in the water and gaseous phases were monitored to ensure proper O2 supply, as indicated by the absence of O2 in both phases, to correlate methanogenic activity and digestibility of the added CR with O2 dosage.

2. Materials and Methods

2.1. Seed Sludge, Cassava Wastewater (CW), and Cassava Residue (CR)

CW, CR, and seed sludge were provided by Chokchai Starch Co., Ltd., Uthai Thani, Thailand. Both CW and CR samples were filtered via 0.2-mm and 1-mm sieves, respectively, to remove sand, fiber, and coarse particles. The filtered CR sample was dehydrated at 105 °C, milled, and then sieved through a 60-mesh screen (particle size > 250 μm). Both the sieved CW and prepared CR samples were kept at around 4 °C until use. The dark-colored seed sludge, with initial mixed liquor suspended solids (MLSS) of about 9000 mg/L and initial mixed liquor volatile suspended solids (MLVSS) of about 8900 mg/L, was loaded into a bioreactor at the experimental start-up step.

2.2. CSTR Setup and Operation

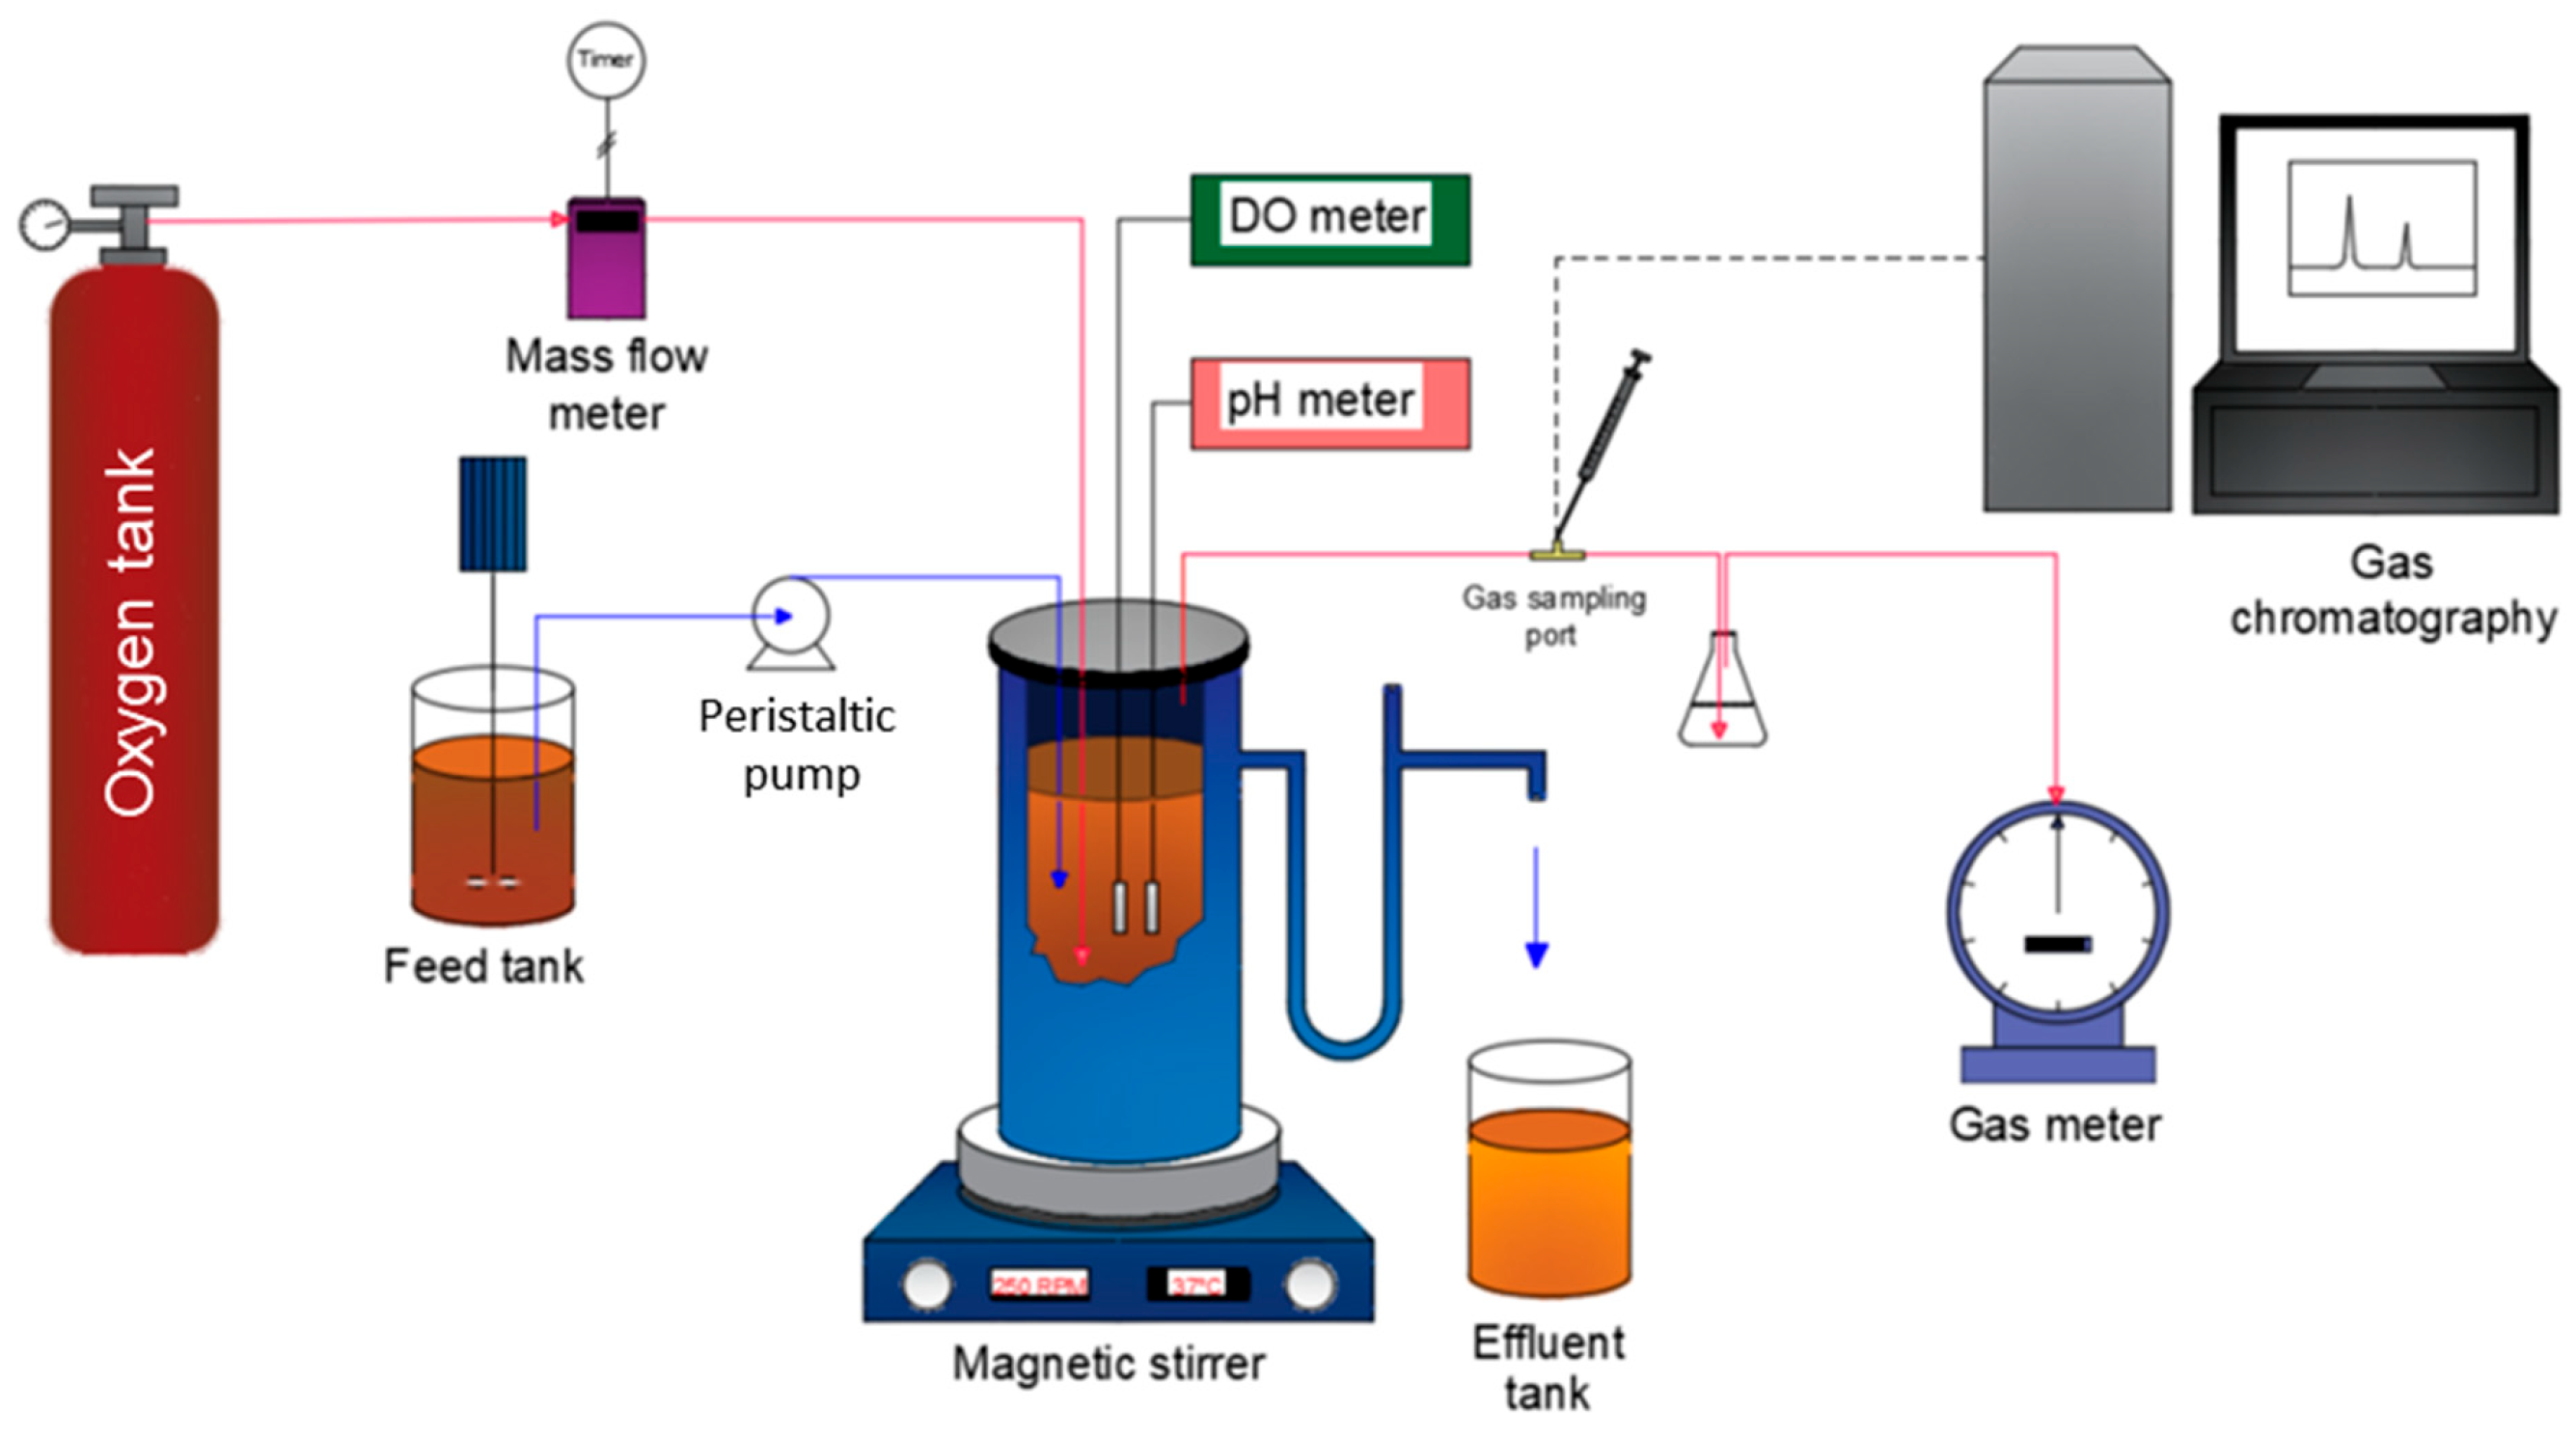
The schematic of a continuous CSTR system used in this study is demonstrated in Figure 1. The CSTR with a liquid holding capacity of 4 L was made from an opaque PVC pipe and plate to suppress the photosynthesis activity of bacteria [24]. The CSTR system was continuously stirred at 400 rpm using a magnetic stirrer to ensure homogeneous mixing, and the inside bioreactor’s temperature was maintained at 37 °C by a temperature controller equipped with a temperature probe. The solution pH values were monitored by an online pH meter (Eutech ECFG7350401B, Singapore). CW with or without added CR was fed continuously to the top of the CSTR using a peristaltic pump (Longer, BT100-3J, Baoding, China) to achieve any controlled chemical oxygen demand (COD) loading rate.
For the first experimental set, the CSTR unit was continuously fed with CW without added CR at different COD loading rates (0.60–2.50 kg/m3d). The feed containing CW was well mixed using an overhead mixer. For any given COD loading rate, the system was allowed to attain stable or steady-state conditions, taking about four weeks. The steady-state conditions were justified when both the effluent COD values and biogas generation rates were invariant with time. For each given COD loading rate studied under steady-state conditions, both specimens of effluents and the produced biogas were preserved for chemical analyses and measurements.
For the second experimental set, under the optimal COD loading rate of the sole CW obtained from the first experimental set, CR was added in different quantities (0–1500 mg/L). The CW and CR were also mixed homogenously. Similarly, for any amount of added CR, the system was allowed to function for around four weeks to attain steady-state conditions before reserving both the samples of effluents and produced biogas for chemical analysis and measurement.
For the microaeration experiments, the two systems of the sole CW beneath its own optimal COD loading rate and the CW with added CR under the optimal COD loading rate of CW and the optimal amount of added CR were supplied with oxygen (O2) at various specific O2 dosage rates (0–6 mL O2/LRd). The O2 flow rate was regulated by a mass flow controller (Aalborg, Orangeburg, SC, USA). For each studied specific O2 dosage rate, the dissolved oxygen (DO) levels inside the bioreactor were monitored online using a DO meter (Lutron, DO-5512SD, Taipei, Taiwan). In the same manner, for each specific O2 dosage rate, the system was allowed to approach a steady-state condition before reserving both the effluent and produced biogas samples for chemical analysis and measurement. Beyond the optimal specific O2 dosage rate, the COD reduction, biogas generation rate, and CH4 yields declined sharply, approaching zero, indicating system failure. Hence, all the experiments were terminated.

2.3. Measurements and Analytical Methodology

The cumulative volume of biogas generated in the CSTR was measured daily using a gas meter (Ritter, TGO5/5, Schwabmünchen, Germany). The chemical constitution of generated biogas (CH4, CO2, H2, and O2) was examined daily using a gas chromatography (GC) (PerkinElmer, AutoSystem, Waltham, MA, USA) connected to a thermal conductivity detector in conjunction with two packed columns (HayeSep D 100/120 mesh and Molecular Sieve, Altech, Deerfield, IL, USA) in series. Ar was used as a carrier gas. The temperatures of the injector, column, and detector were fixed at 150, 60, and 200 °C, respectively. The H2S content in the produced biogas was separately examined using another GC (Shimadzu, GC-2014, Kyoto, Japan), equipped with a flame photometric detector and a capillary column (Agilent, DB-1, Santa Clara, CA, USA). The temperatures of the injector, column, and detector were fixed at 100, 80, and 250 °C, respectively.
The COD measurements of the feed and effluent specimens were conducted by dichromate oxidation and the absorbance measurement technique using a COD digester (HACH, DRB 200, Loveland, CO, USA) and a spectrophotometer (HACH, DR2700, Loveland, CO, USA) [33].
The DO level in the CSTR was monitored daily using a DO meter (Lutron, DO-5512SD, Taipei, Taiwan).
The total quantity of produced volatile fatty acids (VFAs) was analyzed by steam distillation and titration with NaOH [33]. The chemical constitutions of VFAs in effluent and feed specimens were measured by a GC (Perkin-Elmer, Autosystem, Waltham, MA, USA) connected to a DB-WAXetr column and a flame ionization detector. The injection port, column, and detector temperatures were regulated at 250, 180, and 270 °C, respectively.
The total nitrogen (N), NO3-N, NO2-N, and NH4+-N contents were determined using persulfate digestion, cadmium reduction, diazotization procedures, and salicylate, respectively. The total P content was analyzed using the molybdovanadate/acid persulfate digestion technique (Hach Company, Loveland, CO, USA).
The total suspended solids (TSS) and total volatile suspended solids (VSS) in the effluent samples, signifying the mixture of microbial and organic washout from the CSTR system, were quantified according to standard methods [34].
The total alkalinity values of feed and effluent specimens were measured by titration with H2SO4 [34].
The chemical constitutions of the CR and filtered effluent specimens at different dosages were measured for extractives, starch, cellulose, hemicellulose, and lignin [6]. The specimens were first filtered and then dehydrated at 105 °C to remove moisture. Each dried sample was initially analyzed for the extractives fraction by adding 60 mL of acetone to 1 g of the dried sample and incubating at 90 °C for 2 h. After that, the mixture was filtered, and the remaining solids on the filter paper were then dried at 105 °C. The weight loss represented the extractive fraction of the sample. For the determination step of the hemicellulose fraction, 10 mL of a 0.5 M NaOH solution was mixed with 1 g of the dried extractives-free sample, and then the mixture was kept at 80 °C for 3.5 h. After that, the mixture was filtered using filter paper. The undissolved solids fraction was rinsed several times with deionized (DI) water to eliminate the remaining NaOH, and then the sample was dried at 105 °C to obtain a constant weight. The weight loss in the NaOH dissolution step signified the portion of hemicellulose and starch. For the determination step of starch fraction, the filtrate obtained from the NaOH dissolution step was analyzed for starch using a starch test kit (Sigma-Aldrich, St. Louis, MO, USA). For the analysis step of lignin content, 30 mL of a 72% H2SO4 reagent was added to the extractive-free dried sample. The mixture was first preserved at 8–15 °C for 24 h, and then, it was boiled at 100 °C for 1 h. Next, the mixture was filtered and washed several times with DI water. The residue finally dried at 105 °C to obtain a constant weight, which designates the lignin fraction. The cellulose content was calculated by mass balance of all chemical composition fractions [35].
Moreover, the elemental compositions of the CR in feed and effluent specimens from the CSTR at different COD loading rates, any quantities of added CR, and different specific O2 dosage rates were also measured by a CHNS/O analyzer (Leco, TruSpec@ Elemental Determinator, Saint Joseph, MI, USA). The values of acidity and total alkalinity were determined by titration methods with a standard NaOH solution and a standard H2SO4 solution, respectively.
The average analytical and measured values from at least triplicates were used to assess the efficacy of the CSTR system operated under different conditions, as expressed in COD reduction efficiency, biogas generation rate, CH4 generation rate, CH4 yield repressed in either the quantity of CH4 produced per g of COD applied or removed, total and composition of produced VFAs, solution pH, acidity, total alkalinity, and CR degradability.

3. Results and Discussion

3.1. Chemical Characteristics of CW and CR

As exposed in Table 1, the organic compounds in the CW are mostly in colloidal and soluble forms. The nitrogen content in the CW was mainly in organic form. The COD:N:P ratio was 100:2.5:0.8, reflecting that the CW provided adequate quantities of both N and P for AD (theoretical ratio COD:N:P = 100:2:0.4) [13]. Table 2 illustrates the chemical characteristics of the CR, which mostly consisted of organic compounds. The COD:N:P ratio of the CR was 100:3.8:0.5, showing that the CR also had adequate amounts of both N and P for AD. As displayed in Table 2, the main elemental compositions of the CR are O and C, supporting the dominance of organic compounds in the CR. The ranking order of the elements in the CR was O > C >> H >> N >> S. Table 2 also reveals the lignocellulosic composition of the CR used in this study. It had the highest fraction of the remaining starch. The ranking order of the CR composition was starch >> hemicellulose > cellulose >> extractives > lignin, reflecting that the CR was a favorable raw material for biogas production.

3.2. Impacts of COD Loading Rate on the Process Efficacy of CSTR Treating the Sole CW

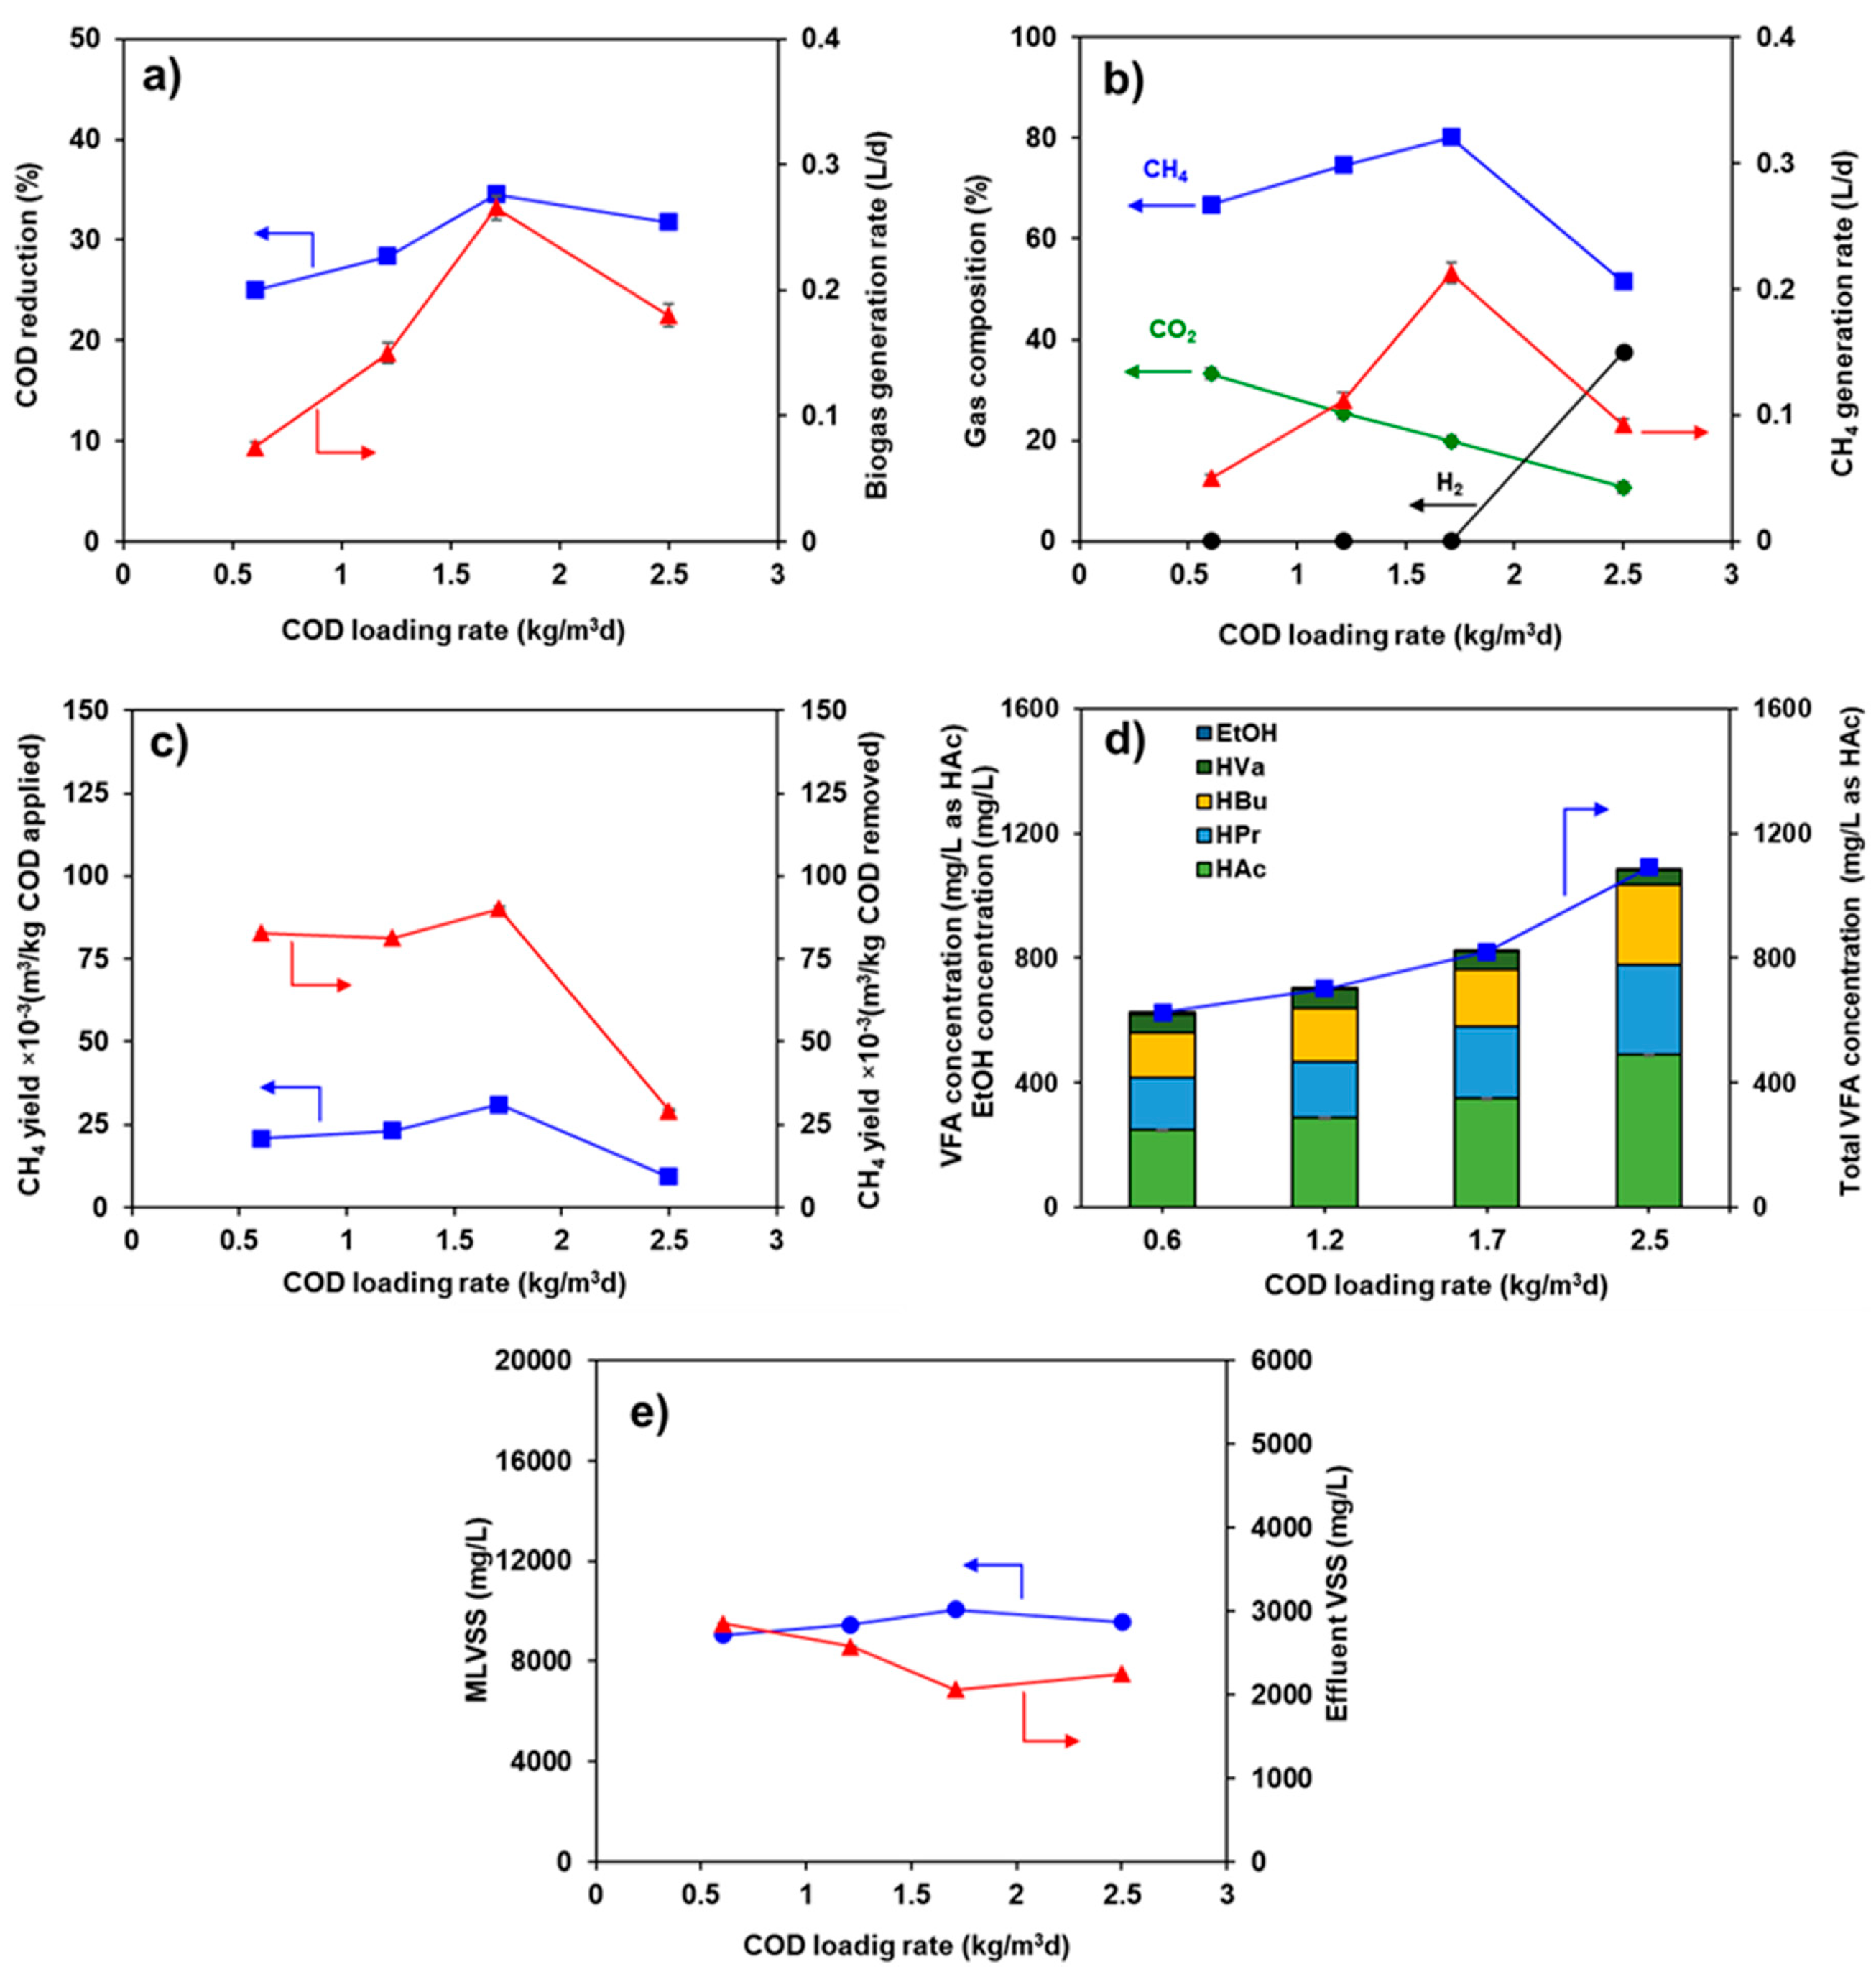
The outcomes of the COD loading rate on the system efficacy of the CSTR treating CW without added CR and microaeration are displayed in Figure 2. As depicted in Figure 2a, the system productivity in terms of COD reduction and biogas generation rate was intensified sharply with augmenting COD loading rate, and they reached the peak levels of 35% and 0.27 L/d, respectively, at a COD loading rate of 1.71 kg/m3d. Beyond the optimal COD loading rate (1.71 kg/m3d), both the COD reduction efficiency and biogas generation rate dropped considerably with further enlargement of the COD loading rate. The initial increase in both the COD reduction level and the biogas generation rate resulted from greater availability of organic compounds to support microbial growth and methanogenic activity. Conversely, the overload negatively affected methanogens due to VFA accumulation in the system, as elucidated experimentally below.
As illustrated in Figure 2b, both contours of the CH4 generation rate and concentration in the created gas established similar patterns to those of the COD reduction and biogas generation rate. A maximum CH4 concentration of 80% was observed at a COD loading rate of 1.71 kg/m3d, corresponding to H2S level of 0.21%. Conversely, the CO2 level in the produced gas dropped linearly as the COD loading rate was enlarged throughout the investigated range. Remarkably, the H2 content was zero at a COD loading rate in the range of 0.60–1.71 kg/m3d, and it elevated sharply to attain the highest value of 38% at the greatest COD loading rate of 2.50 kg/m3d. The results indicated that at low COD loading rates below 1.71 kg/m3d, the methanogenic step was predominant, resulting in a high CH4 portion in the produced gas, with complete H2 uptake to produce CH4. The reduction in CH4 content in the generated gas and the increase alongside the rise in H2 level with an enlargement as the COD loading rate increased beyond 1.71 kg/m3d, reflecting a disruption in the metabolic equilibrium. According to the biochemical pathways for polysaccharide digestion outlined by Jiraprasertwong et al. (2019) [13], the efficient conversion of substrate to CH4 relies on the syntrophic relationship between acidogens and methanogens. At higher COD loading rates, the shorter generation time of acidogens allows them to out-proliferate the slower-growing methanogens. As the loading increases, the acidogens produce H2 and VFAs faster than the methanogens can consume them [13]. In this study, the elevated H2 levels and decreased CH4 portion beyond the optimal loading rate suggest that the rate of acid production exceeded the consumption capacity of the methanogenic archaea. This kinetic mismatch serves as a functional boundary for the system, indicating the point where the reactor transitions from a stable methanogenic environment toward potential acidification.
The CH4 yields, based on both applied and removed COD, as a function of COD loading rate, are shown in Figure 2c. They exhibit alike shapes to those of COD reduction and CH4 content, in which they slightly stepped up to reach the peaks at the COD loading rate of 1.71 kg/m3d, yielding 0.031 m3 CH4/kg COD applied or 0.090 m3 CH4/kg COD removed. Then, they dropped abruptly with further elevating COD beyond 1.71 kg/m3d, consistent with Figure 2a,b. The decline in process performance with increasing COD loading rate beyond the optimal COD loading rate was stemmed by the inhibitory effect of the VFAs buildup, as detailed in the following section.
The total quantity and constitution of produced VFAs in the CSTR system treating the sole CW in relation to the COD loading rate are revealed in Figure 2d. The total amount of produced VFAs was enlarged slightly with elevating COD loading rate from 0.6 to 1.71 kg/m3d, but it was significantly stepped up with an additional augmenting COD loading rate from 1.71 to 2.50 kg/m3d. The present outcomes indicate that the inhibitory level of VFAs on methanogens was 820 mg/L as HAc. For any studied COD loading rate, the main produced VFAs were acetic acid (HAc), followed by propionic acid (HPr), butyric acid (HBu), and valeric acid (HVa) with a small quantity of ethanol (EtOH). The high HAc levels relative to other VFAs suggest that while the hydrolytic and acidogenic stages were highly active, the subsequent acetoclastic methanogenesis—the conversion of HAc to CH4—became the rate-limiting step as the loading rate increased. The accumulation of HAc specifically indicates that the system’s buffering capacity was challenged by the rapid conversion of cassava starch into acetate, which outpaced the methanogens’ ability to process it [13]. The result is in good agreement with previous investigations on AD of cassava wastewater; a maximum VFA tolerance in the CH4 production tank was found at 800 mg/L as HAc, exhibiting a nearly identical distribution of VFA components [6].
As illustrated in Figure 2e, the microbial content, as indicated in MLVSS, is enlarged marginally with augmenting the COD loading rate from 0.60 to 1.71 kg/m3d, while the anaerobe washout, as indicated in VSS, followed a reverse pattern. The maximum MLVSS (10,075 mg/L) and the minimum effluent VSS (2064 mg/L) were observed at a COD loading rate of 1.71 kg/m3d, aligning with the previously observed peak process performance. However, they almost remained unchanged as the COD loading rate was further amplified beyond the optimal COD loading rate. The profiles of both the microbial concentrations in the CSTR system and in the effluent were almost invariant over the investigated COD loading rate range since the CSTR unit was operated in the low range of COD loading rates. Consequently, the observed decline in CH4 production at higher loading rates was likely due to metabolic imbalances and kinetic limitations—as previously discussed in relation to the acidogenic shift—rather than to physical loss of microbial cells (washout) from the system.
Based on the experimental results presented above, the optimal COD loading rate of 1.71 kg/m3d, which provided the greatest process performance, as indicated by the highest COD reduction, biogas generation rate, and CH4 production rate and yields, was selected for the next experiment on the effects of added CR.

3.3. Consequences of Added CR on the CSTR Process Efficacy Treating CW

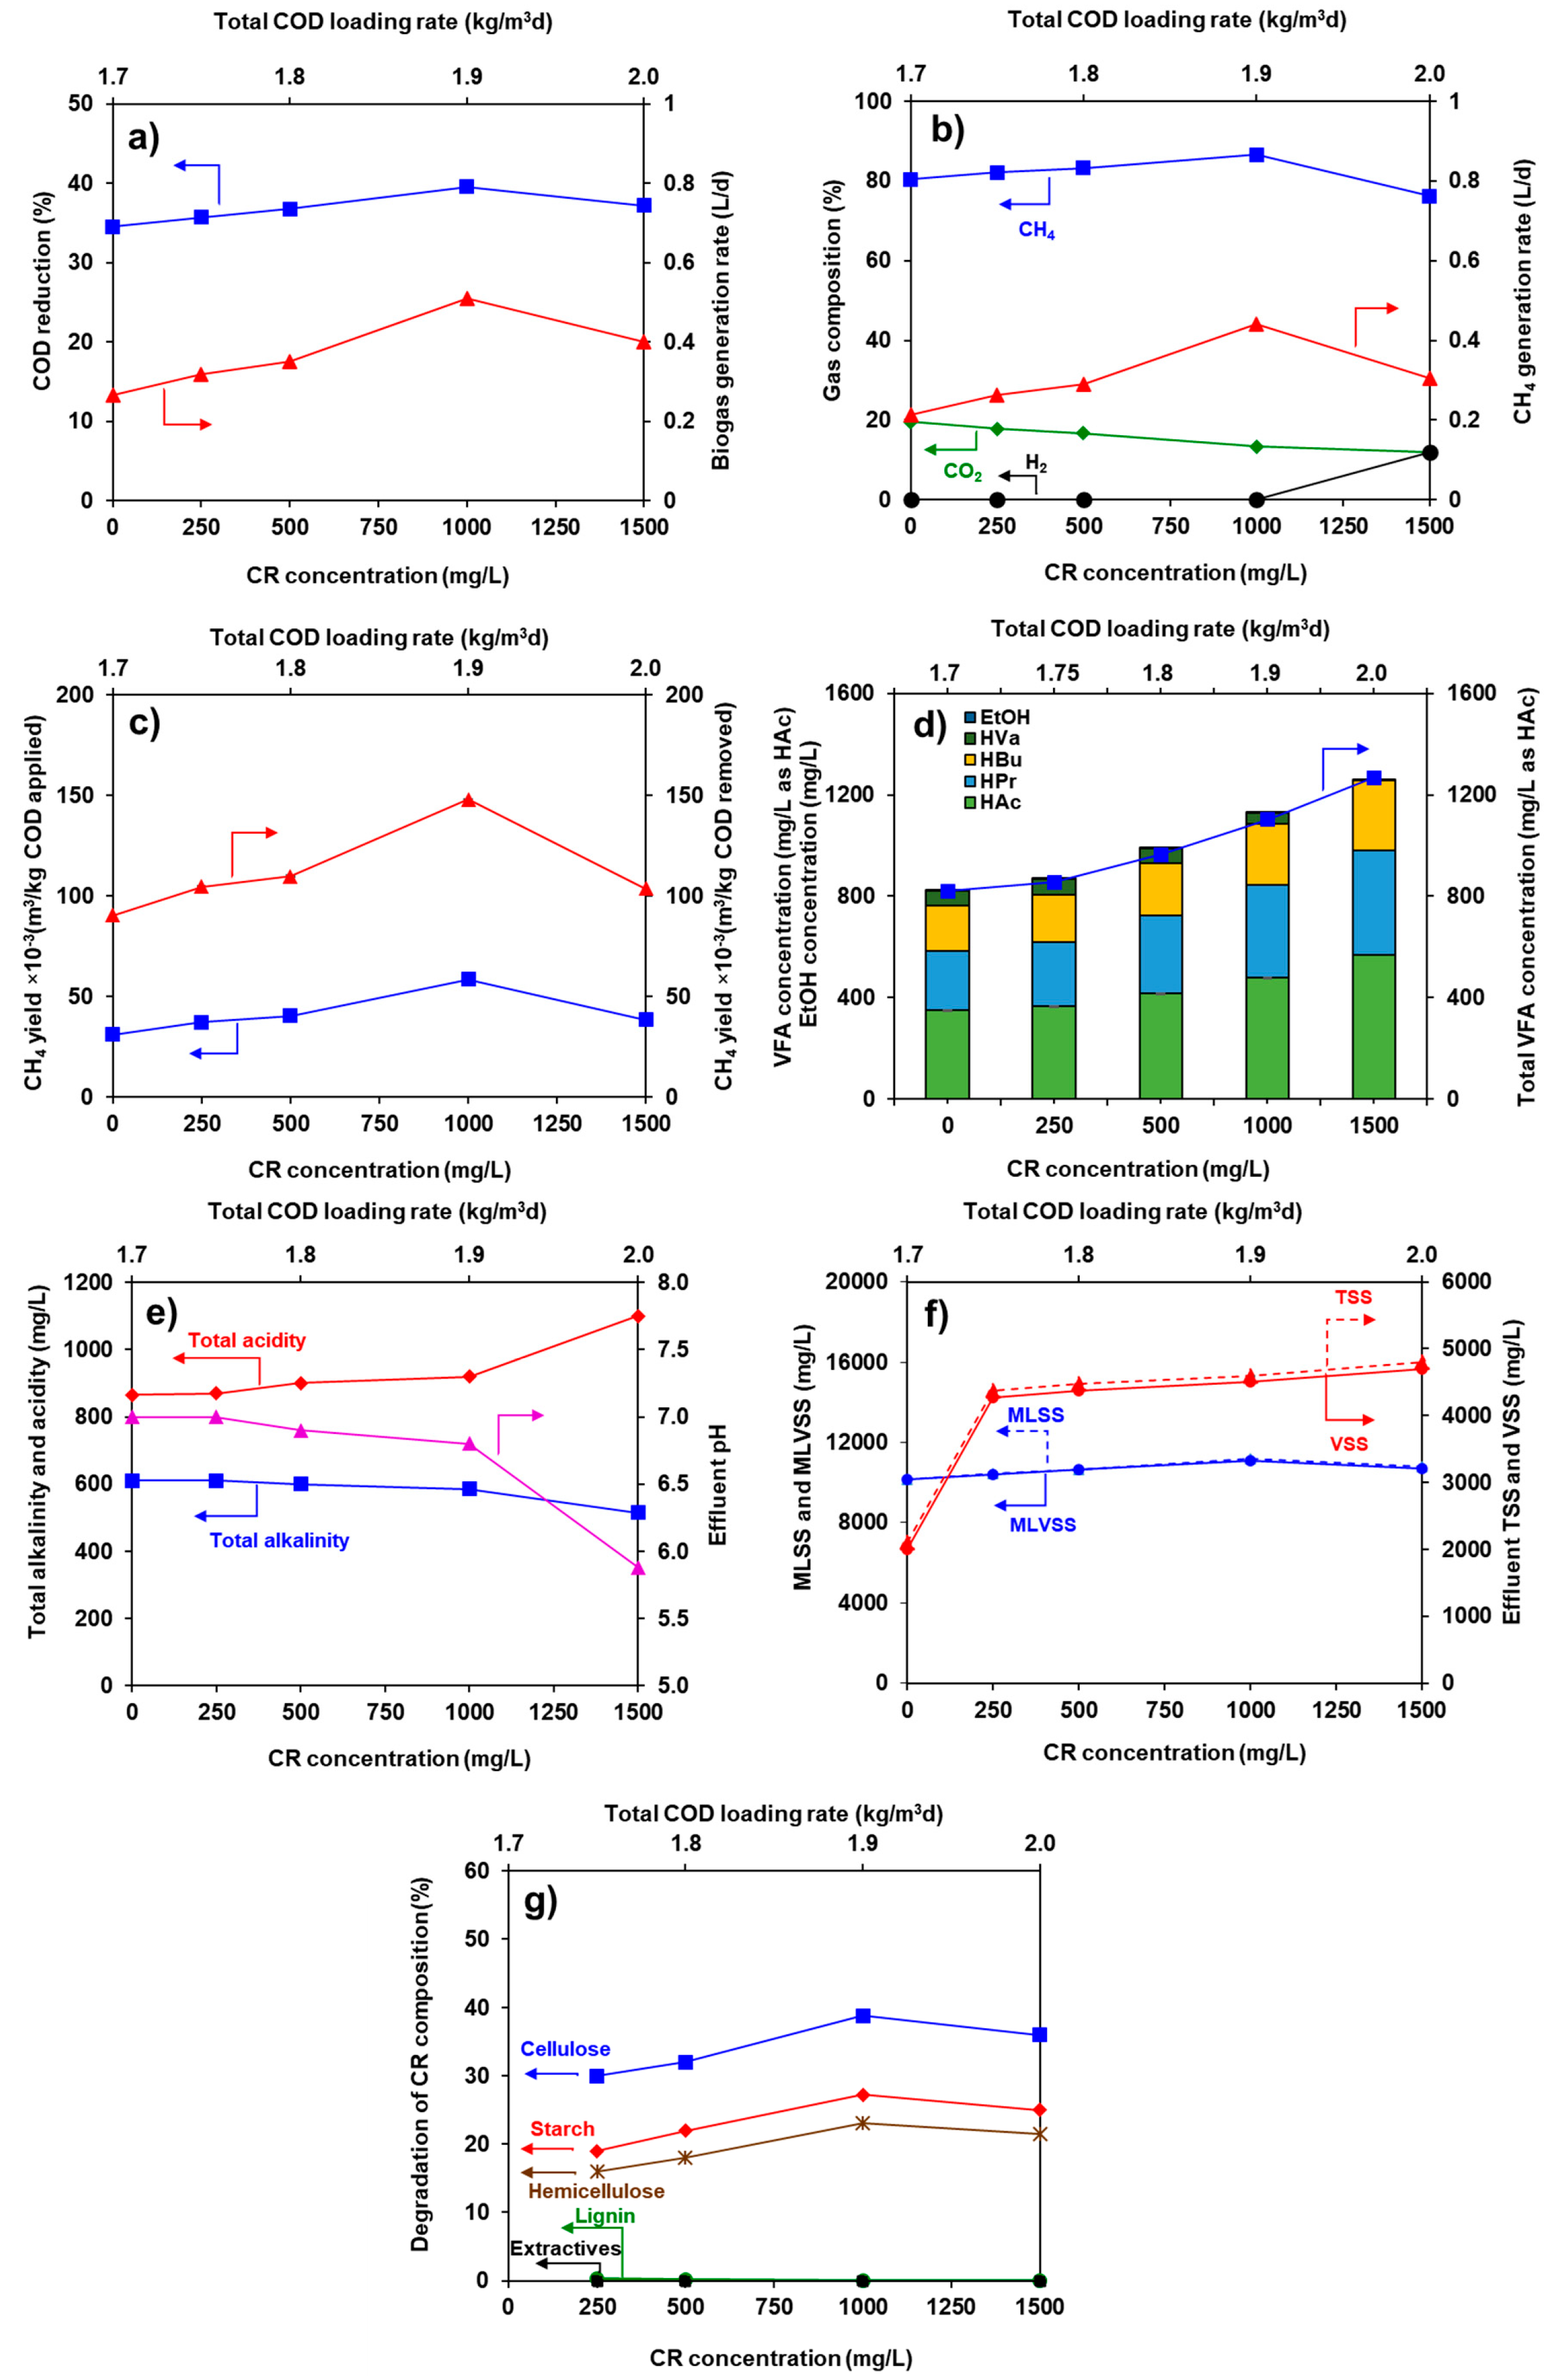
Figure 3 discloses the consequences of added CR load on the process performance of the CSTR treating CW at its own optimal COD loading rate (1.71 kg/m3d). As clarified in Figure 3a, both the COD reduction and the biogas generation rate were slightly elevated to attain the peaks of 40% and 0.51 L/d, respectively, at an added CR load of 1000 mg/L. However, they declined markedly with the enlarging load of added CR above 1000 mg/L. Beyond the increased availability of organic matter, as explained for the effect of CW loading (Section 3.2), the physical nature of CR as a lignocellulosic material also plays an important role (Table 2). At the added load of 1000 mg/L, CR provides a balanced substrate profile that stimulates hydrolytic and acidogenic activities, resulting in the observed maximum in COD reduction and biogas generation rate. However, exceeding this threshold likely might lead to mass-transfer limitations. The accumulation of undegraded fibrous components from the CR could increase the viscosity of the mixture within the CSTR, hindering effective contact between methanogens and soluble substrates. This physical interference, combined with the rapid accumulation of VFA from the starch fraction (41.05% of dried weight) of the CR, explains the sharp decline in process efficacy at higher residue loadings [6].
The CH4 production rate and the chemical constitution of the biogas produced at different loads of added CR in the CSTR treating CW at its optimal COD loading rate (1.71 kg/m3d) are illustrated in Figure 3b. The outlines of the CH4 generation rate and CH4 concentration were analogous to those observed for COD reduction and the biogas generation rate. A maximum CH4 concentration of 87% was achieved at an added CR of 1000 mg/L, while the H2S concentration was measured at 0.28%. Meanwhile, the CO2 content tended to decrease slightly and linearly with an increase in the quantity of added CR in the studied range. Notably, the H2 concentration remained near zero over the range of added CR content from 0 to 1000 mg/L; however, it appeared at 1000 mg/L of added CR and rose sharply to 12% as the CR content was further increased to 1500 mg/L. The explanation for this change in biogas composition is consistent with the effects observed during CW loading (Section 3.2). Specifically, the rise in H2 concentration at the expense of CH4 suggests that, beyond a CR addition of 1000 mg/L, VFA accumulation occurs, making the acidogenic step predominant while the methanogenic step declines in activity [36]. Figure 3c reveals the CH4 yields as a function of the added CR load in the CSTR system. The CH4 yields increased almost linearly, reaching their peaks of 0.059 m3/kg COD applied or 0.148 m3/kg COD removed at the added CR load of 1000 mg/L. Conversely, they declined markedly as the added CR load was further augmented from 1000 to 1500 mg/L. The results of the CH4 yields will be elucidated in conjunction with all other process parameters later. Under the optimal load (1000 mg/L) of the added CR to the CW, the CH4 yield (based on COD applied) was increased by about 88%, as compared to that of the sole CW (see Figure 3c). The present results of the co-digestion of CW and CR showed the CH4 yields greater than those of straw with food waste, rain tree leaves with food wastewater, and food waste with cattle manure (13–41.1%) [7,11,12].
The total amount and chemical components of generated VFAs in relation to added CR load are elucidated in Figure 3d. The total concentration of produced VFAs increased steadily with the added CR load to gain the highest level at the greatest added CR load of 1200 mg/L. The concentration ranking of produced VFAs was HAc > HPr > HBr >> HVa with trace amounts of EtOH detected. Notably, the addition of CR did not alter the VFA profile sequence relative to the sole CW system, indicating that the core metabolic pathways remained consistent within the range studied.
The profile of total alkalinity showed almost unchanged with an added CR load of up to 1000 mg/L (Figure 3e). Nevertheless, it declined slightly with further increasing CR load from 1000 to 1500 mg/L. Conversely, the profile of acidity exhibited a reverse trend to that of total alkalinity. Correspondingly, the pattern of system pH initially declined gradually with the addition of CR load from 0 to 1000 mg/L. It was lowered rapidly when the added CR load was further augmented from 1000 to 1500 mg/L, leading to increases in total VFAs concentration and acidity, with a reduction in total alkalinity and solution pH, as described above. This result also corresponded well with the lowering of CH4 yields when the CR load exceeded 1000 mg/L.
For any given COD loading rate, both ratios of MLSS to MLVSS in the bioreactor and TSS to VSS in the effluent were nearly unity, reflecting that both CW and CR contained mostly organic compounds (Figure 3f). Interestingly, the addition of CR at any dosage did not significantly affect microbial concentration (MLSS and MLVSS) in the bioreactor throughout the investigated range. This was due to the system being operated at the optimal COD loading rate, which was considered not a high organic load. In contrast, both marked increases in effluent VSS and TSS were observed when the added CR was increased from 0 to 250 mg/L, and they elevated slightly with further increasing beyond 250 mg/L. The results indicated that the digestibility of added CR declined significantly when the added CR was elevated beyond 250 mg/L. The results corresponded well with the VFA results. Figure 3g reveals the degradability results of different components of added CR in the CSTR operated under the fixed COD loading rate (1.71 kg/m3d) of CW with varying loads of added CR, as compared to those in the feed. For any given amount of added CR, neither the extractives nor lignin was degraded under anaerobic conditions. The degradation rates of cellulose, hemicellulose, and starch fractions, calculated from the differences between those in the feed and in the effluent, showed similar trends, in which they increased gradually to attain the highest degradation levels as the added CR load was enlarged from 250 to 1000 mg/L. The peak degradation efficiencies achieved for cellulose, starch, and hemicellulose were 39%, 27%, and 23%, respectively. Conversely, they declined slightly with a further addition of CR content from 1000 to 1500 mg/L. The ranking order of biodegradation of CR was cellulose >> starch > hemicellulose without the biodegradation of both lignin and extractives. These results indicated that while cellulose, hemicellulose, and starch are biodegradable, their degradation is hindered at CR loads exceeding 1000 mg/L. This decline is attributed to the inhibitory effects of increasing VFA concentrations and the resulting low solution pH (Figure 3d), which likely disrupted hydrolytic enzyme activity [6]. Furthermore, the aforementioned physical washout resulted in these biodegradable fibers being discharged from the system before hydrolysis could be completed [10].
As shown in Figure 2 and Figure 3, the added CR at the optimal concentration of 1000 m/L under the optimal COD loading rate of CW (1.71 kg/m3d) enhances the methanogenic activity by about 88% or 64%, respectively, as expressed in mL CH4/g applied COD or mL CH4/g COD removed in comparison to those of the system without added CR. The degradation of the starch, cellulose, and hemicellulose fractions of the added CR to provide additional availability of organic compounds was responsible for the improvement of the methanogenic activity of the CW. Based on these findings, the optimal CR concentration of 1000 mg/L was selected for the subsequent microaeration experiments.

3.4. Microaeration Effects on the Process Performance of CSTR Treating CW Without Added CR

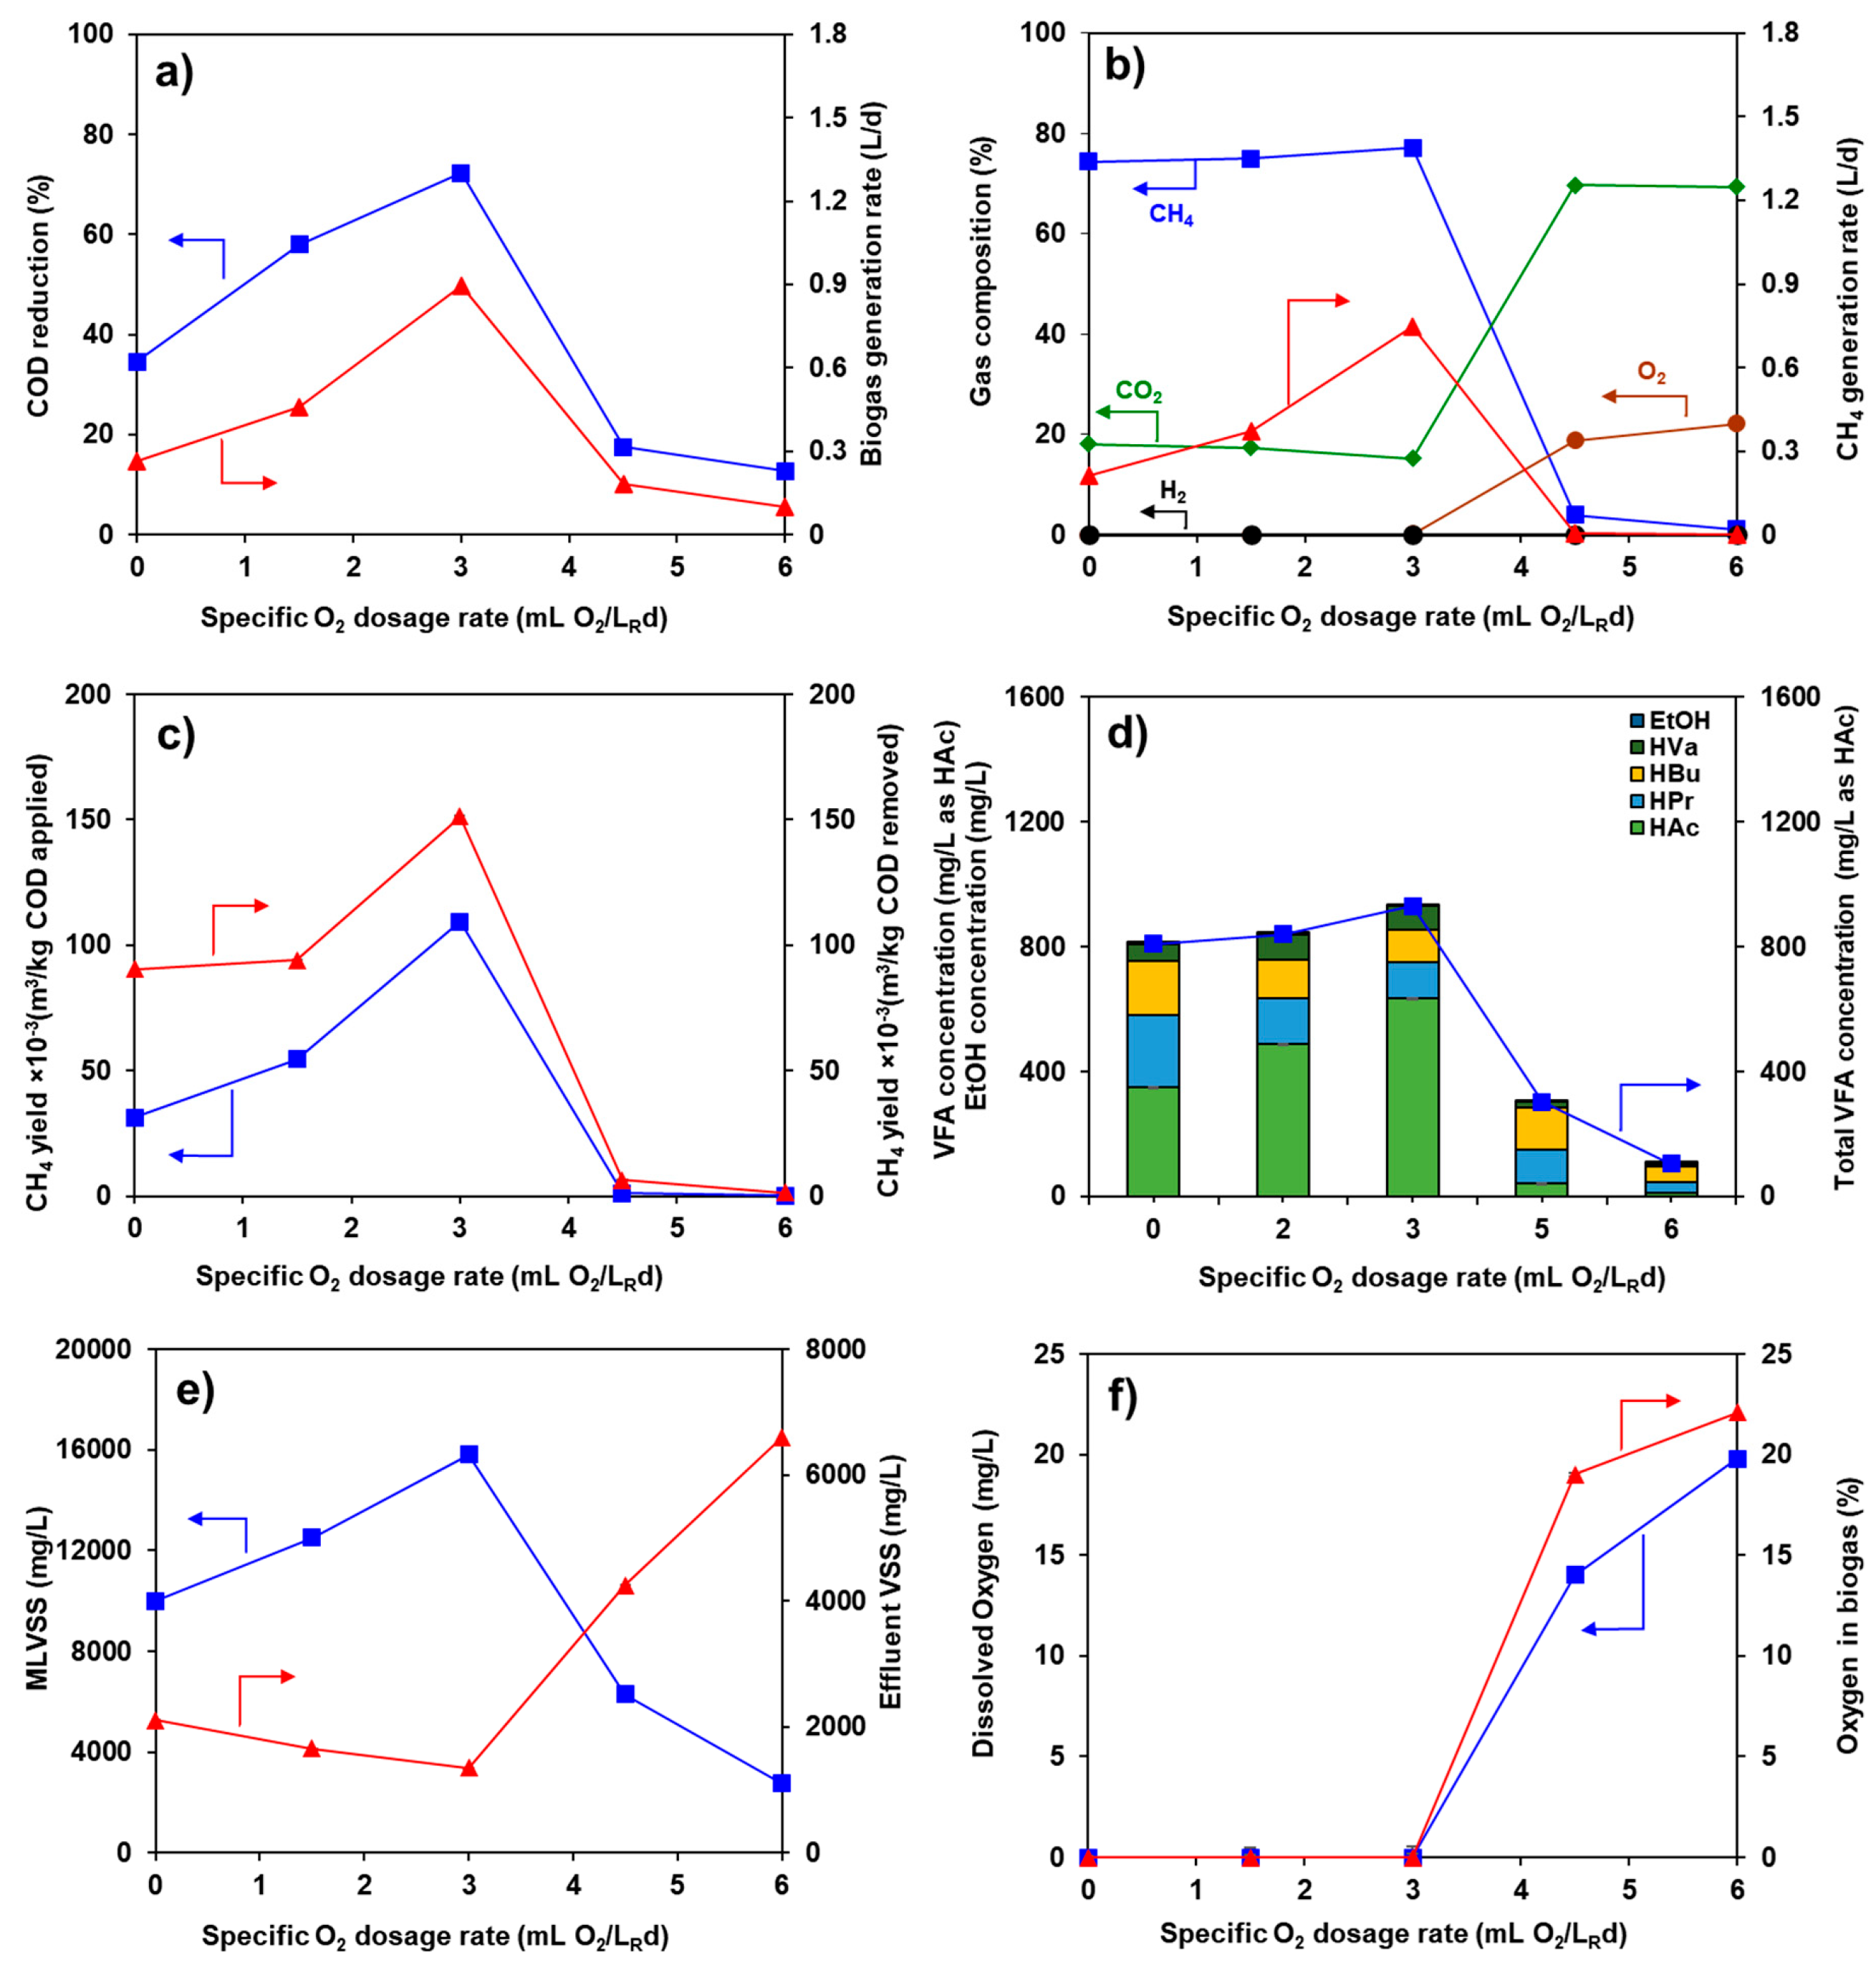
The effects of microaeration on the process performance of the CSTR treating the sole CW at the optimal COD loading rate of 1.71 kg/m3d without added CR are demonstrated in Figure 4. Both the COD reduction efficiency and the biogas generation rate were almost doubled when the specific O2 dosage rate was enlarged from 0 to 3 mL/LRd (Figure 4a). At the peak, a maximum COD reduction of 72% and a biogas generation rate of 0.90 L/d were achieved. Then, they declined substantially with further enlarging the specific O2 dosage rate from 3 to 6 mL/LRd. The initial increase in both COD reduction and the biogas generation rate suggests an increased availability of micronutrients for the anaerobes. Under limited O2 conditions, microaeration facilitates the biological and chemical oxidation of inhibitory sulfides (HS and H2S) into elemental sulfur (S0) [19]. This shift is critical because sulfides typically react with essential trace metal ions—such as Fe2+, Zn2+, Mn2+, Cu2+, Mo2+, Ni2+, and Co2+ to form highly insoluble metal-sulfide precipitates, rendering these nutrients bio-unavailable [13]. By reducing the sulfide concentration, microaeration promotes the liberation of these sequestered metals into a dissolved state, making them accessible for microbial uptake [21,22]. Given that these metals are vital co-factors for key methanogenic enzymes, their increased bioavailability directly enhances methanogenic activity and overall process stability. As a consequence, the system micronutrients became less deficit for AD, and so methanogenic activity was improved under microaeration. The presence of DO in the CSTR mixture and residual O2 in the biogas coincided with a reduction in both COD reduction and biogas generation rate. This decline, observed when the specific O2 dosage exceeded 3 mL/LRd, likely indicates O2 toxicity to methanogens. In addition, the presence of DO might lead to a change in facultative anaerobes to aerobic metabolism [23], as further elaborated below.
Figure 4b reveals the effect of microaeration on biogas constitution and CH4 production rate. The profile of the CH4 generation rate is consistent with that of the biogas generation rate. The CH4 level (74–77%) in the generated biogas remained almost unchanged within the specific O2 dosage rate range of 0–3 mL/LRd. Conversely, both the CH4 production rate and level declined sharply to approach zero as the specific O2 dosage rate increased further from 3 to 6 mL/LRd. The CO2 level in the generated gas displayed a reverse trend of the CH4 content. Notably, the O2 content in the generated biogas started to appear at the specific O2 dosage rate surpassing 3 mL/LRd, and steadily increased with the additional enlargement of the specific O2 dosage rate, corresponding to the reduction in process performance, as experimentally supported (see Figure 4a–c). Moreover, the presence of O2 in the produced biogas suggested that the excess supply of O2 had an inhibitory effect on methanogens [23,37,38], as further elucidated experimentally later. Notably, at the optimum COD rate and specific O2 dosage rate, the produced biogas was free from H2S. In contrast, in the given system at the optimal COD loading rate without microaeration, the produced biogas had 0.21% H2S, suggesting that the system sulfide was completely oxidized microbially to elemental sulfur under the optimum specific O2 dosage rate.
The CH4 yields exhibit similar trends in biogas and CH4 production rates (Figure 4c). The maximum CH4 yields of 0.109 m3 CH4/kg COD applied or 0.151 m3 CH4/kg COD removed also appeared at the optimal specific O2 dosage rate of 3 mL/LRd and, conversely, declined sharply with further enlargement of the specific O2 dosage rate greater than 3 mL/LRd. The same elucidation for the CH4 generation rate was used for the CH4 yield results. At the optimal specific O2 dosage rate, the enhancements in CH4 yields were 251% and 68% based on COD applied and removed, respectively, compared to those of the sole CW without added O2 (see Figure 2c). These enhancements, which are discussed in detail in the following sections, demonstrate the significant impact of microaeration on methanogenic efficiency.
As depicted in Figure 4d, the total concentration of produced VFAs in the CSTR enlarged slightly with increasing specific O2 dosage rate in the range of 0–3 mL/LRd. Within this range, the VFA profile followed the order: HAc >> HPr > HBu > HVa, with a very low concentration of EtOH. Notably, the steady increase in HAc concentration suggests that microaeration specifically facilitated the acidogenic conversion of substrates toward acetate. This shift is likely attributed to enhanced metabolic kinetics of facultative acidogens, directing fermentation pathways toward the production of more direct methanogenic precursors [13]. The ratios of HAc to HPr, HBu, and HVa increased concurrently with the specific O2 dosage rate up to 3 mL/LRd, but declined significantly once this threshold was exceeded. This trend reflects that limited O2 addition with completely used up could enhance all three stages of acidogenesis, acetogenesis, and methanogenesis [39]. Conversely, at specific O2 dosage rate greater than 3 mL/LRd, the VFA ranking shifted to HBu > HPr ≈ HAc coinciding with a marked reduction in methanogenic activity under aerobic breakthrough conditions. These results indicated that excess O2 (>3 mL/LRd) not only inhibited methanogenic activity but also suppressed the metabolic rate of acid-producing anaerobes (acidogens and acetogens). This suggests a potential metabolic shift: while facultative anaerobes likely transitioned to aerobic respiration, strict anaerobes—particularly methanogens—might be compromised or eliminated by O2 toxicity, as mentioned above [23].
The microbial concentration (MLVSS) in the system increased steadily approaching its maximum of 15,800 mg/L at the optimal specific O2 dosage rate of 3 mL/LRd, then dropped sharply as the specific O2 dosage rate was further increased beyond 3 mL/LRd (Figure 4e). The improvement in process productivity (COD reduction, biogas generation rate, CH4 production rate, and CH4 yields) with increasing specific O2 dosage rate in the range of 0–3 mL/LRd corresponded well to the increasing microbial concentration (MLVSS) in the CSTR, leading to increasing microbial activity. In contrast, the reduction in process performance with an additional increase in specific O2 dosage rate above 3 mL/LRd was well correlated with the reduction in microbial concentration and the increase in microbial washout (effluent VSS).
The profiles of DO in the CSTR mixture and the residual O2 content in the produced biogas were completely zero when the specific O2 dosage rates were varied in the range of 0–3 mL/LRd (Figure 4f). Beyond the specific O2 dosage rate of 3 mL/LRd, both the DO level in the CSTR mixture and the O2 content in the produced biogas increased substantially with enlarging the specific O2 dosage rate. The experimental results of COD reduction, biogas generation rate, and CH4 yields in relation to the results of the DO level in the CSTR and O2 content in the produced biogas reflected that the excess O2 supply (as indicated in both the presences of DO in the CSTR and O2 content in the produced biogas) caused severe toxicity to methanogens, leading to the drastic drop in the CH4 yields. These results indicated a metabolic shift in facultative anaerobes toward aerobic respiration in the presence of DO. The significant enhancement in process efficiency achieved by the addition of O2 under the conditions of an adequate amount with complete O2 uptake (DO = 0 mg/L and the absence of O2 in the produced biogas), known as microaeration. This process can lead to the prevention of micronutrient deficits [19] as well as the avoidance of O2 toxicity to anaerobes. As mentioned above in Equation (5), the microbial conversion of HS to S0 was directly beneficial in preventing the loss of the micronutrients (Fe2+, Co2+, Ni2+, Mn2+, Cu2+, Zn2+, Mo2+, etc.) from the chemical precipitation with sulfide ions to produce metal sulfide precipitates [14,18,19,20,40]. Consequently, ensuring micronutrient bioavailability significantly enhances CSTR performance, as pointed out above.

3.5. Microaeration Effects on the Process Performance of CSTR Treating CW with Added CR

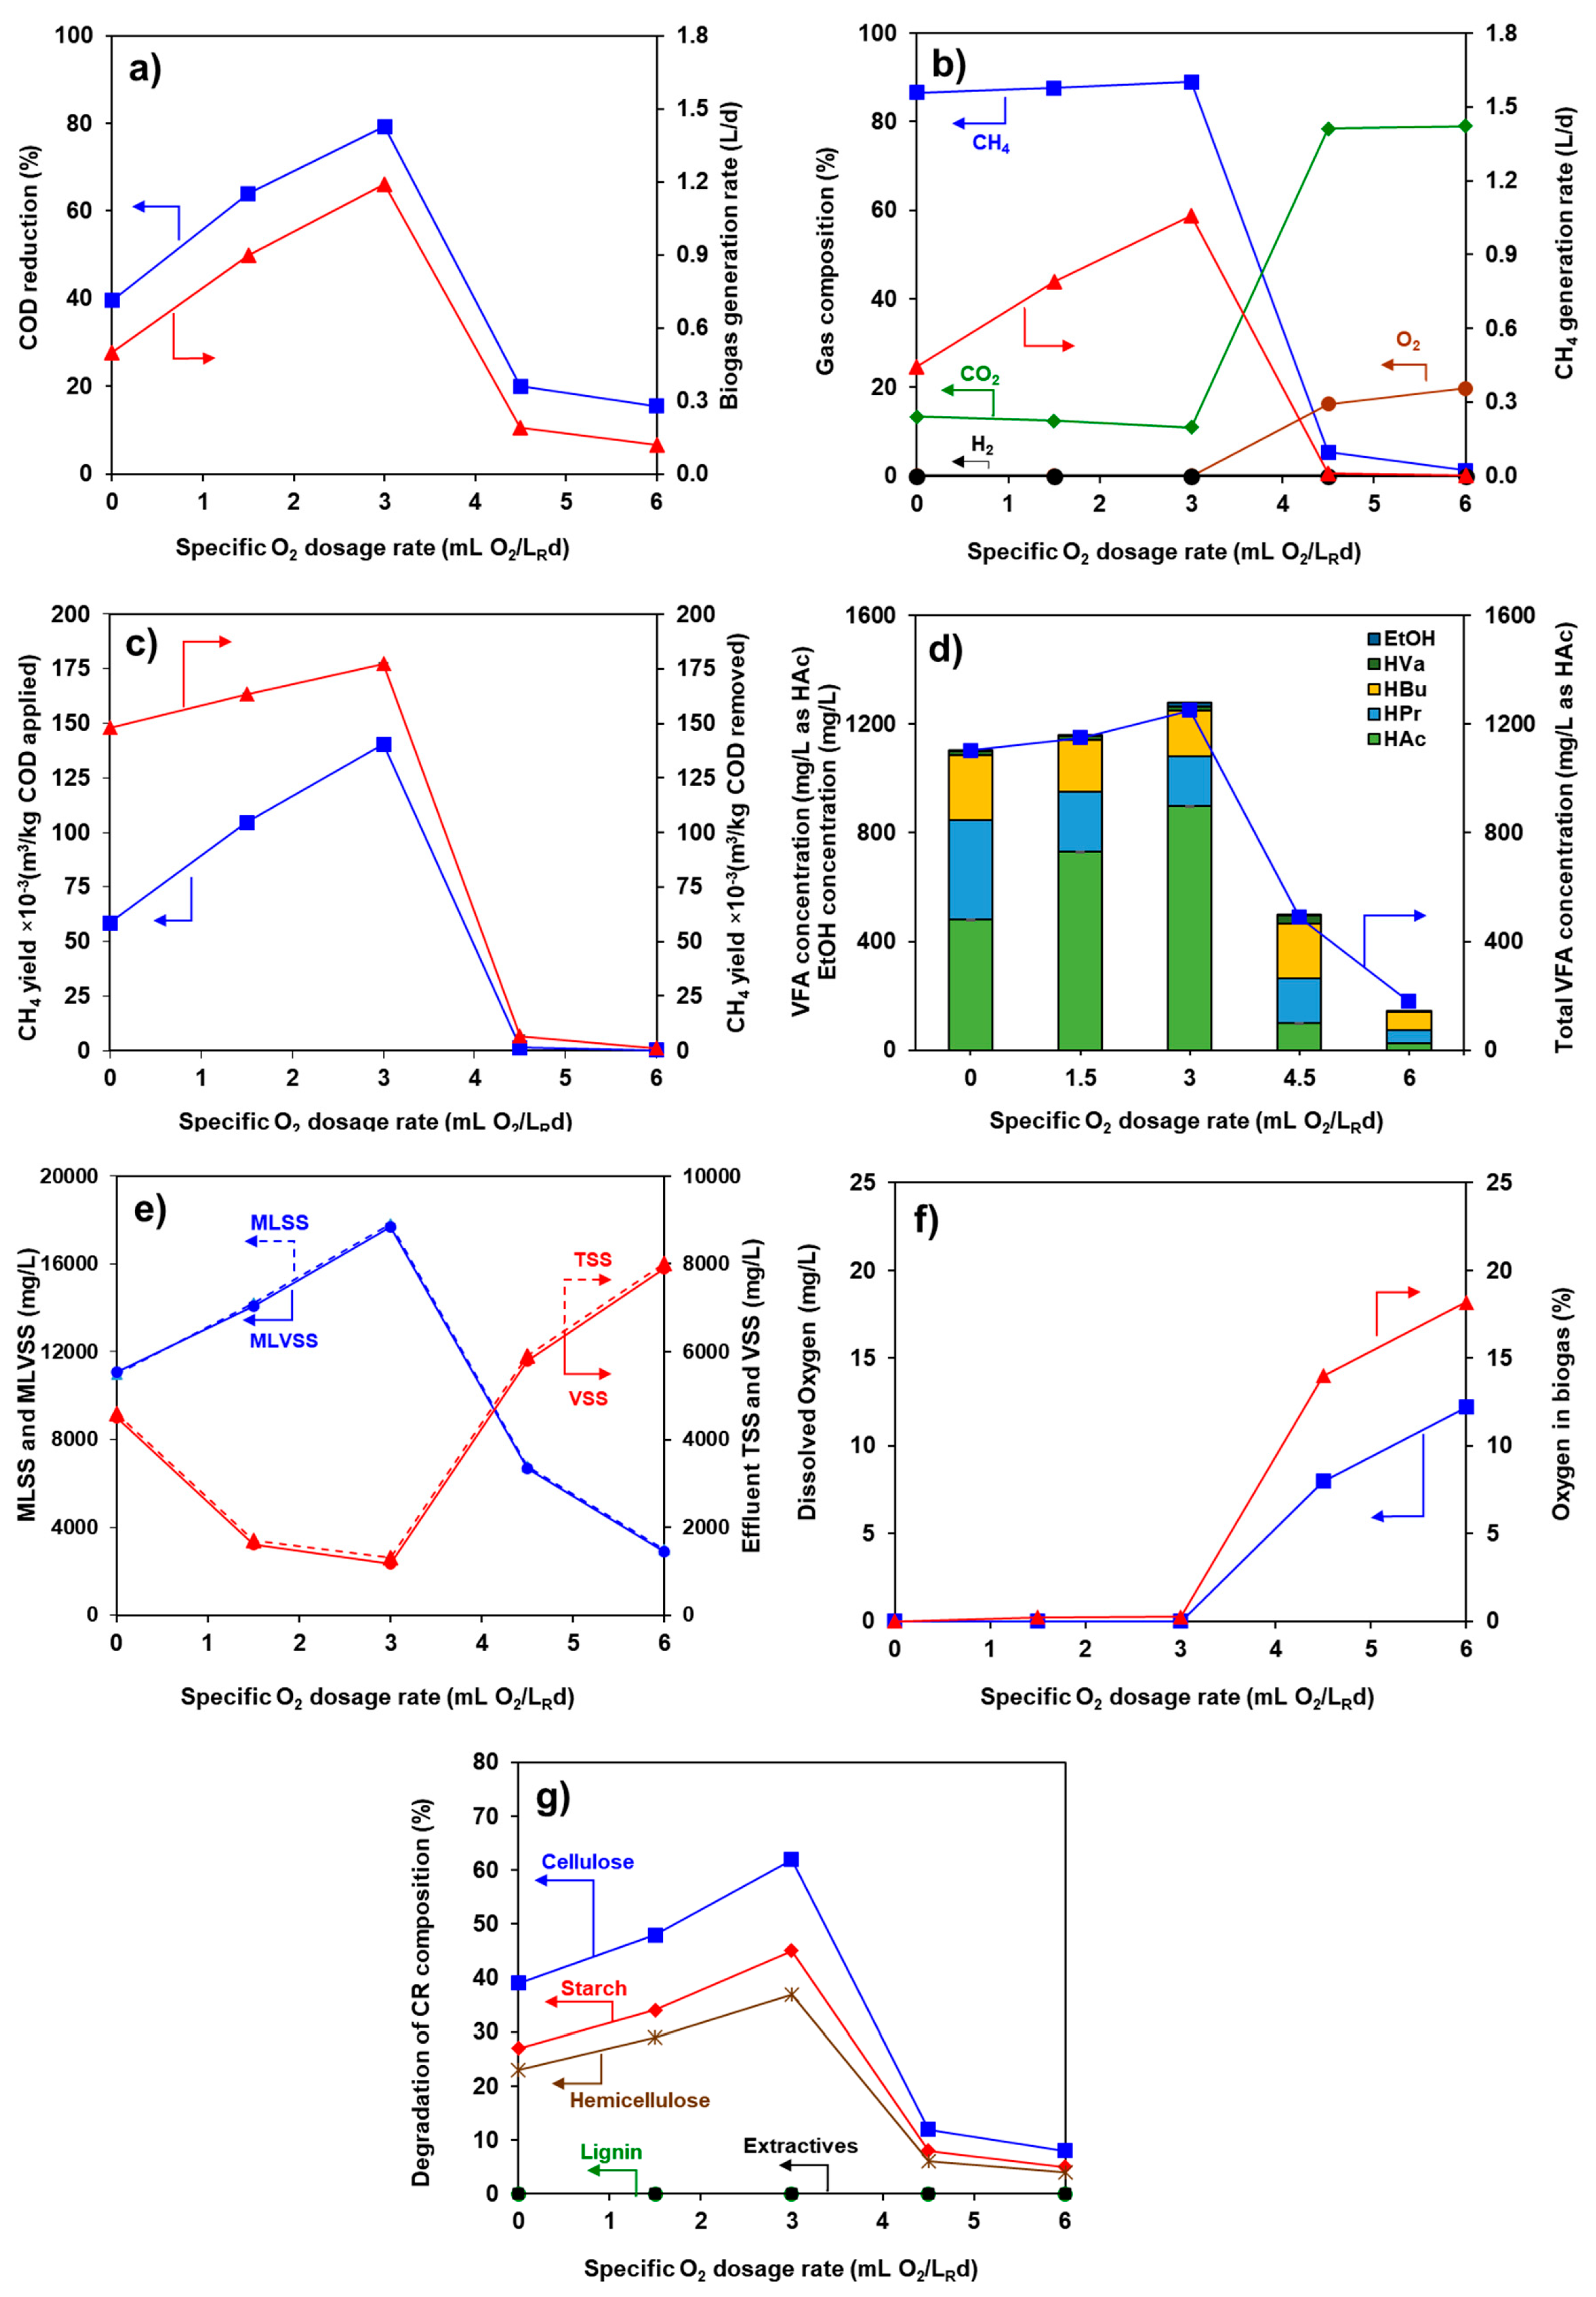
The consequences of microaeration, as a function of specific O2 dosage rate, on the CSTR process efficiency treating CW with added CR—under optimized conditions (COD loading rate of 1.71 kg/m3d CW and 1000 mg/L CR)—is depicted in Figure 5. As illustrated in Figure 5a, both the COD reduction efficiency and the biogas generation rate nearly doubled, increasing from 40 to 79% and 0.51 to 1.20 L/d, respectively, with the enlargement of the specific O2 dosage rate from 0 to 3 mL/LRd. These performance profiles closely mirror those observed for microaeration with the sole CW system in Section 3.4 (see Figure 4a); however, the current setup consistently achieved higher values. This suggests that the addition of 1000 mg/L of CR did not alter the fundamental metabolic response of the microbial community to microaeration. Consistent with the mechanisms previously discussed, the initial enhancement is likely attributed to improved micronutrient bioavailability. However, as the O2 dosage was further increased from 3 to 6 mL/LRd, a sharp decline in process efficacy was observed. This indicates that the 3 mL/LRd threshold remains the critical limit for avoiding O2 toxicity in this co-digestion setup, just as it was for the sole CW system. The relationship between these results and the observed levels of DO and O2 existing in biogas will be elucidated in the following sections.
As displayed in Figure 5b, the CH4 content (87–89%) remained nearly constant with the specific O2 dosage range of 0–3 mL/LRd, but plummeted to zero as the dosage increased further. Conversely, the CH4 generation rate was remarkably enhanced by augmenting the specific O2 dosage, peaking at the optimal rate of 3 mL/LRd before declining sharply. These trends, including the inverse relationship of CO2 concentration, closely parallel the observations for the sole CW system (see Figure 4b). Notably, H2S was completely absent from the biogas at the optimal O2 dosage, whereas it was 0.28% in the non-aerated control (Section 3.3). This indicates that the added O2 was entirely utilized by sulfide-oxidizing bacteria to convert sulfides into elemental sulfur [22,41]. Furthermore, the absence of H2 across all tested dosages suggests that any H2 produced was efficiently consumed via hydrogenotrophic methanogenesis.
As shown in Figure 5c, the highest CH4 yields were 0.140 m3/kg COD applied and 0.177 m3/kg COD removed, representing improvements of 140% and 20%, respectively, compared to the CW+CR system without microaeration. Furthermore, compared with the sole CW system without microaeration, these yields show even larger increases of 352% and 97%, respectively. The total VFA concentration and composition (Figure 5d) in the co-digestion of CW and CR system mirrored those of the sole CW system. In the optimal range (0–3 mL/LRd), the VFA concentration increased slightly to a peak of 1250 mg/L (as HAc), with a ranking order of HAc > HPr > HBu >> HVa. This suggests that controlled O2 uptake promotes metabolic flux across all anaerobic stages [39,42,43]. However, beyond 3 mL/LRd, a shift in VFA composition to HBu > HVa > HPr occurred, signaling a severe suppression of methanogenesis due to O2 toxicity (Figure 5f). These performance trends correlated with microbial density (Figure 5e). Both MLSS and MLVSS reached their peaks of 17,800 mg/L and 17,700 mg/L, respectively, at an O2 dosage of 3 mL/LRd. Concurrently, microbial washout was minimized, with effluent TSS and VSS concentrations reduced to 1300 mg/L and 1160 mg/L, respectively. This suggests that the optimized microaeration dosage supports higher biomass retention and activity, whereas excess O2 leads to microbial inhibition and increased washout.
As indicated in Figure 5f, both the DO in the CSTR mixture and O2 content in the produced biogas remained at zero within the specific O2 dosage range of 0–3 mL/LRd. This suggests that the added O2 was completely consumed by the anaerobes, thereby facilitating the metabolic benefits described previously without exposing strict anaerobes to toxicity. However, both parameters increased substantially when the dosage exceeded 3 mL/LRd. Consistent with the findings in Section 3.4 (see Figure 4f), the presence of detectable DO and residual O2 correlates precisely with the sharp decline in all process performance parameters, suggesting that excess O2 supply leads to severe inhibition of the methanoges.
Figure 5g illustrates the impact of microaeration on the digestibility of the solid CR components. Starch, cellulose, and hemicellulose remained biodegradable, while extractives and lignin were recalcitrant under these AD conditions. Notably, at the optimal O2 dosage (3 mL/LRd), maximum degradation efficiencies of 62%, 45%, and 37% were recorded for cellulose, starch, and hemicellulose, respectively. These values represent significant improvements of 59%, 67%, and 61% for cellulose, starch, and hemicellulose, respectively, when compared to the non-aerated control. As previously discussed, the CH4 yields in this investigation were substantially enhanced by microaeration. Based on COD applied, the yields increased by 251% and 140% compared to the sole CW and CW+CR systems, respectively; similarly, based on COD removed, improvements of 68% and 20% were achieved. Most notably, the synergistic effect of combining CR addition with microaeration resulted in total CH4 yield increases of 352% and 97% based on applied and removed COD, respectively, compared to the baseline sole CW system. These results significantly outperform previously reported values for Napier grass [27], wheat straw [28], corn straw, and pure cellulose [30,31]. The much greater CH4 productivity in the present work stemmed from the continuous mode of operation, which yielded a well-adapted culture. In contrast, all other systems were operated in batch mode. Moreover, microaeration could enhance the digestibility of most lignocellulosic components in those various agricultural residues, including CR. Remarkably, lignin remained undigested in this study. In contrast, lignin digestion was observed in Napier grass with anaerobically digested cattle manure inoculum [27] and in corn straw (CS) with anaerobically digested sludge [30]. The complete breakdown of lignocellulosic fibers in CR represents a persistent challenge. Further exploration is needed to determine if the adapted sludge from this investigation can be synergized with substrates like cattle manure; such a mixture could theoretically enhance the hydrolysis of lignin through the introduction of diverse rumen-derived microorganisms.


4. Conclusions

In this investigation, microaeration was demonstrated to be an effective strategy for enhancing both methanogenic activity and digestibility. Under the tested system of continuous CSTR treating CW (1.71 kg/m3d) without and with added CR (1000 mg/L), the microaeration with a specific O2 dosage rate of 3 mL/LRd enhanced CH4 yields, with increases of up to 251% for sole CW and 140% for CW+CR systems (based on COD applied). Notably, integrating CW+CR co-digestion with microaeration exhibited a powerful synergistic effect, resulting in a 352% improvement in total yield over the baseline sole CW system. At this dosage, O2 was completely consumed, and H2S was entirely removed from the biogas, potentially via microbial oxidation of sulfide. This enhancement is attributed to the liberation of essential micronutrients previously sequestered as metal sulfides, thereby boosting methanogenic activity. Furthermore, this microaeration level facilitated the breakdown of complex organic matter in the cassava residue, enhancing the degradation of starch, cellulose, and hemicellulose by 67, 59, and 61%, respectively, though lignin remained recalcitrant under all tested conditions. Conversely, exceeding the 3 mL/LRd threshold led to O2 breakthrough and a metabolic shift from acetate-dominant to butyrate-dominant VFA profiles, indicating O2 toxicity to the methanogens. While these findings represent a significant step toward enhancing biogas production in the cassava industry, it is important to note that the optimal O2 dosage in this work serves as a specific reference point for similar configurations rather than a universal constant, as optimal rates may vary with gas-liquid mass transfer and mixing intensity.

Author Contributions

Conceptualization, K.S., M.L. and S.C.; methodology, K.S., K.P., M.L. and S.C.; validation, K.S., E.L.Y., M.L. and S.C.; formal analysis, O.K. and K.P.; investigation, O.K. and K.P.; data curation, O.K. and K.P.; writing—original draft preparation, K.S., O.K. and K.P.; writing—review and editing, K.S., E.L.Y., M.L. and S.C.; visualization, O.K. and K.P.; supervision, K.S., M.L. and S.C.; project administration, S.C.; funding acquisition, K.S. and S.C. All authors have read and agreed to the published version of the manuscript.

Funding

This research was funded by the Thailand Science Research and Innovation Fund (Grant No. FRB650082/0227-WU02) and Walailak University for partial support under the International Research Collaboration Scheme (Grant No. WU-CIA-02703/2025). K.P. received financial support from the Second Century Fund (C2F), Chulalongkorn University, through a Postdoctoral Fellowship.

Institutional Review Board Statement

Not applicable.

Informed Consent Statement

Not applicable.

Data Availability Statement

The original contributions presented in this study are included in the article. Further inquiries can be directed to the corresponding author.

Acknowledgments

The authors would also like to thank Chokchai Starch Co., Ltd., Uthai Thani, Thailand, for providing the seed sludge, cassava wastewater, and residue samples. We would like to thank David C. Chang for his English proofreading.

Conflicts of Interest

The authors declare no conflicts of interest.

Abbreviations

The following abbreviations are used in this manuscript:
ADAnaerobic digestion
CODChemical oxygen demand
CRCassava residue
CSTRContinuous stirred tank reactor
CWCassava wastewater
DODissolved oxygen
HAcAcetic acid
HBuButyric acid
HPrPropionic acid
HVaValeric acid
MLSSMixed liquor suspended solids
MLVSSMixed liquor volatile suspended solids
TSTotal solids
TSSTotal suspended solids
TVSTotal volatile solids
VFAVolatile fatty acids
VSSVolatile suspended solids

References

  1. Sowcharoensuk, C. Industry Outlook 2025–2027: Cassava Industry. Krungsri Research, 2025. Available online: https://www.krungsri.com/en/research/industry/industry-outlook/agriculture/cassava/io/cassava-2025-2027 (accessed on 1 February 2026).
  2. Li, S.; Cui, Y.; Zhou, Y.; Luo, Z.; Liu, J.; Zhao, M. The industrial applications of cassava: Current status, opportunities and prospects. J. Sci. Food Agric. 2017, 97, 2282–2290. [Google Scholar] [CrossRef] [Scilit]
  3. Lerdlattaporn, R.; Phalakornkule, C.; Trakulvichean, S.; Songkasiri, W. Implementing circular economy concept by converting cassava pulp and wastewater to biogas for sustainable production in starch industry. Sustain. Environ. Res. 2021, 31, 20. [Google Scholar] [CrossRef] [Scilit]
  4. Achi, C.G.; Hassanein, A.; Lansing, S. Enhanced biogas production of cassava wastewater using zeolite and biochar additives and manure co-digestion. Energies 2020, 13, 491. [Google Scholar] [CrossRef] [Scilit]
  5. Hansupalak, N.; Piromkraipak, P.; Tamthirat, P.; Manitsorasak, A.; Sriroth, K.; Tran, T. Biogas reduces the carbon footprint of cassava starch: A comparative assessment with fuel oil. J. Clean. Prod. 2016, 134, 539–546. [Google Scholar] [CrossRef] [Scilit]
  6. Chavadej, S.; Wangmor, T.; Maitriwong, K.; Chaichirawiwat, P.; Rangsunvigit, P.; Intanoo, P. Separate production of hydrogen and methane from cassava wastewater with added cassava residue under a thermophilic temperature in relation to digestibility. J. Biotechnol. 2019, 291, 61–71. [Google Scholar] [CrossRef] [Scilit]
  7. Zhang, Q.; He, J.; Tian, M.; Mao, Z.; Tang, L.; Zhang, J.; Zhang, H. Enhancement of methane production from cassava residues by biological pretreatment using a constructed microbial consortium. Bioresour. Technol. 2011, 102, 8899–8906. [Google Scholar] [CrossRef] [Scilit]
  8. Cruz, I.A.; Santos Andrade, L.R.; Bharagava, R.N.; Nadda, A.K.; Bilal, M.; Figueiredo, R.T.; Romanholo Ferreira, L.F. Valorization of cassava residues for biogas production in Brazil based on the circular economy: An updated and comprehensive review. Clean Eng. Technol. 2021, 4, 100196. [Google Scholar] [CrossRef] [Scilit]
  9. Dar, R.A.; Parmar, M.; Dar, E.A.; Sani, R.K.; Phutela, U.G. Biomethanation of agricultural residues: Potential, limitations and possible solutions. Renew. Sustain. Energy Rev. 2021, 135, 110217. [Google Scholar] [CrossRef] [Scilit]
  10. Kunatsa, T.; Xia, X. A review on anaerobic digestion with focus on the role of biomass co-digestion, modelling and optimisation on biogas production and enhancement. Bioresour. Technol. 2022, 344, 126311. [Google Scholar] [CrossRef] [Scilit]
  11. Ratanatamskul, C.; Manpetch, P. Comparative assessment of prototype digester configuration for biogas recovery from anaerobic co-digestion of food waste and rain tree leaf as feedstock. Int. Biodeterior. Biodegrad. 2016, 113, 367–374. [Google Scholar] [CrossRef] [Scilit]
  12. Yong, Z.; Dong, Y.; Zhang, X.; Tan, T. Anaerobic co-digestion of food waste and straw for biogas production. Renew. Energy 2015, 78, 527–530. [Google Scholar] [CrossRef] [Scilit]
  13. Jiraprasertwong, A.; Maitriwong, K.; Chavadej, S. Production of biogas from cassava wastewater using a three-stage upflow anaerobic sludge blanket (UASB) reactor. Renew. Energy 2019, 130, 191–205. [Google Scholar] [CrossRef] [Scilit]
  14. Deng, Q.; Wu, X.; Wang, Y.; Liu, M. Activity characteristics of sulfate reducing bacteria and formation mechanism of hydrogen sulfide. Appl. Ecol. Environ. Res. 2018, 16, 6369–6383. [Google Scholar] [CrossRef] [Scilit]
  15. Yongsiri, C.; Hvitved-Jacobsen, T.; Vollertsen, J.; Tanaka, N. Introducing the emission process of hydrogen sulfide to a sewer process model (WATS). Water Sci. Technol. 2003, 47, 85–92. [Google Scholar] [CrossRef] [Scilit]
  16. Yan, L.; Ye, J.; Zhang, P.; Xu, D.; Wu, Y.; Liu, J.; Zhang, H.; Fang, W.; Wang, B.; Zeng, G. Hydrogen sulfide formation control and microbial competition in batch anaerobic digestion of slaughterhouse wastewater sludge: Effect of initial sludge pH. Bioresour. Technol. 2018, 259, 67–74. [Google Scholar] [CrossRef] [Scilit] [PubMed]
  17. Yongsiri, C.; Vollertsen, J.; Hvitved-Jacobsen, T. Effect of temperature on air-water transfer of hydrogen sulfide. J. Environ. Sci. 2004, 130, 104–109. [Google Scholar] [CrossRef] [Scilit]
  18. Rickard, D. Kinetics of FeS precipitation: Part 1. Competing reaction mechanisms. Geochim. Cosmochim. Acta 1995, 59, 4367–4379. [Google Scholar] [CrossRef] [Scilit]
  19. Pornmai, K.; Itsadanont, S.; Lertpattanapong, M.; Seneesrisakul, K.; Jiraprasertwong, A.; Leethochawalit, M.; Sekiguchi, H.; Chavadej, S. Enhancement of methanogenic activity by micronutrient control: Micronutrient availability in relation to sulfur transport. J. Environ. Sci. 2023, 127, 738–752. [Google Scholar] [CrossRef] [Scilit]
  20. Seneesrisakul, K.; Jantaruksa, T.; Jiraprasertwong, A.; Pornmai, K.; Rangsunvigit, P.; Chavadej, S. Effects of the reactor volumetric ratio and recycle ratio on the methane and energy productivity of a three-step anaerobic sequencing batch reactor (3S-ASBR) treating ethanol wastewater. Energy 2021, 227, 120512. [Google Scholar] [CrossRef] [Scilit]
  21. Pokorna, D.; Zabranska, J. Sulfur-oxidizing bacteria in environmental technology. Biotechnol. Adv. 2015, 33, 1246–1259. [Google Scholar] [CrossRef] [Scilit]
  22. Castro, I.; Azevedo, L.; Souza, C. Evaluation of microaeration strategies in the digestion zone of UASB reactors as an alternative for biogas desulfurization. Environ. Technol. 2023, 44, 431–445. [Google Scholar] [CrossRef] [Scilit]
  23. Botheju, D.; Bakke, R. Oxygen effects in anaerobic digestion—A review. Open Waste Manag. J. 2011, 4, 1–19. [Google Scholar] [CrossRef] [Scilit]
  24. Khongsumran, O. Enhancement of Anaerobic Digestion of Cellulosic Fraction in Cassava Production Wastewater by Microaeration; Chulalongkorn University: Bangkok, Thailand, 2014. [Google Scholar]
  25. Canul Bacab, F.; España Gamboa, E.; Ruiz Espinoza, J.E.; Leal-Bautista, R.M.; Tapia Tussell, R.; Domínguez Maldonado, J.; Canto Canché, B.; Alzate-Gaviria, L. Two phase anaerobic digestion system of municipal solid waste by utilizing microaeration and granular activated carbon. Energies 2020, 13, 933. [Google Scholar] [CrossRef] [Scilit]
  26. Nguyen, P.H.L.; Kuruparan, P.; Visvanathan, C. Anaerobic digestion of municipal solid waste as a treatment prior to landfill. Bioresour. Technol. 2007, 98, 380–387. [Google Scholar] [CrossRef] [Scilit]
  27. Sawatdeenarunat, C.; Sung, S.; Khanal, S.K. Enhanced volatile fatty acids production during anaerobic digestion of lignocellulosic biomass via micro-oxygenation. Bioresour. Technol. 2017, 237, 139–145. [Google Scholar] [CrossRef] [Scilit] [PubMed]
  28. Tsapekos, P.; Kougias, P.; Vasileiou, S.; Lyberatos, G.; Angelidaki, I. Effect of micro-aeration and inoculum type on the biodegradation of lignocellulosic substrate. Bioresour. Technol. 2017, 225, 246–253. [Google Scholar] [CrossRef] [Scilit] [PubMed]
  29. Wang, X.; Yuan, T.; Lei, Z.; Kobayashi, M.; Adachi, Y.; Shimizu, K.; Lee, D.-J.; Zhang, Z. Supplementation of O2-containing gas nanobubble water to enhance methane production from anaerobic digestion of cellulose. Chem. Eng. J. 2020, 398, 125652. [Google Scholar] [CrossRef] [Scilit]
  30. Zhu, R.; Wang, D.-H.; Zheng, Y.; Zou, H.; Fu, S.-F. Understanding the mechanisms behind micro-aeration to enhance anaerobic digestion of corn straw. Fuel 2022, 318, 123604. [Google Scholar] [CrossRef] [Scilit]
  31. Zhu, R.; Zhang, Y.-f.; Zou, H.; Guo, R.-B.; Fu, S.-F. The effects of micro-aeration on semi-continued anaerobic digestion of corn straw with increasing organic loading rates. Renew. Energy 2022, 195, 1194–1201. [Google Scholar] [CrossRef] [Scilit]
  32. Fu, S.; Lian, S.; Angelidaki, I.; Guo, R. Micro-aeration: An attractive strategy to facilitate anaerobic digestion. Trends Biotechnol. 2023, 41, 714–726. [Google Scholar] [CrossRef] [Scilit]
  33. Intanoo, P.; Rangsunvigit, P.; Namprohm, W.; Thamprajamchit, B.; Chavadej, J.; Chavadej, S. Hydrogen production from alcohol wastewater by an anaerobic sequencing batch reactor under thermophilic operation: Nitrogen and phosphorous uptakes and transformation. Int. J. Hydrogen Energy 2012, 37, 11104–11112. [Google Scholar] [CrossRef] [Scilit]
  34. Rice, E.W.; Bridgewater, L.; Association, A.P.H. Standard Methods for the Examination of Water and Wastewater; American Public Health Association: Washington, DC, USA, 2012. [Google Scholar]
  35. Lin, L.; Yan, R.; Liu, Y.; Jiang, W. In-depth investigation of enzymatic hydrolysis of biomass wastes based on three major components: Cellulose, hemicellulose and lignin. Bioresour. Technol. 2010, 101, 8217–8223. [Google Scholar] [CrossRef] [Scilit] [PubMed]
  36. Li, Y.; Hua, D.; Xu, H.; Jin, F.; Mu, H.; Zhao, Y.; Fang, X. Acidogenic and methanogenic properties of corn straw silage: Regulation and microbial analysis of two-phase anaerobic digestion. Bioresour. Technol. 2020, 307, 123180. [Google Scholar] [CrossRef] [Scilit] [PubMed]
  37. Lohani, S.P.; Havukainen, J. Anaerobic digestion: Factors affecting anaerobic digestion process. In Waste Bioremediation; Springer: Singapore, 2018; pp. 343–359. [Google Scholar] [CrossRef] [Scilit]
  38. Eryildiz, B.; Lukitawesa; Taherzadeh, M.J. Effect of pH, substrate loading, oxygen, and methanogens inhibitors on volatile fatty acid (VFA) production from citrus waste by anaerobic digestion. Bioresour. Technol. 2020, 302, 122800. [Google Scholar] [CrossRef] [Scilit]
  39. Ruan, D.; Zhou, Z.; Pang, H.; Yao, J.; Chen, G.; Qiu, Z. Enhancing methane production of anaerobic sludge digestion by microaeration: Enzyme activity stimulation, semi-continuous reactor validation and microbial community analysis. Bioresour. Technol. 2019, 289, 121643. [Google Scholar] [CrossRef] [Scilit]
  40. Jansen, S.; Gonzalez-Gil, G.; van Leeuwen, H.P. The impact of Co and Ni speciation on methanogenesis in sulfidic media—Biouptake versus metal dissolution. Enzyme Microb. Technol. 2007, 40, 823–830. [Google Scholar] [CrossRef] [Scilit]
  41. Krayzelova, L.; Bartacek, J.; Kolesarova, N.; Jenicek, P. Microaeration for hydrogen sulfide removal in UASB reactor. Bioresour. Technol. 2014, 172, 297–302. [Google Scholar] [CrossRef] [Scilit]
  42. Johansen, J.-E.; Bakke, R. Enhancing hydrolysis with microaeration. Water Sci. Technol. 2006, 53, 43–50. [Google Scholar] [CrossRef] [Scilit]
  43. Yu, N.; Guo, B.; Zhang, Y.; Zhang, L.; Zhou, Y.; Liu, Y. Different micro-aeration rates facilitate production of different end-products from source-diverted blackwater. Water Res. 2020, 177, 115783. [Google Scholar] [CrossRef] [Scilit]
Figure 1. Schematic of the studied CSTR system.
Fermentation 12 00212 g001
Figure 2. Effects of COD loading rate on the process efficiency of the CSTR treating CW without added CR and without microaeration on: (a) COD reduction and biogas generation rate, (b) gas composition and CH4 generation rate, (c) CH4 yields, (d) VFAs composition, EtOH content, and total VFAs concentrations, and (e) MLVSS and effluent VSS. (Data are shown as the mean ± SD, derived from at least three independent repeats).
Fermentation 12 00212 g002
Figure 3. Impacts of the amount of added CR on the process efficiency of the CSTR treating CW at the optimal COD loading rate of 1.71 kg/m3d without microaeration on: (a) COD reduction and biogas generation rate, (b) biogas composition and CH4 generation rate, (c) CH4 yields, (d) VFAs composition, and EtOH content, and total VFAs concentrations, (e) total alkalinity, total acidity, and solution pH, (f) MLSS, MLVSS, effluent TSS, and effluent VSS, and (g) the degradability of all components in the CR. (Data are shown as the mean ± SD, derived from at least three independent repeats).
Fermentation 12 00212 g003
Figure 4. Effects of microaeration at different specific O2 dosage rates on the process efficiency of the CSTR treating CW without added CR under the optimal conditions of a COD loading rate of 1.71 kg/m3d (total COD loading rate of 1.90 kg/m3d) on: (a) COD reduction and biogas generation rate, (b) biogas composition and CH4 generation rate, (c) CH4 yields, (d) VFA composition, and EtOH content, and total VFAs concentrations, (e) MLVSS and effluent VSS, and (f) DO levels in liquid and O2 concentration in produced gas. (Data are shown as the mean ± SD, derived from at least three independent repeats).
Fermentation 12 00212 g004
Figure 5. Effects of microaeration at different specific O2 dosage rates on the process efficiency of the CSTR treating CW with added CR (1000 ppm) under the optimal COD loading rate of 1.71 kg/m3d of CW (total COD loading rate of 1.90 kg/m3d) on: (a) COD reduction and biogas generation rate, (b) biogas composition and CH4 generation rate, (c) CH4 yields, (d) VFA composition, EtOH concentration, and total VFA concentrations, (e) MLSS, MLVSS, effluent TSS, and effluent VSS, (f) DO in CSTR and O2 concentration in produced biogas, and (g) digestibility of all components in CR. (Data are shown as the mean ± SD, derived from at least three independent repeats).
Fermentation 12 00212 g005
Table 1. Chemical features of the CW used in this study.
ParameterUnitValue
Total CODmg/L10,700
Settled CODmg/L10,420
Soluble CODmg/L9400
Total Nmg/L270
        NO3-Nmg/L47
        NO2-Nmg/L1.1
        NH4+-Nmg/L2.00
Total Pmg/L80
COD:N:P-100:2.5:0.8
pH-4.34
Total VFAsmg/L580
Aciditymg/L838
TSmg/L1330
TVSmg/L1320
Table 2. Chemical features of the CR in this study.
ParameterUnitValue
Chemical composition  
TSg/g dried weight0.994
TVSg/g dried weight0.976
Ashg/g dried weight0.018
Total CODg/g dried weight0.806
Total Ng/g dried weight0.031
Total Pg/g dried weight0.004
COD:N:P ratio-100:3.8:0.5
Elemental composition  
Moisture%11.63
C%37.07
H%5.89
N%0.20
S%0.07
O%56.77
Lignocellulosic composition  
Extractives% dried weight9.34
Starch% dried weight41.05
Cellulose% dried weight20.57
Hemicellulose% dried weight23.41
Lignin% dried weight5.63
Disclaimer/Publisher’s Note: The statements, opinions and data contained in all publications are solely those of the individual author(s) and contributor(s) and not of MDPI and/or the editor(s). MDPI and/or the editor(s) disclaim responsibility for any injury to people or property resulting from any ideas, methods, instructions or products referred to in the content.