Article

Effect of Aeration Process on Lignocellulosic Degradation, Humification and Carbohydrate-Active Enzyme (CAZymes) Genes in Aerobic Composting

by
Yufeng Chen
,
Hongbo Zhang
,
Haolong Wu
and
Xueqin He
*
College of Engineering, China Agricultural University, Beijing 100083, China
*
Author to whom correspondence should be addressed.
Fermentation 2026, 12(4), 170; https://doi.org/10.3390/fermentation12040170
Submission received: 28 February 2026 / Revised: 9 March 2026 / Accepted: 19 March 2026 / Published: 24 March 2026
(This article belongs to the Section Fermentation Process Design)

Abstract

This study investigated the impacts of diverse aeration processes (continuous aeration vs. intermittent aeration) and aeration rates on the aerobic composting process. The key properties examined include temperature, oxygen dynamics, lignocellulose degradation, humification, and the functional potential of carbohydrate-active enzymes (CAZymes) based on metagenomic analysis. Among all the treatments, continuous aeration at a low rate (CA_1.5) attained the highest level of lignocellulose degradation by balancing the thermophilic duration and oxygen supply. Conversely, intermittent aeration (IA_3) led to superior humus stabilization, with the ratio of humic acid to fulvic acid (H/F) increasing by 118.45% in comparison to the initial level. Low total ventilation in CA_1.5 and IA_3 facilitated an increase in the abundance of glycosyl transferases (GTs) genes. Notably, intermittent aeration (IA_3) synergistically augmented the activities of glycoside hydrolases (GHs) and GTs, propelling the efficient conversion of lignocellulose into stable humic substances. In conclusion, the aeration process influenced the functional potential of microbial CAZymes, thus exerting an influence on both the composting efficiency and the quality of the final product.

1. Introduction

The rapid global rise in livestock farming has increased the quantity of animal manure. Among them, dairy manure poses a significant challenge to sustainable agriculture and waste management owing to its high production volume and potential environmental risks [1,2]. Aerobic composting is a crucial technology for the resource utilization of manure [3]. Dairy manure solids possess favorable attributes for direct utilization as a feedstock in aerobic composting. These include suitable moisture content (MC) (55–65%) and a porous structure (porosity > 35%), rendering them suitable for the production of high-value organic fertilizer [4]. Aerobic composting is a microbially mediated process that stabilizes organic waste into mature fertilizer. It accomplishes this via high-temperature aerobic fermentation, which facilitates the mineralization, humification, and sanitation of organic matter (OM) [5,6]. Oxygen functions as the electron acceptor in the core metabolic processes of aerobic microorganisms. Its permeation and consumption rate directly influence composting efficiency and the quality of the final product [7].
Aeration is regarded as the most crucial factor in aerobic composting systems. It represents the most effective process for controlling oxygen penetration within the compost pile, in conjunction with turning and natural convection [6,8]. An appropriate aeration rate and mode can enhance oxygen supply efficiency and reduce greenhouse gas emissions [9]. Research has indicated that intermittent aeration (30 min on/30 min off) utilizes only half of the total aeration volume of continuous aeration at the same rate, yet boosts oxygen utilization efficiency by 96.67% [7]. Conversely, an inappropriate aeration process frequently leads to low oxygen utilization efficiency and heat loss. This can prolong the maturation period and result in significant ammonia (NH3) emissions [10]. In conclusion, aeration plays a vital role in optimizing the composting process. It modifies the concentration and distribution of oxygen within the pile, thereby influencing the metabolic activity of aerobic microorganisms and ultimately affecting composting performance. Lignocellulose degradation and compost maturity are key indicators for assessing the composting process. Meng et al. (2023) examined the effects of different aeration rates on lignocellulose degradation and compost maturity during the aerobic composting of biogas residue [11]. They discovered that lower aeration rates promote lignocellulose decomposition by extending the thermophilic phase. Cheng et al. (2023) compared the effects of continuous and intermittent aeration on humification during food waste composting [12]. Their findings demonstrated that intermittent aeration enhances humification and reduces greenhouse gas emissions, increasing humic acid (HA) content by 24.1%. Nevertheless, the relationship between aeration mode, whether intermittent or continuous, and the transformation of lignocellulose into humic substances still necessitates further exploration.
Aeration processes alter the oxygen concentration within the compost pile, select for distinct microbial communities, and regulate their functions, thereby influencing lignocellulose degradation and humus transformation [13,14]. An increased aeration rate inhibits humification due to excessive mineralization of organic matter (OM). It also inhibited the abundance of Tepidimicrobium and Caldicoprobacter, and reduced methane emissions [15]. Ge et al. (2020) also found that a high aeration rate was favorable to the uniformity of bacteria during the thermophilic phase and enhanced cellulase activity during aerobic composting [13]. Ding et al. (2025) applied a neural network model with adaptive aeration control for food waste composting [16]. By comparing enzyme genes against the KEGG database, Ding et al. found that the optimized aeration strategy promotes humification by enhancing the transformation of phenolic compounds by Saccharomonospora and Comamonas during the thermophilic phase. They proposed that future studies should employ metagenomics to explore the underlying microbial mechanisms. Aligning metagenomic sequencing data with the CAZy database offers insight into carbohydrate-active enzymes (CAZymes). These enzymes are essential for microbial degradation, modification, and synthesis of carbohydrates. They play a decisive role in breaking down complex lignocellulosic materials in composting feedstocks. Their degradation products serve as important precursors for the formation of humic substances (HS) [17]. However, few studies have explored how aeration processes affect lignocellulose degradation and humus transformation from the perspective of CAZymes. Ma and Liu (2022) reported that a 3D-printed bulking agent improves air permeability inside the compost, significantly increasing the abundance of CAZyme genes and promoting OM degradation [18]. Zhan et al. (2025) found that a micro-positive pressure environment created by membrane covering is more conducive to oxygen diffusion, thus enhancing the synergy among CAZyme families and increasing the H/F by 1.48 times [14]. However, neither study specifically addressed aeration strategies. In summary, clarifying how aeration processes shape the functional profile of microbial CAZymes and drive the biosynthesis and stabilization of HS is the key focus of this research.
In this study, the solid fraction of dairy manure was used as the sole raw material. Three aeration strategies were designed: continuous aeration at 0.13 L min−1 kg−1 DM (CA_1.5), continuous aeration at 0.25 L min−1 kg−1 DM (CA_3), and intermittent aeration at 0.25 L min−1 kg−1 DM (IA_3). The objective was to investigate the effects of different aeration processes on basic properties (primarily temperature dynamics, oxygen concentration at the reactor outlet), lignocellulose degradation, and humic substance formation during aerobic composting. Based on metagenomic analysis, we analyzed changes in the composition and functional potential of microbial CAZyme families under different aeration processes. Using the Mantel test and correlation network analysis, we further revealed how aeration processes drive the transformation of lignocellulose into stable humic substances by regulating the activity of key CAZymes.

2. Materials and Methods

2.1. Composting Experimental Design

In this composting experiment, the only raw material employed was the solid fraction obtained from fresh manure collected at a large-scale dairy farm subsequent to solid–liquid separation (referred to as “solid fraction of dairy manure”). The feedstock was sourced from the Jinyindao Ranch of the Shounong Animal Husbandry Development Co., Ltd. (Daxing District, Beijing, China). The experiment included three treatments: CA_1.5—continuous aeration at a rate of 0.13 L min−1 kg−1 DM (1.5 L/min), CA_3—continuous aeration at a rate of 0.25 L min−1 kg−1 DM (3 L/min), and IA_3—intermittent aeration (30 min on/30 min off) at a rate of 0.25 L min−1 kg−1 DM (3 L/min) [19]. Owing to the low moisture content of the solid fraction of dairy manure, the aeration rates were slightly lower than the typically recommended range (0.42~1.25 L min−1 kg−1 DM) for fresh dairy manure composting, based on preliminary experiments [5]. The basic physicochemical properties of the initial materials for the three composting groups are presented in Table 1.
For each treatment, 32 kg of the initial material was placed into identical 90 L intelligent aerobic composting reactors [20]. The aerobic composting process lasted 30 days. Solid samples (about 100 g each) were collected from the upper, middle, and lower sampling ports of each reactor on days 0, 2, 6, 10, 20, and 30. Subsamples from each reactor were mixed and stored at −20 °C for physicochemical analysis. Additional subsamples (about 20 g) were collected and stored at −80 °C for metagenomic analysis. Gas samples (500 mL) were collected at the reactor outlet every 24 h for the first 20 days and every 48 h thereafter, using gas sampling bags (Delin, Dalian, China).

2.2. Measurement and Analysis Methods

Temperature data of the compost pile and the ambient environment were recorded with temperature sensors installed within the reactors. The O2 concentration at the outlet was measured using a gas sensor system (Biogas 5000; Geotechnical Instruments Ltd., Warwick, UK) [21]. The total organic carbon concentration was determined using the method by Huang et al. (2006) [22]. The concentrations of humic substances (HS), fulvic acid (FA), and humic acid (HA) were calculated according to the method by Sánchez-Monedero et al. (1996) [23]. The relative contents of cellulose, hemicellulose and lignin were determined by the standard method (NREL/TP-510-42618) of the National Renewable Energy Laboratory [24]. The methods for determining other physicochemical properties were presented in the Supplementary Materials.

2.3. Metagenomic Sequencing

Sample DNA was extracted using the FastPure Soil DNA Isolation (MJYH, Shanghai, China). DNA concentration and purity were assessed, and integrity was evaluated via 1% agarose gel electrophoresis. Following fragmentation with a Covaris M220 (Genesky, Shanghai, China), DNA libraries were constructed using the NEXTFLEX Rapid DNA-Seq Kit (Bioo Scientific, Austin, TX, USA). Metagenomic sequencing was performed on an Illumina NovaSeqTM X Plus platform (Illumina, San Diego, CA, USA) by Shanghai Meiji Biotechnology Co., Ltd., Shanghai, China. Raw sequencing data have been submitted to the NCBI database (Accession number: SUB15936434).
Quality-filtered and trimmed reads were assembled de novo using the MEGAHIT software (version 1.1.2) [25]. Predicted gene sequences from all samples were clustered with CD-HIT (version 4.6.1) to construct a non-redundant gene catalog [26]. High-quality reads from each sample were aligned against this non-redundant catalog using SOAPaligner (version 2.21) (with 95% identity) to calculate gene abundance information [27]. For taxonomic annotation, the amino acid sequences of the non-redundant gene set were aligned against the NCBI NR database using Diamond (version 0.8.35) [28]. For functional annotation regarding CAZymes (https://www.cazy.org, accessed on 27 February 2026), the amino acid sequences were aligned against the CAZy database using hmmscan (https://www.ebi.ac.uk/jdispatcher/pfa/hmmer3_hmmscan, accessed on 27 February 2026).

2.4. Statistical Data Analysis

Data were processed using Microsoft Excel 2016. Figures were created using Origin 2022 (OriginLab Corporation, Northampton, MA, USA). Significant differences were analyzed using SPSS 27 (IBM, Armonk, NY, USA). Principal coordinates analysis (PCoA) and bar plots depicting relative taxonomic abundance were performed using R (version 3.3.1). Circos plots were generated using Circos version 0.67–7 [29]. Redundancy analysis (RDA) and Mantel test heatmaps were conducted using the vegan package (version 2.4.3) in R [30]. Correlation networks were constructed using Networkx (version 1.11) and visualized using Gephi (version 0.10.1) [31].

3. Results and Discussion

3.1. Changes in Temperature and Oxygen Concentration at the Reactor Outlet

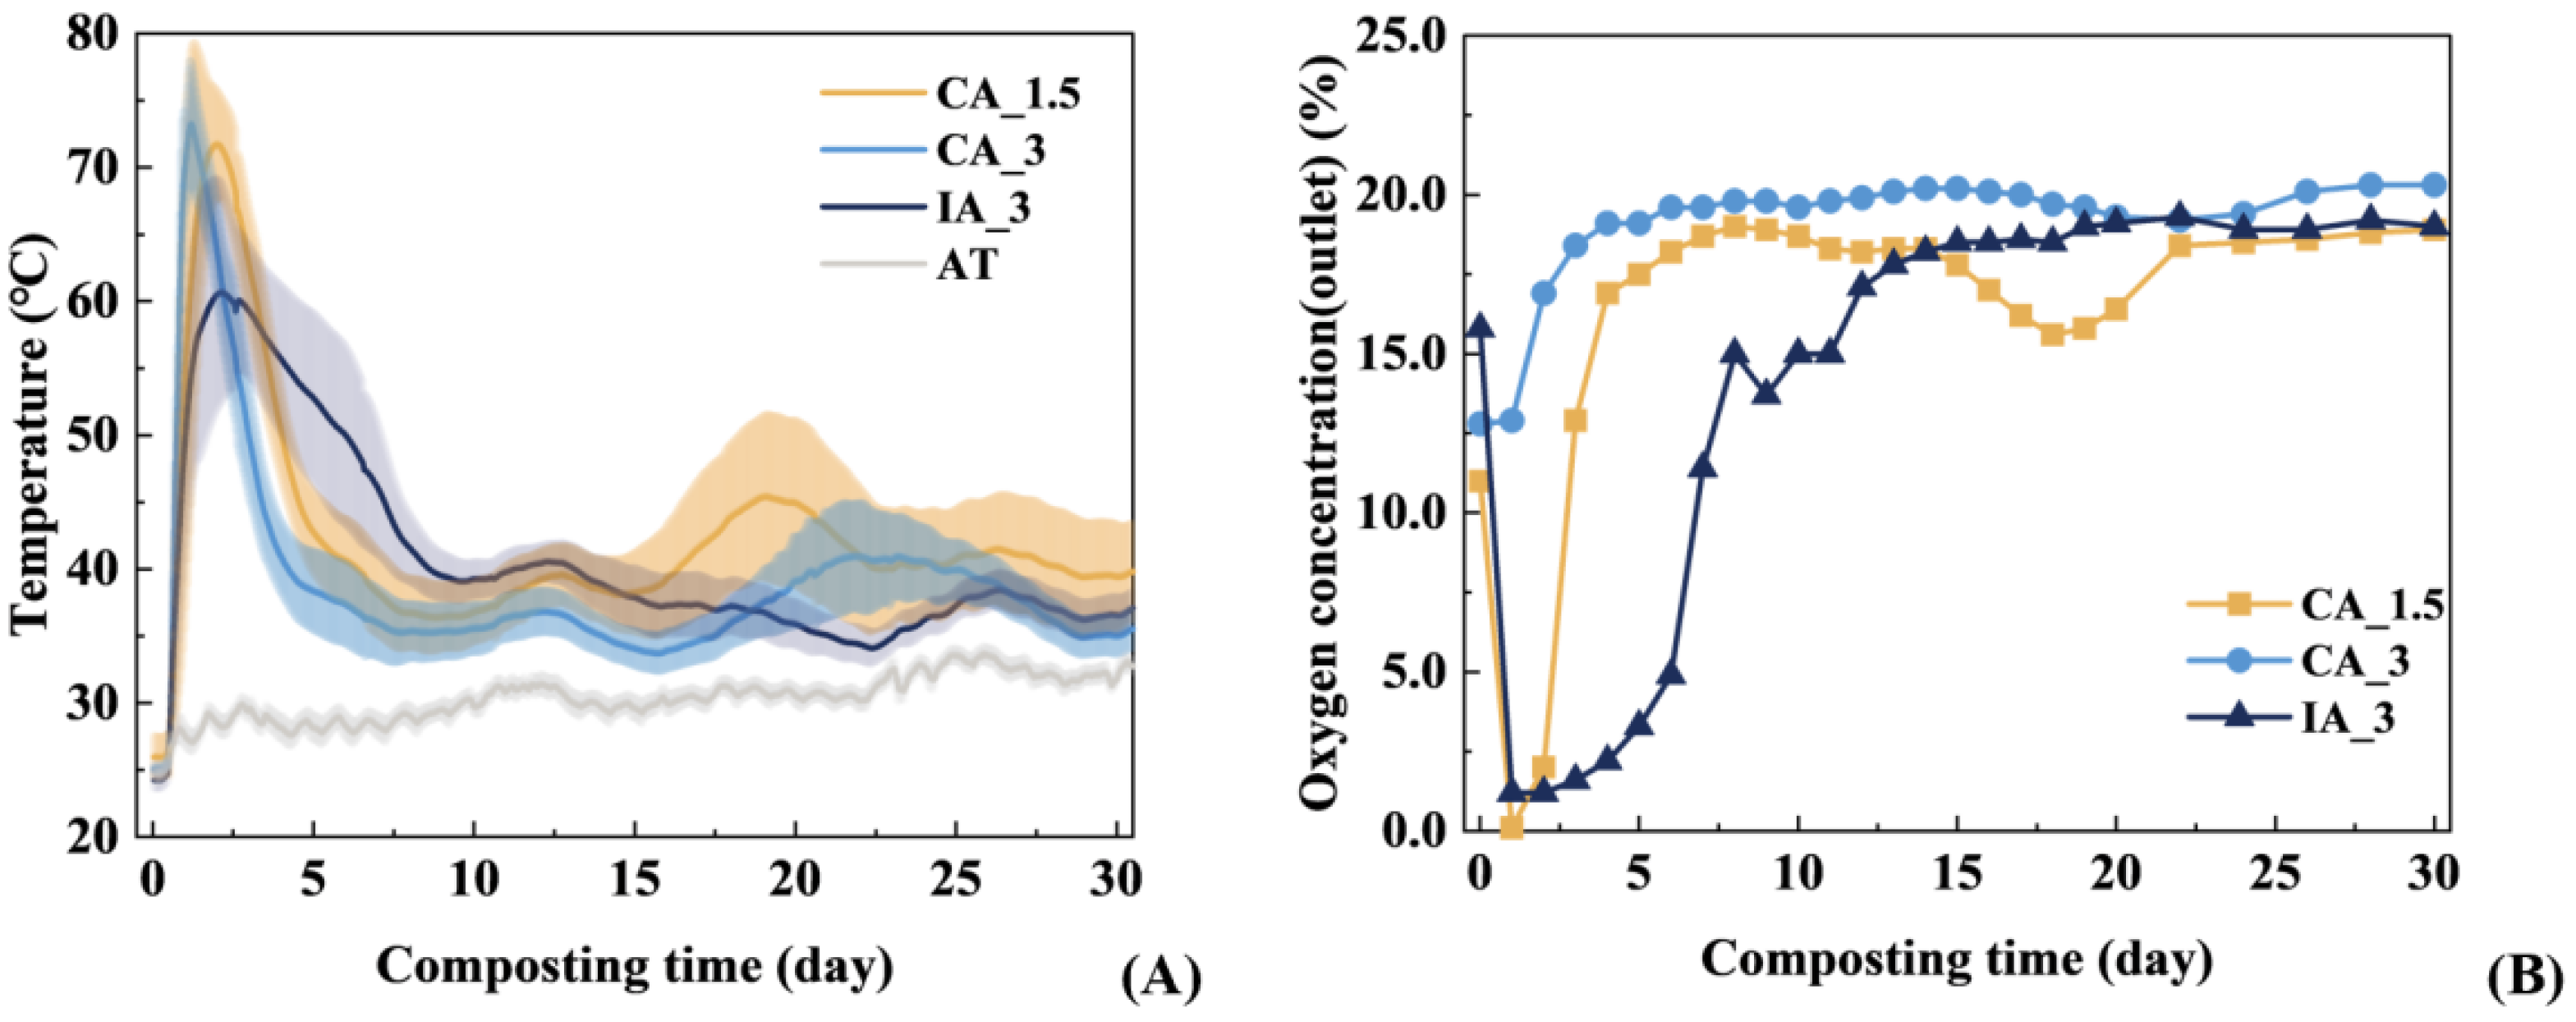
As shown in Figure 1A, the first day of composting was the heating phase. In terms of both the heating rate and the maximum temperature, the descending order was CA_3, CA_1.5, and IA_3. A higher oxygen content generally resulted in higher pile temperatures [32]. This occurs because continuous aeration provides a consistent supply of oxygen, which promotes the aerobic microorganisms’ growth and metabolism. Subsequently, these microorganisms generate heat rapidly through material degradation [15]. During the thermophilic phase (temperature > 45 °C), the durations of sustained high-temperature conditions were 152 h for IA_3, 89 h for CA_1.5, and 57 h for CA_3, in descending order [6]. Li & Peng (2011) suggested that maintaining a composting temperature at 60 °C for 30 min guarantees effective pathogen inactivation [5]. All treatments met this temperature inactivation criterion. Continuous aeration shortened the thermophilic phase because a large amount of heat generated within the pile was dissipated by the continuous airflow [7]. In contrast, the intermittent aeration treatment (IA_3), despite having a slightly lower heating rate and a maximum temperature of only approximately 60 °C, achieved a longer thermophilic duration and the slowest cooling rate compared to continuous aeration strategies. Owing to its longest thermophilic duration, IA_3 promoted the most substantial organic matter degradation and emitted the highest CO2 (427.91 g kg−1 DM) (Table S1 and Figure S1) [12]. During the cooling phase, the pile temperature ranged between 35 °C and 40 °C. The composting trial was carried out during summer under high temperature, with an ambient temperature over 30 °C. The pile temperatures during the cooling phase exceeded the ambient level because microbial activity persisted, which generated heat through the decomposition of recalcitrant lignocellulosic materials [33].
A significant negative correlation was found between changes in the oxygen concentration at the reactor outlet and the temperature variations (Pearson correlation: −0.610 **; Significance: p = 0.004 (one-tailed)) (Figure 1). On the first day of composting, the oxygen concentration at the reactor outlet declined rapidly to 0.1% in CA_1.5, 12.9% in CA_3, and 1.2% in IA_3. This sharp decline was mainly attributed to the high oxygen demand for microbial growth and metabolism during the heating phase [15]. Among the treatments, CA_3 maintained the highest outlet oxygen concentration (>5%), which met the oxygen requirements of aerobic microorganisms during the heating phase. Moreover, the outlet oxygen concentrations in the continuously aerated treatments (CA_1.5 and CA_3) recovered rapidly after the initial decline (to nearly 20%). Throughout the process, the oxygen concentration in CA_3 remained higher than that in CA_1.5. Zhang et al. (2023) also found that higher aeration intensity supplies sufficient oxygen for microbial metabolism, particularly during the thermophilic phase, resulting in higher oxygen levels than lower aeration intensity [15]. IA_3 had the same total ventilation volume per unit time as CA_1.5. However, a dynamic imbalance between this periodic oxygen supply and the competition from microbial oxygen consumption or population growth metabolism resulted in the outlet oxygen concentration of IA_3 remaining below 5% for six consecutive days. Zeng et al. (2022) pointed out that the continuous oxygen supply enables rapidly restore oxygen levels after a short-term oxygen limitation compared to intermittent aeration [7]. Conversely, other studies have suggested that increasing aeration intensity can enhance the consumption of readily available organic matter, negatively affecting lignocellulose degradation and thus impeding the humification process [15].

3.2. The Dynamic Changes in the Contents of Cellulose, Hemicellulose and Lignin

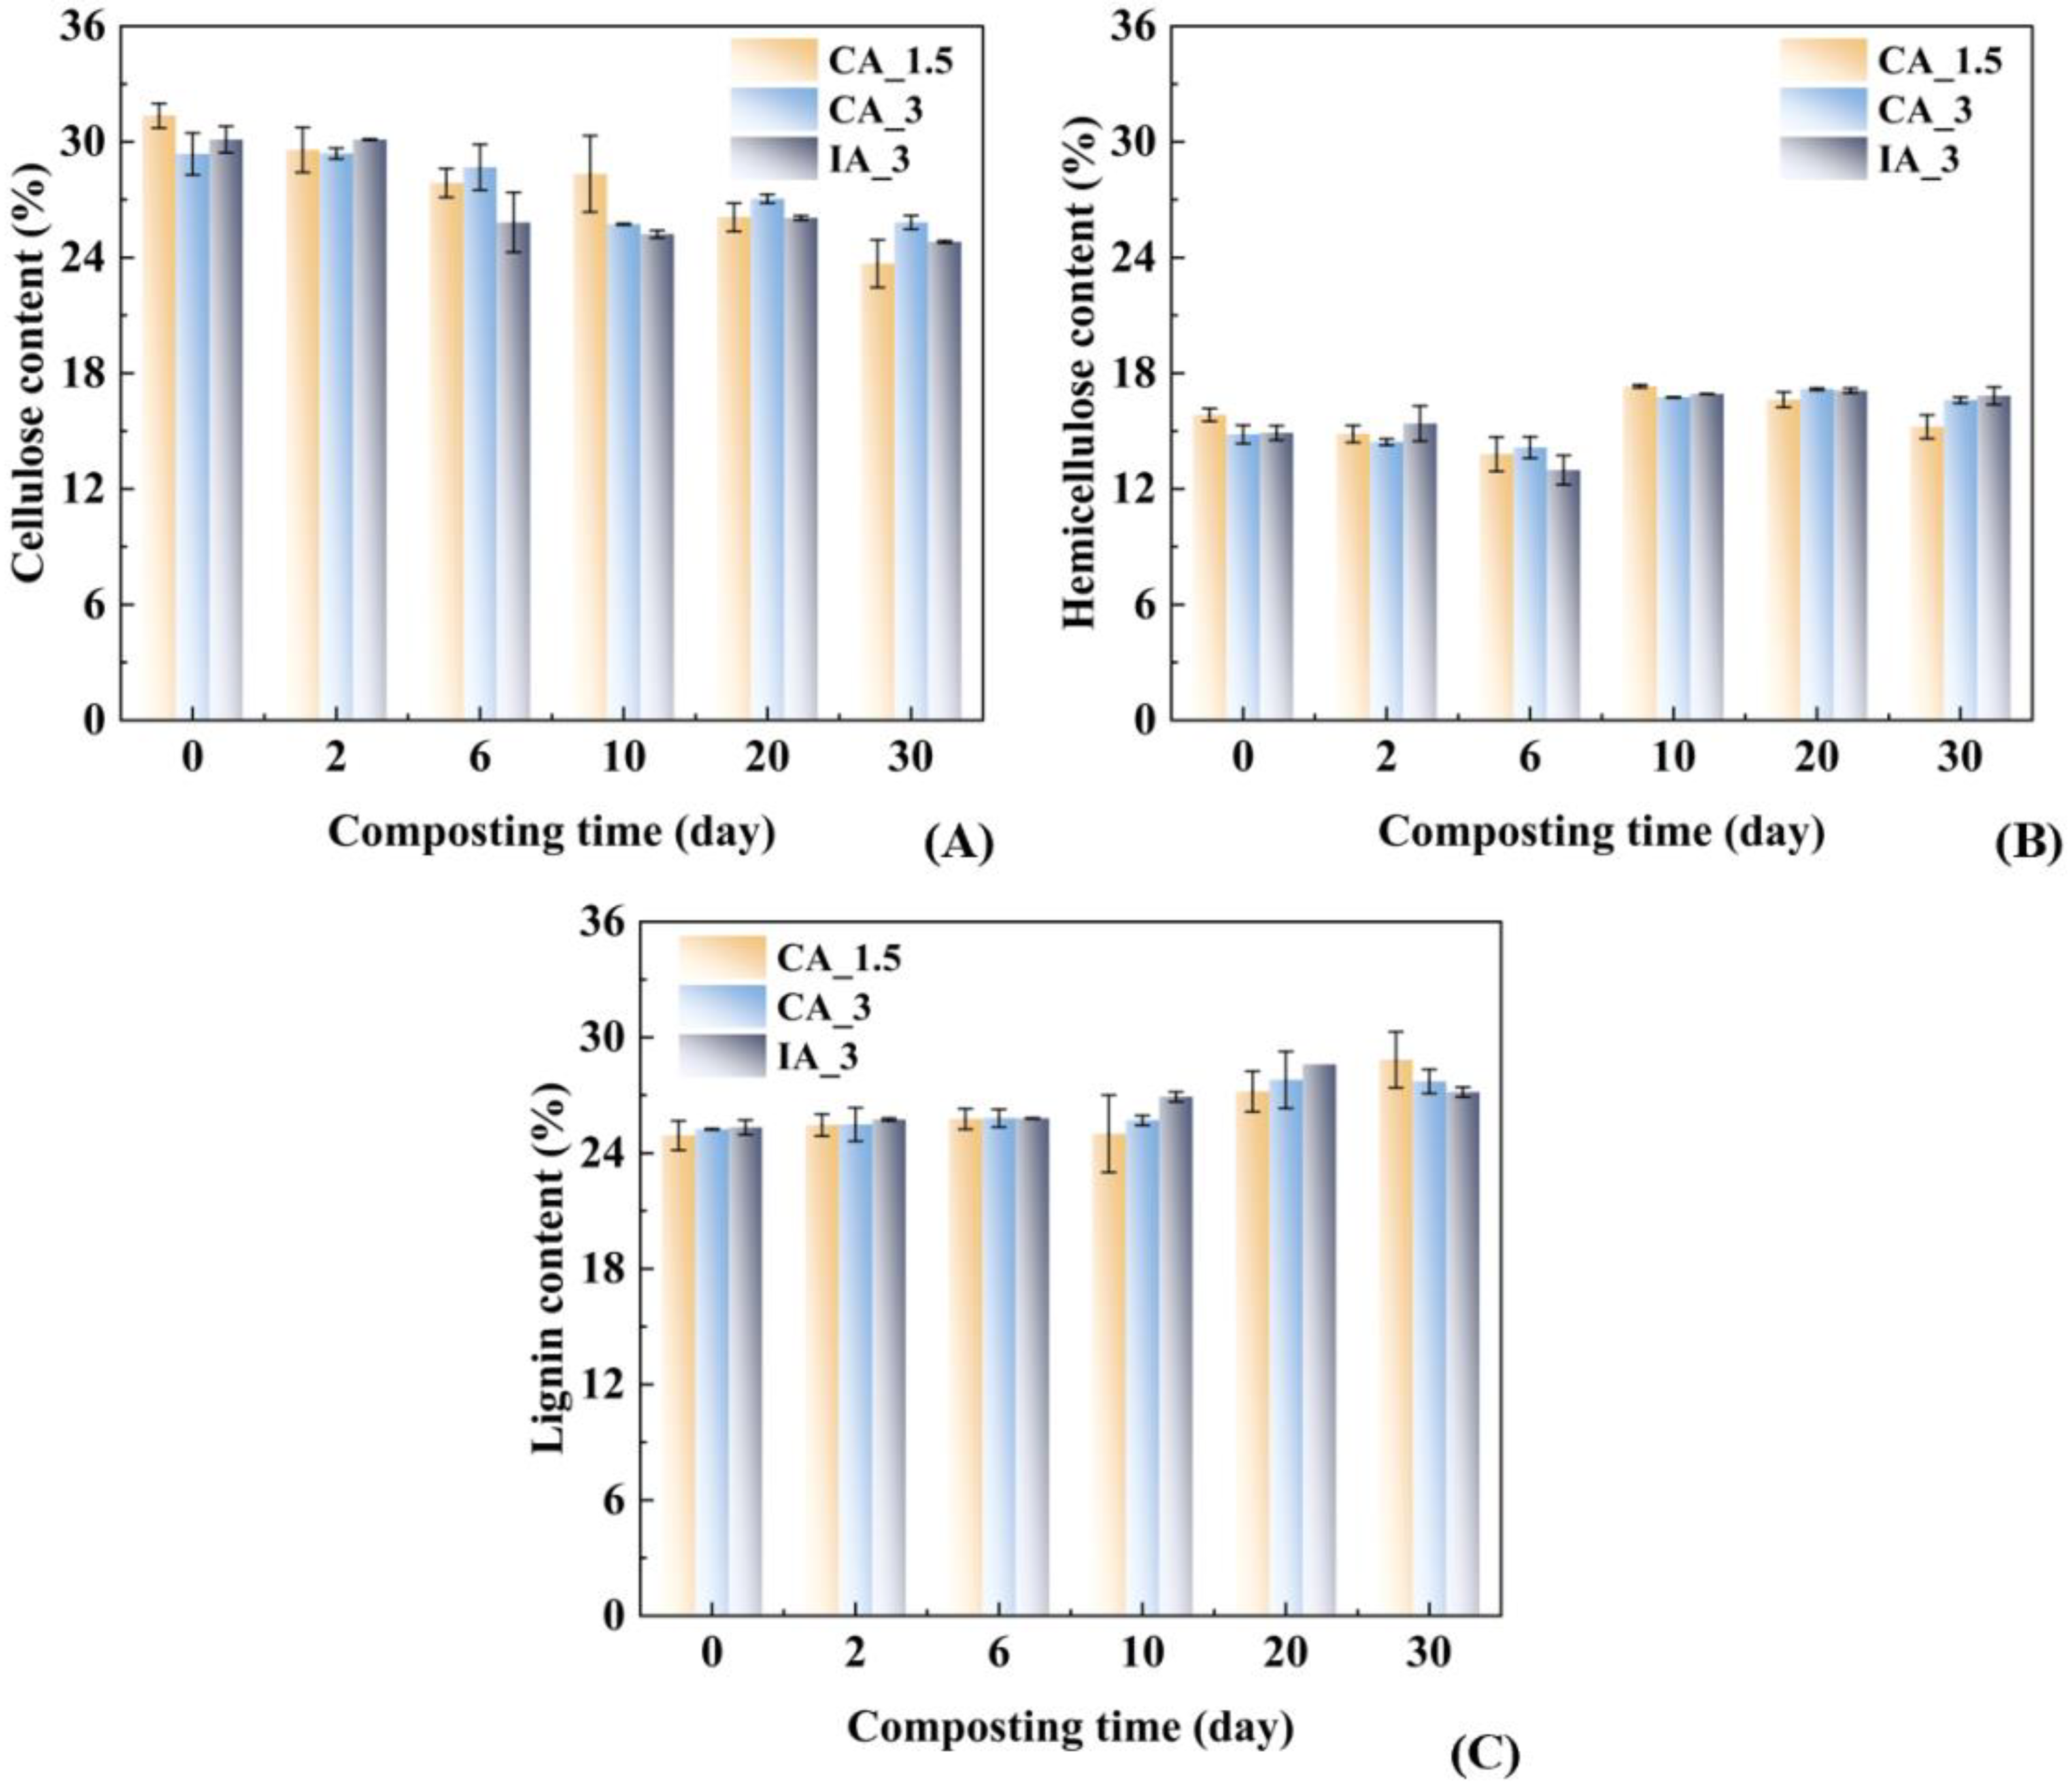
Lignocellulose degradation has been recognized as a crucial factor constraining the aerobic composting process and impacting the quality of the final product [11]. Throughout the aerobic composting process, the relative cellulose content in all treatments continuously declined (Figure 2A). By the end of the process, the cellulose content in CA_1.5, CA_3, and IA_3 had decreased by 24.49%, 12.05%, and 17.61% (p < 0.05), compared to the initial levels (Table S2). Contrary to the consistently decreasing trend of hemicellulose reported by Meng et al. (2023) [11], our findings indicated an initial decrease from day 0 to day 6, followed by an increase from day 6 to day 30 (Figure 2B). Ultimately, the combined degradation rates of cellulose and hemicellulose were 28.38% in CA_1.5, 0.01% in CA_3, and 4.73% in IA_3 (p < 0.05). The degradation of cellulose and hemicellulose mainly occurred during the thermophilic phase, ranging from 50 °C to 70 °C [34]. Correspondingly, in this study, their degradation mainly happened during the high-temperature phase. Nevertheless, hemicellulose is frequently tightly cross-linked with lignin, which elevates the difficulty of its enzymatic hydrolysis [35]. Meng et al. (2023) observed significant lignocellulose degradation under lower aeration rates, which prolonged the thermophilic duration [11]. In addition to confirming this, our study showed that under the same ventilation conditions, the intermittent aeration treatment (IA_3) with a longer thermophilic phase had a lower total degradation rate of cellulose and hemicellulose than the continuous aeration treatment (CA_1.5). Aerobic cellulolytic bacteria (e.g., Actinomycetota and Bacillota) were known to be the primary agents responsible for degrading cellulose and hemicellulose [36,37]. The maximum relative abundance of Actinomycetota and Bacillota in CA_1.5 was 43.79% and 25.52%, which were both higher than the 34.64% and 23.68% observed in IA_3 (Figure S3). The higher and more stable oxygen concentration in CA_1.5 more effectively maintained an aerobic environment in the compost pile. Conversely, the lack of a consistently stable aerobic environment in IA_3 might have limited the activity of cellulose and hemicellulose degrading enzymes [13,38].
Lignin has a complex polymeric structure and stands as the most recalcitrant component of lignocellulose [39]. During the composting process, microorganisms rapidly consumed cellulose and hemicellulose, resulting in a relative increase in lignin content [11]. As shown in Figure 2C, the relative lignin content increased over time in all treatments, which was consistent with Su et al. (2024)’s findings [40]. This occurred because microorganisms more rapidly utilized and transformed other organic components, which degraded more readily than lignin, leading to its relative enrichment [39,40]. At the end of the composting process, the increase in relative lignin content was highest in CA_1.5, followed by CA_3, and then IA_3. Notably, between days 20 and 30, the relative lignin content in IA_3 decreased from 28.60% to 27.16%. This decrease coincided with a reduction in pH and an increase in electrical conductivity (EC) in the same treatment (Figure S2). Lu et al. (2021) proposed that hydrogen ions might disrupt the dense lignin structure, facilitating its degradation [41]. In summary, low aeration rates prolonged the thermophilic phase, further weakening the protective lignin matrix and enhancing the degradation of cellulose and hemicellulose. Among the treatments, continuous aeration at a lower rate (CA_1.5) effectively balanced the thermophilic duration and the stability of oxygen supply. Notably, lignin degradation occurred during the cooling phase under intermittent aeration. This suggested that a sequential strategy—initiated with continuous aeration followed by intermittent aeration—might enhance the overall lignocellulose decomposition after hemicellulose and cellulose degradation.

3.3. The Dynamic Changes in Humus, Humic Acid, Fulvic Acid and Humic Acid/Fulvic Acid Ratio

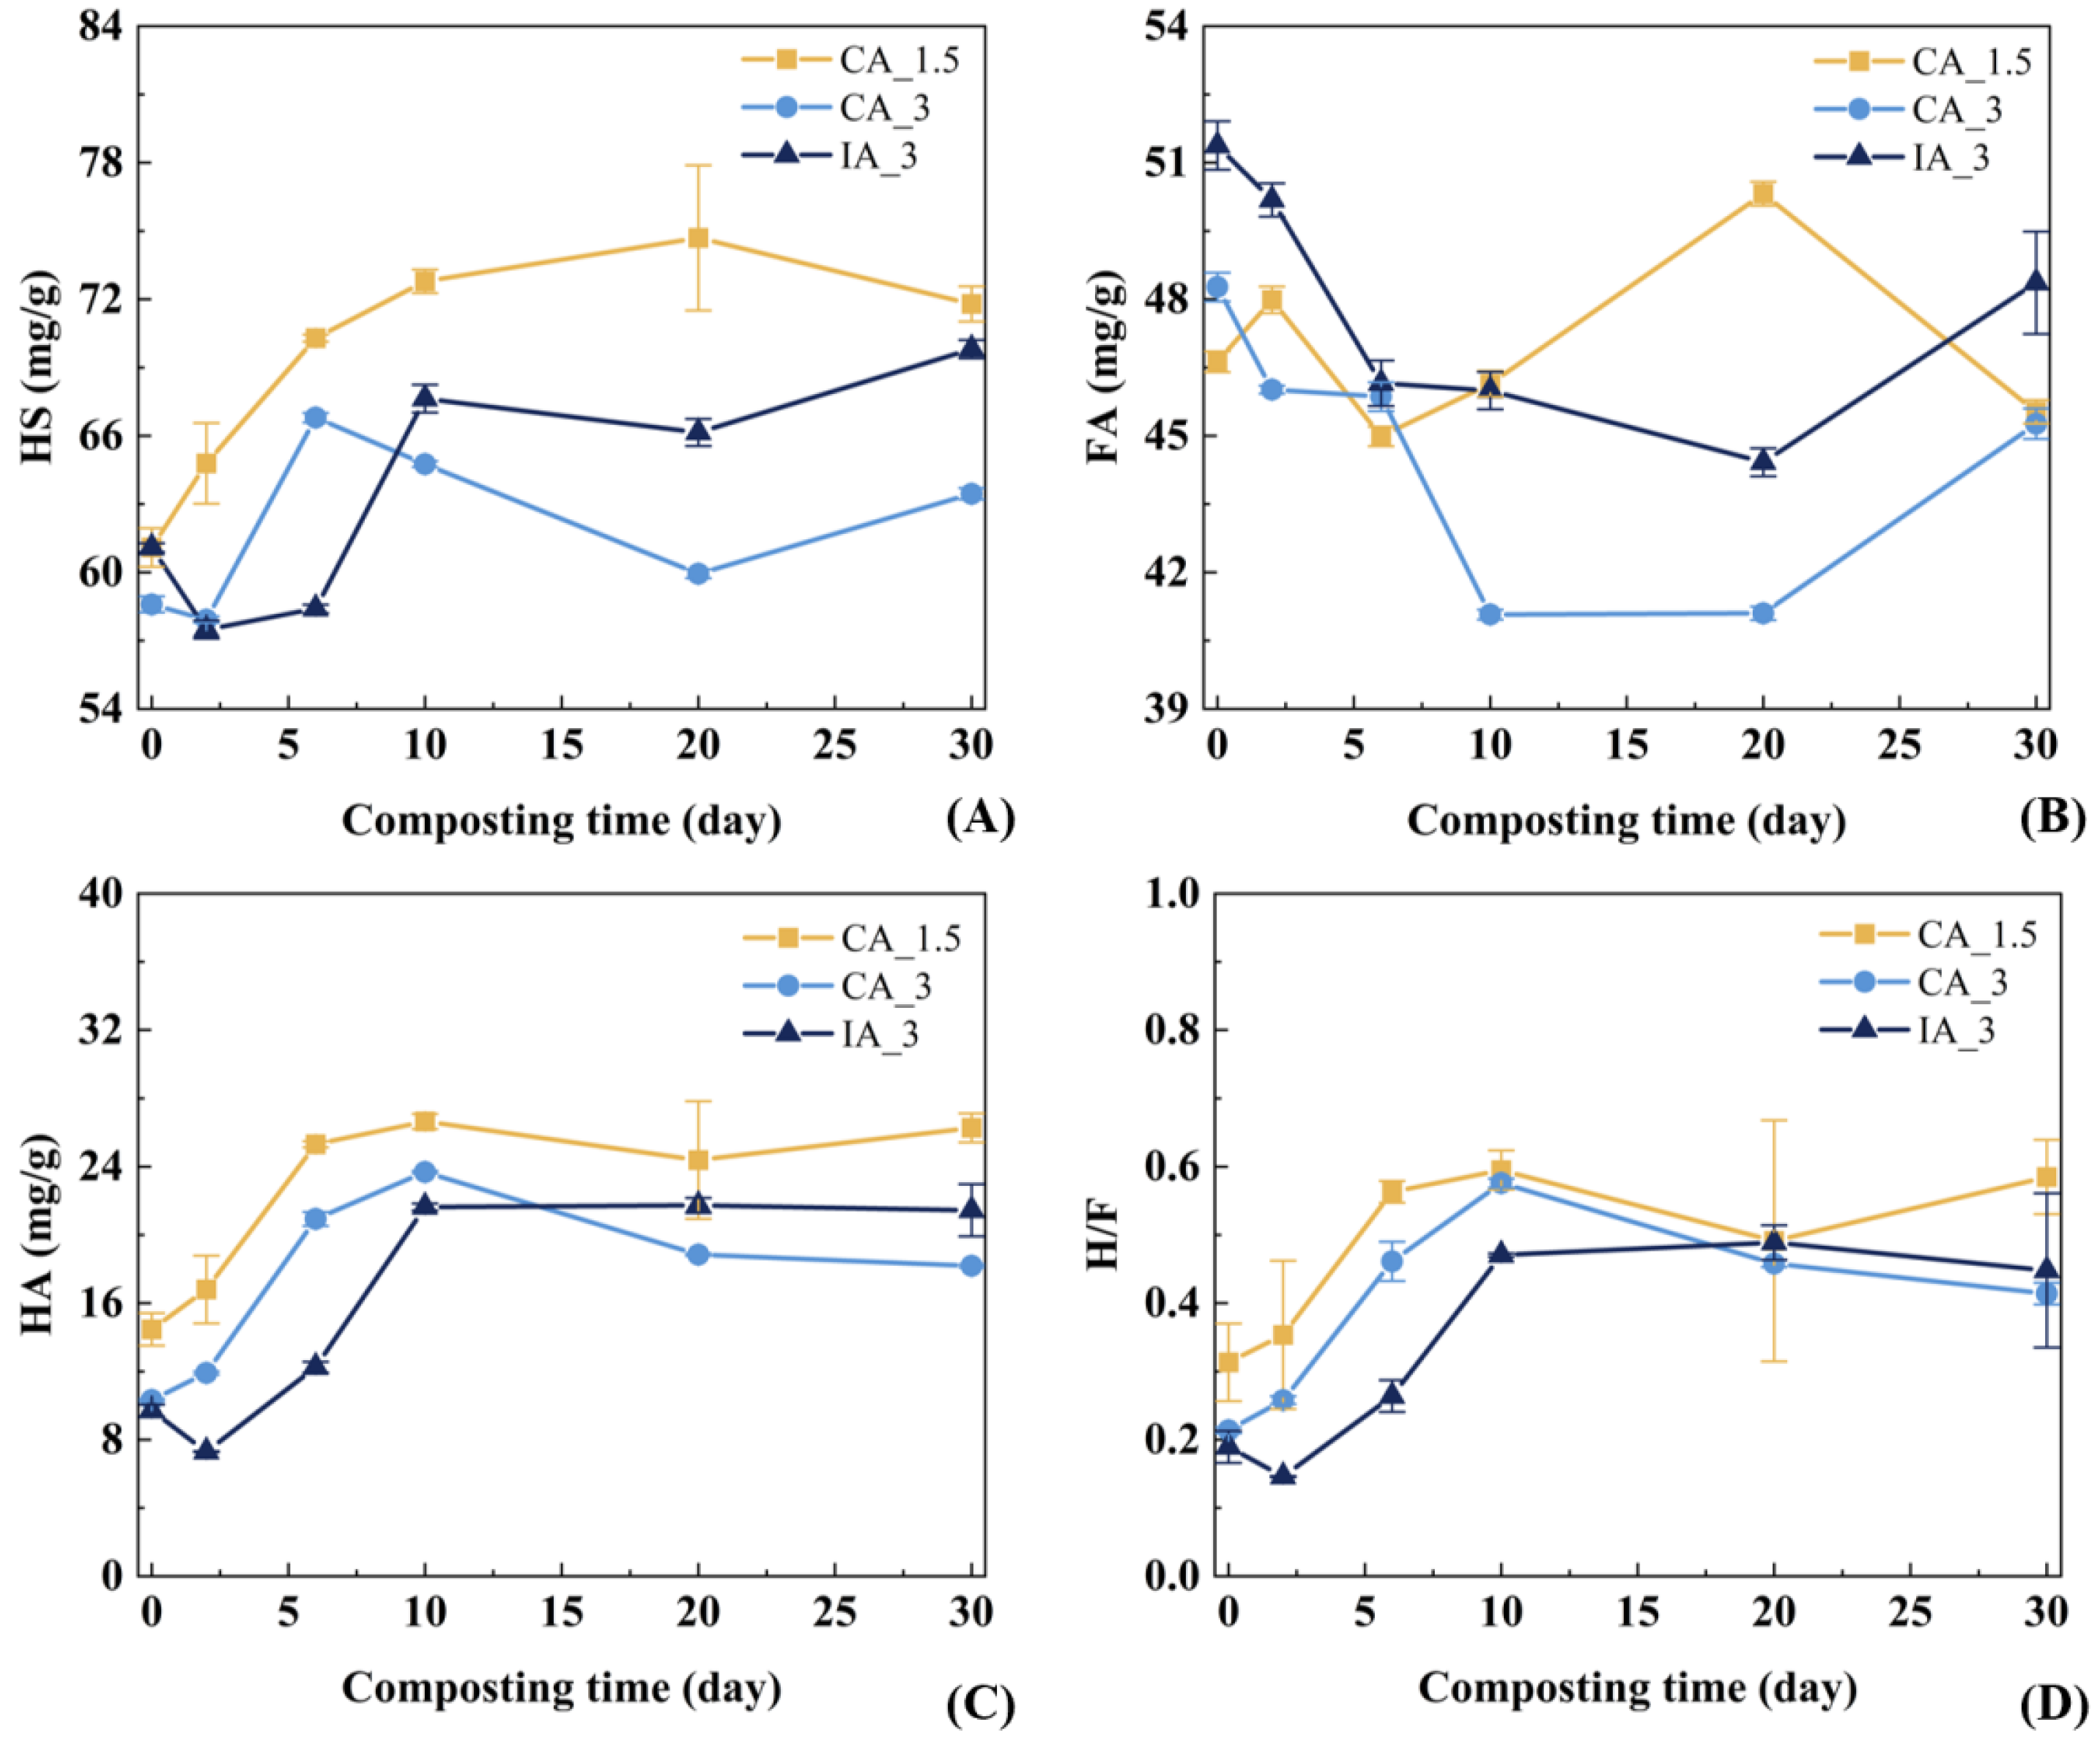
As the key indicators of compost stability, HS are mainly composed of HA and FA, and their formation is closely linked to biochemical processes driven by oxygen [12,42]. As shown in Figure 3A, the total HS content in all treatments initially decreased slightly and then increased throughout the aerobic composting period. The initial decline was due to the rapid mineralization of readily degradable OM, during which some relatively simple HS components were also decomposed [12,15]. Subsequently, microorganisms degraded complex organics such as lignocellulose. The metabolites from this process gradually increased the total HS content through polymerization and condensation reactions [36]. FA has a relatively low molecular weight (600–1500 Da) and is water-soluble [43]. It is considered an intermediate product or incompletely polymerized component in HS formation [44].
As shown in Figure 3B, FA content in all treatments followed a similar trend of initially decreasing and then increasing. This reflected the role of FA as an intermediate in HS formation [44]. The early decrease in FA might be attributed to its consumption for forming more stable HA, while the later increase suggested a relative slowdown in HA formation, allowing FA to accumulate again [40]. HA with a higher degree of aromaticity and polymerization is generally regarded as an indicator of compost stability [45]. As shown in Figure 3C, HA content in all treatments increased continuously and stabilized toward the end of composting. CA_1.5 exhibited the fastest increase, achieving the highest final HA level. Combined with its highest cellulose degradation rate, this highlighted the importance of stable aeration and prolonged thermophilic duration for HA formation. IA_3 also exhibited notable HA accumulation, ultimately reaching 21.45 mg/g. This was attributed to its longer cooling phase, providing favorable conditions for the gradual HA polymerization and stabilization. In contrast, CA_3 showed the slowest increase in HA content and the lowest final level, suggesting its lower lignocellulose degradation efficiency limited HA formation [12,42].
The H/F which was widely regarded as a key indicator of compost maturity and stability reflected the transformation of humic substances from readily degradable, low polymerization forms to more recalcitrant and highly polymerized forms [46]. In all treatments, the H/F increased initially and then stabilized (Figure 3D). This stabilization likely resulted from inhibited HA formation in the later phase, while simpler HS components such as FA continued to accumulate or remained relatively stable [36]. At the end of aerobic composting, CA_3, CA_1.5, and IA_3 showed no significant differences in H/F values. All values were below the 1.9 threshold reported in the literature [5]. This may be attributed to the high lignin content (approximately 25%) in the solid fraction of dairy manure, which is more resistant to degradation. Compared to the initial H/F, the values increased by 88.93% in CA_3, 81.53% in CA_1.5, and 118.45% in IA_3 (Table S2). IA_3 experienced a longer period of oxygen-limited conditions during the thermophilic phase, followed by an extended cooling and maturation phase. During this period, the pH value of the pile was between 8.3 and 8.6. This prolonged and mild maturation environment allowed a longer time window for the microbial conversion and polymerization of FA to HA, enhancing the H/F [37]. Zhang et al. (2023) reported that a low aeration rate of 0.1 L min−1 kg−1 DM achieved the best humification effect, while higher aeration rates led to excessive OM mineralization and inhibited humification [15]. Similarly, Zhao et al. (2022) found that intermittent aeration resulted in higher humus formation (29.3%) than continuous aeration (24.7%), attributing to OM mineralization caused by over-aeration [47]. In this study, we compared the effects of different aeration modes under the same aeration rate (CA_1.5 vs. IA_3). The results indicated that intermittent aeration at a low rate was more favorable for humus stabilization.

3.4. Analysis of Carbohydrate-Active Enzyme Genes

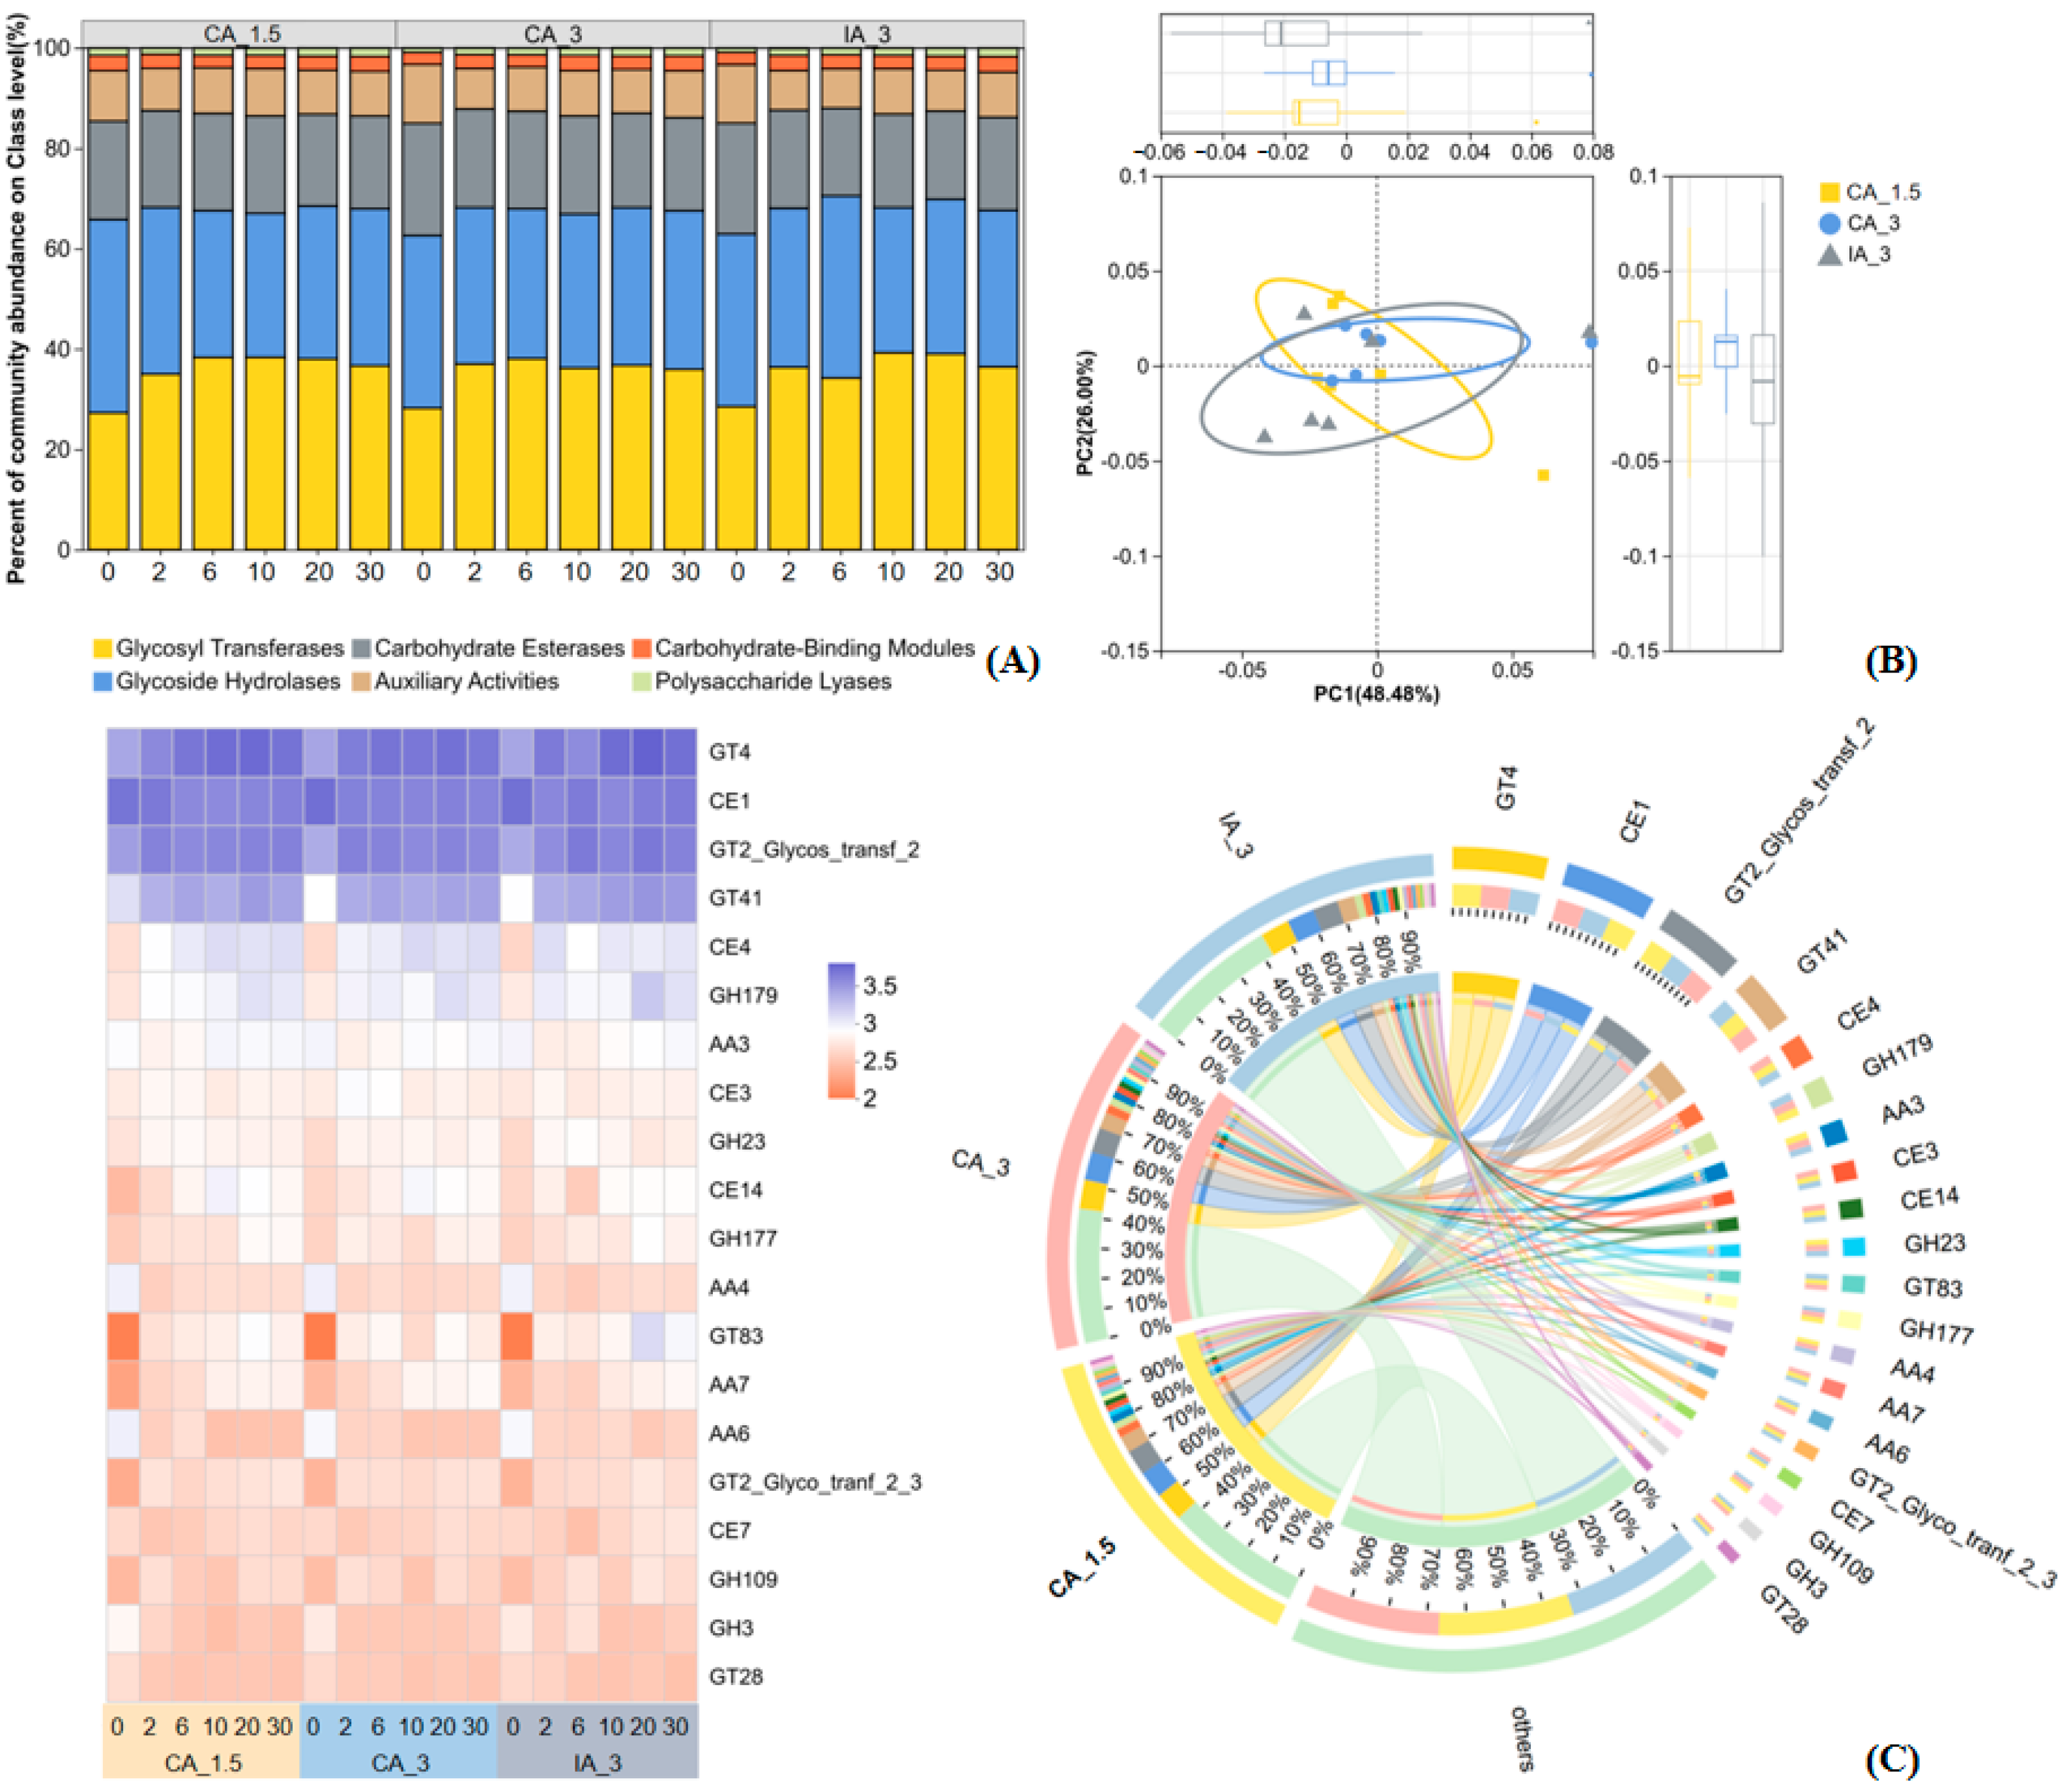
CAZymes are key enzymes involved in the microbial degradation, modification, and synthesis of carbohydrates, whose functional potential directly determines the transformation efficiency of complex OM and the formation of HS during aerobic composting [48]. Figure 4A showed the relative abundance of the six major CAZyme classes—glycosyl transferases (GTs), glycoside hydrolases (GHs), carbohydrate esterases (CEs), carbohydrate-binding modules (CBMs), auxiliary activities (AAs), and polysaccharide lyases (PLs) across treatments throughout the composting process. GTs are known to facilitate lignocellulose breakdown into smaller molecules, which can repolymerize to form HS [18]. GHs decompose polysaccharides such as cellulose and hemicellulose by hydrolyzing glycosidic bonds [48,49]. As shown in Figure 4A, GTs, GHs, and CEs together accounted for more than 80% of the total relative abundance across all treatments, indicating dominance in carbohydrate metabolism during composting. Principal coordinate analysis (PCoA) based on the Bray–Curtis distance matrix was performed (Figure 4B). The first two principal coordinates explained 48.48% and 26.00% of the total variation, respectively. CA_3 samples formed the tightest cluster, suggesting the lowest degree of variation in CAZyme gene composition [14]. Under the same aeration rate, different aeration modes (CA_1.5 vs. IA_3) drove the CAZyme communities in different directions. During aerobic composting, different aeration processes also influenced the microbial composition, and changes in microbial abundance drove the succession of CAZymes functional genes. (Figure S3). The compost microbial community is dominated by Pseudomonadota, Actinomycetota, Bacillota and Bacteroidota, accounting for more than 63% of the total relative abundance across all treatments. Figure S4 presents the redundancy analysis results conducted on the genus-level community. The oxygen concentration at the reactor outlet was negatively correlated with cellulose degradation and FA accumulation, but positively correlated with hemicellulose degradation as well as HS and H/F. On the 2nd and 6th days of composting, microorganisms mainly decomposed cellulose and accumulated FA. Subsequently, FA was converted into HA. Ge et al. (2020) and Zhang et al. (2021) aslo confirmed through redundancy analysis that cellulase activity onegatively correlated with temperature and oxygen concentration [13,50]. Therefore, continuous aeration at a low rate (CA_1.5), balancing maximum temperature and stable oxygen supply, guided the CAZyme community toward a composition more favorable for lignocellulose degradation.
Figure 4C showed the top 20 most abundant CAZyme families in each treatment. Among the three most abundant families, GT4 and Gt2_Glycos_transfer_2 increased in abundance throughout the composting period, while CE1 continuously decreased. Compared to day 0, GT4 abundance on day 30 increased by 76.70% in CA_1.5, 62.21% in CA_3, and 79.20% in IA_3. Low aeration treatments promoted GT4 abundance, which may be more conducive to HS formation [18]. Gt2_Glycos_transfer_2 of the IA_3 treatment reached its highest abundance among all samples on day 20. This family belongs to the GT2 family, catalyzing the transfer of glycosyl groups from activated sugar donors to specific acceptor molecules—a function similar to that of GT4 [51]. Chen et al. (2025) reported that CE1’s involvement in hemicellulose degradation [52]. As the pile cooled and hemicellulose degradation slowed, CE1 abundance correspondingly decreased. CA_3 showed the highest CE1 abundance on day 0 but the lowest on day 30 among all treatments. This suggested that high aeration rates suppressed CE1’s functional potential, partially explaining the limited lignocellulose degradation observed in this group [14]. In summary, different aeration rates drove the CAZyme communities in divergent directions. Low aeration increased the abundance of GTs and enhanced humification. In contrast, high aeration inhibited CE1, likely hindering lignocellulose degradation.

3.5. Mantel Test Analysis of Correlations Between CAZymes and Environment

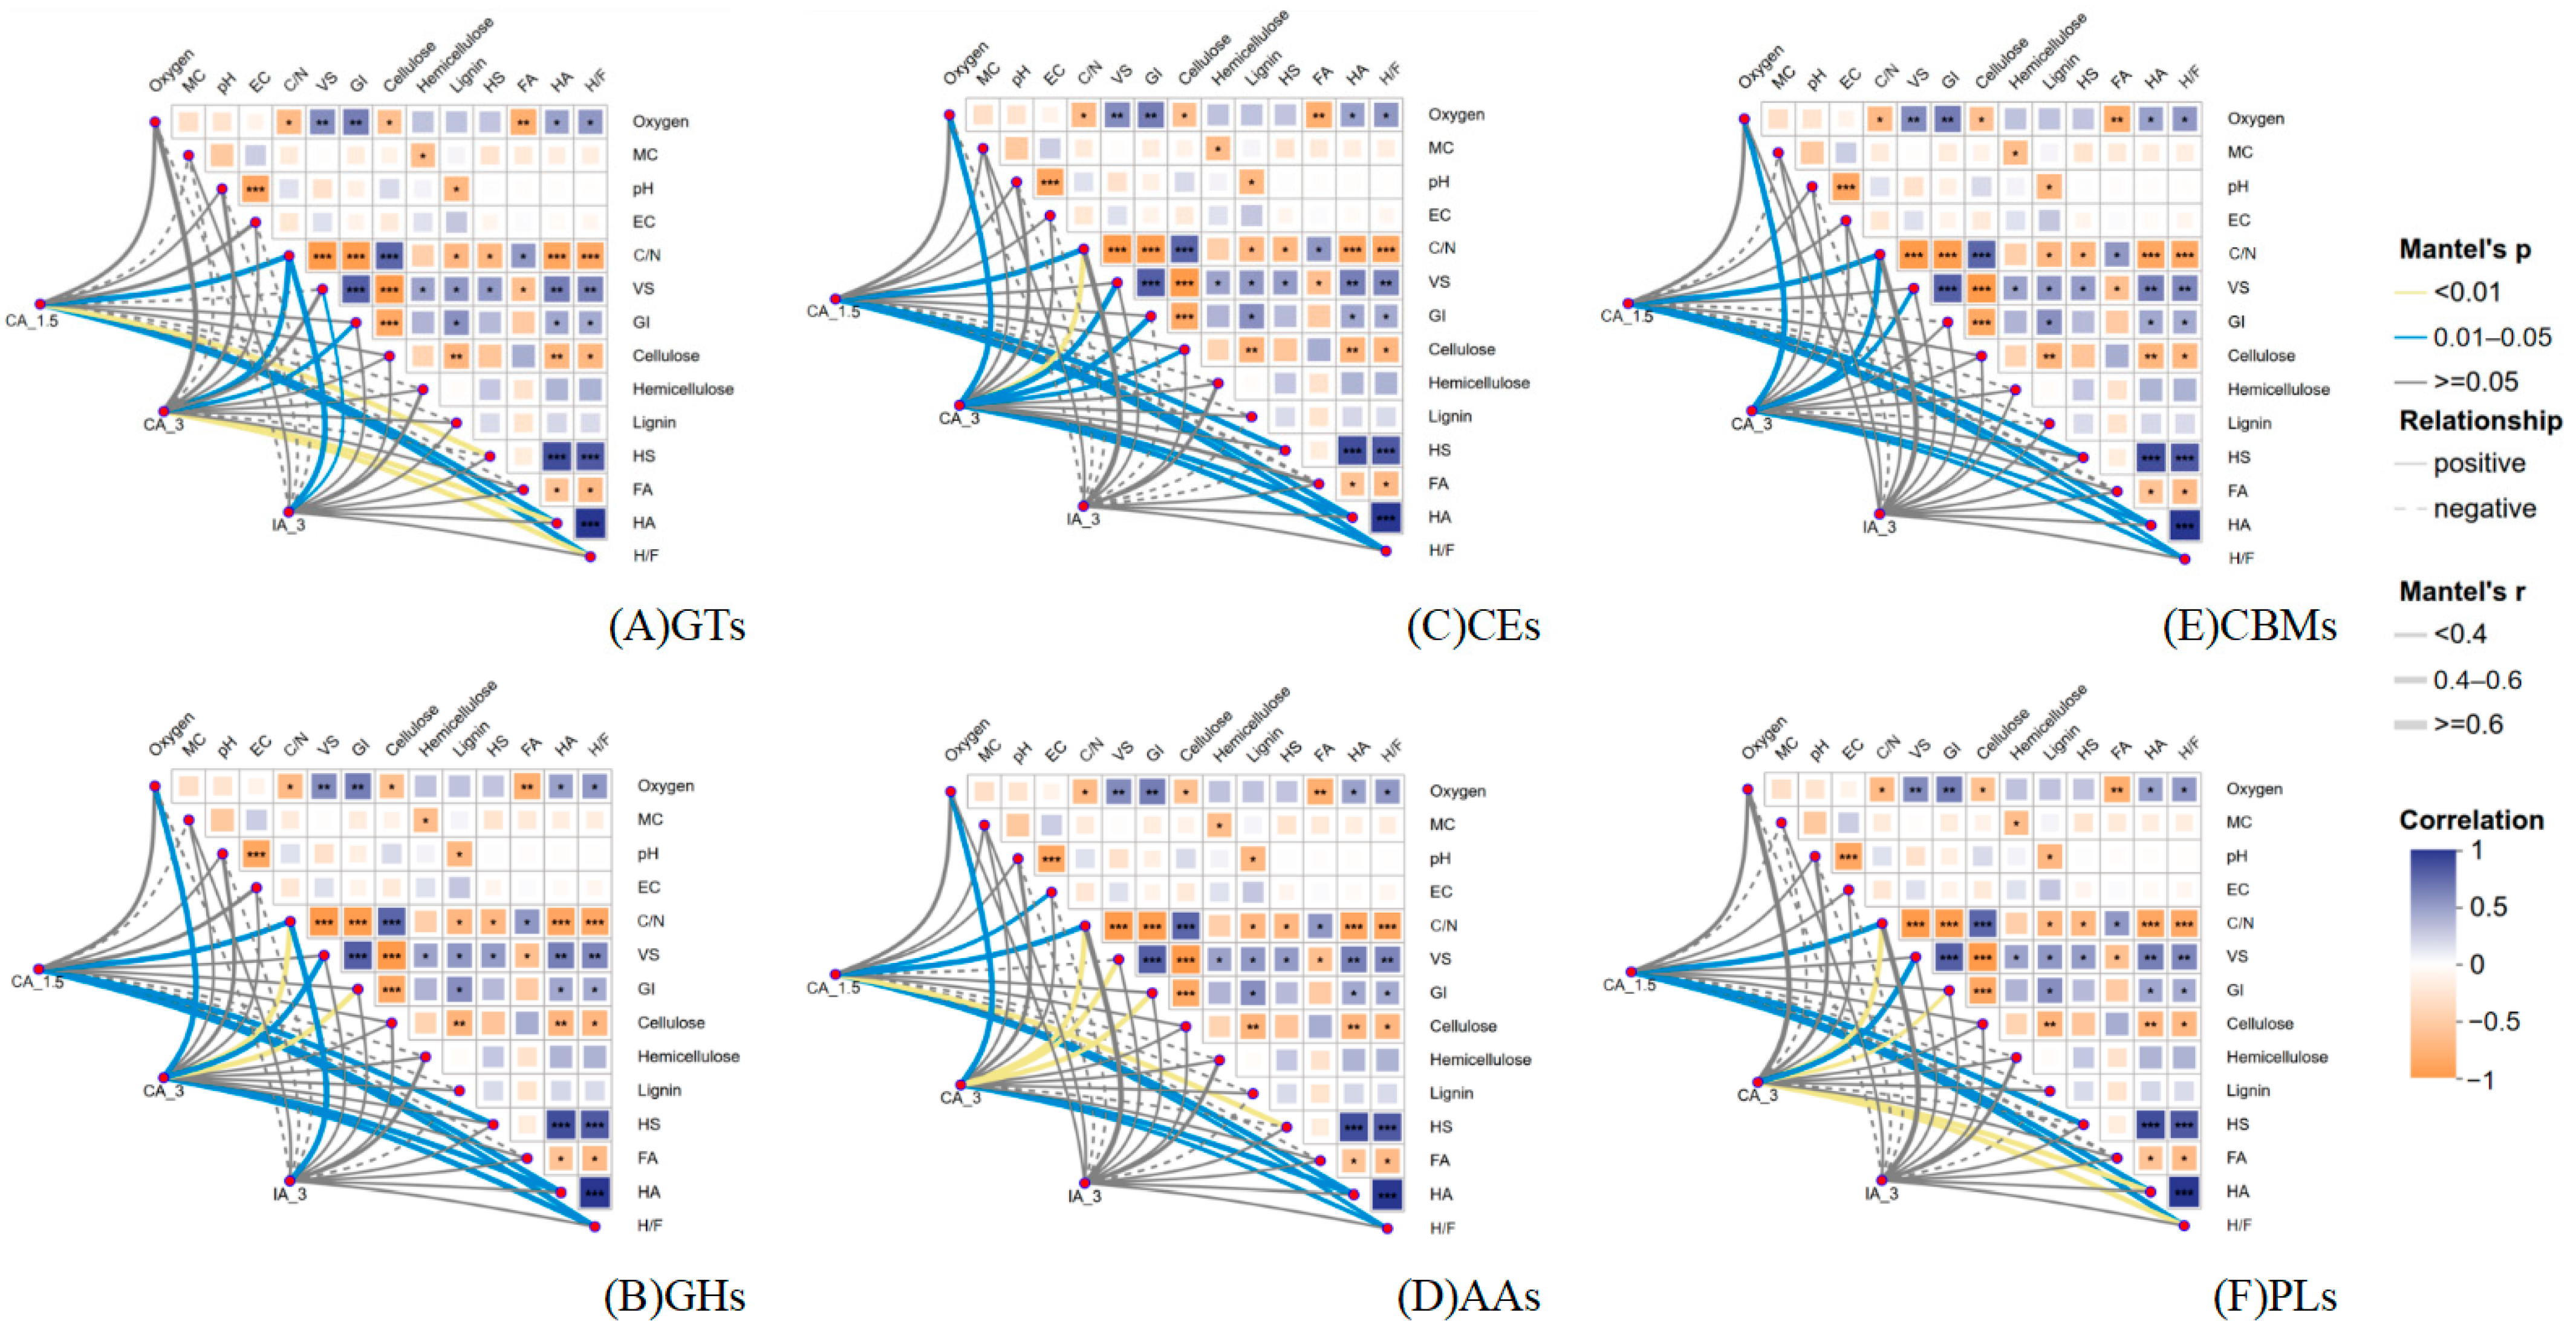
A Mantel test was conducted to explore the correlations between class level CAZymes abundance and environmental factors during composting (Figure 5). Changes in MC, volatile solids (VS), pH, carbon-to-nitrogen ratio (C/N), EC, and germination index (GI) are shown in Figure S2. The heatmap displayed pairwise pearson correlations among environmental factors, with lines indicated significant correlations between CAZyme classes abundance and environmental factors based on Mantel test results. The results showed that oxygen concentration at the reactor outlet was significantly negatively correlated with FA, and significantly positively correlated with HA and the H/F. This was explained by the transition into the maturation phase: as microbial activity declined, oxygen concentration recovered and the pile cooled, facilitating the conversion of FA into HA [5]. In all three treatments, class level CAZyme abundances were generally positively correlated with C/N. A high C/N typically indicated a relatively abundant carbon source, potentially stimulating the decomposition of carbohydrates by microorganisms(e.g., Actinomycetota and Bacillota) and enhance related CAZymes expression [53].
In CA_1.5, all six CAZyme classes showed significant positive correlations with HS, HA, and the H/F. In CA_3, all six classes were also significantly positively correlated with HA and H/F. In addition, enzyme classes including GHs, CEs, AAs, and CBMs showed significant positive correlations with oxygen concentration at the reactor outlet. In contrast, IA_3 showed no significant correlations between CAZyme classes and environmental factors. Considering the lowest cellulose degradation and moderate H/F increase in CA_3, maintaining thermophilic duration is inferred to be more crucial than a high aeration rate in limiting lignocellulose conversion to stable humic substances. In IA_3, alternating aerobic and anaerobic conditions enhanced microorganisms’ adaptability to oxygen concentration fluctuations. This likely weakened the interactions between enzyme activities and environmental factors. Intermittent aeration favored microbial communities more tolerant to oxygen fluctuations. As a result, substrates for microbial growth and metabolism shifted from readily degradable carbohydrates and proteins to more recalcitrant components, including lignin residues, residual cellulose, and HS precursors [12,54,55]. Furthermore, the aerobic-anaerobic/anoxic cycles led to periodic changes in the system redox potential. This promoted the formation of new phenolic/quinone groups, potentially facilitating the humic substances condensation [56,57].

3.6. Correlation Network Analysis

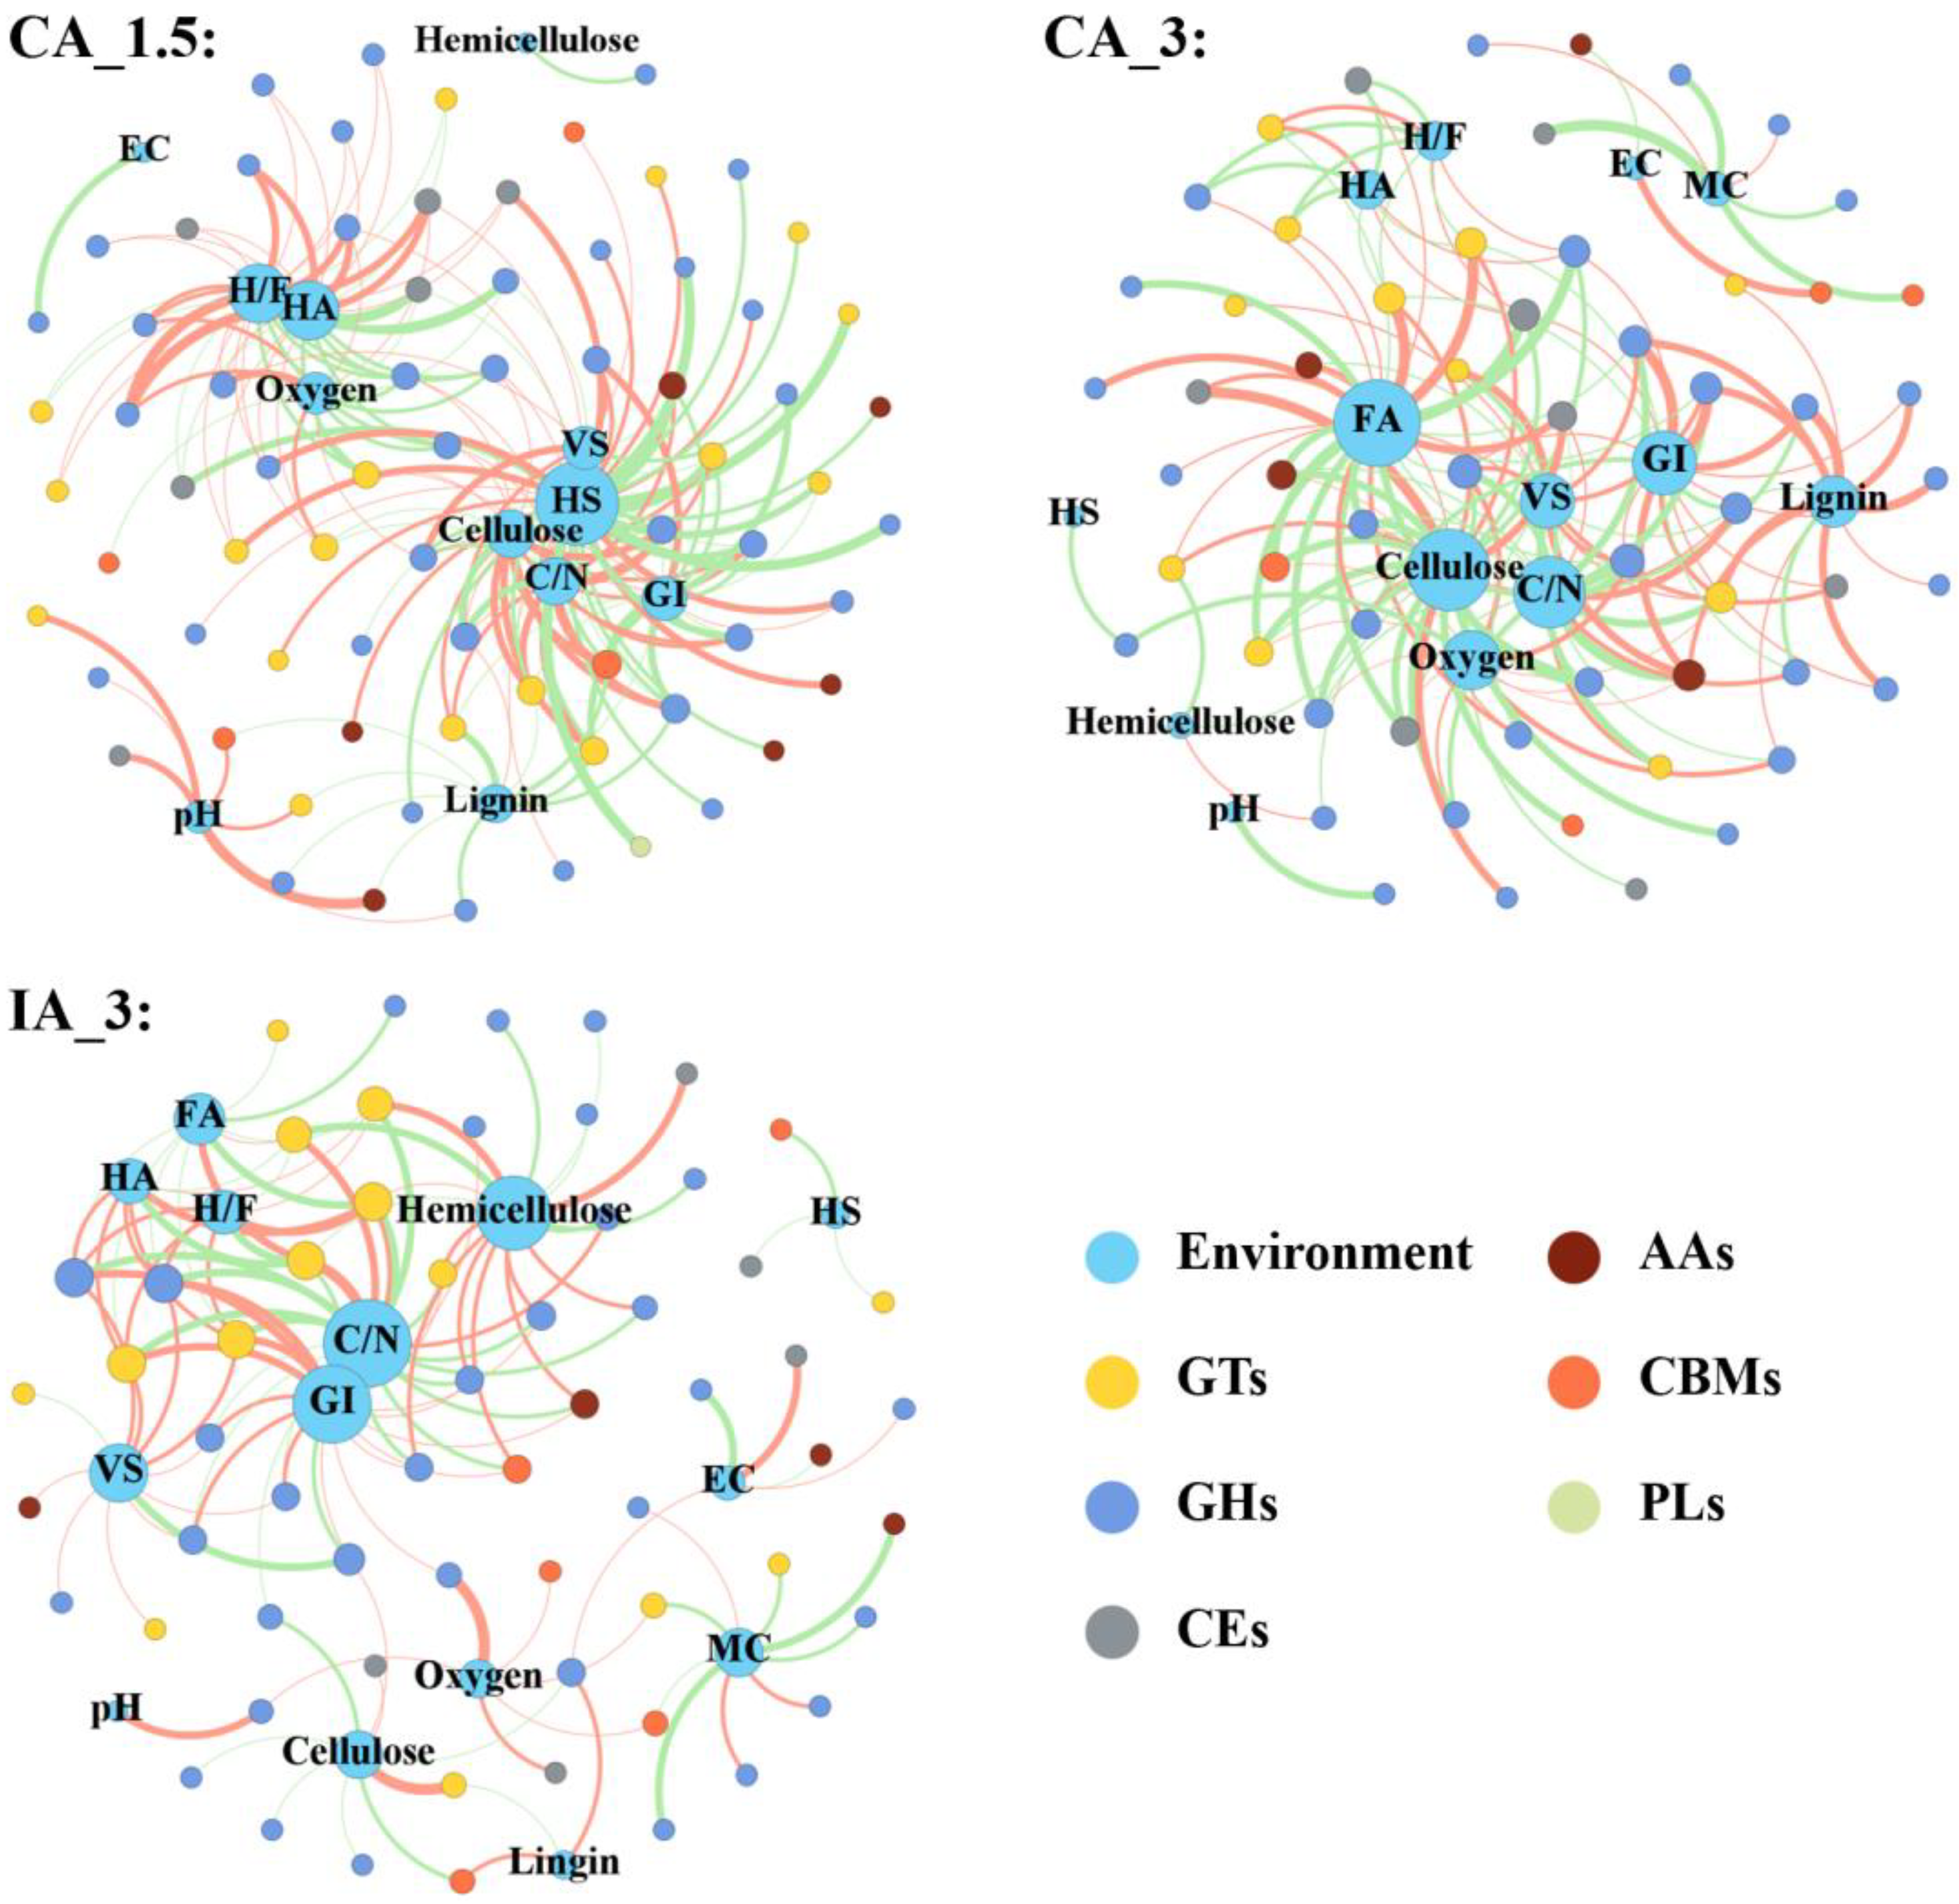
The Mantel test described in Section 3.5 focused on the overall correlations between enzyme profiles and environmental factor matrices [30]. Bivariate correlation network analysis can identify more specific pairwise associations [58]. The top 100 most abundant CAZyme families were selected for network analysis (Figure 6). Among the three treatments, IA_3 formed the sparsest network, with the lowest average degree (3.514) and graph density (0.048) (Table 2). However, both IA_3 and CA_1.5 had a modularity value of 0.484, higher than CA_3’s 0.416. This indicated that in low aeration treatments, CAZyme families and environmental factors tended to cluster into functionally related modules. Under intermittent aeration conditions, microbial communities such as Pseudomonadota, Actinomycetota, Bacillota and Bacteroidota (which carry and express CAZymes genes) were enriched to adapt to the alternating environment of oxygen limitation and aerobic conditions. This is consistent with the observed changes in taxonomic composition in our microbial community analysis (Figure S3). In the IA_3 network, several CAZyme families including GT41, GT2_Glyco_tranf_2_3, GT9, GH13_11, GH13_3, and GT8, showed the highest degree centrality (0.08219). Degree centrality is a direct measure of node importance in network analysis; the higher the degree centrality, the more central the node [31]. In contrast, no family in CA_1.5 exceeded 0.08, while only GH15 and GH184 in CA_3 reached a degree centrality of 0.08333. Although the periodic oxygen fluctuations in IA_3 limited the overall interactions between CAZymes and environmental factors, they amplified the importance of GTs and GHs within the network. Zhang et al. (2021) reported that different intermittent aeration frequencies altered the pile’s oxygen concentration, influenced microbial succession, and subsequently affected the activity of enzymes released by these bacteria [50]. Compared to continuous aeration, which favored broad carbohydrate degradation, intermittent aeration promoted humification through the synergistic action of GHs and GTs. Specifically, GHs drove the hydrolysis of macromolecular polysaccharides, continuously releasing humification precursors such as phenolic compounds and soluble sugars [36]. Concurrently, GTs catalyzed the conjugation of glycosyl groups with aromatic precursors, forming glycosidic intermediates [59]. De Winter et al. (2015) and Trobo-Maseda et al. (2023) demonstrated that such glycosylation modifications enhanced phenolic compounds’ water solubility and stability, making them more reactive in the composting environment [59,60]. These glycosidic intermediates then served as ideal substrates for subsequent oxidative polymerization and condensation reactions, forming stable humic substances [61]. Therefore, intermittent aeration enhanced GHs and GTs activities, enabling more efficient conversion of lignocellulose into complex and stable humic macromolecules.

4. Conclusions

Continuous aeration treatments (CA_1.5 and CA_3) resulted in a short thermophilic phase with sufficient oxygen supply. In contrast, intermittent aeration (IA_3) achieved a longer thermophilic duration but exhibited low outlet oxygen concentration during the thermophilic and cooling phases. Continuous aeration at a low rate (CA_1.5) balanced thermophilic duration and oxygen supply stability, leading to the best cellulose and hemicellulose degradation. Intermittent aeration (IA_3), with its relatively stable cooling phase, provided sufficient time for FA to convert into HA. Low aeration (CA_1.5 and IA_3) directed the CAZyme communities towards a composition favoring lignocellulose degradation. Low aeration also increased GT abundance, thereby promoting humification. In contrast, high aeration inhibited CE1, hindering lignocellulose degradation. Ultimately, low-rate intermittent aeration (IA_3) enhanced GH and GT synergy, enabling more efficient lignocellulose conversion into complex and stable humic macromolecules. Future studies could explore intermittent aeration processes with varying aeration rates at different composting stages. Additionally, extending the composting period could allow a more comprehensive assessment of the compost’s long-term stability. Such approaches may better meet microorganisms’ high oxygen demand during the thermophilic phase while maintaining adequate thermophilic duration, thereby achieving optimal humification.

Supplementary Materials

The following supporting information can be downloaded at: https://www.mdpi.com/article/10.3390/fermentation12040170/s1. Table S1. Comparative summary of greenhouse gas emissions and global warming potential from various composting treatments. Table S2. Growth rates of H/F and degradation rates of cellulose, hemicellulose, and lignin. Figure S1. Emission rate and total emissions of carbon dioxide (CO2) (A), methane (CH4) (B), ammonia (NH3) (C), and nitrous oxide (N2O) (D). Figure S2. Dynamic changes of moisture content (MC) and volatile solids (VS) (A), pH and carbon to nitrogen ratio (C/N) (B), electrical conductivity (EC) and germination index (GI) (C). Figure S3. Microbial community composition at the phylum level (A) and the genus level (B). Figure S4. Redundancy analysis (RDA) of genus level communities consrtained by oxygen, lignocellulose and humification factors. References [19,21,62,63,64,65,66,67] are cited in the Supplementary Materials.

Author Contributions

Conceptualization, Y.C.; Methodology, Y.C. and X.H.; Software, Y.C.; Validation, Y.C.; Formal Analysis, Y.C. and H.Z.; Investigation, Y.C., H.W. and H.Z.; Resources, X.H.; Data Curation, X.H.; Writing—Original Draft Preparation, Y.C. and X.H.; Writing-Review and Editing, Y.C. and X.H.; Visualization, Y.C.; Supervision, X.H.; Project Administration, X.H.; Funding Acquisition, X.H. All authors have read and agreed to the published version of the manuscript.

Funding

This research received no external funding.

Data Availability Statement

The original contributions presented in this study are included in the article/Supplementary Material. Further inquiries can be directed to the corresponding author.

Acknowledgments

This work was supported by the Basic Research Fund of China Agricultural University (Grant Nos. 2025TC081, 2024TC127). We gratefully acknowledge the Agricultural Biomass Resource Utilization Engineering Laboratory of the College of Engineering at China Agricultural University for providing the composting experimental conditions and analytical testing platform. We also sincerely thank Shanghai Meiji Biotechnology Co., Ltd. for their essential support in performing metagenomic sequencing.

Conflicts of Interest

The authors declare no conflicts of interest.

References

  1. Sajjad, J.; Mohammad, F.; Mohammad, A.H.; Mehdi, R.; Morteza, H. Conceptual design and economic evaluation of an integrated anaerobic digestion system for sustainable dairy manure management. Energy 2025, 336, 138203. [Google Scholar] [CrossRef]
  2. Atsebaha, G.K.; Tsehaye, A.; Enquebaher, K. Fecal carriage, risk factors, and antimicrobial susceptibility patterns of Salmonella from lactating cows and contact humans at the dairy farm level in Mekelle and Southeast Zones of Tigrai, Northern Ethiopia. BMC Infect. Dis. 2025, 25, 1736. [Google Scholar] [CrossRef] [PubMed]
  3. Duan, M.L.; Zhang, Y.H.; Zhou, B.B.; Qin, Z.L.; Wu, J.H.; Wang, Q.J.; Yin, Y.A. Effects of Bacillus subtilis on carbon components and microbial functional metabolism during cow manure-straw composting. Bioresour. Technol. 2020, 303, 122868. [Google Scholar] [CrossRef] [PubMed]
  4. Luo, J.; Zhao, L.X.; Yao, Z.L.; Feng, J.; Yu, J.D.; Yuan, Y.W. Construction and application of comprehensive evaluation index system for waste treatment on intensive livestock farms. Trans. Chin. Soc. Agric. Eng. 2020, 36, 182–189. [Google Scholar]
  5. Li, J.; Peng, S.P. Practical Handbook of Composting Engineering, 2nd ed.; Chemical Industry Press: Beijing, China, 2011; pp. 1+261–285. [Google Scholar]
  6. Haug, R.T. The Practical Handbook of Compost Engineering; CRC Press: Boca Raton, FL, USA, 1993; pp. 1+261–285. [Google Scholar]
  7. Zeng, J.F.; Shen, X.L.; Yin, H.J.; Sun, X.X.; Dong, H.M.; Huang, G.Q. Oxygen dynamics, organic matter degradation and main gas emissions during pig manure composting: Effect of intermittent aeration. Bioresour. Technol. 2022, 361, 127697. [Google Scholar] [CrossRef] [PubMed]
  8. Kulcu, R.; Yaldiz, O. Determination of aeration rate and kinetics of composting some agricultural wastes. Bioresour. Technol. 2004, 93, 49–57. [Google Scholar] [CrossRef]
  9. Jiang, T.; Li, G.X.; Tang, Q.; Ma, X.G.; Wang, G.; Schuchardt, F. Effects of aeration method and aeration rate on greenhouse gas emissions during composting of pig feces in pilot scale. J. Environ. Sci. 2015, 31, 124–132. [Google Scholar] [CrossRef]
  10. Fu, T.; Shangguan, H.Y.; Wei, J.R.; Wu, J.X.; Tang, J.H.; Zeng, R.J.; Zhou, S.G. In-situ electrolytic oxygen is a feasible replacement for conventional aeration during aerobic composting. J. Hazard. Mater. 2022, 426, 127846. [Google Scholar] [CrossRef] [PubMed]
  11. Meng, X.Y.; Wang, Q.P.; Zhao, X.X.; Cai, Y.F.; Fu, J.Y.; Zhu, M.C.; Ma, X.G.; Wang, P.; Liu, R.F.; Wang, Y.J.; et al. Effect of aeration/micro-aeration on lignocellulosic decomposition, maturity and seedling phytotoxicity during full-scale biogas residues composting. Waste Manag. 2023, 168, 246–255. [Google Scholar] [CrossRef]
  12. Cheng, J.W.; Gao, X.Z.; Yan, Z.W.; Li, G.X.; Luo, W.H.; Xu, Z.C. Intermittent aeration to reduce gaseous emission and advance humification in food waste digestate composting: Performance and mechanisms. Bioresour. Technol. 2023, 371, 128644. [Google Scholar] [CrossRef] [PubMed]
  13. Ge, M.S.; Zhou, H.B.; Shen, Y.J.; Meng, H.B.; Li, R.; Zhou, J.; Cheng, H.S.; Zhang, X.; Ding, J.T.; Wang, J.; et al. Effect of aeration rates on enzymatic activity and bacterial community succession during cattle manure composting. Bioresour. Technol. 2020, 304, 122928. [Google Scholar] [CrossRef] [PubMed]
  14. Zhan, M.Q.; Su, Y.; Zhuo, Q.T.; Yang, S.W.; Shao, H.C.; Fang, C. Long-term effects of short-term functional membrane covering on humification process and carbohydrate-active enzymes during dairy manure composting at industrial scale. J. Environ. Chem. Eng. 2025, 13, 117837. [Google Scholar] [CrossRef]
  15. Zhang, L.X.; Gao, X.Z.; Shi, T.; Xu, Z.C.; Li, G.X.; Luo, W.H. Regulating aeration intensity to simultaneously improve humification and mitigate gaseous emissions in food waste digestate composting: Performance and bacterial dynamics. Sci. Total Environ. 2023, 889, 164239. [Google Scholar] [CrossRef] [PubMed]
  16. Ding, S.; Du, S.W.; Zhang, K.N.; Wu, Y.W.; Xu, X.H.; Lou, L.P.; Wu, D.L. Intelligent aeration strategy for optimizing food waste composting and enhancing humification. Chem. Eng. J. 2025, 521, 166668. [Google Scholar] [CrossRef]
  17. Wu, J.Q.; Zhao, Y.; Qi, H.S.; Zhao, X.Y.; Yang, T.X.; Du, Y.Q.; Zhang, H.; Wei, Z.M. Identifying the key factors that affect the formation of humic substance during different materials composting. Bioresour. Technol. 2017, 244, 1193–1196. [Google Scholar] [CrossRef] [PubMed]
  18. Ma, S.S.; Liu, H.T. Effects of 3D-printed bulking agent on microbial community succession and carbohydrate-active enzymes genes during swine manure composting. Chemosphere 2022, 306, 135513. [Google Scholar] [CrossRef] [PubMed]
  19. Zeng, J.F. Effects and Mechanisms of Intermittent Oxygen Supply on Oxygen Supply and Demand and Main Gas Production and Emission in Aerobic Composting of Livestock Manure. Ph.D. Thesis, China Agricultural University, Beijing, China, 2018. [Google Scholar]
  20. Sun, X.X.; Ma, S.S.; Han, L.J.; Huang, G.Q. Design and Test on Lab-scale Intelligent Membrane-covered Aerobic Composting Reactor. Trans. Chin. Soc. Agric. Mach. 2016, 47, 240–245. [Google Scholar]
  21. He, X.Q.; Yin, H.J.; Han, L.J.; Cui, R.X.; Fang, C.; Huang, G.Q. Effects of biochar size and type on gaseous emissions during pig manure/wheat straw aerobic composting: Insights into multivariate-microscale characterization and microbial mechanism. Bioresour. Technol. 2019, 271, 375–382. [Google Scholar] [CrossRef] [PubMed]
  22. Huang, G.F.; Wu, Q.T.; Wong, J.W.C.; Nagar, B.B. Transformation of organic matter during co-composting of pig manure with sawdust. Bioresour. Technol. 2006, 97, 1834–1842. [Google Scholar] [CrossRef] [PubMed]
  23. Sánchez-Monedero, M.; Roig, A.; Martínez-Pardo, C.; Cegarra, J.; Paredes, C. A microanalysis method for determining total organic carbon in extracts of humic substances. Relationships between total organic carbon and oxidable carbon. Bioresour. Technol. 1996, 57, 291–295. [Google Scholar] [CrossRef]
  24. Fang, C.; Yuan, X.R.; Liao, K.K.; Qu, H.W.; Han, L.J.; He, X.Q.; Huang, G.Q. Micro-aerobic conditions based on membrane-covered improves the quality of compost products: Insights into fungal community evolution and dissolved organic matter characteristics. Bioresour. Technol. 2022, 362, 127849. [Google Scholar] [CrossRef] [PubMed]
  25. Li, D.H.; Liu, C.M.; Luo, R.B.; Sadakane, K.; Lam, T. MEGAHIT: An ultra-fast single-node solution for large and complex metagenomics assembly via succinct de Bruijn graph. Bioinformatics 2015, 31, 1674–1676. [Google Scholar] [CrossRef]
  26. Fu, L.M.; Niu, B.F.; Zhu, Z.W.; Wu, S.T.; Li, W.Z. CD-HIT: Accelerated for clustering the next-generation sequencing data. Bioinformatics 2012, 28, 3150–3152. [Google Scholar] [CrossRef] [PubMed]
  27. Li, R.Q.; Li, Y.R.; Kristiansen, K.; Wang, J. SOAP: Short oligonucleotide alignment program. Bioinformatics 2008, 24, 713–714. [Google Scholar] [CrossRef]
  28. Buchfink, B.; Xie, C.; Huson, D.H. Fast and sensitive protein alignment using DIAMOND. Nat. Methods 2015, 12, 59–60. [Google Scholar] [CrossRef]
  29. Krzywinski, M.; Schein, J.; Birol, I.; Connors, J.; Gascoyne, R.; Horsman, D.; Jones, S.J.; Marra, M.A. Circos: An information aesthetic for comparative genomics. Genome Res. 2009, 19, 1639–1645. [Google Scholar] [CrossRef]
  30. Legendre, P.; Fortin, M.J. Comparison of the Mantel test and alternative approaches for detecting complex multivariate relationships in the spatial analysis of genetic data. Mol. Ecol. Resour. 2010, 10, 831–844. [Google Scholar] [CrossRef]
  31. Lü, L.Y.; Chen, D.B.; Ren, X.L.; Zhang, Q.M.; Zhang, Y.C.; Zhou, T. Vital nodes identification in complex networks. Phys. Rep. 2016, 650, 1–63. [Google Scholar] [CrossRef]
  32. Bari, Q.R. Effect of Different Modes of Aeration on Composting of Solid Waste in a Closed System. Ph.D. Thesis, The University of Hong Kong, Hong Kong, China, 1999. [Google Scholar]
  33. Wei, H.; Tucker, M.P.; Baker, J.O.; Harris, M.; Luo, Y.H.; Xu, Q.; Himmel, M.E.; Ding, S.Y. Tracking dynamics of plant biomass composting by changes in substrate structure, microbial community, and enzyme activity. Biotechnol. Biofuels 2012, 5, 20. [Google Scholar] [CrossRef]
  34. Peng, L.J.; Tang, R.L.; Wang, G.Y.; Ma, R.A.; Li, Y.M.; Li, G.X.; Yuan, J. Effect of aeration rate, aeration pattern, and turning frequency on maturity and gaseous emissions during kitchen waste composting. Environ. Technol. Innov. 2023, 29, 102997. [Google Scholar] [CrossRef]
  35. Chen, H.; Chen, Z.J.; Wang, S.J.; Li, X.Y.; Lan, T.Q.; Fu, X.J.; Lin, Q.L. Lignin–carbohydrate complex structures, their extraction, characterization, and impact on cellulase hydrolysis: A comprehensive review. Int. J. Biol. Macromol. 2026, 346, 150543. [Google Scholar] [CrossRef]
  36. Shen, B.Q.; Gao, W.F.; Zhang, X.; Wei, Z.M.; Song, C.H. Unveiling the molecular mechanisms of humification during composting: A cascade reaction process from lignocellulose prehydrolysis to protein-enhanced synthesis and clay mineral stabilization. Chem. Eng. J. 2026, 527, 172118. [Google Scholar] [CrossRef]
  37. Li, X.L.; Li, K.C.; Wang, Y.W.; Huang, Y.T.; Yang, H.X.; Zhu, P.F.; Li, Q.L. Diversity of lignocellulolytic functional genes and heterogeneity of thermophilic microbes during different wastes composting. Bioresour. Technol. 2023, 372, 128697. [Google Scholar] [CrossRef]
  38. Reddy, V.; Reddy, P.; Pillay, B.; Singh, S. Effect of aeration on the production of hemicellulases by T. lanuginosus SSBP in a 30 l bioreactor. Process Biochem. 2002, 37, 1221–1228. [Google Scholar] [CrossRef]
  39. Tuomela, M.; Vikman, M.; Hatakka, A.; Itävaara, M. Biodegradation of lignin in a compost environment: A review. Bioresour. Technol. 2000, 72, 169–183. [Google Scholar] [CrossRef]
  40. Su, Y.; Zhou, L.; Zhuo, Q.T.; Fang, C.; You, J.; Han, L.J.; Huang, G.Q. Microbial mechanisms involved in negative effects of amoxicillin and copper on humification during composting of dairy cattle manure. Bioresour. Technol. 2024, 399, 130623. [Google Scholar] [CrossRef] [PubMed]
  41. Lu, M.Y.; Shi, X.S.; Feng, Q.; Li, X.; Lian, S.J.; Zhang, M.D.; Guo, R.B. Effects of humic acid modified oyster shell addition on lignocellulose degradation and nitrogen transformation during digestate composting. Bioresour. Technol. 2021, 329, 124834. [Google Scholar] [CrossRef] [PubMed]
  42. Bao, R.X.; Lu, X.L.; Huang, W.Y.; Li, Q.L. Bacillus licheniformis inoculation accelerates the humification process through regulating the shikimic acid pathway and lignin degradation in pilot-scale composting. Biocatal. Agric. Biotechnol. 2025, 70, 103859. [Google Scholar] [CrossRef]
  43. Diallo, M.S.; Simpson, A.; Gassman, P.; Faulon, J.L.; Johnson, J.H.; Goddard, W.A.; Hatcher, P.G. 3-D Structural Modeling of Humic Acids through Experimental Characterization, Computer Assisted Structure Elucidation and Atomistic Simulations. 1. Chelsea Soil Humic Acid. Environ. Sci. Technol. 2003, 37, 1783–1793. [Google Scholar] [CrossRef]
  44. Zhang, X.; Zhao, Y.; Meng, H.H.; Li, L.Y.; Cui, H.Y.; Wei, Z.M.; Yang, T.X.; Dang, Q.L. Revealing the Inner Dynamics of Fulvic Acid from Different Compost-Amended Soils through Microbial and Chemical Analyses. J. Agric. Food Chem. 2020, 68, 3722–3728. [Google Scholar] [CrossRef]
  45. Zhu, N.N.; Yu, X.F.; Zhou, X.J.; Cheng, A.; Liu, X.L.; Ji, W.C.; Fan, X.J. Biochar-Driven Transformation of Humic Substances in Full-Scale Chicken Manure Compost. Water Air Soil Pollut. 2025, 237, 300. [Google Scholar] [CrossRef]
  46. de Bertoldi, M.; Sequi, P.; Lemmes, B.; Papi, T. The Science of Composting; Springer: Dordrecht, The Netherlands, 1996; pp. 382–393. [Google Scholar]
  47. Zhao, Y.X.; Lou, Y.C.; Qin, W.Z.; Cai, J.J.; Zhang, P.; Hu, B.L. Interval aeration improves degradation and humification by enhancing microbial interactions in the composting process. Bioresour. Technol. 2022, 358, 127296. [Google Scholar] [CrossRef]
  48. Wardman, J.F.; Bains, R.K.; Rahfeld, P.; Withers, S.G. Carbohydrate-active enzymes (CAZymes) in the gut microbiome. Nat. Rev. Microbiol. 2022, 20, 542–556. [Google Scholar] [CrossRef]
  49. Khatoon, M.; Patel, S.H.; Pandit, R.J.; Jakhesara, S.J.; Rank, D.N.; Joshi, C.G.; Kunjadiya, A.P. Rumen and fecal microbial profiles in cattle fed high lignin diets using metagenome analysis. Anaerobe 2022, 73, 102508. [Google Scholar] [CrossRef] [PubMed]
  50. Zhang, S.C.; Wang, J.L.; Chen, X.; Gui, J.X.; Sun, Y.; Wu, D.L. Industrial-scale food waste composting: Effects of aeration frequencies on oxygen consumption, enzymatic activities and bacterial community succession. Bioresour. Technol. 2021, 320, 124357. [Google Scholar] [CrossRef]
  51. Breton, C.; Fournel-Gigleux, S.; Palcic, M.M. Recent structures, evolution and mechanisms of glycosyltransferases. Curr. Opin. Struct. Biol. 2012, 22, 540–549. [Google Scholar] [CrossRef] [PubMed]
  52. Chen, S.S.; Liu, Q.M.; Li, D.J. Engineering the composting microbiome with a synthetic microbial community to accelerate lignocellulose degradation and humus synthesis. J. Environ. Manag. 2025, 396, 128088. [Google Scholar] [CrossRef]
  53. Li, X.Y.; Cheng, X.Y.; Xu, J.J.; Wu, J.J.; Chan, L.L.; Cai, Z.H.; Zhou, J. Dynamic patterns of carbohydrate metabolism genes in bacterioplankton during marine algal blooms. Microbiol. Res. 2024, 286, 127785. [Google Scholar] [CrossRef] [PubMed]
  54. López, M.J.; Elorrieta, M.A.; Vargas-García, M.C.; Suárez-Estrella, F.; Moreno, J. The effect of aeration on the biotransformation of lignocellulosic wastes by white-rot fungi. Bioresour. Technol. 2002, 81, 123–129. [Google Scholar] [CrossRef]
  55. Wang, Y.Y.; Xu, P.X.; Wang, Y.; Su, J.; Xu, Z.; Jiang, Z.B.; Wei, Y.Q.; Hang, S.; Ding, X.Y.; Zhang, H.; et al. Effects of aeration modes and rates on nitrogen conversion and bacterial community in composting of dehydrated sludge and corn straw. Front. Microbiol. 2024, 15, 1372568. [Google Scholar] [CrossRef]
  56. Klüpfel, L.; Piepenbrock, A.; Kappler, A.; Sander, M. Humic substances as fully regenerable electron acceptors in recurrently anoxic environments. Nat. Geosci. 2014, 7, 195–200. [Google Scholar] [CrossRef]
  57. Yang, P.; Jiang, T.; Cong, Z.; Liu, G.; Guo, Y.; Liu, Y.; Shi, J.; Hu, L.; Yin, Y.; Cai, Y.; et al. Loss and Increase of the Electron Exchange Capacity of Natural Organic Matter during Its Reduction and Reoxidation: The Role of Quinone and Nonquinone Moieties. Environ. Sci. Technol. 2022, 56, 6744–6753. [Google Scholar] [CrossRef]
  58. Hermanussen, M.; Aßmann, C.; Groth, D. Chain Reversion for Detecting Associations in Interacting Variables-St. Nicolas House Analysis. Int. J. Environ. Res. Public Health 2021, 18, 1741. [Google Scholar] [CrossRef] [PubMed]
  59. De Winter, K.; Dewitte, G.; Dirks-Hofmeister, M.E.; De Laet, S.; Pelantová, H.; Křen, V.; Desmet, T. Enzymatic Glycosylation of Phenolic Antioxidants: Phosphorylase-Mediated Synthesis and Characterization. J. Agric. Food Chem. 2015, 63, 10131–10139. [Google Scholar] [CrossRef] [PubMed]
  60. Trobo-Maseda, L.; Romero-Fernandez, M.; Guisan, J.M.; Rocha-Martin, J. Glycosylation of polyphenolic compounds: Design of a self-sufficient biocatalyst by co-immobilization of a glycosyltransferase, a sucrose synthase and the cofactor UDP. Int. J. Biol. Macromol. 2023, 250, 126009. [Google Scholar] [CrossRef]
  61. Qiao, X.Y.; Li, P.J.; Zhao, J.H.; Li, Z.L.; Zhang, C.H.; Wu, J.Q. Gaining insight into the effect of laccase expression on humic substance formation during lignocellulosic biomass composting. Sci. Total Environ. 2024, 923, 171548. [Google Scholar] [CrossRef]
  62. US Composting Council. Test Methods for the Examination of Composting and Compost; US Composting Council: Bethesda, MA, USA, 2002. [Google Scholar]
  63. Ma, S.S.; Xiong, J.P.; Cui, R.X.; Sun, X.X.; Han, L.J.; Xu, Y.P.; Kan, Z.W.; Gong, X.Y.; Huang, G.Q. Effects of intermittent aeration on greenhouse gas emissions and bacterial community succession during large-scale membrane-covered aerobic composting. J. Clean. Prod. 2020, 266, 121551. [Google Scholar] [CrossRef]
  64. Zeng, J.F.; Yin, H.J.; Shen, X.L.; Liu, N.; Ge, J.Y.; Han, L.J.; Huang, G.Q. Effect of aeration interval on oxygen consumption and GHG emission during pig manure composting. Bioresour. Technol. 2018, 250, 214–220. [Google Scholar] [CrossRef]
  65. Ge, J.Y.; Huang, G.Q.; Huang, J.; Zeng, J.F.; Han, L.J. Particle-Scale Modeling of Methane Emission during Pig Manure/Wheat Straw Aerobic Composting. Environ. Sci. Technol. 2016, 50, 4374–4383. [Google Scholar] [CrossRef]
  66. Pereira, J.L.; Costa, T.; Figueiredo, V.; Marques, F.; Perdigão, A.; Brás, I.; Silva, M.E.; Wessel, D.F. Influence of Different Agro-Food Waste on Ammonia and Greenhouse Gas Emissions during Composting. Agronomy 2024, 14, 220. [Google Scholar] [CrossRef]
  67. Li, M.H. The Impact of Composting Soil Amendment on the Composting Process of Chicken Manure and the Emissions of Greenhouse Gases and Odors. Master’ Thesis, Shandong Agricultural University, Tai’an, China, 2023. [Google Scholar]
Figure 1. Changes in temperature (A) and oxygen concentration (B). CA_1.5: Continuous aeration at 0.13 L min−1 kg−1 DM (1.5 L/min); CA_3: Continuous aeration at 0.25 L min−1 kg−1 DM (3 L/min); IA_3: Intermittent aeration (30 min on/30 min off) at 0.25 L min−1 kg−1 DM (3 L/min).
Fermentation 12 00170 g001
Figure 2. Changes in cellulose content (A), hemicellulose content (B), and lignin content (C). CA_1.5: Continuous aeration at 0.13 L min−1 kg−1 DM (1.5 L/min); CA_3: Continuous aeration at 0.25 L min−1 kg−1 DM (3 L/min); IA_3: Intermittent aeration (30 min on/30 min off) at 0.25 L min−1 kg−1 DM (3 L/min).
Fermentation 12 00170 g002
Figure 3. Changes in HS (A), FA (B), HA (C), and H/F (D). CA_1.5: Continuous aeration at 0.13 L min−1 kg−1 DM (1.5 L/min); CA_3: Continuous aeration at 0.25 L min−1 kg−1 DM (3 L/min); IA_3: Intermittent aeration (30 min on/30 min off) at 0.25 L min−1 kg−1 DM (3 L/min).
Fermentation 12 00170 g003
Figure 4. Relative abundance at the CAZyme class level (A), PCoA analysis at the CAZyme class level (B), and relative abundance at the family level (C). GTs: Glycosyl transferases; GHs: Glycoside hydrolases; CEs: Carbohydrate esterases; AAs: Auxiliary activities; CBMs: Carbohydrate-binding modules; PLs: Polysaccharide lyases. CA_1.5: Continuous aeration at 0.13 L min−1 kg−1 DM (1.5 L/min); CA_3: Continuous aeration at 0.25 L min−1 kg−1 DM (3 L/min); IA_3: Intermittent aeration (30 min on/30 min off) at 0.25 L min−1 kg−1 DM (3 L/min).
Fermentation 12 00170 g004
Figure 5. Environmental factor correlation analysis of CAZyme classes. * 0.01 < p ≤ 0.05, ** 0.001 < p ≤ 0.01, *** p ≤ 0.001. CA_1.5: Continuous aeration at 0.13 L min−1 kg−1 DM (1.5 L/min); CA_3: Continuous aeration at 0.25 L min−1 kg−1 DM (3 L/min); IA_3: Intermittent aeration (30 min on/30 min off) at 0.25 L min−1 kg−1 DM (3 L/min).
Fermentation 12 00170 g005
Figure 6. Correlation network analysis between the top 100 CAZyme families and environmental factors. Note: Nodes represent functional genes or environmental factors. Node size is proportional to the number of connections (edges). Edges between nodes indicate significant correlations (p < 0.05). Edge thickness corresponds to the magnitude of the Spearman correlation coefficient (r > 0.5). Red edges denote positive correlations, while green edges denote negative correlations. CA_1.5: Continuous aeration at 0.13 L min−1 kg−1 DM (1.5 L/min); CA_3: Continuous aeration at 0.25 L min−1 kg−1 DM (3 L/min); IA_3: Intermittent aeration (30 min on/30 min off) at 0.25 L min−1 kg−1 DM (3 L/min).
Fermentation 12 00170 g006
Table 1. Physicochemical properties of the raw materials.
Physicochemical Properties aCA_1.5CA_3IA_3Differences Between Groups
MC (%) b63.43 ± 0.3262.55 ± 0.1562.65 ± 0.25no significant (p > 0.05)
VS (%) c12.76 ± 0.3012.09 ± 0.2812.38 ± 0.03no significant (p > 0.05)
C/N c33.02 ± 0.6731.51 ± 0.8433.05 ± 0.88no significant (p > 0.05)
pH b8.89 ± 0.048.85 ± 0.048.95 ± 0.03no significant (p > 0.05)
EC b44.00 ± 1.1342.85 ± 1.0644.10 ± 1.41no significant (p > 0.05)
TC (%) c42.85 ± 0.0942.84 ± 0.1342.81 ± 0.63no significant (p > 0.05)
TN (%) c1.30 ± 0.021.36 ± 0.031.30 ± 0.02no significant (p > 0.05)
Cellulose (%) c31.35 ± 0.6429.37 ± 1.0930.12 ± 0.69no significant (p > 0.05)
Hemicellulose (%) c15.84 ± 0.3314.83 ± 0.4814.91 ± 0.38no significant (p > 0.05)
Lignin (%) c24.91 ± 0.7625.24 ± 0.0325.33 ± 0.38no significant (p > 0.05)
a MC: moisture content; VS: volatile solids; C/N: the ratio of total organic carbon to total nitrogen; EC: electrical conductivity; TC: total carbon; TN: total nitrogen. b Measurement based on the wet weight. c Measurement based on the dry weight. CA_1.5: Continuous aeration at 0.13 L min−1 kg−1 DM (1.5 L/min); CA_3: Continuous aeration at 0.25 L min−1 kg−1 DM (3 L/min); IA_3: Intermittent aeration (30 min on/30 min off) at 0.25 L min−1 kg−1 DM (3 L/min).
Table 2. Network characteristic.
PropertiesCA_1.5CA_3IA_3
Node number847374
CAZyme family nodes725960
Environmental factor nodes121414
Edge number193163131
Positive correlation lines898370
Negative correlation lines1048061
Average degree4.5954.4663.514
Average weighted degree4.093.9433.081
Graph distance8610
Graph density0.0550.0620.048
Modularity0.4840.4160.484
Average path length3.0872.7024.41
CA_1.5: Continuous aeration at 0.13 L min−1 kg−1 DM (1.5 L/min); CA_3: Continuous aeration at 0.25 L min−1 kg−1 DM (3 L/min); IA_3: Intermittent aeration (30 min on/30 min off) at 0.25 L min−1 kg−1 DM (3 L/min).
Disclaimer/Publisher’s Note: The statements, opinions and data contained in all publications are solely those of the individual author(s) and contributor(s) and not of MDPI and/or the editor(s). MDPI and/or the editor(s) disclaim responsibility for any injury to people or property resulting from any ideas, methods, instructions or products referred to in the content.