3.4.1. Variation in Sugar Content of Water Kefir During Refrigerated Storage
Using the optimized data, grape-flavored water kefir was prepared and its stability monitored for 42 days of refrigerated storage at 4 °C, with samples collected at days 0, 7, 14, 28, 35, and 42.
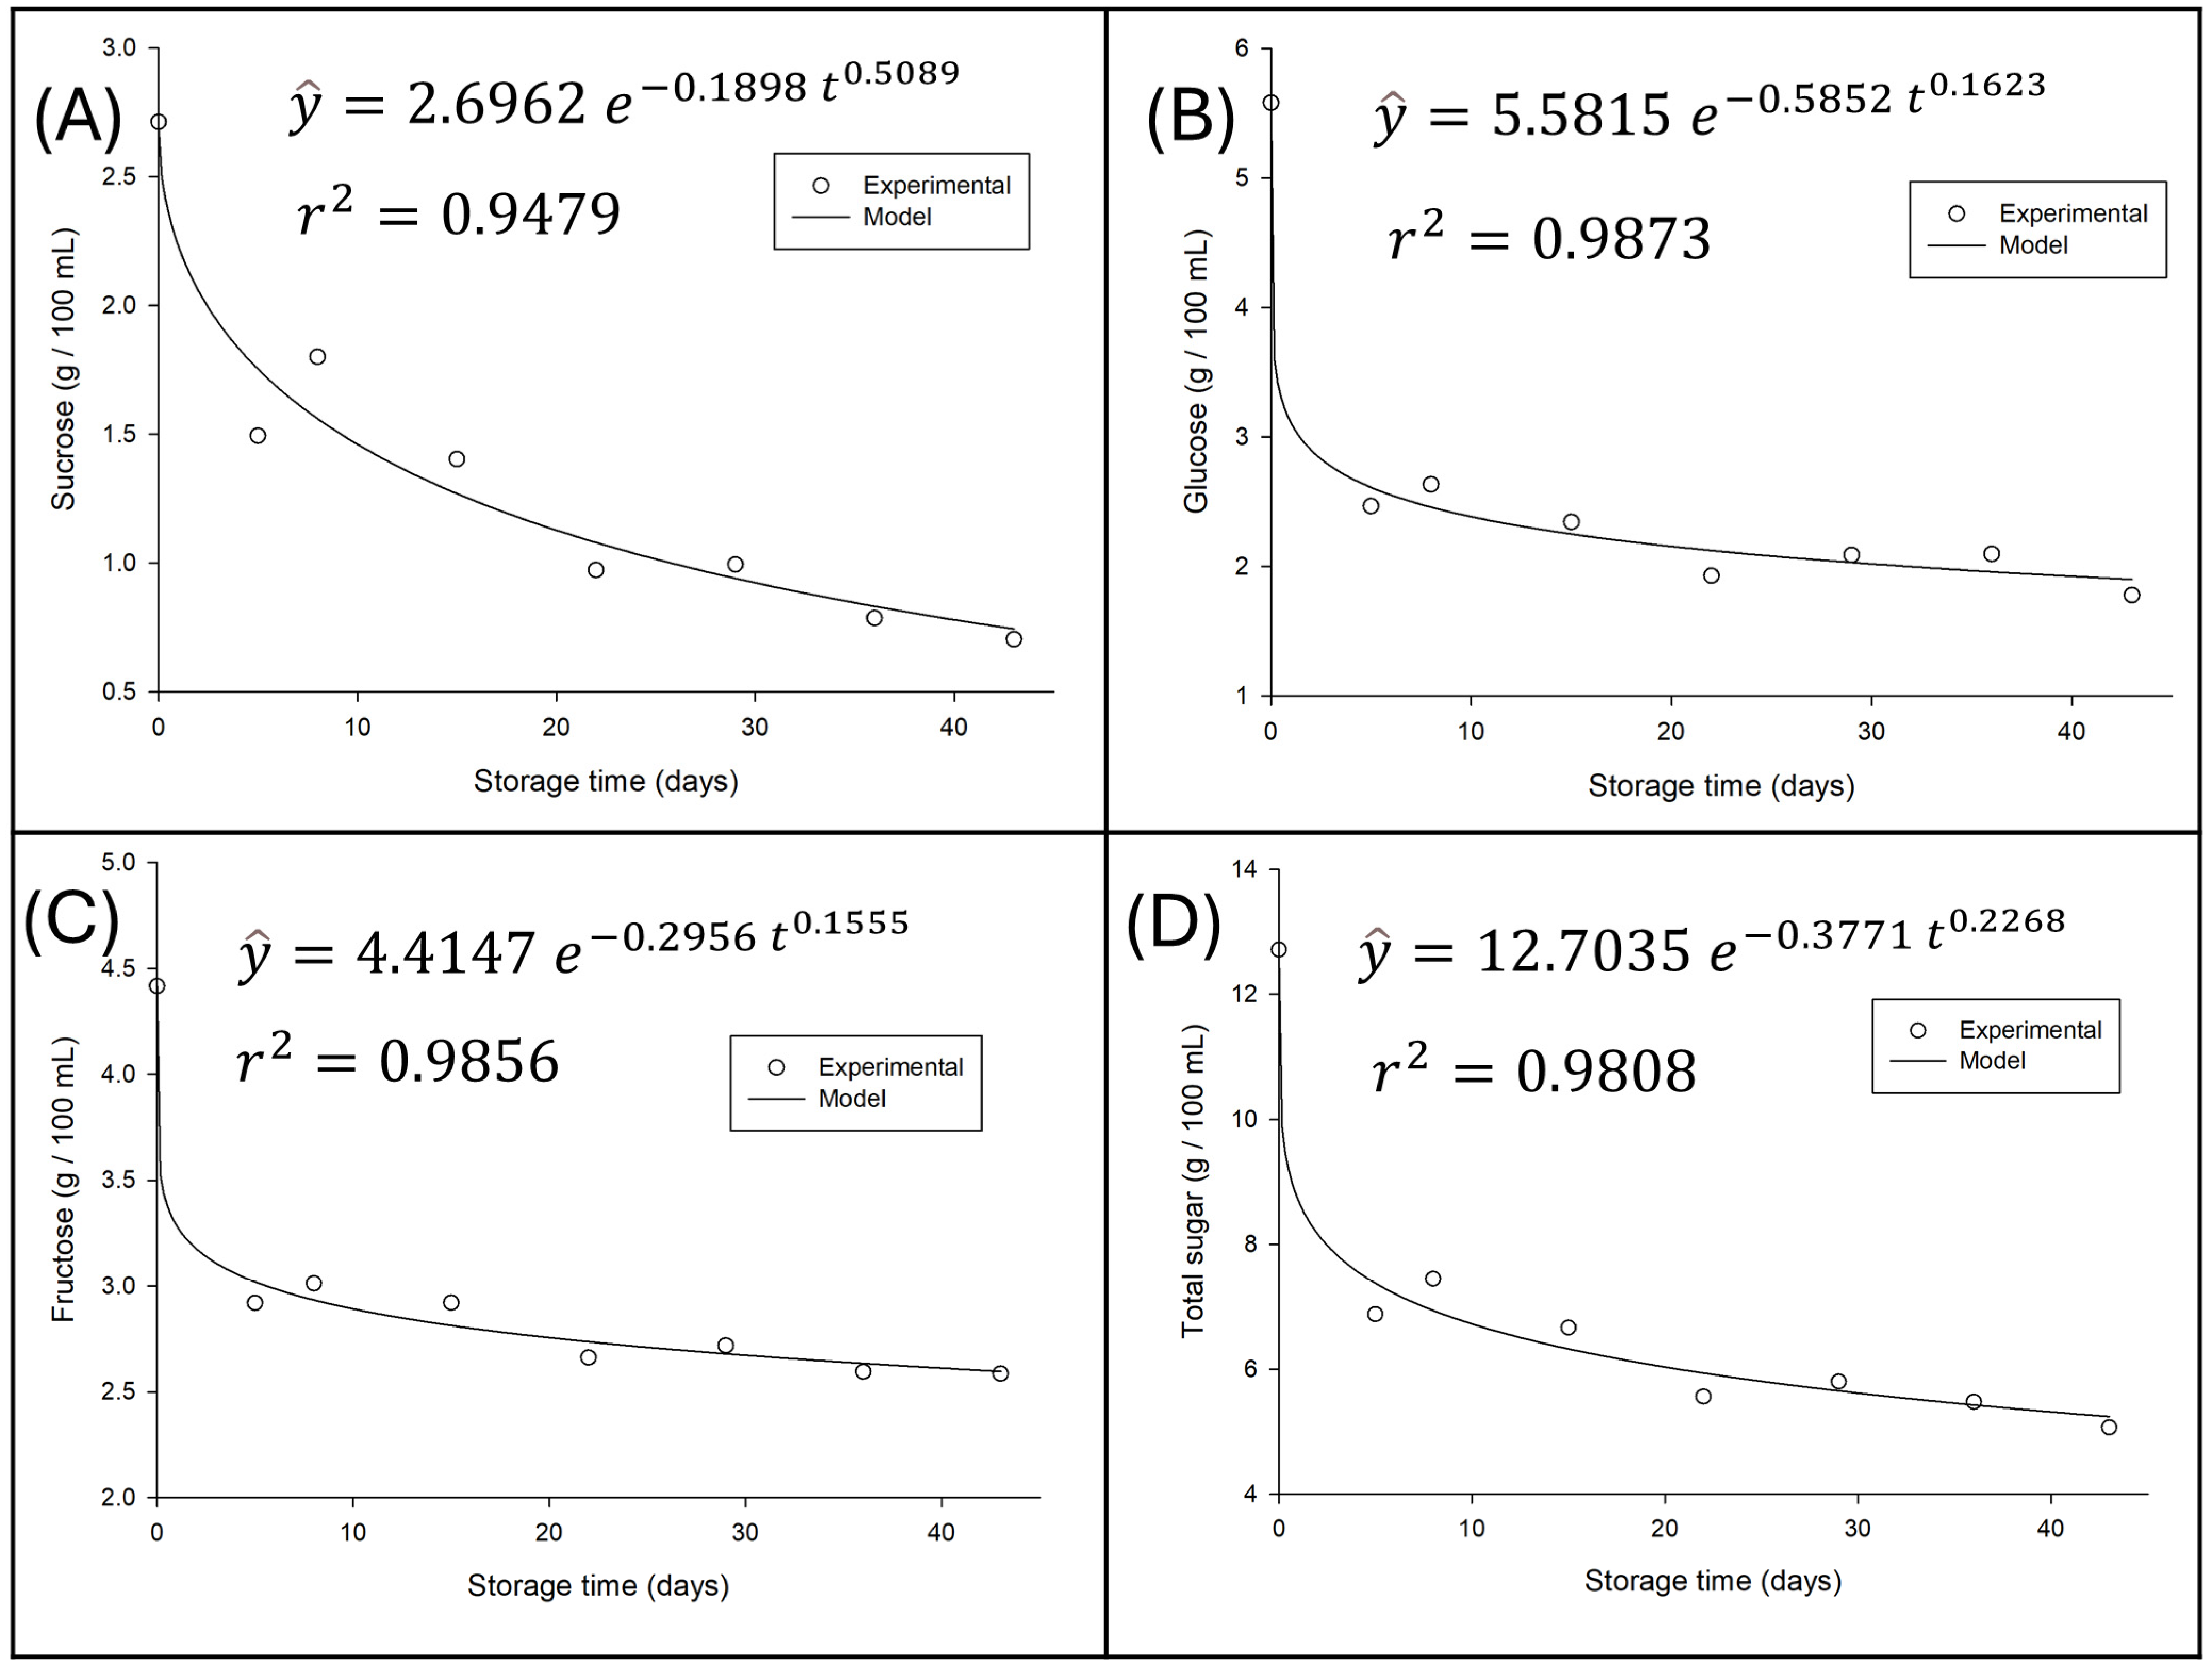
Figure 4 illustrates the variation in sugar content throughout this period, along with the fitted models and their corresponding coefficients of determination (R
2).
A progressive and significant reduction in the concentration of all sugars is observed as storage time increases, indicating ongoing residual metabolic activity; that is, fermentation continues, albeit at a slower rate. It is essential to note that the curves fitted by the model exhibit an excellent fit to the experimental data, thereby validating the representativeness of the observed trends.
Individual sugar analysis corroborates microbial selectivity. The rapid decrease in sucrose can be attributed to the action of hydrolytic enzymes (such as invertases) produced by microorganisms that hydrolyze sucrose into glucose and fructose, making them available for consumption [
28]. Glucose, in turn, was shown to be the monosaccharide preferentially consumed, showing the steepest decrease. This preference for glucose over fructose is a metabolic pattern frequently observed in water kefir fermentations and other microbial systems [
8], where glucose is metabolized more efficiently, while fructose tends to persist in higher concentrations or be consumed more slowly, as also evidenced in the results of this study.
The total sugars curve, which represents the sum of the individual concentrations, reflects the general consumption trend, decreasing from an initial concentration of approximately 12.5 g/100 mL to approximately 5.0 g/100 mL after 40 days. Most of this loss occurred in the first 10–20 days of storage, with the degradation rate decreasing afterward, consistent with first-order kinetics, where the reaction rate is proportional to the substrate concentration.
These results suggest that, despite the completion of primary and secondary fermentation, sugar utilization continues during refrigerated storage, which can directly impact the perception of sweetness and the sensory characteristics of the beverage over time.
3.4.2. Variation in Antioxidant Capacity and Phenolic Compound Content of Water Kefir During Refrigerated Storage
For ABTS values, there was no significant variation over storage time (
p > 0.05). In contrast, antioxidant capacity measured by DPPH and FRAP assays, along with phenolic compound content, showed significant variations (
p < 0.05), as illustrated in
Figure 5.
Figure 5 comprehensively illustrates the variation in total phenolic compound (TPC) content and antioxidant activity over the 42 days of refrigerated storage (4 °C) of the fermented beverage. The graph also displays the adjusted mathematical models, which, as shown in the figure, present an excellent fit to the experimental data.
The increase in total phenolic compounds and FRAP activity is a significant and unexpected finding. This rise is likely linked to the fermentation processes of microorganisms with potential probiotic properties and the transformations that occur in the matrix during storage. Grape juice fermentation with probiotics, as in this beverage, is known to increase total phenolic content. Probiotic bacteria can degrade tannins and produce compounds with a high content of free hydroxyl groups, which enhances phenolic content and antioxidant activity [
29]. This biotransformation releases bound phenolics, increasing their availability and reactivity in assays like Folin–Ciocâlteu (TPC) and FRAP, which measures ferric ion reduction capacity [
30].
Despite the increase in TPC and FRAP, the decrease in free radical scavenging activity (DPPH) is a behavior that, although seemingly paradoxical, is explainable by the complexity of the antioxidant profile. It is possible that the original antioxidant compounds or specific forms with high affinity for the DPPH radical are more susceptible to oxidative degradation or polymerization reactions during storage [
31]. While new phenolic compounds may form, raising TPC and FRAP values, these might be less effective in the DPPH assay but exhibit greater electron-donating capacity, thus showing higher activity in the FRAP assay. The dynamics of phenolic compounds are influenced by several chemical reactions that can occur during aging, where some phenolics degrade while others remain stable, such as gallic acid [
32].
The stability of ABTS activity suggests that the beverage maintains a general electron-donating/radical-scavenging capacity, perhaps through less specific compounds or mechanisms that are not as impacted by the transformations observed in DPPH. The diversity of microorganisms present [
8,
28] and the composition of the grape matrix itself contribute to this complexity and the multifaceted behavior of antioxidant capacity [
30].
Thus, the results indicate a favorable evolution of the beverage’s antioxidant functionality, with the fermentation and storage processes promoting the formation or release of compounds that increase the total phenolic content and antioxidant reducing power. The particularity of the DPPH reduction highlights that different assays evaluate different aspects of antioxidant activity, and that the beverage undergoes a rearrangement of its bioactive profile, which is overall beneficial to health [
33].
3.4.3. Variation in Water Kefir Microorganism Count During Refrigerated Storage
Assessing the population dynamics of microorganisms during refrigerated storage is crucial for understanding the stability and maintenance of the functional characteristics of fermented beverages such as water kefir. It is essential to note that, at zero storage time, the beverage has already undergone two fermentation phases: 24 h for the first fermentation and, subsequently, another 24 h for the second fermentation. This process ensures that microbial populations are already at or near their maximum growth rate, typically in the stationary or initial decline phase, rather than in the exponential growth phase.
Regarding the lactic acid bacteria (LAB) count, the results of this study indicate that there was no significant variation over the refrigerated storage time (p > 0.05). The average count of these bacteria remained at 3.78 × 10⁷ CFU/mL in the beverage.
This stability of the LAB population is a positive indicator, as maintaining high LAB counts is a characteristic not only associated with the health benefits of probiotic products like kefir, whose health-promoting potential, driven by bioactive compounds and beneficial microorganisms, has been extensively reviewed [
34], but also observed in other traditional fermented foods and food matrices. Comparing this result with the literature, it is observed that the count obtained is in line with the expected levels for fermented water kefir products. For instance, Gökırmaklı et al. [
35] reported
Lactobacillus sp. counts in water kefir ranging from 5.18 to 7.71 log CFU/mL in fig-based media, and
L. acidophilus at similar levels. The mean count of 7.58 log CFU/mL falls within the upper range or is slightly above the values reported in the literature for lactic acid bacteria in water kefir-related products, thereby reinforcing both the quality and probiotic potential of the developed beverage. Similarly, Almeida [
11] observed lactic acid bacteria counts between 5.42 and 6.71 log CFU/mL during the fermentation stage and 7.17 ± 0.43 log CFU/g in the feed solution prior to drying, further confirming the high microbial viability achieved in this work
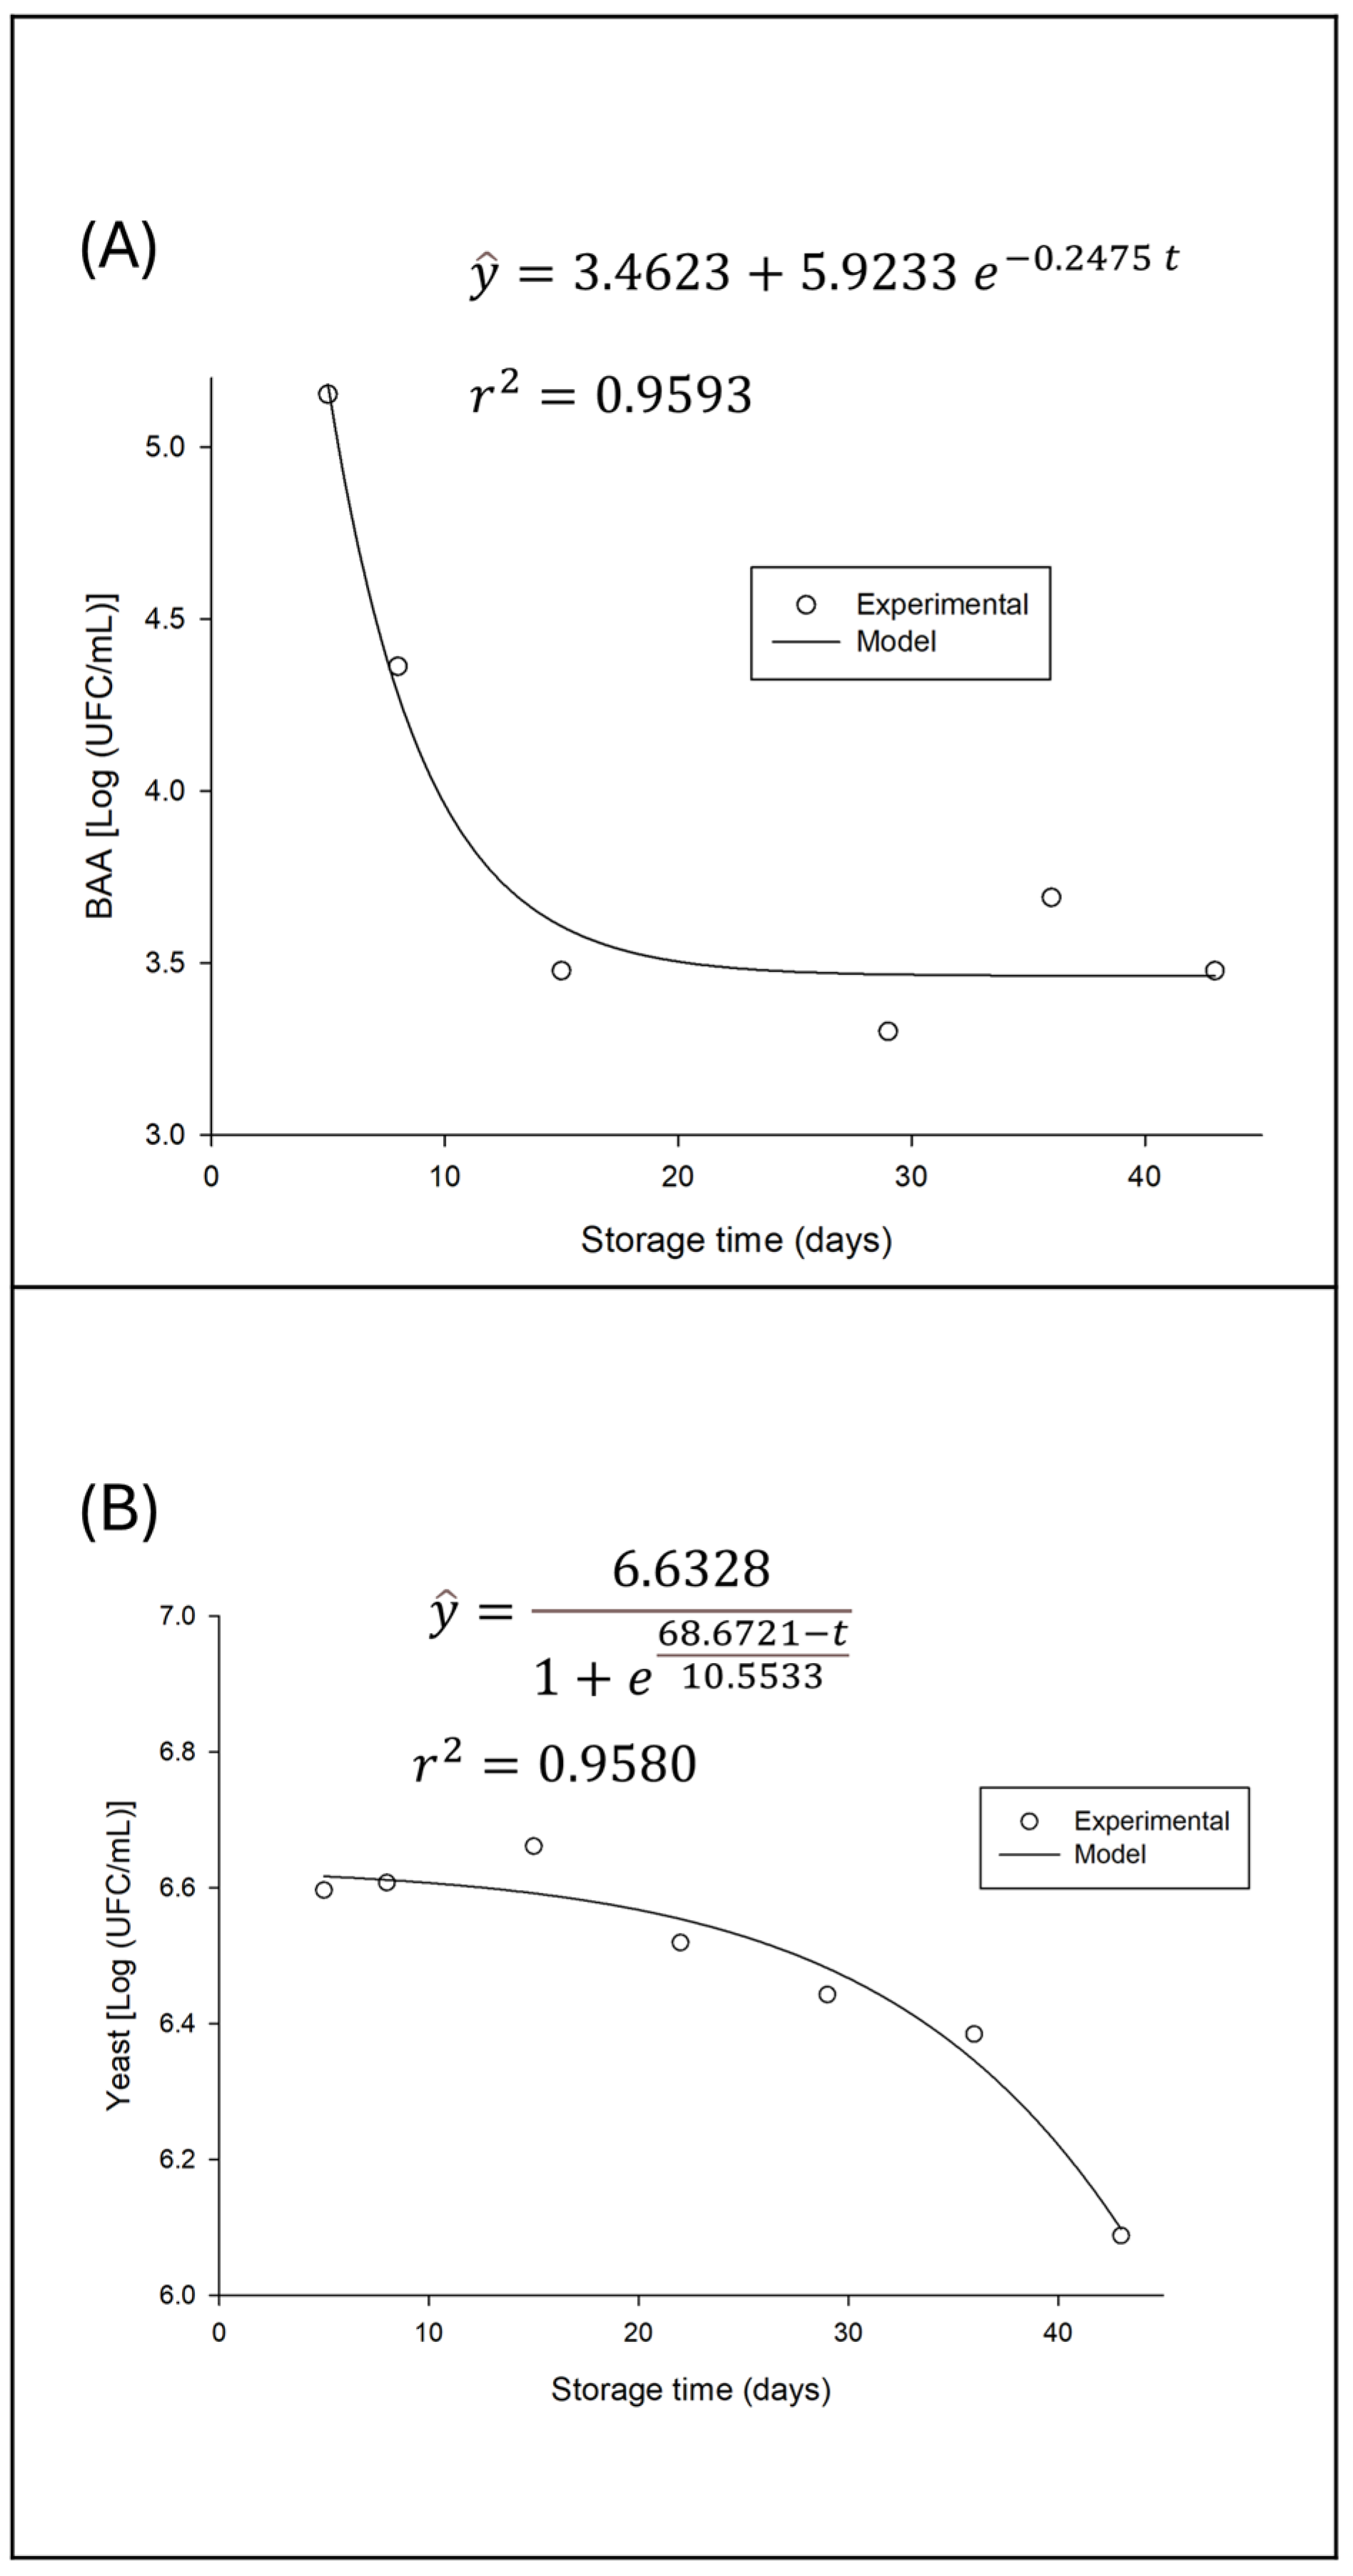
In contrast to lactic acid bacteria, acetic acid bacteria counts showed a significant decline over the storage period. This behavior is illustrated in
Figure 6, where the population decay and the fit of an exponential model for this variation are observed.
The observed decrease in acetic acid bacteria (AAB) counts during refrigerated storage, as shown in
Figure 6, reflects the characteristic metabolism of these microorganisms under the storage conditions. Acetic acid bacteria, such as those of the genera
Acetobacter and
Gluconobacter, are typically aerobic, relying on oxygen to carry out their main metabolic activities, such as the oxidation of ethanol to acetic acid and of sugars to gluconic acid [
28,
35].
Considering that the beverage, after both fermentations, was stored under refrigerated conditions in hermetically sealed bottles, oxygen availability became a critical limiting factor. The reduction in available oxygen in the environment leads to a decrease in the metabolic activity of AAB, and consequently, their inactivation and gradual death, resulting in the observed population decline, modeled by an exponential curve. This is a striking difference compared to lactic acid bacteria, which have anaerobic or facultatively anaerobic metabolism and are therefore less affected by the absence of oxygen.
Although direct comparative studies of AAB counts over storage time in water kefir are scarce, the initial presence of these bacteria in fermented beverages is well documented. Almeida [
11], for example, detected acetic acid bacteria in their water kefir samples, with counts ranging from 5.04 to 5.75 log CFU/g, representing the starting point for the AAB population at zero storage time. The decline from these initial levels, as evidenced in the present study, directly reflects the impact of post-fermentation storage conditions.
The decrease in the AAB population carries both sensory and chemical implications for the beverage. Acetic acid is one of the main contributors to the characteristic flavor and aroma of water kefir, imparting a pungent acidity [
35]. If this characteristic acetic acid level is too high, it can cause sensory rejection of the product. Additionally, the inactivity of AAB under anoxic conditions helps stabilize the beverage’s alcohol content, since ethanol oxidation, one of its primary functions, is inhibited. The decrease in AAB in a closed refrigerated environment can be seen as a natural control mechanism that prevents over-acidification and limits the formation of undesirable volatile compounds over shelf life.
The yeast population dynamics during refrigerated storage of water kefir exhibit a distinct pattern, differing both from both the stability of lactic acid bacteria and the decline of acetic acid bacteria. Initially, the results suggest that, following the two fermentation stages, the yeast population enters a stationary phase, which is later followed by a period of decline (
Figure 6B).
According to the process history, the beverage at storage time zero has already completed two fermentation stages (24 h of F1 and 24 h of F2), which suggests that the yeast population has already reached or is close to its maximum growth peak. In other words, the yeast entered storage in a plateau phase, where the growth rate balances with the cell death rate, or a transitional phase toward decline, reflecting post-fermentation metabolic and environmental conditions.
In the early stationary phase, yeasts, having consumed the most easily assimilated substrates and produced metabolites such as ethanol and organic acids during fermentations, reach maximum population density. At this point, nutrient limitation and the accumulation of byproducts may begin to inhibit further growth. Gökırmaklı et al. [
35] observed that yeast counts in sugar- and fig-based water kefir peaked after 24 h of fermentation, ranging from 5.89 to 6.16 log CFU/mL, before a slight decline between 24 and 48 h. Almeida [
11] also reported yeast counts ranging from 5.03 to 5.65 log CFU/g.
Subsequently, the yeast population enters a decline phase. This phenomenon is driven by several factors, including nutrient depletion and low storage temperatures, accumulation of inhibitory metabolites, and cellular lysis and senescence, among others [
28,
36].
3.4.4. Variation of pH Value, Soluble Solids and Alcohol Content over Time During Refrigerated Storage
During the 42-day storage period, there was no significant difference (p > 0.05) in relation to the pH value and alcohol content. The average pH value was 3.30, and the average alcohol content was 1.86% °GL.
pH stability is an important indicator of both the quality and safety of fermented beverages over time, reflecting residual metabolic activity and product preservation. In the present study, analysis of water kefir beverages during 42 days of refrigerated storage revealed no variations over time in either pH or alcohol content (p > 0.05). The average pH value for this period remained at 3.30.
Achieving and maintaining a low pH, such as 3.30, is crucial for ensuring the microbiological safety of fermented beverages, as it creates an unfavorable environment for the growth of most pathogenic microorganisms [
21]. This value is well below the critical limit of 4.5, commonly accepted as a barrier to pathogen development, and is consistent with the value found in other stages of the experiment.
Laureys [
8] reported pH values ranging from approximately 3.34 to 3.47 after 48 to 192 h of fermentation in different water kefir formulations. Therefore, the pH value of 3.30 found in the present study is in line with the lower values observed by these authors. On the other hand, Almeida [
11], in a study on powdered water kefir, reported pH values ranging from 3.88 to 4.30 during the first fermentation, differing from the present results.
Beyond safety concerns, pH has a direct impact on the flavor profile. Lower pH values, such as 3.30, indicate higher acidity, resulting in a sourer taste [
37]. This acidity intensity can influence overall acceptance; for example, kefir with a pH of 3.37 was considered less preferred compared to slightly higher pH options [
36].
The pH stability during storage, along with a consistent alcohol content (1.86 °GL), aligns with the observed dynamics of microbial populations. The stable population of lactic acid bacteria, combined with declining acetic acid bacteria and yeasts (as discussed previously), results in reduced metabolic activity, preventing significant fluctuations in acid and ethanol production.
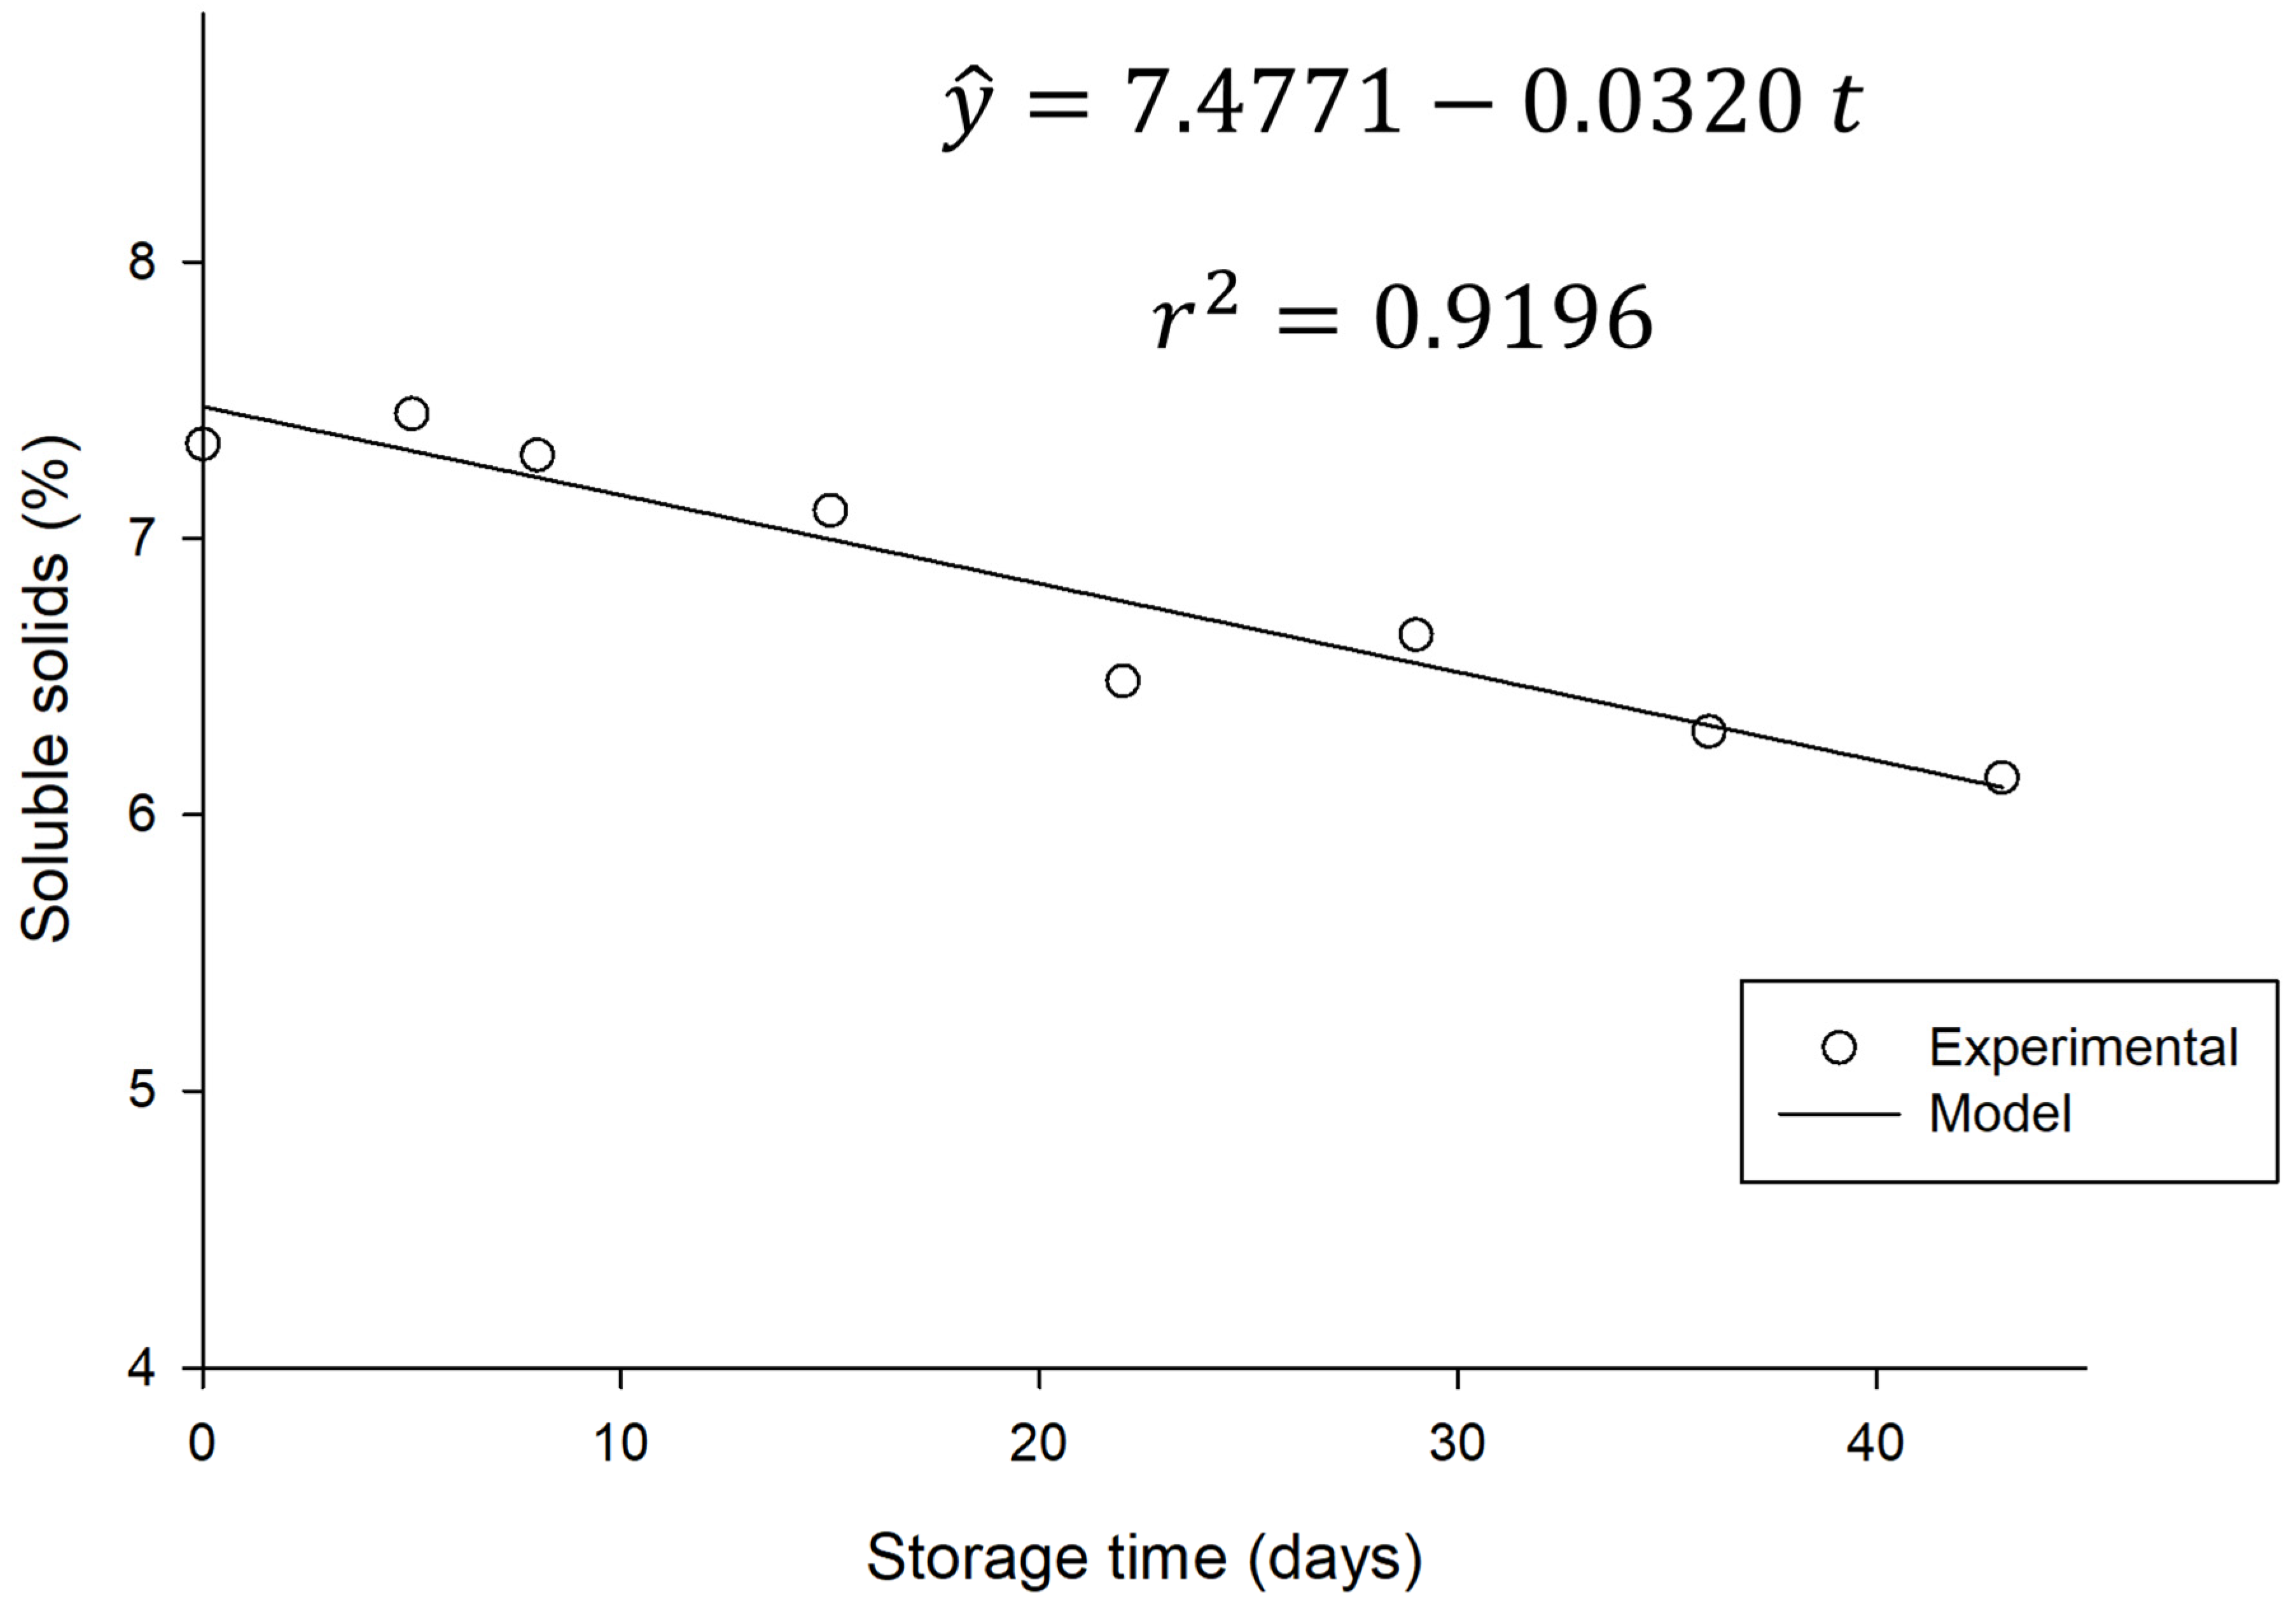
On the other hand, there was a significant variation (
p < 0.05) in the total soluble solids during storage time, as illustrated in
Figure 7.
This decrease in TSS directly reflects the consumption of sugars present in the beverage by residual microorganisms, as shown in
Section 3.4.1 and
Figure 4, where a reduction in sugar levels is observed. Since sugars make up most of the soluble solids in water kefir and serve as the primary substrate for microbial activity, this decline indicates ongoing, albeit slow, residual fermentation.
This trend is consistent with the specialized literature. Esatbeyoglu et al. [
6] observed a reduction in TSS values and sugar conversion, accompanied by a decrease in total sugars, glucose, and fructose, when studying water kefir produced from aronia. Complementarily, Pendón et al. [
38] explained the fundamental process of sucrose consumption by yeast (with hydrolysis into glucose and fructose) and the subsequent use of these monosaccharides by lactic and acetic bacteria during water kefir fermentation. Although slowed by refrigeration, this residual metabolic activity is primarily responsible for the decrease in sugars and, consequently, in soluble solids.
It is worth noting that, despite the reduction in soluble solids content and sugar consumption, there was no significant difference in the pH value or alcohol content of the beverage during refrigerated storage. This suggests that residual sugars were primarily used by microorganisms for maintenance metabolism and cell survival, as well as for processes that do not result in significant production of additional acids or ethanol. Beverages can form a buffer system, allowing the pH to remain relatively stable even with small acid production.
