Article

A Comparative Proteomic Analysis of the Acetification Process of Komagataeibacter europaeus Using Different Substrates

by
Daniela Herrera-Rosero
1,†,
Juan J. Román-Camacho
1,*,†,
Juan Carlos García-García
1,
Inés M. Santos-Dueñas
2,
Teresa García-Martínez
1,
Isidoro García-García
2 and
Juan Carlos Mauricio
1,*
1
Department of Agricultural Chemistry, Edaphology and Microbiology, Agrifood Campus of International Excellence ceiA3, Universidad de Córdoba, 14014 Córdoba, Spain
2
Department of Inorganic Chemistry and Chemical Engineering, Agrifood Campus of International Excellence ceiA3, Nano Chemistry Institute (IUNAN), Universidad de Córdoba, 14014 Córdoba, Spain
*
Authors to whom correspondence should be addressed.
These authors contributed equally to this work.
Fermentation 2025, 11(8), 484; https://doi.org/10.3390/fermentation11080484
Submission received: 14 July 2025 / Revised: 13 August 2025 / Accepted: 18 August 2025 / Published: 20 August 2025
(This article belongs to the Special Issue Fermentation: 10th Anniversary)

Abstract

Although vinegar is technically elaborated by a well-known bioprocess, the behavior and function of the microorganisms responsible for its production still need investigation. In vinegars obtained from raw materials and systems typical of Europe, the acetic acid bacteria species Komagataeibacter europaeus predominates due to its particular adaptive metabolism. This work addresses the study of several adaptation mechanisms of K. europaeus during acetic acid fermentation in a submerged semi-continuous production system. The aim is to analyze the molecular response and behavior of this species to increasing acidity gradients, up to 7–8% w/v acetic acid, applying a comparative proteomic approach in three matrices (synthetic alcoholic medium, dark craft beer, and dry fine wine). A total of 1070 proteins are identified, with 174 showing statistically significant changes in abundance (FDR < 0.05), particularly in pathways related to amino acid biosynthesis, fatty acid metabolism, and stress response. The proteomic patterns differ among substrates, with the synthetic alcohol medium inducing stress-related proteins and the dark craft beer enhancing lipid biosynthesis. These observations provide experimental evidence that the fermentation substrate modulates metabolic adaptation in K. europaeus, offering a rational basis for designing fermentation protocols that enhance bacterial resilience, thereby optimizing vinegar production processes.

1. Introduction

Vinegar is a common household product that, beyond its culinary uses, mainly as a flavoring and food preservative, has long been recognized for its medicinal properties, offering antibacterial and antioxidant benefits, as well as roles in the prevention and treatment of diseases such as obesity, cancer, diabetes, and hypertension, among others [1,2]. This is mostly due to the health properties of acetic acid, which exerts health benefits including appetite stimulation, exhaustion recovery, a lower blood lipid content, and blood pressure regulation [1,2].
The organoleptic properties and quality of vinegar depend on multiple factors, including the origin of raw materials, microbial composition, and operating systems [1,3,4]. Raw materials significantly influence the final product’s sensory and chemical attributes, with popular substrates including spirits and alcoholic beverages (wines, must wines, beers, and ciders), which are more typical of European countries such as Italy, Spain, France, and Germany (ordered from highest to lowest export value), cereal grains (rice, sorghum, corn, barley, and wheat), which predominate in Asian countries such as China and Japan, and other fruit derivatives (tomato, strawberry, persimmon, mango, etc.), among others, each providing particular aromatic and flavor properties to the final product [2,3,4,5]. Wine vinegar is particularly significant in Europe, especially in the Mediterranean region. According to the most current official data, there are five vinegars with Protected Designation of Origin (PDO) status registered in Europe. Specifically, the following three of these PDO vinegars are from Andalusia (Spain): “Vinagre de Jerez”, “Vinagre de Montilla-Moriles”, and “Vinagre de Condado de Huelva” [5].
To overcome the vinegar-making limitations of traditional surface cultures, including poor control over system variables and microbial mass accumulation, submerged cultures are usually applied. In this system, microorganisms remain submerged while ensuring a high oxygen transfer efficiency and a good degree of mixing. This industrial approach enhances productivity, providing a significant advantage over traditional methods by offering a higher yield and consistency in product quality [6,7]. Different operating methods are available for submerged cultures, highlighting the semi-continuous working mode. This system is conducted in cycles, each concluding when the ethanol concentration in the medium decreases to a certain value. At that time, the reactor is partially unloaded until it reaches a certain volume; the remaining content is used as inoculum for the next cycle, which starts by introducing a fresh medium. The semi-continuous mode is preferred over other methods (continuous and batch modes) because it better supports the growth of mixed cultures that are auto-adapted to both the substrate and product [8,9].
Vinegar is obtained through the incomplete oxidation of ethanol in a medium by acetic acid bacteria (AAB) and other microorganisms that normally cohabit, forming microbial communities [10,11]. Regarding the main microorganisms responsible for this bioprocess, AAB genera such as Acetobacter, Komagataeibacter, Gluconacetobacter, and Gluconobacter play a crucial role in vinegar production due to their preference for ethanol as a carbon source and exceptional tolerance to high acidity levels [12]. Among them, Komagataeibacter europaeus stands out for its abundance in industrial fermentation settings, especially in Europe, because of its ability to withstand and thrive in environments with acetic acid concentrations higher than 15% w/v [13,14]. Recent studies have highlighted the dominance of K. europaeus in the microbial community during submerged acetification, contributing over 75% [9,15,16]. This prevalence has been associated with several physiological and molecular mechanisms, including the enhanced activity and stability of membrane-bound pyrroloquinoline quinone-dependent alcohol dehydrogenase (PQQ-ADH), which plays a crucial role in ethanol oxidation and acid resistance, as well as modifications in the cell envelope such as alterations in phospholipid composition, thereby supporting cell viability under high-acid conditions, among other adaptative mechanisms [12,17].
Despite their industrial significance, AAB are considered fastidious microorganisms due to their complex nutritional requirements and sensitivity to environmental conditions. Cultivating these bacteria in laboratory settings poses challenges, as they often enter a viable but non-culturable (VBNC) state under stress conditions, such as a low pH and high acetic acid concentrations, leading to difficulties in isolation and maintenance [8]. To address these challenges, specialized culture media enriched with specific carbon sources and buffering agents have been developed to support AAB growth and facilitate their recovery from the VBNC state. Even so, many species cannot be isolated, so the richness and diversity of these environments remain to be fully explored.
To tackle the challenges inherent in deciphering the microbial ecosystems of fermented foods, the adoption of omics approaches has proven invaluable. The implementation of high-throughput culture-independent techniques facilitates comprehensive analyses of microbial communities and their functional roles in situ, circumventing the limitations of traditional culture methods [10,18,19,20]. In the context of vinegar fermentation, metaproteomic analyses have been instrumental in identifying the predominant role of Komagataeibacter species, including K. europaeus. These studies have revealed that the activity of proteins associated with stress response and the tricarboxylic acid (TCA) cycle, among other metabolic processes, showed significant variations during acetification, underscoring the adaptive strategies employed by AAB to thrive in acidic environments [14,21]. Among the novel methodologies recently implemented for processing AAB proteins, the liquid chromatography coupled with tandem mass spectrometry (LC-MS/MS) approach has enhanced the resolution and accuracy of protein identification, facilitating a more detailed understanding of the functional roles of microbial communities in vinegar fermentation [22].
The starting hypothesis of the present study is that the chemical and nutritional composition of fermentation raw material can significantly influence the proteomic response of a species as predominant in the production of European vinegar as K. europaeus. Therefore, this work aims to analyze the behavior and adaptation mechanisms of K. europaeus throughout submerged vinegar production using the following three alcoholic raw materials: a synthetic alcohol medium, a dry white wine, and a craft dark beer. First, synthetically prepared raw material is selected to establish a comparative reference profile, without the influence of natural components. Next, two natural raw materials, typical of our region, are chosen in order to determine the influence of each on the K. europaeus proteome. A semi-continuous operating mode is selected for performing acetification and LC-MS/MS is selected for proteomic analysis, along with advanced bioinformatics tools. The outcomes are expected to fill a crucial gap in industrial biotechnology, aiding in the development of more efficient and resilient fermentation processes, ultimately advancing vinegar production technology, particularly in Europe.

2. Materials and Methods

2.1. Raw Materials

Three types of alcoholic raw material were employed as media for the acetification process. The first one was a synthetic alcohol medium (SAM), formulated in our facilities following the method outlined by Llaguno [23] with peptone (0.5 g/L) and yeast extract (0.25 g/L) as supplements. The remaining two media, as follows, were traditionally produced alcoholic beverages: a dry white wine (DWW), sourced from Montilla-Moriles (Bodegas Alvear S.A., Montilla, Córdoba, Spain), and a dark sugary craft beer (DSB) from Mahou-San Miguel, Córdoba, Spain. Although the original ethanol concentrations were different in each case, they were standardized to approximately 10% v/v by diluting with distilled water to suit the experimental conditions. The starting acidity (expressed as the mass percentage of acetic acid relative to the medium volume) was 0.1 ± 0.1% w/v for SAM, and 0.2 ± 0.1% w/v for both DWW and DSB. Further details concerning the composition of the raw materials can be found in Román-Camacho et al. [15]. Briefly, DSB was characterized by a high content of fermentable sugars, 35% of total sugars, mainly maple syrup and muscovado sugar, with 7% remaining unfermented, as well as a rich amino acid profile, with L-γ-aminobutyric acid, L-aspartic acid, L-glutamic acid, and L-arginine predominating, among others. DWW contained polyphenols and an amino acid profile mainly featuring L-proline, L-aspartic acid, ammonium ion, and L-γ-aminobutyric acid; whereas SAM was nutrient-poor, lacking complex organic compounds and providing ethanol as a unique carbon source.

2.2. Starter Inoculum

The original source of microorganisms consisted of a culture sample collected from the final phase of an industrial reactor making wine vinegar (UniCo Vinagres y Salsas, S.L.L., Doña Mencía, Córdoba, Spain). This inoculum was stored in our laboratories and subsequently acclimatized to each substrate by conducting several preliminary cycles before acetification and sampling; first, the synthetic alcohol medium (SAM) was used in all cases to calibrate the measurement probes, and next, each specific medium was used for acclimatization of microbial populations, as follows: (1) only SAM for the first profile, (2) SAM plus DWW, and (3) SAM plus DSB for natural profiles in each case. The inoculum was common to three profiles, but observations did not start until the microorganisms reached optimal activity with stable and repetitive cycles in each case. Additional content about the characteristics of the inoculum is available in Román-Camacho et al. [15].

2.3. Fermentation Conditions

Acetifications were conducted by a fully automated 8 L Frings bioreactor (Heinrich Frings GmbH & Co., KG, Bonn, Germany). The reactor worked in a semi-continuous method, which started with an ethanol depletion phase up to 1.0% v/v, and then, 50% of the volume was unloaded (4 L). Next, the reactor was replenished up to the working volume (8 L), ensuring that the preset ethanol concentration (5.0% v/v) was not exceeded. When the rate of ethanol disappearance from the medium was low, the loading phase could reach the preset ethanol concentration. After this point, ethanol was added gradually and discontinuously to avoid surpassing the specified concentration, as occurred in the SAM profile (see Figure 1). Throughout all experimental profiles, the conditions were maintained at a constant temperature of 31 °C, with a loading rate of 1.3 ± 0.1 L/h and an airflow of 7.5 L (h L medium).

2.4. Sampling

Before proceeding with full-scale sampling, several initial acetification cycles were performed to stabilize the system and establish consistent semi-continuous acetification patterns. First, samples for physicochemical analysis were directly collected from the raw materials before inoculation (SAM_T0, DWW_T0, and DSB_T0). Once reproducible cycles were achieved for each condition, stable sampling cycles were conducted, as follows: 28 cycles for SAM and 15 cycles each for the DWW and DSB profiles. Each acetification profile was stopped when the total volume of available medium was exhausted (100 L in each case) or when the cycles lost their stability, whichever came first. Samples from each acetification profile were collected at the following two key stages: first, at the end of the loading stage, when the bioreactor reached the working volume: SAM_T1, DWW_T1, and DSB_T1; and second, just prior to unloading, when acidity reached its maximum level, finishing the fermentation stage: SAM_T2, DWW_T2, and DSB_T2. Three to four samples were obtained across different stable cycles, randomly selected for each acetification profile.

2.5. Analytical Methods

The operative parameters of the system, including fermentation volume, ethanol concentration, and temperature, were monitored by using an EJA 110 differential pressure probe (Yokogawa Electric Corporation, Tokyo, Japan) along with an Alkosens R probe (Heinrich Frings GmbH & Co., KG, Bonn, Germany). Temperature data was obtained via the same ethanol probe mentioned above. The automated setup allowed for continuous data logging, ensuring a high level of reproducibility in the measurements. Total acidity (expressed as % w/v, g of acetic acid/100 mL of medium) was determined by acid–base titration using 0.5 N NaOH. Total and viable microbial cell counts were assessed using direct observation under an optical microscope (Olympus BX51, Hamburg, Germany), in combination with a Neubauer counting chamber (Brand™, model 7178-10, Brand, Wertheim, Germany), which featured a 0.02 mm depth and a rhodium-coated bottom. These data were only registered at sampling times.

2.6. Proteomics

2.6.1. Cellular Collection and Protein Extraction

The procedure for separating cells from vinegar samples and the subsequent extraction of proteins for analysis were performed following the protocol described in our previous works [22].

2.6.2. LC-MS/MS Analysis

Protein identification of samples (≥50 μg) was conducted through LC-MS/MS analysis at the Central Research Support Service (SCAI) of the University of Córdoba (Córdoba, Spain). A Dionex Ultimate 3000 nano UHPLC system coupled with an Acclaim Pepmap C18 column, 500 mm × 0.075 mm (Thermo Fisher Scientific, MA, USA), was used for nano-LC separation. Mass spectrometry (MS) detection was performed on an Orbitrap Fusion instrument equipped with a nanoelectrospray ionization source (Thermo Fisher Scientific, Waltham, MA, USA). MS raw data were treated by Proteome Discoverer (version 2.1.0.81, Thermo Fisher Scientific, MA, USA). MS/MS spectra were searched with the SEQUEST engine against UniProt for Komagataeibacter europaeus as the selected species. The rest of the criteria established for the search, as well as other additional information, are available in Román-Camacho et al. [22]. Finally, it is important to note that this study is a continuation of previous studies in which the vinegar metaproteome was characterized [9,15]. Because the species K. europaeus contributed to the higher protein abundance (> 70%), far above the other groups, and plays a key role in the function of the microbial community, an enrichment analysis is conducted in the present study, exclusively to search and obtain the K. europaeus proteins in three acetifications. K. europaeus is treated in this study as a model in the context of its own microbial community.

2.6.3. Data Analysis

The raw proteomic data were processed using Perseus software (version 2.0.3.1). Only proteins detected in at least 50% of the samples (three or four replicates per group) at each sampling time point (T1 and T2) and shared across the three fermentation systems (SAM, DSB, and DWW) were retained for further analysis. Missing values were imputed using a detection limit approach, where each missing value was replaced by one-fifth of the minimum positive intensity observed for that protein across all samples. Subsequently, total sum normalization (TSN) was applied by scaling each protein intensity to the sum of all protein intensities within a given sample and multiplying by 100. Autoscaling was performed using z-score transformation to ensure comparability across samples and proteins.
All downstream statistical and exploratory analyses were conducted using MetaboAnalyst 5.0 “www.metaboanalyst.ca (accessed on 3 October 2024)”. One-way ANOVA followed by Tukey’s post hoc test was used to identify proteins with statistically significant differences in abundance (p < 0.05). Volcano plots were generated in MetaboAnalyst to visualize the differential protein abundance between each pair of fermentation substrates (SAM vs. DSB, SAM vs. DWW, and DSB vs. DWW), allowing for the identification of significantly modulated proteins specific to each comparison. Feature selection was performed using sparse Partial Least Squares Discriminant Analysis (sPLS-DA) to assess sample separation and rank proteins according to their loadings on the first component. A sparsity criterion of 10 variables per component was set a priori to maximize interpretability while maintaining model performance. Additionally, hierarchical clustering heatmaps were generated in MetaboAnalyst using Euclidean distance to visualize expression patterns across conditions.
Protein–protein interaction (PPI) network analysis and Kyoto Encyclopedia of Genes and Genomes (KEGG) pathway enrichment (GO enrichment) were performed using the STRING 11.5 database “https://string-db.org/ (accessed on 14 November 2024)” with K. europaeus as the reference organism. Only high-confidence interactions (combined score > 0.7) were considered. The resulting interaction networks and pathway mappings were visualized using Cytoscape 3.10.2 for functional interpretation and clustering analysis.

3. Results and Discussion

3.1. Description of Acetification Profiles

The acetification profiles displayed clear differences among substrates (Table 1). SAM progressed slower and required an additional loading phase, DWW completed the process the fastest, and DSB was operated at a reduced volume due to foaming. SAM maintained the highest viable cell counts, whereas DWW and DSB showed greater acetification efficiency. These trends are further addressed in Section 3.6 in relation to proteomic differences.
In short, the acetification profiles showed that the synthetic alcohol medium (SAM) had the slowest fermentation cycle and the highest cell viability compared to the natural raw material profiles. The dry white wine (DWW) profile had the highest acetification rate and acidity, which suggests that the nutrient complexity of DWW may facilitate faster and more efficient fermentation, while the poor nutrient composition of SAM imposes metabolic constraints despite supporting viable cell levels. In the case of DSB, foaming issues along with excessive sugar content may have influenced acetification yield, despite its high nutritional richness. Overall, the analysis of acetification profiles showed that raw material composition may affect the efficiency of vinegar production, in agreement with other studies [15,20,24].

3.2. Functional Enrichment Analysis

A total of 1070 proteins were identified throughout each acetification profile (SAM, DWW, and DSB) and at sampling time (T1 and T2) by LC-MS/MS technology. After filtering proteins present in at least 50% of biological replicates using Perseus (version 2.0.3.1), 570 proteins were retained for comparative analysis. The raw data list of valid proteins, including additional information about them, can be found in Table S1 (see Supplementary Material). Among these, 174 proteins showed statistically significant differences (ANOVA, p-value < 0.05), corresponding to 16.4% of the total protein dataset.
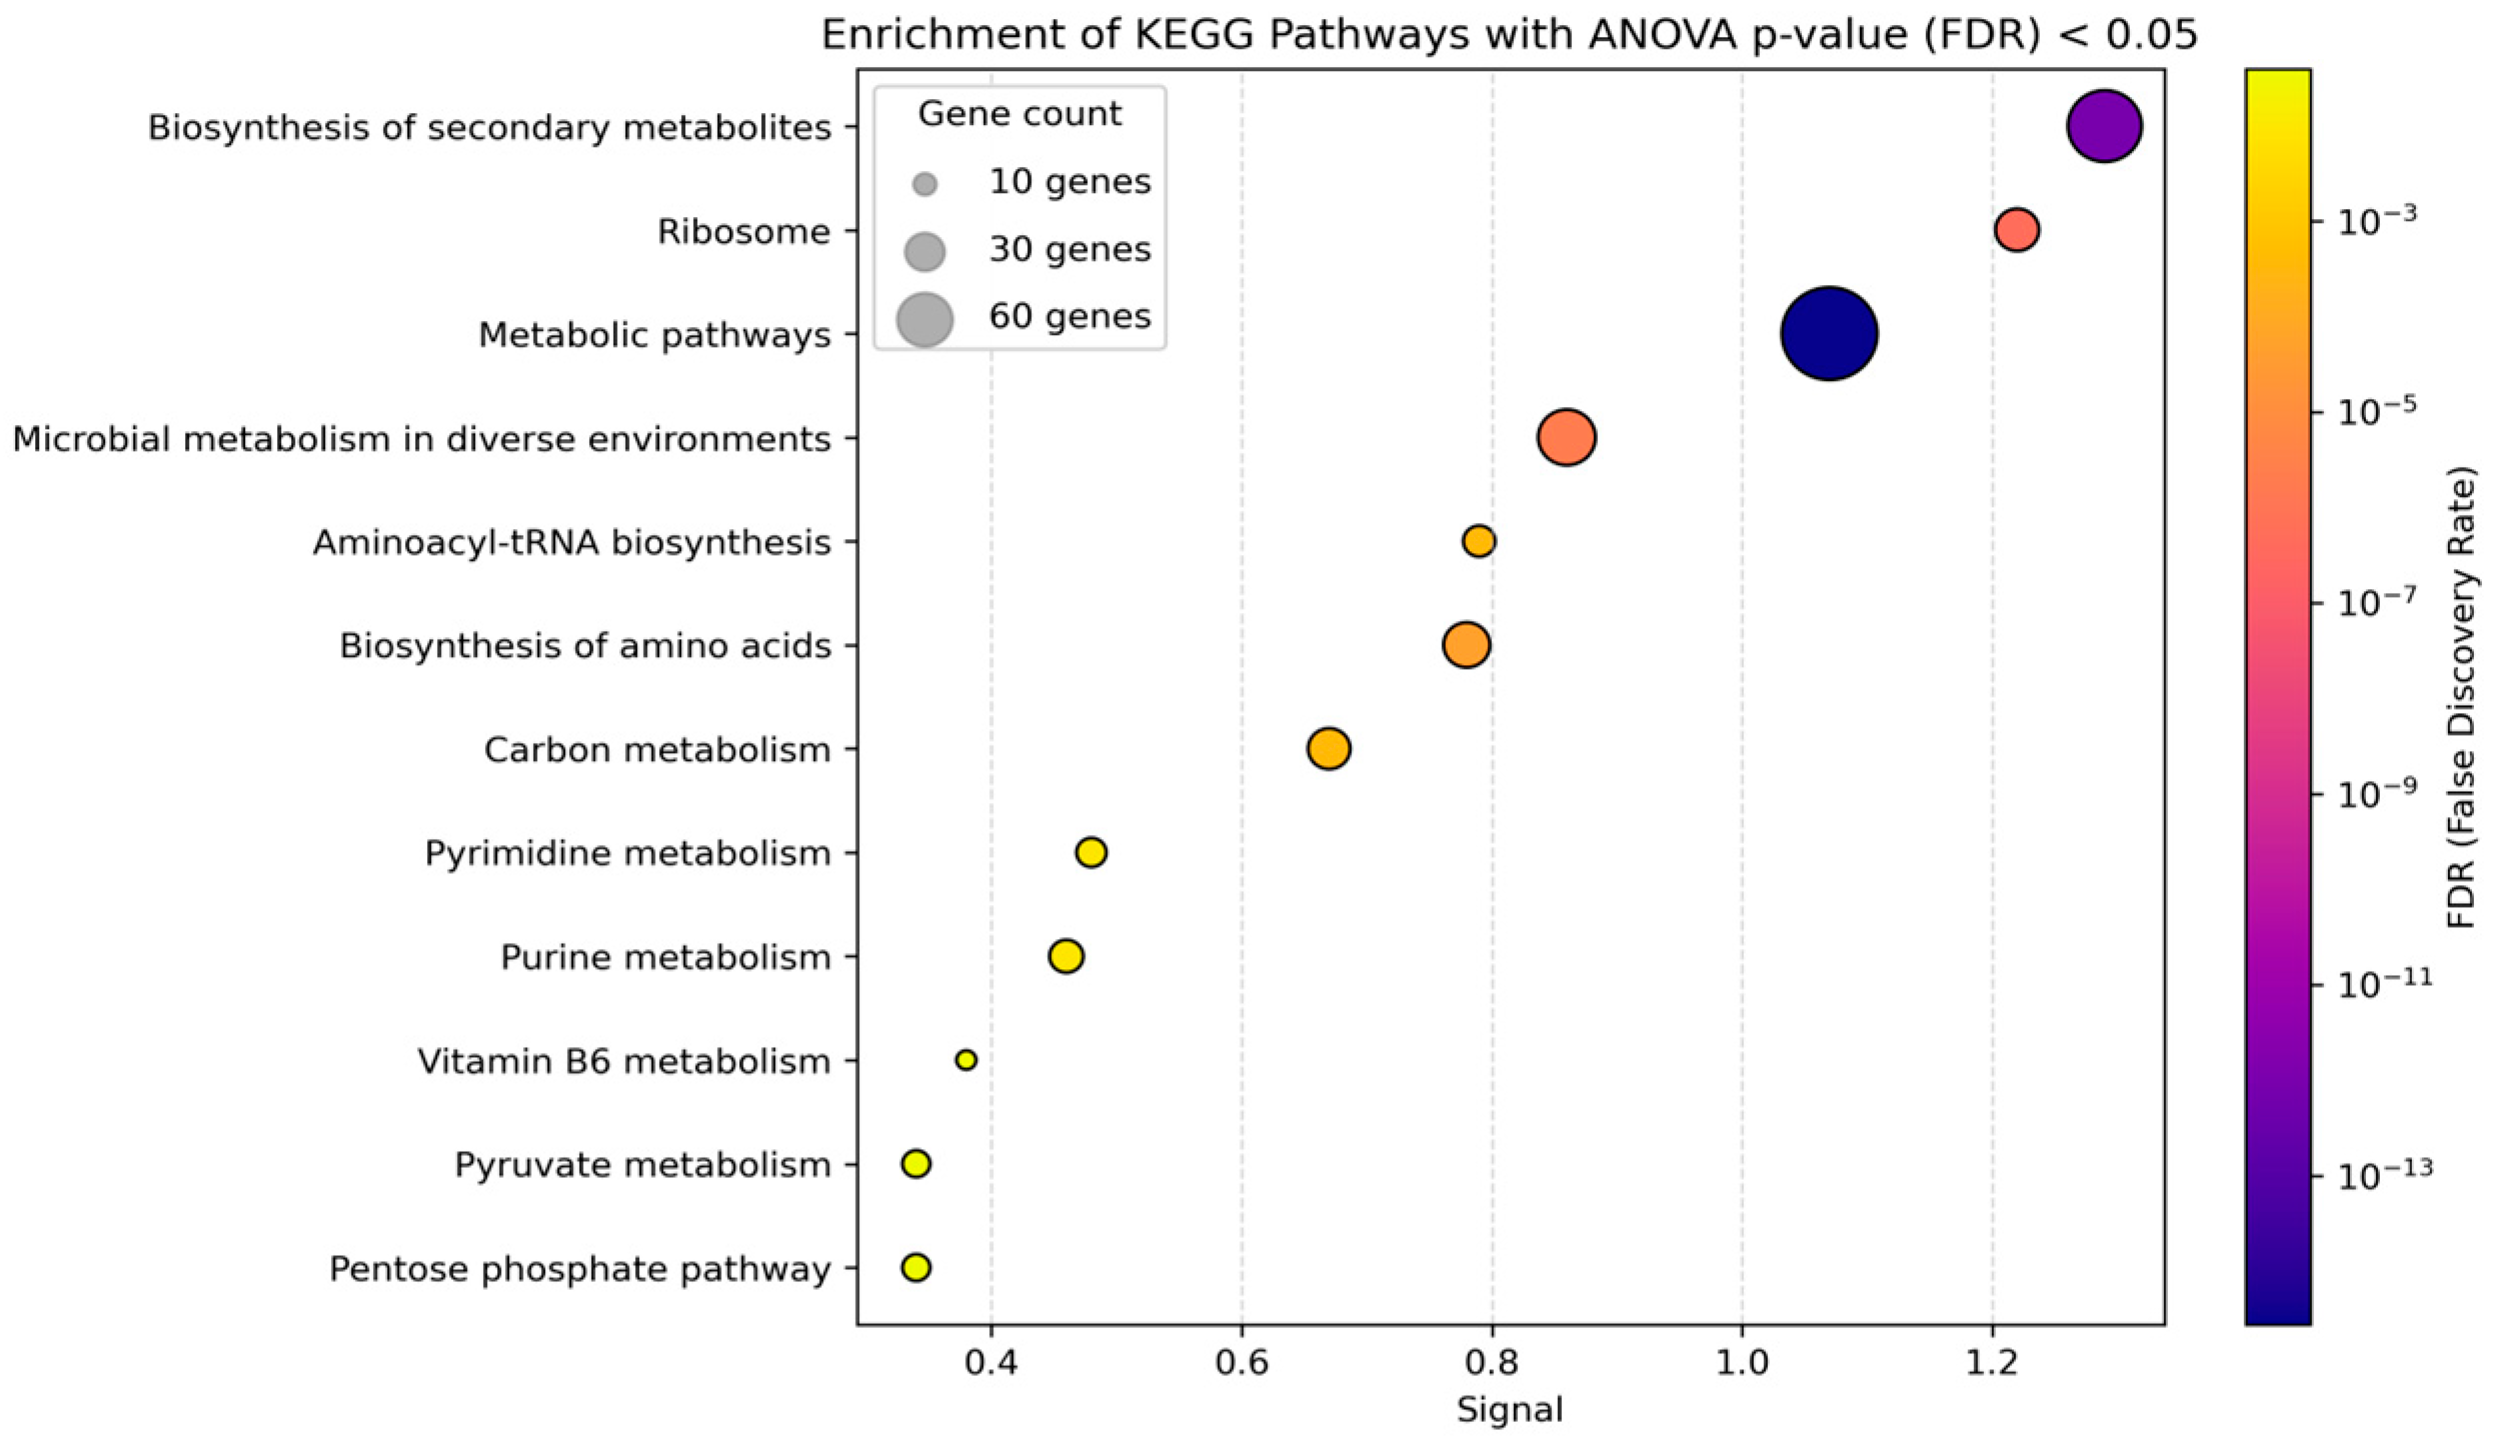
To investigate the biological functions of the differentially abundant proteins, KEGG pathway enrichment analysis was performed using the STRING database, and the results are shown in Figure 2. The main categories of the enrichment analysis based on KEGG pathways corresponded to biosynthetic processes, metabolic functions, and stress-related responses. Among the top enriched pathways were “Biosynthesis of secondary metabolites”, “Ribosome”, and “Metabolic pathways”, associated with a particularly high gene count, represented by larger bubbles (≥30 genes), and a strong signal (>1.0), although some of them were general metabolic pathways; these pathways also provided the highest FDR values (>10−5). The remaining enriched pathways included “Microbial metabolism in diverse environments”, “Aminoacyl-tRNA biosynthesis”, and “Biosynthesis of amino acids”, as well as several involved in carbon and nucleotide metabolism, such as “Carbon metabolism”, “Purine metabolism”, and “Pyrimidine metabolism”, among others. These results may suggest, as in other works, that proteins involved in biosynthesis processes, translation, and cellular adaptation mechanisms were enhanced and differentially modulated depending on the acetification profile. Thus, K. europaeus could take advantage of the nutrients offered by each raw material to promote one metabolic pathway or another [14,25,26].
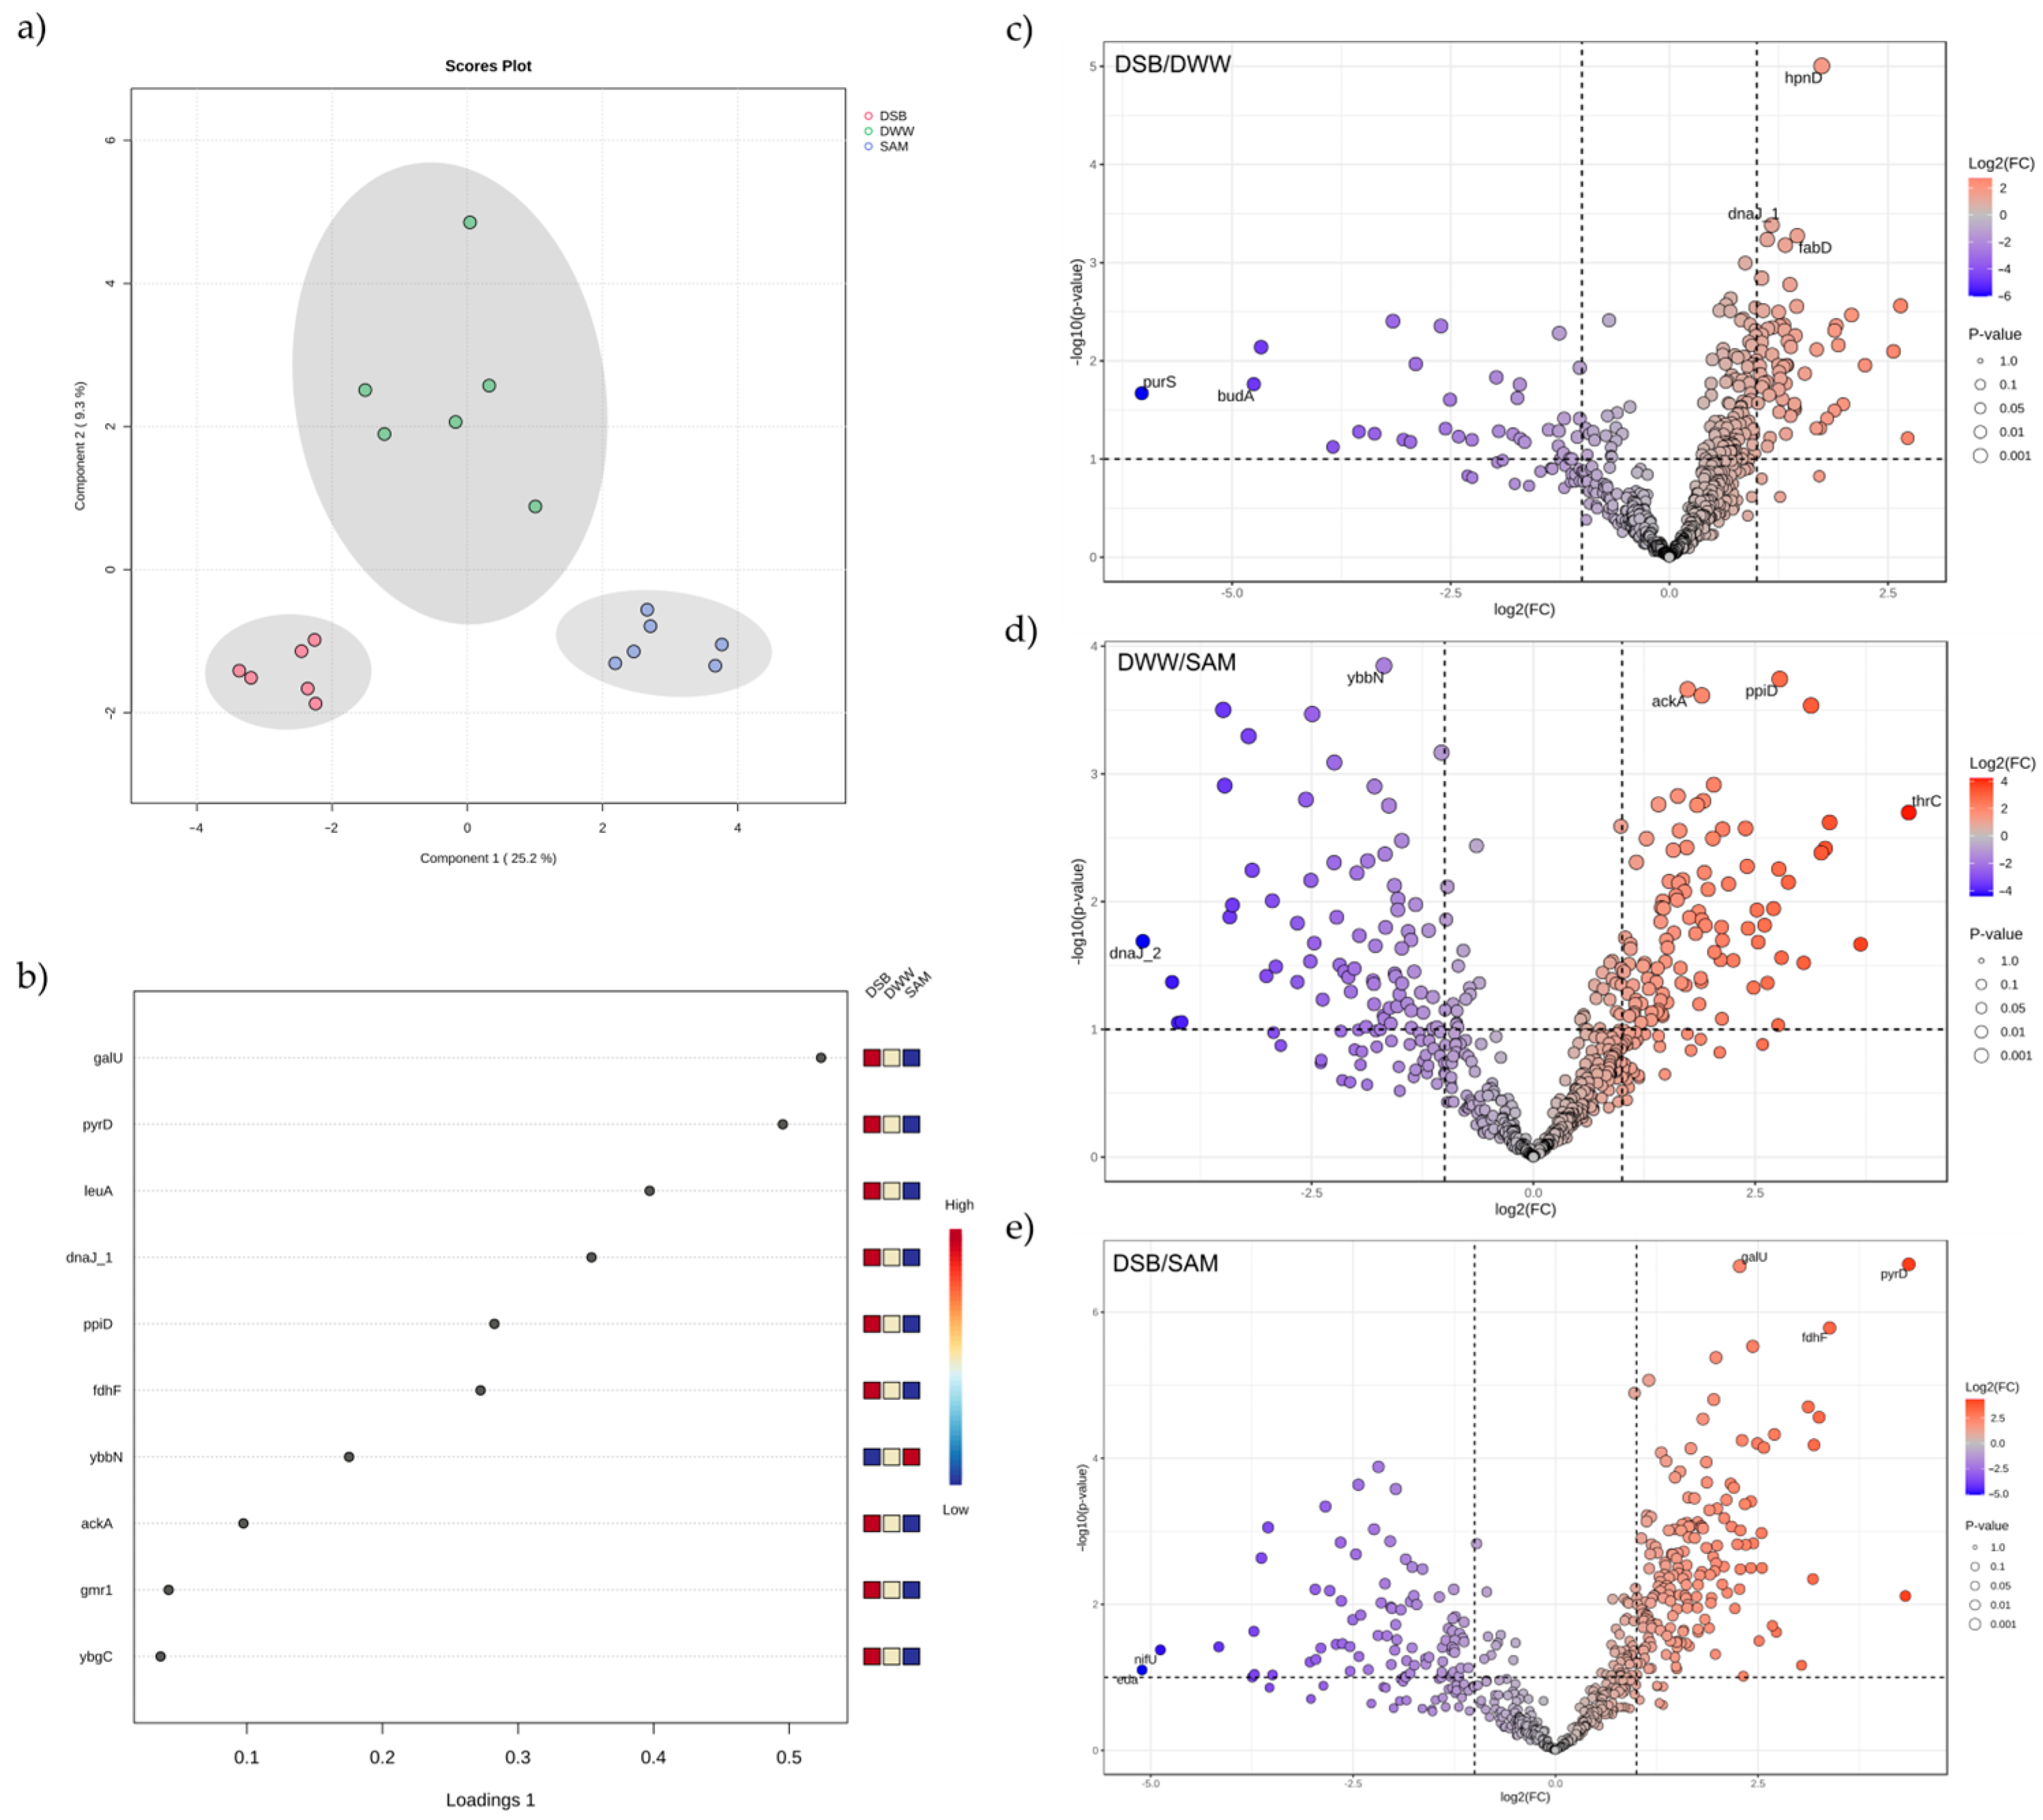
To assess the multivariate distribution of the samples and evaluate potential grouping patterns based on the fermentation substrate, a sparse Partial Least Squares Discriminant Analysis (sPLS-DA) was conducted (Figure 3a). This supervised method allows for dimensionality reduction while optimizing sample discrimination, revealing a clear separation among the three acetification profiles (SAM, DWW, and DSB). The distinct clustering indicates substrate-specific proteomic signatures, further corroborated by the Random Forest analysis (Figure 3b), which identifies key discriminatory proteins driving the classification. Volcano plots (Figure 3c–e) provide pairwise comparisons of proteomic profiles, highlighting proteins with statistically significant differential abundances across substrates.
Notably, the findings reveal that several biosynthetic and stress-related pathways were subject to substrate-dependent modulation, particularly those involving amino acid and fatty acid metabolism. These patterns are consistent with prior omics studies on K. europaeus and related AAB, which describe enhanced quantification of proteins related to the TCA cycle, lipid remodeling, and membrane-bound ADH and ALDH as central features of acid adaptation [12,17,27]. For instance, K. europaeus and related AAB have been shown to upregulate oxidative metabolism and stress chaperones under high acetic acid concentrations (> 7–8% w/v), ensuring redox balance and membrane stability during fermentation [16,28,29]. The coordinated high quantification of key proteins such as galU, pyrD, leuA, dnaJ1, and ppiD, along with volcano-plot-enriched proteins like hpnD, dnaJ1, fabD (DSB/DWW, Figure 3c), ackA, ppiD, thrC, ybbN, dnaJ2 (DWW/SAM, Figure 3d), galU, pyrD, fdhF, nifU, and eda (DSB/SAM, Figure 3e), reflects a comprehensive stress-adaptive and biosynthetic response that differs significantly depending on the raw material used for vinegar production. These proteomic shifts are thought to integrate metabolic, structural, and regulatory responses that promote survival under cyclical acid stress, particularly under submerged culture systems [8,24,30]. Overall, the clustering in sPLS-DA and the specific protein markers identified suggest that K. europaeus tailors its physiology to the physicochemical nature of each raw material, aligning with mechanisms observed in earlier transcriptomic and metabolomic investigations [4,14,18]. This reinforces the concept of a tightly regulated acid tolerance network that is both conserved and modulated by the acetification substrate. In short, KEGG enrichment and sPLS-DA analyses confirmed substrate-specific modulation of the key proteome of AAB and other related microbiota members.

3.3. Proteomic Profile Involved in Amino Acid Biosynthesis

Among the 571 quantified proteins, 50 were associated with amino acid biosynthesis pathways. Of these, nine proteins showed statistically significant abundance differences across the three fermentation profiles (ANOVA, p-value < 0.05). These included the following proteins: lpd3 (A0A0M0EJQ4), leuA (A0A0M0EHV1), metXA (A0A0D6PWD8), proA (A0A0D6PYG3), hisC (A0A0D6Q0F6), gcvH (A0A0M0EEQ3), hisB (A0A0D6PWQ8), thrC (A0A0D6PVA6), and hisZ (A0A0M0EGQ7).
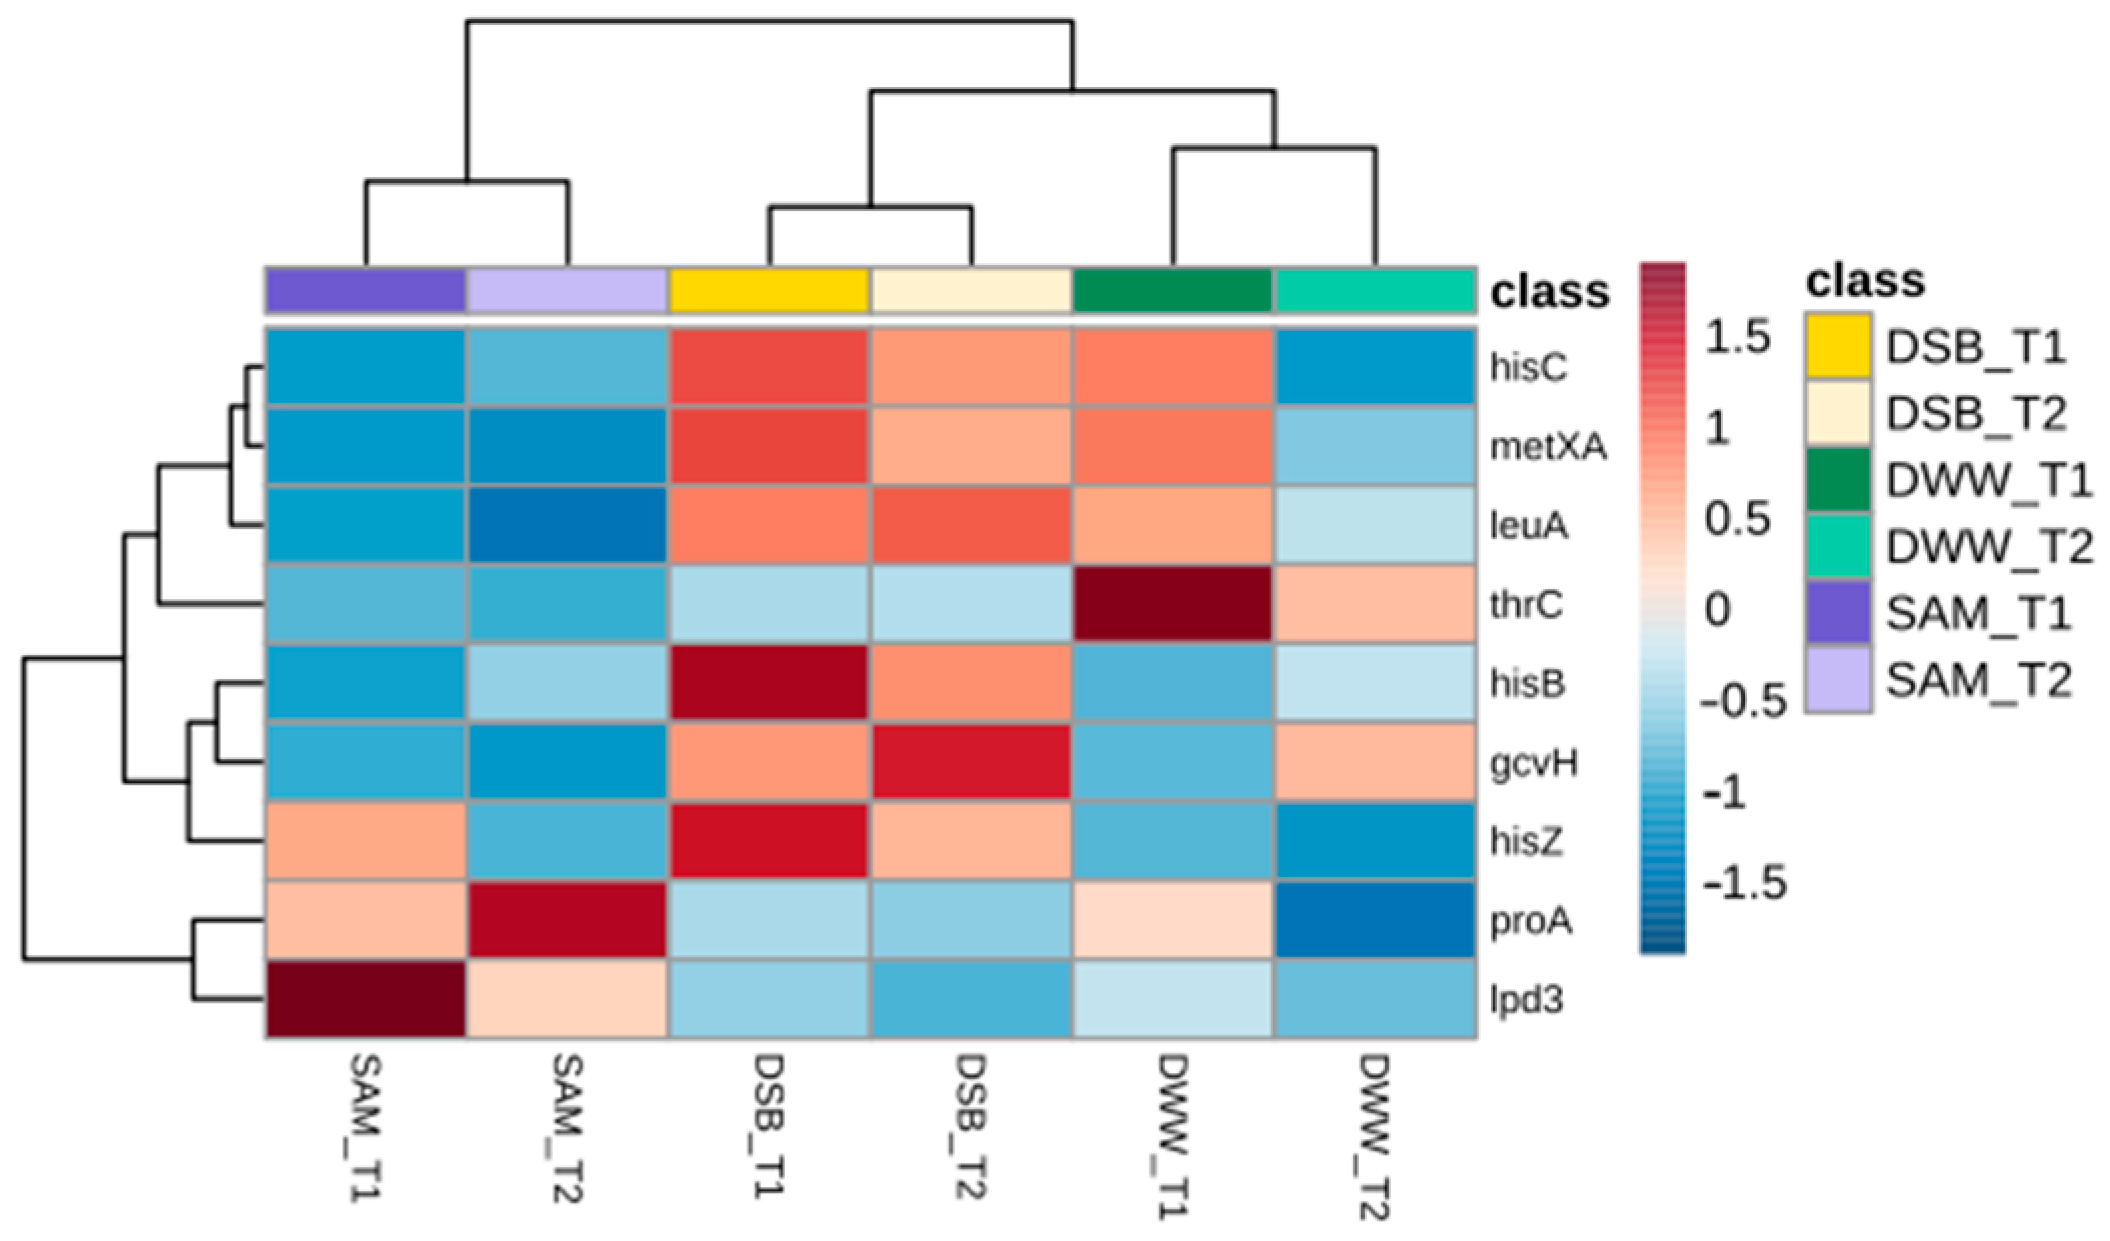
A heatmap illustrating the relative protein abundances (z-score normalized) is shown in Figure 4. The DSB profile displayed a higher abundance in six out of the nine proteins, while the SAM profile exhibited the lowest intensities in most proteins. These differences reflect variations in proteins directly associated with amino acid metabolism under different acetification media. The associated amino acids, including L-histidine, glycine, L-methionine, L-threonine, L-proline, and L-leucine, are summarized in Table 2.
Proteins related to amino acid biosynthesis showed a higher abundance, for instance, of histidine-associated proteins (hisB, hisC, and hisZ) in the DSB profile, which may reflect an adaptive response aimed at maintaining intracellular pH balance and enhancing cellular protection mechanisms under acidic stress, and proline-associated proteins (proAs) in the SAM profile, which aligns with the substrate availability and stress adaptation of AAB, as in the case of K. europaeus. DSB, which may have a higher initial histidine content, supported enhanced anabolic activity, whereas SAM induced protective responses. These results are consistent with previous findings in Gluconacetobacter and Komagataeibacter spp., as well as K. europaeus, where the metabolism of amino acids through biosynthesis and deamination processes can modulate the nitrogen cycle and contribute to the replenishment of biosynthetic precursors for the synthesis of cellular material in sudden semi-continuous working systems for vinegar production [15,21,31,32].

3.4. Proteomic Profile Related to Lipid and Fatty Acid Biosynthesis

A total of ten proteins related to lipid and fatty acid biosynthesis were identified, including accC1 (A0A0M0EJY2), hpnC (A0A0D6Q455), fabF (A0A0D6PVE4), fabG1 (A0A0M0ELM6), fabZ (A0A0D6PVE5), fabI (A0A0D6PZ96), fabD (A0A0M0ELK1), fabH (A0A0D6PY59), lpxD (A0A0M0EIE3), and lpxA (A0A0M0EIE7).
The abundance patterns of these proteins are summarized in Figure 5, which includes a heatmap of their z-score-normalized abundances and boxplots of the most representative proteins, fabF, fabI, and hpnD. Samples of the DSB profile showed a consistently higher abundance across most proteins, particularly throughout acetification profiles (DSB_T1 and DSB_T2). Samples of the SAM media exhibited the lowest abundance levels, while those of DWW displayed intermediate abundances, see Figure 5a.
Among the differentially abundant proteins, fabF and fabI showed statistically significant variations (ANOVA, p-value < 0.05), with a higher abundance in the DSB acetification profile. The protein hpnD showed an elevated abundance at DSB_T1 (1.22 ± 0.40, see Figure 5b and Table S1). On the other hand, fabD, fabG1, and lpxG showed particularly high quantification peaks at SAM_T1. These results suggest that the fatty acid biosynthetic pathways in K. europaeus were strongly modulated by the substrate, likely as part of membrane adaptation responses during acetic acid fermentation. Concretely, a significant group of proteins exhibited high and stable abundance levels during the course of the DSB acetification profile, with other proteins showing peaks at the end of the loading phase for the rest of the profiles (SAM_T1 and DWW_T1).
According to several studies, the regulation of fabF and fabI under acidic conditions has been described in Acetobacter pasteurianus and other related species [33]. While these observations provide useful context, the specific regulation of these proteins in K. europaeus remains poorly characterized. In our study, fabF and fabI exhibited a decreased abundance over time, contrasting with previous reports for K. europaeus under lower-acidity conditions [14]. This suggests that the regulatory proteins associated with fatty acid pathways in our goal species, K. europaeus, may differ under higher acetic acid levels or under different substrate natures and compositions. The upregulation of fabH was inversely related to the abundance of stress proteins, especially in the DSB and DWW profiles, while the SAM profile exhibited the opposite trend. This suggests that lipid metabolism modulation may be linked to cellular stress resilience mechanisms. A metabolic adaptability shift of cell membrane fatty acids was also demonstrated in Komagataeibacter hansenii HDM1-3, with the activation of fatty acid dehydrogenase (des) and cyclopropane fatty acid synthase (cfa) genes under high-acid conditions [34]. In summary, these findings suggest species-specific responses to different media and cycle moments.

3.5. Proteins Related to Acetic Acid Metabolism

The transformation of ethanol into acetic acid may be carried out in both the periplasm and cytoplasm. However, this oxidative bioconversion predominantly occurs in the periplasm, where pyrroloquinoline quinone-dependent alcohol dehydrogenase (PQQ-ADH) oxidizes ethanol into acetaldehyde, followed by oxidation into acetic acid by pyrroloquinoline quinone-dependent aldehyde dehydrogenase (PQQ-ALDH). At the cytoplasm level, NAD and NADP-dependent alcohol and aldehyde dehydrogenases (NAD-ADH and NAD(P)-ALDH) perform parallel roles in the ethanol oxidation process [12,17,35].
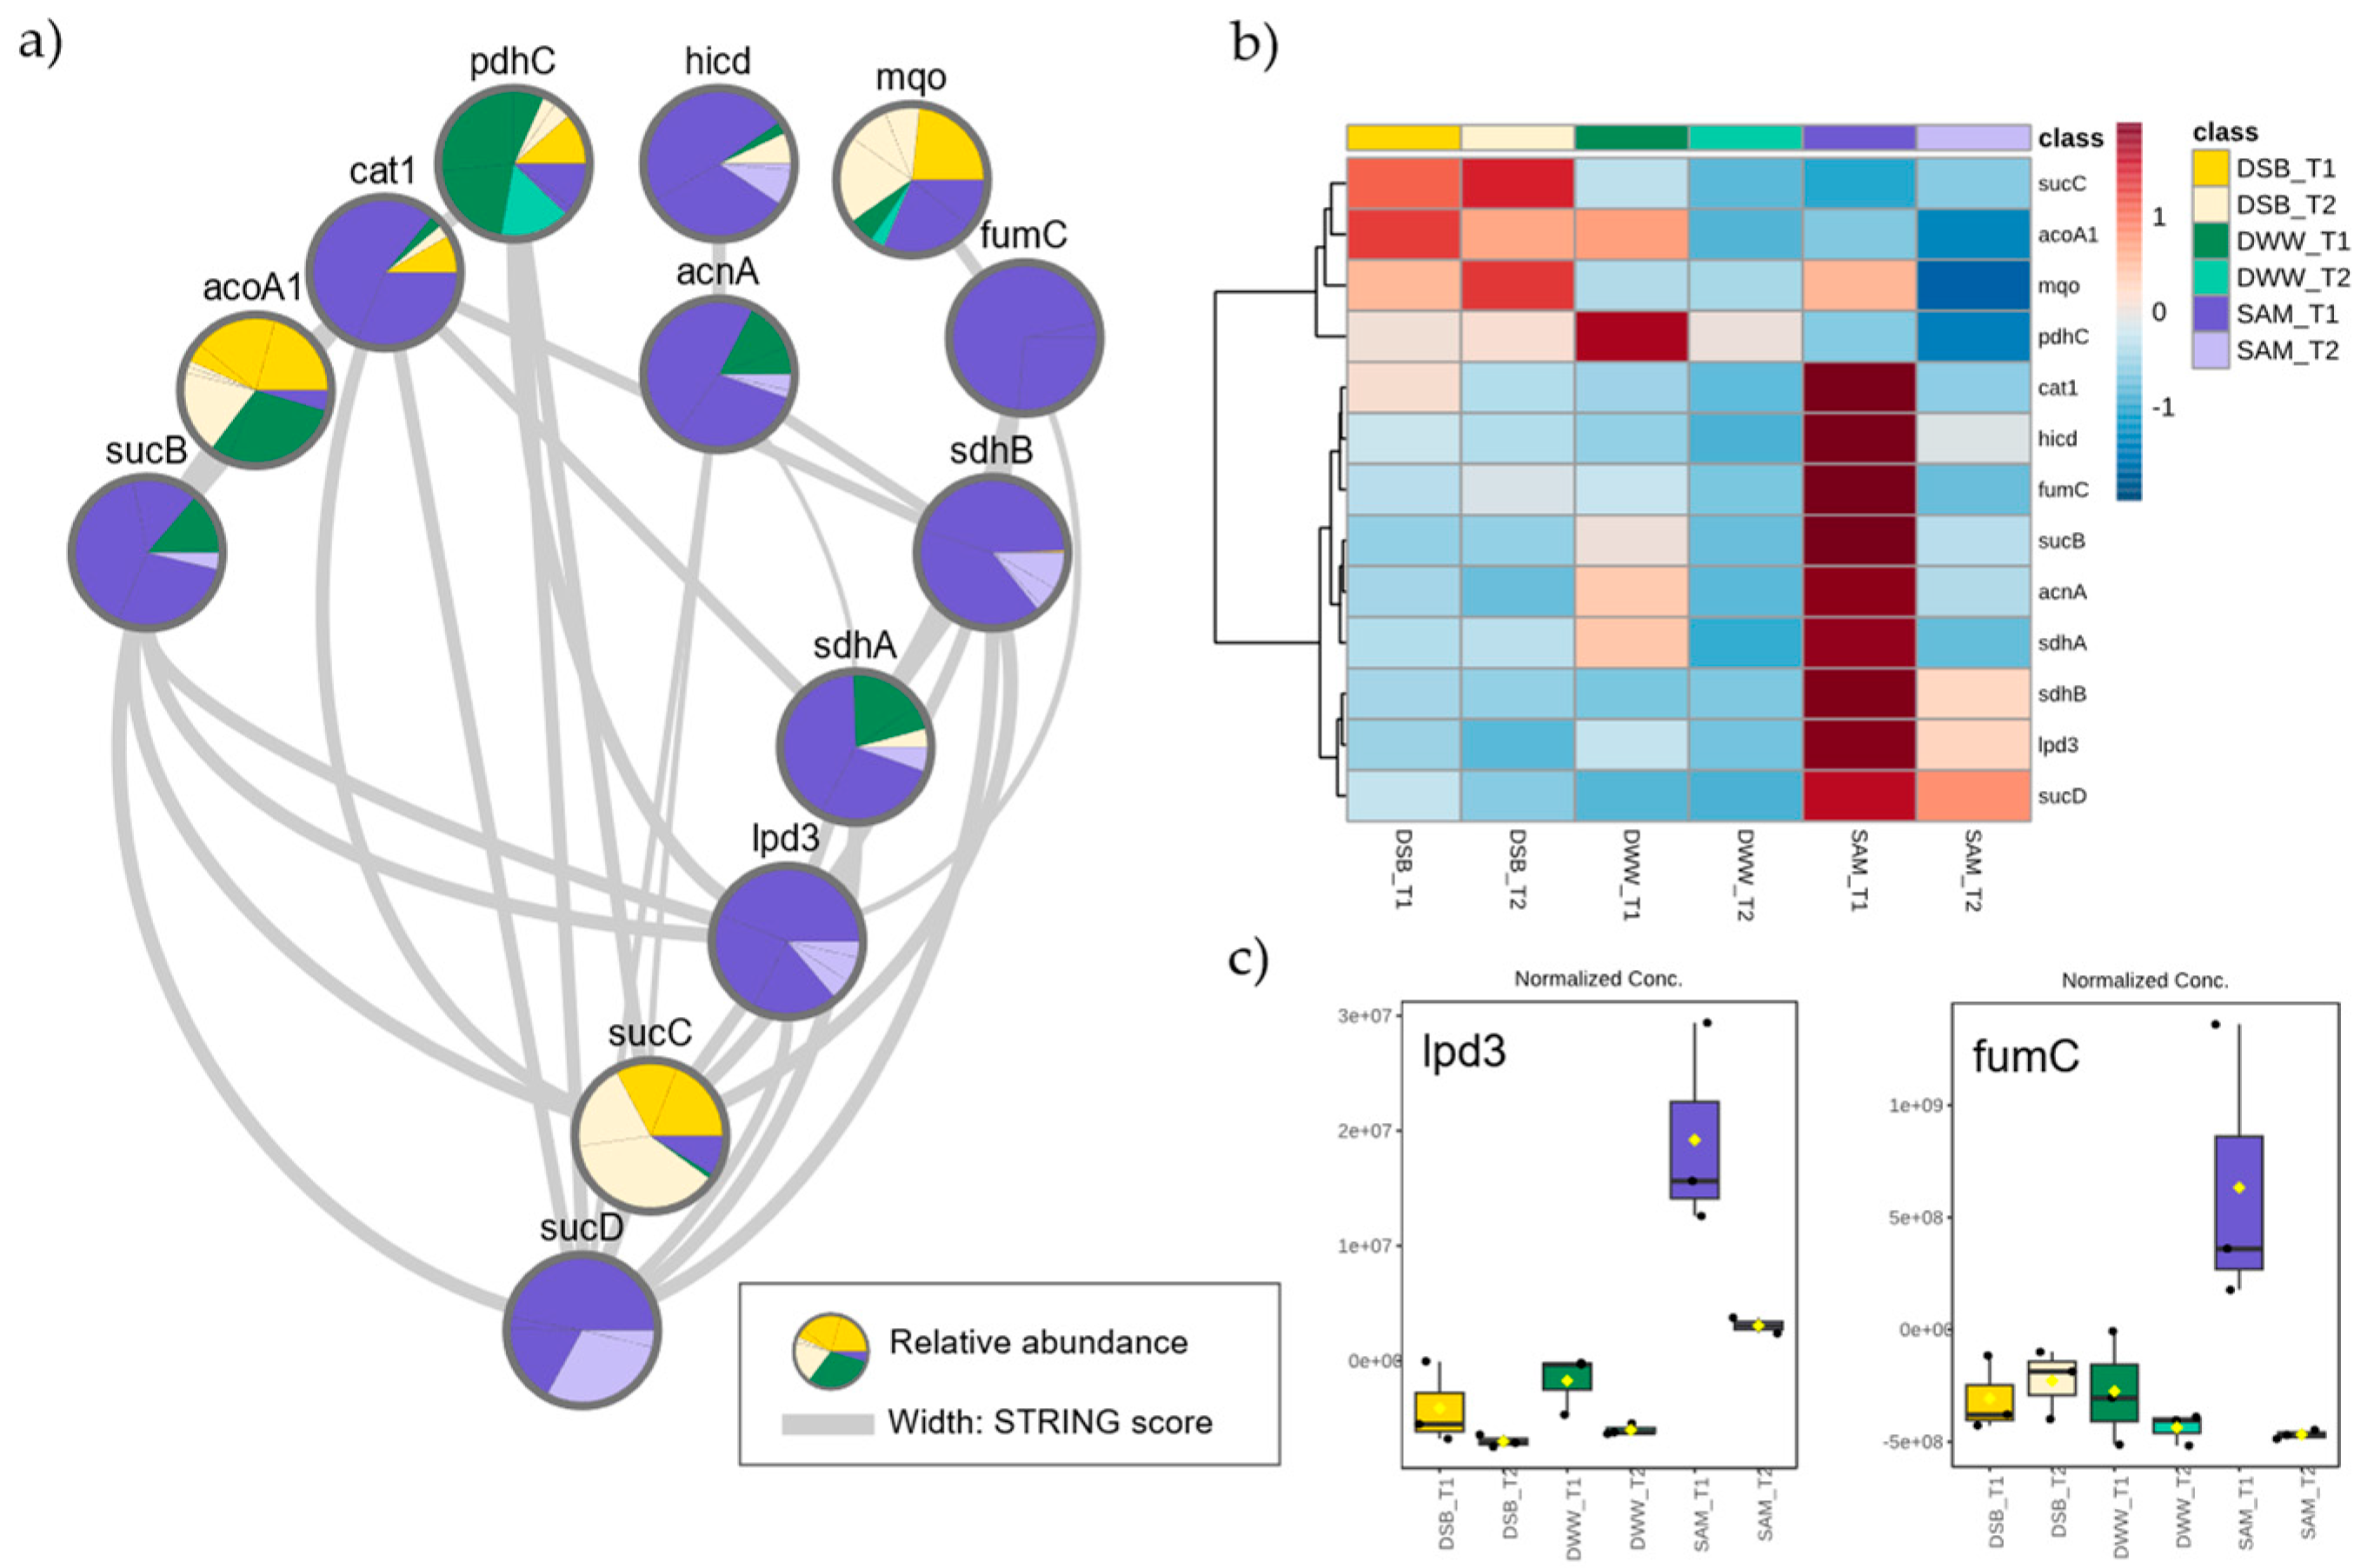
In this study, a set of enzymes related to acetic acid metabolism and assimilation via the TCA cycle was identified for the three acetification profiles. A functional network of these proteins (n = 13) was built using the STRING database in order to determine their interactions and abundance profiles, see Figure 6a. The network included enzymes involved in the cell inner assimilation of acetic acid, including ackA (A0A0M0EKC3), fumC (A0A0D6PUS9), sucD (A0A0D6PVF4), sucC (A0A0D6PXR7), acnA (A0A0M0EJW2), mqo (A0A0D6PWY5), cat1 (A0A0M0EHH9), sdhA, sdhB, pdhC, hicD, acoA1, and lpd3 (A0A0M0EJQ4).
The heatmap shown in Figure 6b illustrates the z-score-normalized abundances of these proteins across the different acetification profiles and sampling times. The SAM profile, particularly at SAM_T1, showed elevated abundance levels for most enzymes in this group, especially acnA, sucC, and fumC, suggesting a potential metabolic shift to assimilate acetic acid through the TCA cycle and metabolic response under high-acid stress conditions [21,36].
The rest of the proteins displayed high abundances at the end of the loading phase for the natural acetification profiles (DSB_T1 and DWW_T1). The particular boxplots produced for the lpd3 and fumC proteins indicate statistically significant differences in abundance across sampling times (ANOVA, p-value < 0.05), see Figure 6c. While lpd3 was most abundant in DSB, fumC showed strong quantification in SAM samples, consistent with an increased metabolic demand under nutrient-limited or acidic conditions. TCA cycle proteins were upregulated in SAM, suggesting an enhanced assimilation of acetic acid at the cytoplasmic level. In fact, K. europaeus is known to possess TCA cycle enzymes and is able to execute this cycle in the case of excess cytoplasmic acetic acid [12,15,21].
On the other hand, eight proteins and subunit proteins were identified as participating in incomplete ethanol oxidation into acetic acid at the membrane level. These included subunits of PQQ-ADH, PQQ-ALDH, NAD-ADH, and NADP-ALDH. The abundance patterns of these enzymes, shown in Figure 7, suggest differential abundances between the different profiles. Moreover, samples from the DSB media exhibited higher levels of PQQ-ADH and PQQ-ALDH, particularly at the unloading phase (DSB_UL). By contrast, samples from SAM tended to show a lower abundance of these proteins. No clear pattern of differential abundance was observed for the NAD- or NADP-dependent subunits.
These findings suggest that ethanol oxidation at the membrane level may have been more active in the DSB acetification profile, possibly reflecting substrate-specific regulation of membrane-bound dehydrogenases [12,35,37].

3.6. Stress-Related Proteins

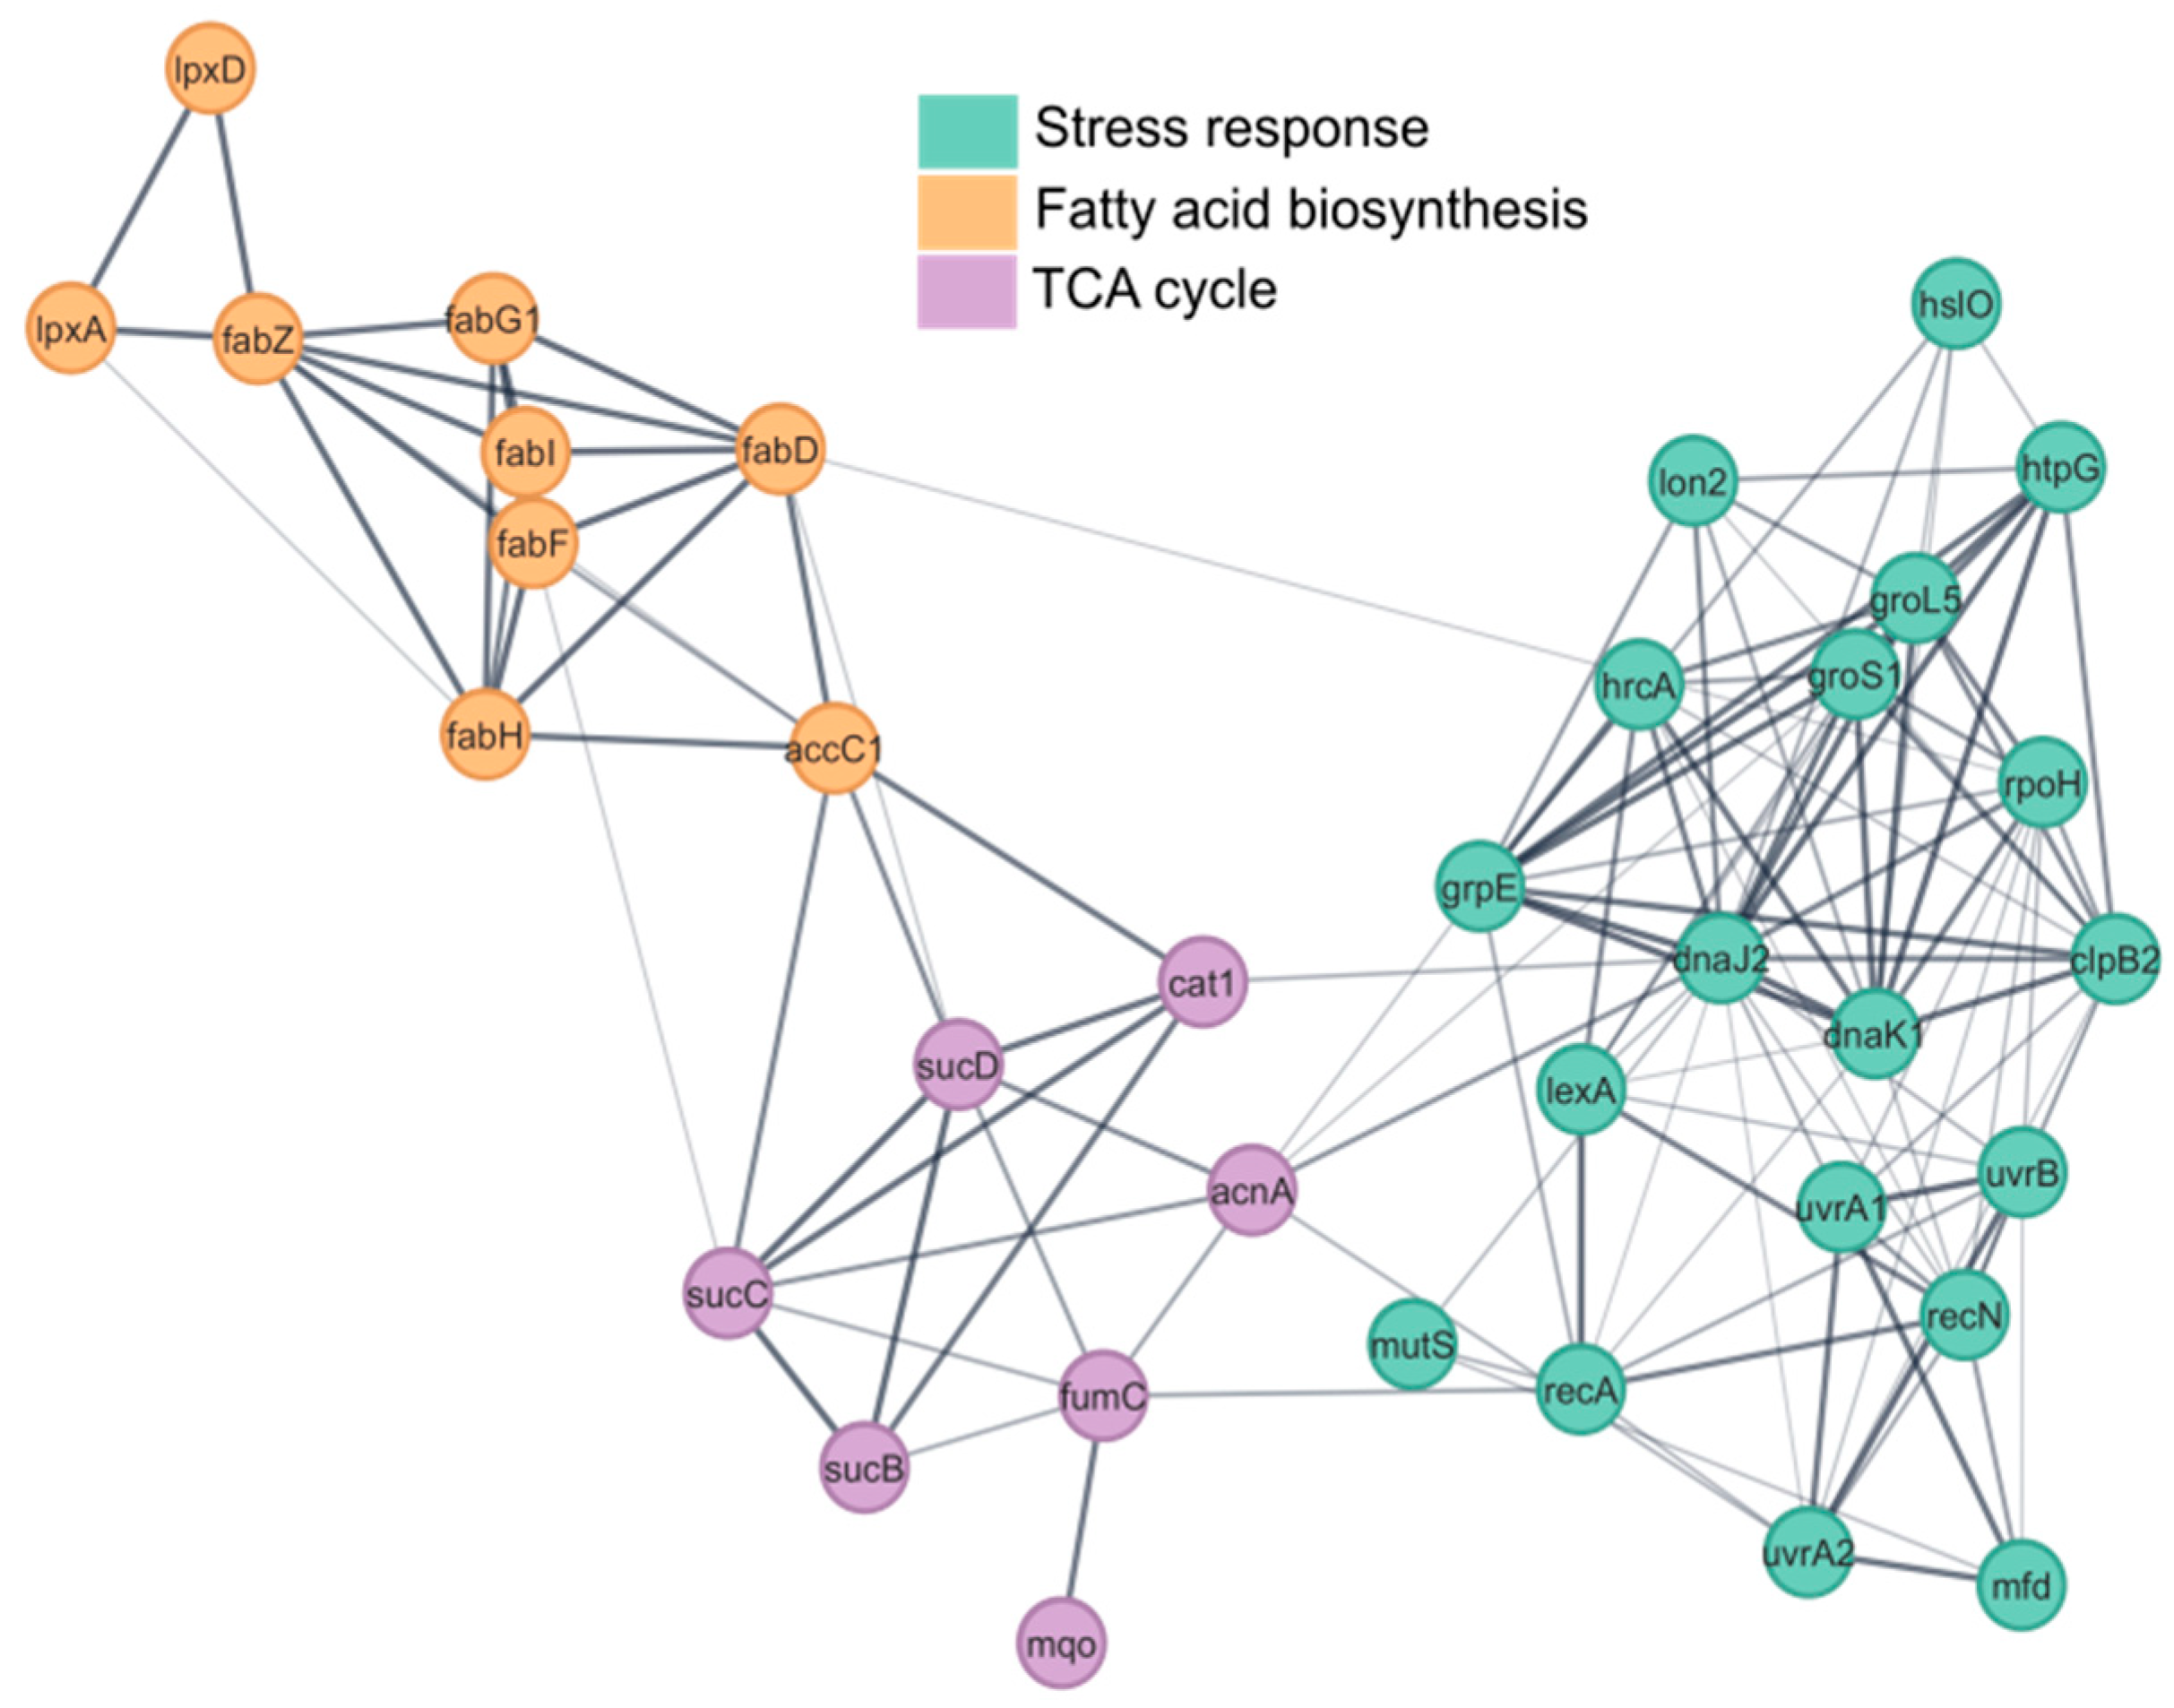
Among the 19 identified stress-related proteins, protein–protein interaction network analysis revealed two main distinct groups, as shown in Figure 8. The first group included heat shock proteins such as clpB (A0A0D6PW14), dnaJ (A0A0D6PXF2), dnaK1 (A0A0M0EL04), groL (A0A0D6PXU2), rpoH (A0A0D6PYU1), grpE (A0A0M0EK23), groS (A0A0D6PX21), hrcA (A0A0M0EJT2), hsp33 (A0A0D6PWJ8), htpG (A0A0D6Q0I1), and lon2 (A0A0D6Q3R7), which are selectively synthesized by cells under stressful conditions such as high temperatures, oxidative damage, and harmful physicochemical environments. The second protein group consisted of DNA damage response proteins, including recN (A0A0D6Q2N5), uvrA1 (A0A0M0EGX9), uvrA (A0A0D6Q0A4), uvrB (A0A0M0EIH5), mutS (A0A0M0EIJ0), lexA (A0A0D6PZC4), mfd (A0A0D6PZF9), and recA (A0A0M0EFG0). These proteins participate in excision repair, recombinational repair, and the SOS response pathway [28,38].
As shown in the STRING interaction network and heatmap analysis (Figure 8a,b), the proteins present in SAM samples, particularly at SAM_T2, just before unloading, exhibited an increased abundance of stress-related proteins. Hierarchical clustering revealed that SAM_T2 formed a distinct group, indicating enhanced activation of stress response systems. Among the most differentially abundant proteins, dnaK1 and groS showed statistically significant upregulation in the SAM medium (ANOVA, p-value < 0.05), as illustrated in the accompanying boxplots (Figure 8c). This suggests an adaptive response to stress conditions through protein folding and repair mechanisms.
On the other hand, the interaction network formulated using the STRING database allowed us to relate stress-related proteins with proteins from other aforementioned pathways, see Figure 9. The protein–protein interaction analysis revealed that central stress-related nodes, such as recA, were functionally connected to proteins of the TCA cycle (e.g., acnA and fumC) and fatty acid biosynthesis (e.g., fabH and fabD). This suggests an integrated stress adaptation system. Interestingly, proteins like fabH and fabZ also interacted with stress components and were upregulated during the fermentation phase with concomitant acidity increases, reinforcing a possible role in maintaining membrane stability. This has been shown in transcriptomic studies of A. pasteurianus under high-acidity conditions [33] and matches our observations, particularly in DSB and DWW media, where the final acidity exceeded 7% w/v, see Table 1.
Moreover, the interaction of acnA and fumC with other stress proteins further supports their central role in adaptation. This correlates with previous work linking TCA activation to acid detoxification and energy supply in high-acidity environments such as food beverages, including vinegar, kombucha, and kefir, among others [19,37,39,40]. Stress-related proteins, including dnaK1, groS, hsp33, and recA, were strongly upregulated in the SAM acetification profile, particularly at the end of fermentation (SAM_T2). These proteins participate in protein folding and DNA repair, indicating that SAM may induce a coordinated response in K. europaeus to heat, oxidative, and acid stress [30]. It is probable that a synthetic composition, without natural nutrients, such as the one contributed by the SAM medium to the acetification profile, also being the medium that provided the lowest acetification yields (see Table 1), can promote these multiple mechanisms of K. europaeus in the face of different types of stress. For example, several detoxification mechanisms have been previously observed in other AAB, supporting the acid tolerance phenotype of K. europaeus [12,25,30,41]. Overall, the observed connections between fatty acid biosynthesis, TCA cycle activation, and stress response reflect a tightly coordinated system that enables K. europaeus to withstand harsh fermentation conditions in the submerged culture systems typical of European vinegar making.

4. Conclusions

This study was based on the hypothesis that the composition of the fermentation substrate could significantly influence the proteomic response of Komagataeibacter europaeus, a key species in vinegar production that is particularly affected by pathways related to metabolic stress and high-acidity adaptation. Through a comparative high-throughput LC-MS/MS proteomic analysis applied to three different alcoholic media for vinegar making (SAM, DSB, and DWW) at key moments in each profile (T1 and T2), this work identified a series of functional pathways that were differentially modulated depending on the fermentation substrate. Significant differences were observed in the abundance of proteins involved in amino acid biosynthesis and lipid and fatty acid metabolism, as well as in enzymes linked to ethanol oxidation and acetic acid assimilation via both the TCA cycle and the membrane. Notably, the acetification profiles for natural raw materials, especially the DSB profile, exhibited an increased abundance of proteins associated with lipid biosynthesis and membrane-bound dehydrogenases, while the SAM profile triggered a greater abundance of stress-related proteins, DNA repair enzymes, and TCA-associated proteins. This suggests a coordinated adaptive response to high acidity and nutrient limitation. Furthermore, functional interaction analysis revealed molecular links between stress proteins and core metabolic pathways, which supports the existence of an integrated adaptation network. Biosynthetic processes, particularly those involving amino acids, were among the most significantly modulated across acetification profiles. These findings provide experimental evidence that the fermentation medium plays a central role in shaping the adaptive physiology of K. europaeus to withstand harsh fermentation conditions, which has practical implications for optimizing industrial vinegar production processes. The data also underscore the biological complexity and plasticity of K. europaeus, particularly under semi-continuous fermentation conditions that impose cyclic environmental stress, as is common in Europe. In addition to its findings, this study has certain limitations that should be acknowledged. For instance, the foaming issue observed in the DSB profile could potentially be mitigated by adjusting aeration intensity or applying antifoaming agents, although these measures were not tested here. From an industrial perspective, the comparative analysis of acetification performance and proteomic responses indicates that tailoring strategies to each substrate, such as optimizing loading regimes or supplementing limiting nutrients, may enhance process efficiency and product quality. From a future perspective, this study lays a foundation for developing biotechnological strategies to enhance the performance and robustness of acetic acid bacteria, either through adaptive strain selection or genetic engineering. Moreover, fine-tuning the chemical composition of fermentation media could enable the precise modulation of proteomic profiles, promoting favorable metabolic traits under controlled acetification gradients and contributing to more efficient and resilient bioprocesses in the vinegar industry.

Supplementary Materials

The following supporting information can be downloaded at: https://www.mdpi.com/article/10.3390/fermentation11080484/s1, Table S1. List of raw data proteins for K. europaeus identified in the LC/MS-MS analysis of vinegar samples from each medium (SAM, DWW, and DSB) and sampling time (T1 and T2), present in at least 50% of the samples. The IDs (BioCyc and Uniprot), the gene name, and the z-scored quantification value of each valid protein are included.

Author Contributions

Conceptualization, I.G.-G. and J.C.M.; methodology, D.H.-R., J.J.R.-C., and I.M.S.-D.; validation, J.J.R.-C., J.C.G.-G., and T.G.-M.; formal analysis, D.H.-R. and J.J.R.-C.; investigation, J.J.R.-C., I.M.S.-D., I.G.-G., and J.C.M.; resources, I.G.-G. and J.C.M.; data curation, D.H.-R., J.J.R.-C., J.C.G.-G., and T.G.-M.; writing—original draft preparation, D.H.-R. and J.J.R.-C.; writing—review and editing, J.C.G.-G., I.G.-G., and J.C.M.; visualization, D.H.-R.; supervision, I.G.-G. and J.C.M.; project administration, I.M.S.-D., I.G.-G., and J.C.M.; funding acquisition, I.G.-G. and J.C.M. All authors have read and agreed to the published version of the manuscript.

Funding

This research was co-funded by the Spanish Ministry of Science, Innovation, and Universities (MICIU/European Union FEDER), Ref. PID 2021-127766OB-I00 (J.C.M. and I.G.G.).

Institutional Review Board Statement

Not applicable.

Informed Consent Statement

Not applicable.

Data Availability Statement

Mass spectrometry proteomics data from Román-Camacho et al. [18] have been deposited to the ProteomeXchange Consortium via the PRIDE partner repository with the dataset identifier PXD031147.

Acknowledgments

The efficient support of the Proteomics and Bioinformatics staffs at the Central Research Support Service (SCAI) of the University of Córdoba with proteomic and bioinformatic analysis is, respectively, and gratefully acknowledged. We would like also to thank Alvear Winery and Mahou San Miguel Group, production Center of Córdoba, for supplying us the dry fine wine and dark craft beer, respectively, as well as UniCo vinegar factory for supplying us with the vinegar inoculum.

Conflicts of Interest

The authors declare no conflicts of interest.

Abbreviations

The following abbreviations are used in this manuscript:
AABAcetic Acid Bacteria
PDOProtected Designation of Origin
VBNCViable But Non-Culturable
PQQ-ADHPyrroloquinoline Quinone-Dependent Alcohol Dehydrogenase
PQQ-ALDHPyrroloquinoline Quinone-Dependent Aldehyde Dehydrogenase
NAD-ADHNicotinamide Adenine Dinucleotide-Dependent Alcohol Dehydrogenase
NAD(P)-ALDHNAD or NADP-Dependent Aldehyde Dehydrogenase
TCATricarboxylic Acid (Cycle)
LC-MS/MSLiquid Chromatography–Tandem Mass Spectrometry
SAMSynthetic Alcohol Medium
DWWDry White Wine
DSBDark Sugary Beer
UHPLCUltra-High Performance Liquid Chromatography
MS/MSTandem Mass Spectrometry
PSMPeptide Spectral Match
FDRFalse Discovery Rate
TSNTotal Sum Normalization
ANOVAAnalysis of Variance
MDAMean Decrease Accuracy
sPLS-DASparse Partial Least Squares Discriminant Analysis
PPIProtein–Protein Interaction
KEGGKyoto Encyclopedia of Genes and Genomes
GOGene Ontology

References

  1. Ali, Z.; Wang, Z.; Amir, R.M.; Younas, S.; Wali, A.; Adowa, N.; Ayim, I. Potential Uses of Vinegar as a Medicine and Related in Vivo Mechanisms. Int. J. Vitam. Nutr. Res. 2016, 86, 140–151. [Google Scholar] [CrossRef]
  2. Sengun, I.Y.; Kilic, G.; Charoenyingcharoen, P.; Yukphan, P.; Yamada, Y. Investigation of the Microbiota Associated with Traditionally Produced Fruit Vinegars with Focus on Acetic Acid Bacteria and Lactic Acid Bacteria. Food Biosci. 2022, 47, 101636. [Google Scholar] [CrossRef]
  3. Selvanathan, Y.; Masngut, N. Optimization of Process Factor and Characterization of Vinegar-like Beverage Production via Spontaneous Fermentation from Pineapple Peel Waste. LWT 2023, 182, 114818. [Google Scholar] [CrossRef]
  4. Wang, J.; Zhang, A.; Zhou, Y.; Zhang, W.; Liang, K.; Román-Camacho, J.-J.; Zhou, J.; Song, J.; Zheng, Y.; Wang, M. Identification of Aroma Active Compounds in Shanxi Aged Vinegar and Tracing the Source in the Entire Production Process. Food Chem. X 2024, 24, 101918. [Google Scholar] [CrossRef]
  5. Ríos-Reina, R.; Segura-Borrego, M.P.; Morales, M.L.; Callejón, R.M. Characterization of the Aroma Profile and Key Odorants of the Spanish PDO Wine Vinegars. Food Chem. 2020, 311, 126012. [Google Scholar] [CrossRef]
  6. Cejudo-Bastante, C.; Durán-Guerrero, E.; García-Barroso, C.; Castro-Mejías, R. Comparative Study of Submerged and Surface Culture Acetification Process for Orange Vinegar. J. Sci. Food Agric. 2018, 98, 1052–1060. [Google Scholar] [CrossRef] [PubMed]
  7. Luzón-Quintana, L.M.; Castro, R.; Durán-Guerrero, E. Biotechnological Processes in Fruit Vinegar Production. Foods 2021, 10, 945. [Google Scholar] [CrossRef]
  8. Gullo, M.; Verzelloni, E.; Canonico, M. Aerobic Submerged Fermentation by Acetic Acid Bacteria for Vinegar Production: Process and Biotechnological Aspects. Process Biochem. 2014, 49, 1571–1579. [Google Scholar] [CrossRef]
  9. Román-Camacho, J.J.; Santos-Dueñas, I.M.; García-García, I.; Moreno-García, J.; García-Martínez, T.; Mauricio, J.C. Metaproteomics of Microbiota Involved in Submerged Culture Production of Alcohol Wine Vinegar: A First Approach. Int. J. Food Microbiol. 2020, 333, 108797. [Google Scholar] [CrossRef] [PubMed]
  10. Han, D.; Yang, Y.; Guo, Z.; Chen, K.; Dai, S.; Zhu, Y.; Wang, Y.; Yu, Z.; Wang, K.; Liu, P.; et al. Metagenomics Profiling of the Microbial Community and Functional Differences in Solid-State Fermentation Vinegar Starter (Seed Pei) from Different Chinese Regions. Front. Microbiol. 2024, 15, 1389737. [Google Scholar] [CrossRef]
  11. Ruan, W.; Liu, J.; Li, P.; Zhao, W.; Zhang, A.; Liu, S.; Wang, Z.; Liu, J. Dynamics of Microbial Communities, Flavor, and Physicochemical Properties during Ziziphus jujube Vinegar Fermentation: Correlation between Microorganisms and Metabolites. Foods 2022, 11, 3334. [Google Scholar] [CrossRef]
  12. Qiu, X.; Zhang, Y.; Hong, H. Classification of Acetic Acid Bacteria and Their Acid Resistant Mechanism. AMB Express 2021, 11, 29. [Google Scholar] [CrossRef]
  13. Peng, M.-Y.; Zhang, X.-J.; Huang, T.; Zhong, X.-Z.; Chai, L.-J.; Lu, Z.-M.; Shi, J.-S.; Xu, Z.-H. Komagataeibacter europaeus Improves Community Stability and Function in Solid-State Cereal Vinegar Fermentation Ecosystem: Non-Abundant Species Plays Important Role. Food Res. Int. 2021, 150, 110815. [Google Scholar] [CrossRef] [PubMed]
  14. Wang, L.; Hong, H.; Zhang, C.; Huang, Z.; Guo, H. Transcriptome Analysis of Komagataeibacter europaeus CGMCC 20445 Responses to Different Acidity Levels During Acetic Acid Fermentation. Pol. J. Microbiol. 2021, 70, 305–313. [Google Scholar] [CrossRef]
  15. Román-Camacho, J.J.; Mauricio, J.C.; Santos-Dueñas, I.M.; García-Martínez, T.; García-García, I. Unraveling the Role of Acetic Acid Bacteria Comparing Two Acetification Profiles from Natural Raw Materials: A Quantitative Approach in Komagataeibacter europaeus. Front. Microbiol. 2022, 13, 840119. [Google Scholar] [CrossRef]
  16. Andrés-Barrao, C.; Saad, M.M.; Cabello Ferrete, E.; Bravo, D.; Chappuis, M.-L.; Ortega Pérez, R.; Junier, P.; Perret, X.; Barja, F. Metaproteomics and Ultrastructure Characterization of Komagataeibacter spp. Involved in High-Acid Spirit Vinegar Production. Food Microbiol. 2016, 55, 112–122. [Google Scholar] [CrossRef] [PubMed]
  17. He, Y.; Xie, Z.; Zhang, H.; Liebl, W.; Toyama, H.; Chen, F. Oxidative Fermentation of Acetic Acid Bacteria and Its Products. Front. Microbiol. 2022, 13, 879246. [Google Scholar] [CrossRef] [PubMed]
  18. Li, Z.; Zhao, C.; Dong, L.; Huan, Y.; Yoshimoto, M.; Zhu, Y.; Tada, I.; Wang, X.; Zhao, S.; Zhang, F.; et al. Comprehensive Metabolomic Comparison of Five Cereal Vinegars Using Non-Targeted and Chemical Isotope Labeling LC-MS Analysis. Metabolites 2022, 12, 427. [Google Scholar] [CrossRef]
  19. Yu, X.; Gu, C.; Guo, X.; Guo, R.; Zhu, L.; Qiu, X.; Chai, J.; Liu, F.; Feng, Z. Dynamic Changes of Microbiota and Metabolite of Traditional Hainan Dregs Vinegar during Fermentation Based on Metagenomics and Metabolomics. Food Chem. 2024, 444, 138641. [Google Scholar] [CrossRef]
  20. Lin, B.; Tang, J.; Yang, Q.; Su, Z.; Zhu, L.; Li, Q.; Jiang, W.; Zhang, L.; Liu, Y.; Chen, S. Microbial Succession and Its Effect on Key Aroma Components during Light-Aroma-Type Xiaoqu Baijiu Brewing Process. World J. Microbiol. Biotechnol. 2022, 38, 166. [Google Scholar] [CrossRef]
  21. Adler, P.; Frey, L.J.; Berger, A.; Bolten, C.J.; Hansen, C.E.; Wittmann, C. The Key to Acetate: Metabolic Fluxes of Acetic Acid Bacteria under Cocoa Pulp Fermentation-Simulating Conditions. Appl. Environ. Microbiol. 2014, 80, 4702–4716. [Google Scholar] [CrossRef] [PubMed]
  22. Román-Camacho, J.; Mauricio, J.; Sánchez-León, I.; Santos-Dueñas, I.; Fuentes-Almagro, C.; Amil-Ruiz, F.; García-Martínez, T.; García-García, I. Implementation of a Novel Method for Processing Proteins from Acetic Acid Bacteria via Liquid Chromatography Coupled with Tandem Mass Spectrometry. Molecules 2024, 29, 2548. [Google Scholar] [CrossRef]
  23. El Vinagre de Vino; Llaguno Marchena, C., Polo, M.C., Eds.; Consejo Superior de Investigaciones Científicas: Madrid, Spain, 1991; ISBN 978-84-00-07205-6. [Google Scholar]
  24. Román-Camacho, J.J.; Santos-Dueñas, I.M.; García-García, I.; García-Martínez, T.; Peinado, R.A.; Mauricio, J.C. Correlating Microbial Dynamics with Key Metabolomic Profiles in Three Submerged Culture-Produced Vinegars. Foods 2025, 14, 56. [Google Scholar] [CrossRef]
  25. Román-Camacho, J.J.; Mauricio, J.C.; Santos-Dueñas, I.M.; García-Martínez, T.; García-García, I. Recent Advances in Applying Omic Technologies for Studying Acetic Acid Bacteria in Industrial Vinegar Production: A Comprehensive Review. Biotechnol. J. 2024, 19, 2300566. [Google Scholar] [CrossRef]
  26. Devanthéry, T.; Nakamura, K.; Hashiguchi, S.; Hashimoto, M. Structure of a Heptose-Containing Polysaccharide Derived from Komagataeibacter Europaeus NBRC 3261. Carbohydr. Res. 2020, 492, 107989. [Google Scholar] [CrossRef]
  27. Trček, J.; Mira, N.P.; Jarboe, L.R. Adaptation and Tolerance of Bacteria against Acetic Acid. Appl. Microbiol. Biotechnol. 2015, 99, 6215–6229. [Google Scholar] [CrossRef]
  28. Nakano, S.; Ebisuya, H. Physiology of Acetobacter and Komagataeibacter spp.: Acetic Acid Resistance Mechanism in Acetic Acid Fermentation. In Acetic Acid Bacteria; Matsushita, K., Toyama, H., Tonouchi, N., Okamoto-Kainuma, A., Eds.; Springer: Tokyo, Japan, 2016; pp. 223–234. ISBN 978-4-431-55931-3. [Google Scholar]
  29. Okamoto-Kainuma, A.; Ishikawa, M. Physiology of Acetobacter spp.: Involvement of Molecular Chaperones During Acetic Acid Fermentation. In Acetic Acid Bacteria; Matsushita, K., Toyama, H., Tonouchi, N., Okamoto-Kainuma, A., Eds.; Springer: Tokyo, Japan, 2016; pp. 179–199. ISBN 978-4-431-55931-3. [Google Scholar]
  30. Xu, J.; Guo, L.; Zhao, N.; Meng, X.; Zhang, J.; Wang, T.; Wei, X.; Fan, M. Response Mechanisms to Acid Stress of Acid-Resistant Bacteria and Biotechnological Applications in the Food Industry. Crit. Rev. Biotechnol. 2023, 43, 258–274. [Google Scholar] [CrossRef] [PubMed]
  31. Yin, H.; Zhang, R.; Xia, M.; Bai, X.; Mou, J.; Zheng, Y.; Wang, M. Effect of Aspartic Acid and Glutamate on Metabolism and Acid Stress Resistance of Acetobacter pasteurianus. Microb. Cell Fact. 2017, 16, 109. [Google Scholar] [CrossRef] [PubMed]
  32. Sankuan, X.; Cuimei, Z.; Bingqian, F.; Yu, Z.; Menglei, X.; Linna, T.; Jia, S.; Xinyi, Z.; Min, W. Metabolic Network of Ammonium in Cereal Vinegar Solid-State Fermentation and Its Response to Acid Stress. Food Microbiol. 2021, 95, 103684. [Google Scholar] [CrossRef]
  33. Xia, K.; Han, C.; Xu, J.; Liang, X. Transcriptome Response of Acetobacter pasteurianus Ab3 to High Acetic Acid Stress during Vinegar Production. Appl. Microbiol. Biotechnol. 2020, 104, 10585–10599. [Google Scholar] [CrossRef]
  34. Li, Y.; Yan, P.; Lei, Q.; Li, B.; Sun, Y.; Li, S.; Lei, H.; Xie, N. Metabolic Adaptability Shifts of Cell Membrane Fatty Acids of Komagataeibacter hansenii HDM1-3 Improve Acid Stress Resistance and Survival in Acidic Environments. J. Ind. Microbiol. Biotechnol. 2019, 46, 1491–1503. [Google Scholar] [CrossRef]
  35. Sriherfyna, F.H.; Matsutani, M.; Hirano, K.; Koike, H.; Kataoka, N.; Yamashita, T.; Nakamaru-Ogiso, E.; Matsushita, K.; Yakushi, T. The Auxiliary NADH Dehydrogenase Plays a Crucial Role in Redox Homeostasis of Nicotinamide Cofactors in the Absence of the Periplasmic Oxidation System in Gluconobacter oxydans NBRC3293. Appl. Environ. Microbiol. 2021, 87, e02155-20. [Google Scholar] [CrossRef] [PubMed]
  36. Song, J.; Wang, J.; Wang, X.; Zhao, H.; Hu, T.; Feng, Z.; Lei, Z.; Li, W.; Zheng, Y.; Wang, M. Improving the Acetic Acid Fermentation of Acetobacter pasteurianus by Enhancing the Energy Metabolism. Front. Bioeng. Biotechnol. 2022, 10, 815614. [Google Scholar] [CrossRef] [PubMed]
  37. Yassunaka Hata, N.N.; Surek, M.; Sartori, D.; Vassoler Serrato, R.; Aparecida Spinosa, W. Role of Acetic Acid Bacteria in Food and Beverages. Food Technol. Biotechnol. 2023, 61, 85–103. [Google Scholar] [CrossRef] [PubMed]
  38. Zheng, Y.; Chen, X.; Wang, J.; Yin, H.; Wang, L.; Wang, M. Expression of Gene uvrA from Acetobacter pasteurianus and Its Tolerance to Acetic Acid in Escherichia coli. In Advanced Applications in Biotechnolog; Zhang, T.-C., Nakajima, M., Eds.; Springer: Berlin, Heidelberg, 2015; pp. 163–169. [Google Scholar]
  39. Wang, B.; Rutherfurd-Markwick, K.; Zhang, X.-X.; Mutukumira, A.N. Isolation and Characterisation of Dominant Acetic Acid Bacteria and Yeast Isolated from Kombucha Samples at Point of Sale in New Zealand. Curr. Res. Food Sci. 2022, 5, 835–844. [Google Scholar] [CrossRef]
  40. Izquierdo-González, J.J.; Amil-Ruiz, F.; Zazzu, S.; Sánchez-Lucas, R.; Fuentes-Almagro, C.A.; Rodríguez-Ortega, M.J. Proteomic Analysis of Goat Milk Kefir: Profiling the Fermentation-Time Dependent Protein Digestion and Identification of Potential Peptides with Biological Activity. Food Chem. 2019, 295, 456–465. [Google Scholar] [CrossRef]
  41. Werner, N.; Petersen, K.; Vollstedt, C.; Garcia, P.P.; Chow, J.; Ferrer, M.; Fernandez-Lopez, L.; Falke, S.; Perbandt, M.; Hinrichs, W.; et al. The Komagataeibacter europaeus GqqA Is the Prototype of a Novel Bifunctional N-Acyl-Homoserine Lactone Acylase with Prephenate Dehydratase Activity. Sci. Rep. 2021, 11, 12255. [Google Scholar] [CrossRef]
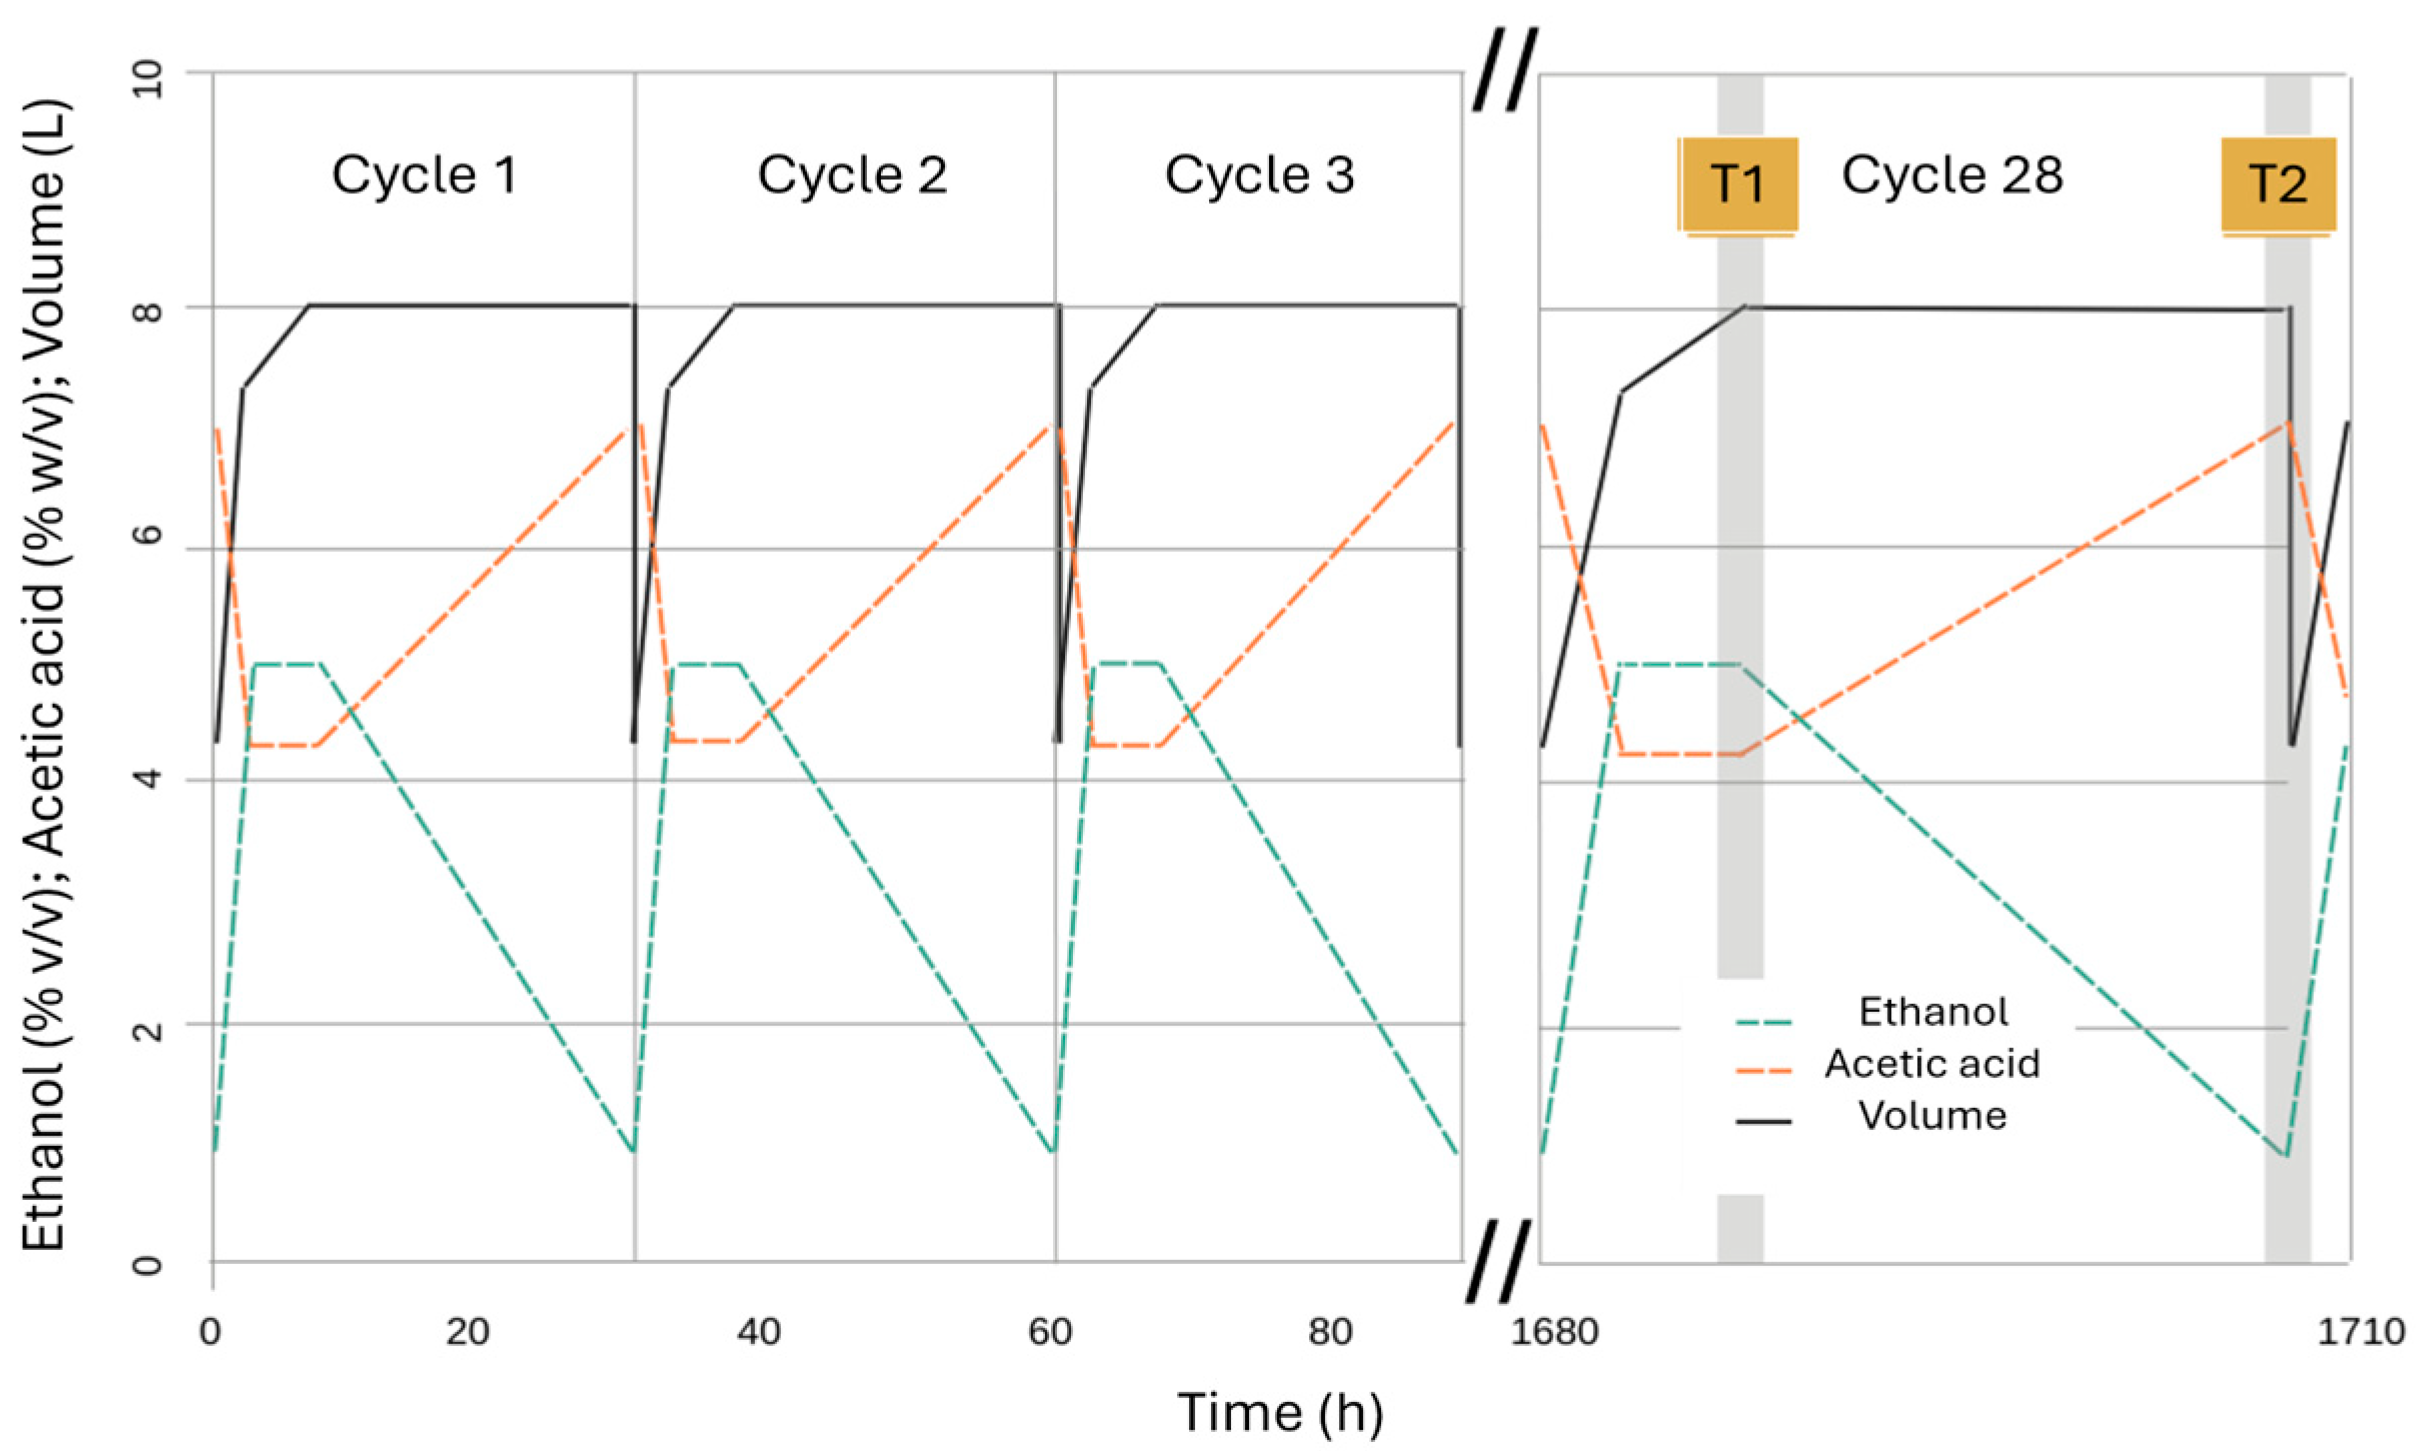
Figure 1. A schematic representation of the typical acetification profile for vinegar production in semi-continuous mode. In this case, the SAM acetification profile is shown with up to 28 stable and robust cycles. T1: sampling at the end of the loading phase. T2: sampling just before unloading.
Fermentation 11 00484 g001
Figure 2. KEGG enrichment analysis of differential pathways (ANOVA p-value (FDR) < 0.05) among significantly abundant proteins and common in all three acetification profiles (SAM, DSB, DWW).
Fermentation 11 00484 g002
Figure 3. (a) sPLS-DA score plot showing separation among samples according to fermentation substrate. (b) Top-ranked proteins identified by sPLS-DA, ranked by their loadings on the first component according to the sparsity criterion (10 variables per component). (ce) Volcano plots of differentially abundant proteins between DSB vs. DWW (c), DWW vs. SAM (d), and DSB vs. SAM (e). Colored dots represent proteins with statistically significant differences (FDR < 0.05) based on log2 fold-change and adjusted p-value thresholds. Synthetic alcohol medium (SAM); dark sugar craft beer (DSB); dry white wine (DWW).
Fermentation 11 00484 g003
Figure 4. Heatmap of the z-score-normalized abundance of amino acid biosynthesis-related proteins throughout fermentation profiles and sampling times. Synthetic alcohol medium (SAM); dark sugar craft beer (DSB); dry white wine (DWW); end of loading phase (SAM_T1, DSB_T1; DWW_T1); just before unloading phase (SAM_T2, DSB_T2; DWW_T2).
Fermentation 11 00484 g004
Figure 5. Abundance of protein profiles of lipid and fatty acid biosynthesis. (a) Boxplots indicate significant abundance differences in fabF, fabI, and hpnD. (b) Heatmap of the z-score-normalized abundance of proteins throughout fermentation profiles and sampling times. Synthetic alcohol medium (SAM); dark sugar craft beer (DSB); dry white wine (DWW); end of loading phase (SAM_T1, DSB_T1; DWW_T1); just before unloading phase (SAM_T2, DSB_T2; DWW_T2).
Fermentation 11 00484 g005
Figure 6. (a) STRING interaction network with relative abundance profiles of proteins related to acetic acid assimilation and the TCA cycle. (b) Heatmap of z-score-normalized abundance. (c) Boxplots of lpd3 and fumC throughout acetification profiles. Synthetic alcohol medium (SAM); dark sugar craft beer (DSB); dry white wine (DWW); end of loading phase (SAM_T1, DSB_T1; DWW_T1); just before unloading phase (SAM_T2, DSB_T2; DWW_T2).
Fermentation 11 00484 g006
Figure 7. Abundance profiles of proteins involved in ethanol oxidation to acetic acid. (a) PQQ-ADH and PQQ-ALDH in the periplasm. (b) NAD-ADH and NADP-ALDH in the cytoplasm. Bar plots show z-score-normalized protein abundance of the three fermentation profiles and sampling phases. Synthetic alcohol medium (SAM); dark sugar craft beer (DSB); dry white wine (DWW); end of loading phase (SAM_T1, DSB_T1; DWW_T1); just before unloading phase (SAM_T2, DSB_T2; DWW_T2).
Fermentation 11 00484 g007
Figure 8. (a) STRING interaction network with relative abundance profiles of stress-related proteins. (b) Heatmap of z-score-normalized protein abundance. (c) Boxplots of groS and dnaK1 throughout the three acetification profiles. Synthetic alcohol medium (SAM); dark sugar craft beer (DSB); dry white wine (DWW); end of loading phase (SAM_T1, DSB_T1; DWW_T1); just before unloading phase (SAM_T2, DSB_T2; DWW_T2).
Fermentation 11 00484 g008
Figure 9. STRING interaction network of the proteome of K. europaeus with MCL clustering (inflation parameter = 2), showing links between proteins involved in fatty acid biosynthesis, TCA cycle, and stress response.
Fermentation 11 00484 g009
Table 1. Main system variables of the three acetification profiles (SAM, DSB, DWW). Data show the average values at the sampling times and their standard deviation (SD). Variables employed to obtain the acetification efficiency of each profile (rA and pA) are also detailed. Synthetic alcohol medium (SAM); dark sugar craft beer (DSB); dry white wine (DWW); substrates (SAM_T0, DSB_T0; DWW_T0); end of loading phase (SAM_T1, DSB_T1; DWW_T1); just before unloading phase (SAM_T2, DSB_T2; DWW_T2).
Variable (Mean ± SD)SAM_T0SAM_T1SAM_T2DSB_T0DSB_T1DSB_T2DWW_T0DWW_T1DWW_T2
Cycle time (h)8.8 ± 2.828.9 ± 2.62.8 ± 0.424.3 ± 1.13.0 ± 0.121.4 ± 0.1
Volume (L)8.0 ± 0.18.0 ± 0.17.0 ± 0.27.0 ± 0.28.0 ± 0.18.0 ± 0.1
Ethanol (% v/v)10.0 ± 0.35.0 ± 0.11.1 ± 0.29.5 ± 0.34.7 ± 0.21.2 ± 0.19.8 ± 0.34.9 ± 0.11.3 ± 0.3
Total acidity (% w/v)0.1 ± 0.14.5 ± 0.2 7.2 ± 0.10.2 ± 0.14.2 ± 0.46.8 ± 0.70.2 ± 0.14.3 ± 0.17.9 ± 0.2
Viable cell (108 cell/mL)1.69 ± 0.342.30 ± 0.290.84 ± 0.701.05 ± 0.701.43 ± 0.331.47 ± 0.28
SAM DSB DWW
Mean acetification rate (rA) [g acetic acid/(L h)] 1.3 ± 0.1 1.6 ± 0.1 1.9 ± 0.1
Global acidity production (pA) (g acetic acid/h) 10.2 ± 1.0 11.3 ± 0.5 15.2 ± 0.5
Table 2. List of proteins identified in the proteome of K. europaeus related to amino acid metabolism. The genes that synthesize each protein, as well as the amino acid associated with each one of them, are included.
GeneProteinAmino Acid
Lpd3Dihydrolipoamide dehydrogenaseGlycine
LeuA2-isopropyl-malate synthaseL-leucine
MetxAHomoserine o-acetyltransferaseL-methionine
ProAGamma-glutamyl phosphate reductaseL-proline
HisCHistidinol-phosphate aminotransferaseL-histidine
GcvHH-protein glycine cleavage systemGlycine
HisBImidazole glycerol-phosphate dehydrataseL-histidine
ThrCThreonine synthaseL-threonine
Disclaimer/Publisher’s Note: The statements, opinions and data contained in all publications are solely those of the individual author(s) and contributor(s) and not of MDPI and/or the editor(s). MDPI and/or the editor(s) disclaim responsibility for any injury to people or property resulting from any ideas, methods, instructions or products referred to in the content.