Abstract
This study investigated the feasibility of using both the solid and the liquid fractions of waste from the anaerobic digestion process—the digestate—as a possible liquid growth medium for fungal production of chitosan. An enriched liquid phase (ELP), combining both fractions, and derived from mild acid hydrolysis treatment at 120 °C with 6% H2SO4 (w/v) for 70 min, was screened for its ability to support biomass and chitosan production by 17 fungal strains. The best results were obtained with Absidia blakesleeana NRRL 2696 and Rhizopus oryzae NRRL 1510 cultures, which yielded chitosan volumetric productions of 444 and 324 mg L−1, respectively. The chitosan preparations of the former and the latter strain, characterized by infrared spectroscopy, elemental analysis, viscosimetry and thermogravimetric analysis, showed deacetylation degrees of 79% and 84.2%, respectively, and average viscosimetric molecular weights of around 20 and 5.4 kDa, respectively. Moreover, both fungal chitosan samples exerted significant antibacterial activity towards Gram-negative (i.e., Pseudomonas syringae and Escherichia coli) and Gram-positive (i.e., Bacillus subtilis) species.
1. Introduction
Chitin is a major constituent of crustacean shells and an abundant component of the exoskeletons of insects and mollusks. For several decades, the production of chitin and its deacetylated counterpart, chitosan, relied on the extraction of crab and shrimp, and shell wastes, where chitin amounts ranged from 14 to 27% and 13 to 15%, respectively. However, the extraction process from these sources involved harsh chemical treatments because of the presence of proteins, lipids, and inorganic salts in the crustacean shell wastes [1].
However, chitin and chitosan are also found in significant amounts in the cell walls of various fungal classes [2]. This discovery has led to extensive research on producing these polymers through fungal bioprocesses. Several technical factors make the fungal production route an attractive alternative to conventional extraction from shellfish residues [2,3]. Firstly, the demineralization step is unnecessary during processing, as the crude chitin from fungal sources has significantly lower ash levels than crustacean shells [4]. In addition to providing a year-round source of chitin and chitosan, fungal bioprocesses can be accurately controlled, potentially ensuring consistent product characteristics [2,3,5]. In contrast to chitosan derived from crustaceans, fungal chitosans do not contain protein residues that can trigger allergic reactions in sensitive individuals [2,5].
Hence, recent research is now concentrating on fungal biotechnology, relying on strains capable of accumulating chitosan directly in their cell walls. This approach is due to the superior quality of chitin and chitosan found in the fungal cell wall and the lower environmental impact of extracting them from fungal sources compared to crustacean waste [4,6]. The strains that meet this requirement belong to the Zygomycota division and have a high percentage of chitin and chitosan in their cell walls. For this reason, they are very promising sources for producing chitosan [3,6,7].
The economics of chitosan production using inexpensive raw materials can make industrial microbial processes competitive with chemical ones. For this reason, studies on using alternative, low-cost carbon sources making the fungal chitosan production process highly sustainable are particularly relevant in this area. Several studies have reported the successful production of chitosan in liquid cultures using various waste materials. Examples include apple pomace [8], corn steep liquor [9], cassava wastewater [10] and paper-mill wastewater [11].
The waste derived from anaerobic conversion processes—the digestate—represents a promising source of nutrients to derive a fungal growth medium [12]. The composition and quality of this by-product depend strongly on the raw materials used and the treatment conditions applied [13]. The digestate derived from the anaerobic conversion of wastes from the agricultural or agro-industrial sector can represent an excellent source of carbohydrates due to the significant content of residual fibers [12].
The present study aimed to derive a digestate-based liquid growth medium and to assess its adequacy for microbial chitosan production. To this end, a digestate from an anaerobic process, fed with a mixture of olive pomace and silage as the input flow, underwent various chemical pretreatments to yield a sugar-enriched liquid phase. The medium thus obtained was tested for its ability to support both growth and chitosan production of 17 fungal strains, most of which belong to well-known chitosan-producing species. The workflow of the study is summarized in Figure 1, detailing our experimental approach. To the best of our knowledge, this is the first study reporting the use of a digestate-based liquid medium for fungal chitosan production.
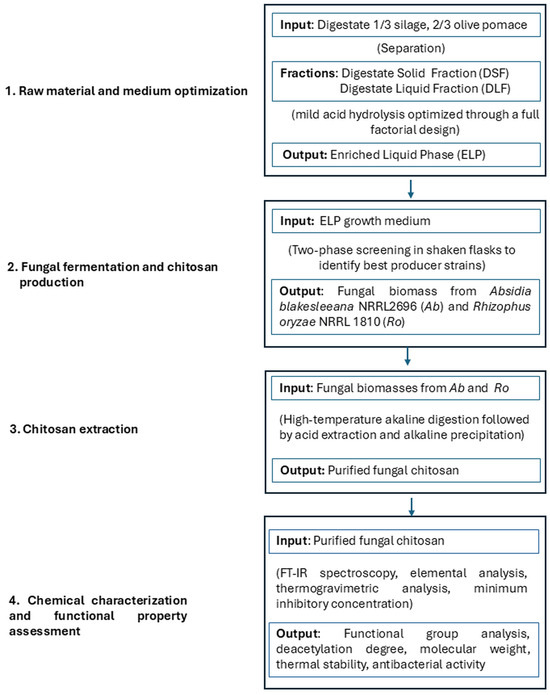
Figure 1.
Overview of the experimental process for producing microbial chitosan from anaerobic digestate.
2. Materials and Methods
2.1. Materials
The digestate was taken from a biogas plant located in the province of Perugia and derived from an anaerobic process fed 1/3 by silage (of which 50% corn, 25% barley, 25% sorghum) and 2/3 by olive pomace. At the end of the chain, the waste was also subjected to a liquid/solid separation leading to a solid fraction, from here onwards referred to as digestate solid fraction (DSF), and a liquid one, referred to as digestate liquid fraction (DLF). Both fractions underwent a preliminary characterization to determine the possibility of using DLF as the extractant for DSF, thus obtaining an extract called enriched liquid phase (ELP). Before use, the DSF was dried at 50 °C in an oven up to constant weight and underwent grinding on a Cyclotec 1093 mill (PBI Instruments, Milan, Italy) endowed with a 1 mm sieve to make its granulometry uniform. DLF, instead, was centrifuged (6000× g, 15 min), filtered under vacuum through Whatman paper n. 1 (porosity, 11 µm) and, finally, stored at −20 °C until use.
Chemical analyses of DSF were performed as described elsewhere [14] and the most relevant parameters, expressed in g kg−1, were: total sugars, 650 ± 30; reducing sugars, 9.2 ± 0.4; crude lipids, 19.3 ± 2.7; phenols, 15.3 ± 2.4; hemicellulose, 172 ± 15; cellulose, 393 ± 24; lignin, 257 ± 14.; ash, 82 ± 4; total nitrogen, 19.8 ± 1.1; total carbon, 415 ± 8; hydrogen, 59.4 ± 2.1; sulfur, 2.2 ± 0.1. The DLF contained the following parameters (g L−1): total sugars, 0.72 ± 0.02; reducing sugars, 0.36 ± 0.01; protein, 0.82 ± 0.22; N-NH4, 1.09 ± 0.01; total amino acids, 0.57 ± 0.024; phenols, 0.76 ± 0.03; potassium, 1.2; and assimilable phosphorus, 0.35. Low-molecular-weight commercial chitosan from Fluka BioChemika was purchased from Sigma-Aldrich-Fluka (Milan, Italy).
2.2. Medium Development from Digestate Fractions
As a first approach to developing a culture medium from the DSF and DLF components, we conducted a series of experiments, designed to verify the possibility of using solid–liquid extraction alone or assisted by hydrolysis under mild alkaline or acid conditions. DLF was used as the liquid extractant of the DSF. The experiments were conducted by varying the solid–liquid ratios (1:10, 1:15 and 1:20, w/v) and temperatures (60, 75, 90, and 120 °C) at a fixed extraction time (60 min). In the case of acid- or alkali-assisted extractions, sulfuric acid or sodium hydroxide was added to the DLF extractant to yield a concentration equal to 6% (w/v), and incubations were performed at 120 °C. The outcome of the experiments was determined by the concentrations of total sugars, reducing sugars, pentoses, ammonium nitrogen, protein and free amino acids in the enriched liquid phase (ELP) arising from the sole solid–liquid extraction or acid- or alkali-assisted extraction. Our thorough data analysis included the volumetric concentration of the component x in the ELP, and the recovery yield percentage (RY%) for each component xi, calculated by Equation (1):
where Cx(DLF) is the initial concentration of component x in the digestate liquid extractant, Cx(ELP) is concentration of component x in the ELP after extraction and Cx(TE) is the theoretical concentration of component x in the ELP assuming quantitative extraction at that given solid–liquid ratio.
In the second phase, experiments based on the statistical approach of the response surface methodology were designed to derive an ELP from DSF. Due to the inefficacy of solid/liquid extraction and alkali-assisted extraction approaches, attention was focused on acid-assisted extraction. In particular, the experiment was a full factorial design that recruited two variables at three levels, namely H2SO4 concentration (2, 6 and 10%, w/v) and extraction time (30, 60 and 120 min). Consequently, the number of runs was 9, each replicated twice, plus three center points. The actual values of the variables were coded as dimensionless terms using Equation (2):
where Xi is the coded value and Ai the actual value of the variable, Ao the actual value of the same variable at the center point, ΔA the mid-range value of the variable. Data were subjected to the analysis of variance (ANOVA) and fitted according to a second order polynomial model shown by Equation (3):
where Y is the predicted response variable, βo is the intercept, βi and βii linear and quadratic coefficients, respectively, βij is the interaction coefficient and Xi and Xj are the coded forms of the input variables. Statistical examination of results and generation of response surfaces were carried out by the statistical software package Modde 9.1 (Umetrics AB, Umeå, Sweden). Analysis of variance (ANOVA) allowed us to calculate the model’s Fisher–Snedecor coefficient (FMOD), verify the significance of each model term, and determine the model’s lack of fit (LOF). The p-value associated with the ratio of the mean squares of the model error to the replicate error (FME) allowed us to determine whether the LOF was significant or not.
2.3. Microorganisms
Except for an environmental strain (DIBAF-E) isolated from an Arsenic-contaminated soil and identified as Mucor moelleri (Accession number KY678773), all the fungal strains used in the present study were obtained from the Culture Collection of the North Regional Research Laboratory (NRRL, Peoria, IL, USA). The strains used, listed in alphabetical order, were: Absidia blakesleeana NRRL 1304 and NRRL 2696; Absidia coerulea NRRL 1312, NRRL 1315 and NRRL A-9483; Absidia corymbifera NRRL 2798; Absidia glauca NRRL 1324, NRLL 2799 and NRRL 3010; Absidia repens NRRL 1337; Aspergillus tubingensis NRRL 4700; Benjaminiella poitrasii NRRL 2845; Cunninghamella elegans NRRL 1392; Mucor rouxii NRRL 1894; Rhizopus oryzae NRRL 1510 and NRRL 2625. Stock cultures were maintained on Potato Dextrose Agar (PDA) (Difco, Detroit, MI, USA) at 4 °C and subcultured every month.
2.4. Shaken Culture Experiments
Ten-day-old malt extract agar (Oxoid, Basingstoke, UK) cultures on Petri dishes were suspended in sterile deionized water (5.0 mL) and used as the inoculum for pre-cultures to obtain an initial spore concentration of 1 × 10⁶ mL−1. Incubations were carried out at 28 °C for 72 h under orbital shaking at 160 rev min−1 in 250 mL Erlenmeyer flasks containing 50 mL of Malt Extract Broth (Difco, Detroit, USA).
2.4.1. Strains Screening for Biomass Producing Capability on ELP Medium
Pre-cultures (5.0 mL) of all the fungal strains were used to inoculate 250 mL Erlenmeyer flasks containing 50 mL of ELP medium, which were incubated at 28 °C for 96 h on a rotary shaker (160 rev min−1). Culture samples were withdrawn at the end of the incubation (96 h). Fungal biomass concentration was determined gravimetrically: culture samples underwent filtration through pre-weighed Whatman GF/C discs (diameter, 47 mm), the harvested biomasses were washed twice with distilled water, lyophilized and then weighed. All cultures were performed in duplicate.
2.4.2. Growth and Chitosan Production Kinetics on ELP Medium
Pre-cultures (10.0 mL) of only those fungal strains that had exhibited good growth capacity on the ELP medium were used to inoculate 500 mL Erlenmeyer flasks containing 100 mL of ELP medium, which were incubated at 28 °C for 96 h on a rotary shaker (160 rev min−1). Sacrificial flasks were withdrawn every 32 h. Fungal biomass concentration was determined gravimetrically before chemical analyses and chitosan extraction. The filtrate was stored at −20 °C until use. All cultures were performed in triplicate.
2.5. Analytical Methods
2.5.1. ELP Medium Characterization
The enriched liquid phase (ELP) was characterized by determining several parameters. Total sugars were determined by the method of Dubois et al. [15], and reducing sugars by the dinitrosalicylic acid method [16]. Pentose sugars were determined by the p-bromoaniline-thiourea method [17]. Ammonium nitrogen, total amino acids and soluble protein were determined by the methods of Jüttnerer [18], Bradford [19] and Sun et al. [20], respectively. Total phenols were determined by the procedure of Ainsworth and Gillespie [21].
2.5.2. Chitosan Extraction
To extract chitosan, a slight modification of the procedure described by Rane and Hoover [22] was used. This procedure relies on high-temperature alkaline digestion to break down non-chitosan cell wall components (e.g., proteins, glucans and lipids) and solubilize them, leaving alkali-insoluble chitosan and other insoluble structural polysaccharides in the solid residue. The chitosan in the alkali-insoluble material (AIM) is extracted with a dilute aqueous acid solution since, due to its polycationic nature (amino groups), it is soluble under these conditions, while most other cell wall components are not. The chitosan in the separated acid-soluble fraction is then recovered through alkaline precipitation. Sodium borohydride (NaBH4) was added to the biomass in the first extraction step, since it is a mild reducing agent used to prevent unwanted chemical modifications, specifically alkaline-induced deamination of chitosan. Finely ground dry mycelial biomass (200–500 mg) was transferred to centrifuge tubes, to which was added NaBH4 (5.0 mg) and NaOH 1.0 M (4.0 mL), then autoclaved (30 min at 121 °C). After cooling, the cell suspension was centrifuged (12,000× g, 30 min) and the pellet washed sequentially with deionized water, absolute ethanol and deionized water again. Each washing was followed by centrifugation under the same conditions and subsequent pellet recovery. After the last wash, the pellet was lyophilized, thus yielding the AIM and finally weighed. The AIM was extracted with 4.0% acetic acid solution in water at 95 °C for 4 h and then centrifuged at 12,000× g for 15 min. The pellet thus obtained was extracted and centrifuged again as above. The two supernatants were pooled, and the solubilized chitosan precipitated by adding NaOH 2.0 M to reach pH 10.0. Chitosan was then recovered by centrifugation (12,000× g, 15 min) and the pellet subsequently washed with absolute ethanol and then with deionized water. Each washing step was followed by centrifugation as above and subsequent pellet recovery. At the end of the washing procedure, the pellet was lyophilized and the weight was determined.
2.5.3. Determination of Minimum Inhibitory Concentration of Fungal Chitosan
The minimum inhibitory concentration (MIC) of fungal chitosan was determined using the microdilution method (CLSI 2012 [23]) in 96-well polystyrene microplates (Greiner Bio-OneTM CELLSTAR, Cassina de Pecchi, Italy). Chitosan obtained from the previous tests was dissolved in a 1% acetic acid aqueous solution to obtain a concentration of 1 mg mL−1, adjusting the pH to about 5.5 with NaOH, and subsequently subjecting the solution to microfiltration (diameter, 0.45 µm). Low-molecular-weight chitosan (Fluka BioChemika, Milan, Italy) solution was also analyzed at the same concentration as that of the samples. The solutions were diluted in Mueller Hinton Broth (MHB, Oxoid, Garbagnate Milanese, Italy) and 100 µL of each dilution was dispensed into each well. The inoculum was adjusted to obtain a density of 5 × 10⁵ CFU mL−1 in each well. The plates were incubated at 28 °C for 24 h. The absorbance was measured at 595 nm using a microplate reader (DTX 880 Multimode detector, Beckman Coulter, IN, USA). The MIC was also determined visually by adding 10 µL of an aqueous solution of TTC (2,3,5-triphenyl tetrazolium chloride) (2 g L−1) to each well and incubating for 30 min. TTC in its oxidized form is colorless; however, when introduced to a medium containing metabolically active microorganisms, it is reduced by cellular dehydrogenases to form intensely colored, insoluble formazan compounds (e.g., red formazan with TTC). The production of this colored compound is directly proportional to the amount of viable (metabolically active) bacteria. The lowest concentration at which no bacterial growth is observed was taken as the MIC value. The test bacteria used were Pseudomonas syringae DSM 21482 (Gram-negative), Escherichia coli ATCC 9637 (Gram-negative) and Bacillus subtilis DSM 10 (Gram-positive).
2.5.4. Fourier Transform Infrared (FT-IR) Spectroscopy, Elemental Analysis and Thermogravimetric Analysis (TGA) of Chitosan Samples
FT-IR spectra of the chitosan powder were recorded in transmission mode, using a Jasco FT-IR 615 spectrometer (Tokyo, Japan). The samples were measured using a KBr-pellet method in the 400–4000 cm−1 wavenumber range, with a resolution of 4 cm−1. The spectra thus obtained were compared with those of commercial chitosan (Fluka, Buchs, Switzerland). FT-IR was performed to evaluate the functional groups of samples and the degree of deacetylation (DD%). For this purpose, among different calculation options based on various absorbance ratios between different spectral bands, the A1320/A1420 ratio was used which, in a study conducted by Brugnerotto et al. [24], was shown to provide the smallest deviation between expected and estimated values. In particular, the first band (1320 cm−1) was characteristic of an acetylated amine or an amide function, while the second band (1420 cm−1), relating to the C-H bending signal, was chosen as the reference band. DD% was calculated using Equation (4):
The Vario MacroCube elemental analyzer for solids (Elementar GmbH, Langelselbold, Germany) enabled the determination of the percentage contents in carbon, hydrogen, nitrogen and sulfur in the purified chitosan samples, and the calibration of the measurements relied on sulfonamide, used as the standard. The degree of deacetylation (DD%), based on C/N ratios, was calculated according to Equation (5) [25]:
Thermogravimetric analysis (TGA) of the samples was performed using a Seiko Exstar 6300 system (TA Instruments, Tokyo, Japan). The sample powders (ca. 10 mg) were placed in an open platinum pan and heated from 30 to 500 °C at the rate of 10 °C min−1 under dynamic nitrogen atmosphere (250 mL min−1). The mass loss (TG) and the derivative mass loss (DTG) curves were calculated.
2.5.5. Intrinsic Viscosity and Average Molecular Mass Determination
The viscosity of chitosan was measured using Lovis 2000 M/ME microviscometer (Anton Paar Italia S.r.l., Rivoli, Italy) with a glass capillary with a diameter of 1.59 mm, a steel ball with a diameter of 1.50 mm, at 25 °C and an inclination of 30°. Stock chitosan solutions (1.0 mg mL−1) were prepared in 1.0% aqueous acetic acid solution and filtered through a 0.45 µm membrane. The intrinsic viscosity [η] of each fungal chitosan was calculated graphically by extrapolating to zero the curve of reduced viscosity versus polymer concentration. The molar mass was calculated using the Mark–Houwink–Sakurada equation:
where
is the intrinsic viscosity, K and a are constants describing the polymer–solvent combination at the given temperature and Mv the viscosimetric average molecular weight. The values of the former and the latter constant for chitosan in 1% acetic acid solution at 25 °C were 0.0474 mL g−1 and 0.723, respectively [26].
3. Results and Discussion
3.1. Production of Growth Medium from Digestate Fractions
The objective of the first set of experiments was to evaluate the effectiveness of a simple solid–liquid extraction compared to an acid- or alkali-assisted extraction, under mild conditions, for obtaining a carbohydrate-enriched liquid fraction. Since DLF contains significant levels of potassium and phosphorus but low concentrations of organic components, we used it as the liquid extractant for the DSF. Table 1 summarizes the results comparing the concentrations and recovery yields of total and reducing sugars in the ELP. Aqueous extraction was ineffective for total sugars: even though higher temperatures increased recovery yields, the values remained below 5.5%, resulting in low TS concentrations in the ELP. The recovery yields of aqueous extractions towards reducing sugars also increased with temperature, leading to values that generally exceeded 100%, presumably due to the contribution of reducing ends of extracted oligosaccharides. However, because DSF contains intrinsically low levels of reducing sugars, their concentrations in the ELP remained unsatisfactory. Even mild alkali extraction gave rise to limited recovery yields of TS and reducing sugars; in fact, although alkaline extraction at 120 °C for 60 min significantly increased TS recovery yield as compared to the best aqueous extraction condition (8.2 vs. 4.5%), the volumetric concentrations of total sugars and reducing sugars (6.0 ± 0.3 and 2.6 ± 0.1 g L−1, respectively) were deemed inadequate to support substantial fungal growth. Conversely, acid-assisted extraction at 120 °C yielded a TS recovery of 36.1%, resulting in a volumetric concentration of 24.1 ± 1.3 g L−1. As for reducing sugars, their recovery yield under the same conditions was around 24 times higher than theoretical value, presumably due to acid-catalyzed hydrolysis of structural polysaccharides.

Table 1.
Effect of different treatments of digestate on volumetric concentrations (VC) and percentage recovery yield (RY) of total sugars and reducing sugars.
Based on these results, mild acid hydrolysis appeared to be the most effective approach in yielding a carbohydrate-enriched ELP. To optimize this pretreatment, a full factorial design was used to statistically evaluate the impact of acid concentration and incubation time (X1 and X2, respectively). Table 2 reporting the structure of the experimental design and the volumetric concentrations obtained for each individual combination of the quantitative variables under study, shows that the response ranged widely from 4.38 to 25.98 g L−1 depending on the selected factor combination.
Table 2.
Full factorial design showing the actual values and, between square brackets, the coded values of the independent variables’ H2SO4 concentration (X1) and incubation time (X2) and observed and predicted values of the volumetric concentrations of total sugars.
Data were fitted by a second order polynomial equation, leading to a high fraction of variation explained by the model (R2adj = 0.925). Since the X1·X2 interaction coefficient was not statistically significant (p = 0.324), data were refitted by excluding the insignificant term from the model (Table 3).
Table 3.
Least squares estimate of coefficients of the variables H2SO4 concentration (X1) and incubation time (X2) in the original and refined model. Statistical parameters measuring fitting power (R2), predictive power (Q2) and probability of lack of fit (FME) are also shown.
As an additional check, the Fisher–Snedecor’s model error values (FME), calculated by the ratio between mean squares of model error and replicate error, showed that the probability for lack of fit of the refined model was not statistically significant (p = 0.256). The contour diagram for saccharification yield as a function of different combinations of the two factors (Figure 2) supported the absence of significant first-order interaction, as also determined primarily through statistical hypothesis testing based on ANOVA (analysis of variance) and regression analysis. The contour lines were mainly ellipsoidal and regularly spaced, showing parallelism and indicating additive effects of both variables. Moreover, there was no strong bending or twisting of contour lines, which is usually a sign of interaction between variables. Figure 2 also shows that the attainment of TS concentrations as high as 25 g L−1 by mild acid hydrolysis with 6% H2SO4 required an incubation time of 68 min. Above that combination of variable levels, the TS values were all positioned on the same isocurve, probably indicating that these conditions efficiently broke down hemicellulose, revealed by the plateau in sugar yield at intermediate conditions, but left much cellulose intact due to its high crystallinity and resistance to acid attack under mild conditions. In the ELP thus derived, most of the TS pool were pentoses and reducing sugars with respective volumetric concentrations amounting to 23.02 and 22.82 g L−1. Under the same condition, the concentration of total phenols and N-NH4+ amounted to 0.72 g and 1.14 g L−1.
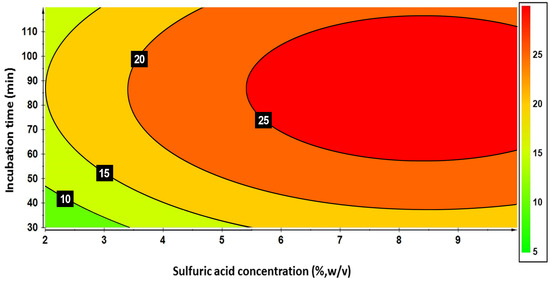
Figure 2.
Contour plot of total sugars concentrations (g L−1) in the enriched liquid phase as a function of incubation time and H2SO4 concentrations.
3.2. Screening of Strains for Biomass- and Chitosan-Producing Ability on ELP Medium
Table 4 shows biomass production, percentage of total sugars (TS) consumption and values of biomass yield referred to the substrate consumed (YX/S) in liquid cultures of several Zygomycota strains grown in the ELP derived from the mild acid hydrolysis of the digestate.
Table 4.
Biomass production, percentage of total sugars (TS) consumed, and biomass yield referred to TS consumed (YX/S) obtained in 96 h old cultures of Zygomycota strains grown on non-supplemented enriched liquid phase.
With the notable exceptions of A. glauca NRRL 2799 and A. blakesleeana NRRL 2696 cultures, yielding TS consumptions of 92 and 75%, respectively, the strains belonging to the Absidia genus showed a limited ability to grow on the ELP medium, and this also concerned C. elegans NRRL 1392 cultures. A. blakesleeana NRRL 2696 and Rhizopus oryzae NRRL 1510 were the best biomass producers on the ELP medium (7.58 and 8.12 g L−1, respectively). The only strain not belonging to the Mucorales order, namely A. tubingensis NRRL 4700, also showed a satisfactory biomass-producing capability on the ELP medium (6.63 g L−1).
Nine of the initial 17 strains under study were selected for the secondary screening phase since their cultures yielded biomass levels higher than 2.5 g L−1, an amount considered compatible with accurate gravimetric quantification of the purified chitosan. The results are summarized in Table 5, showing the amounts of alkali-insoluble material (AIM), chitosan volumetric production, daily productivity (rc) and chitosan yield referred to biomass dry weight (YC/X), obtained after 96 h of incubation.
Table 5.
Values of alkali-insoluble material (AIM), chitosan yield (YC/X), volumetric production (CVP) and daily productivity (rc) in fungal cultures grown on the enriched liquid phase for 96 h.
The ELP medium supported significant chitosan accumulation, with YC/X values ranging from 20 to 59 mg g−1 biomass for the Mucorales strains. In this respect, the performance of the tested species was higher than those grown on a non-optimized liquid medium made of 1% corn-steep liquor and 25% cassava peel juice, where YC/X ranged from 5 and 15 mg g−1 of fungal biomass, depending on the species [27]. In the present study, the highest AIM values per gram of biomass, observed in A. coerulea NRRL 1312 and A. tubingensis NRRL 4700 (610 ± 21 and 355 ± 3 mg g−1, respectively) cultures, were counterbalanced by the lowest percentage of chitosan on AIM (around 7 and 4%, respectively), leading to low chitosan volumetric productions (49 ± 5 and 86 ± 7 mg L−1, respectively) and rc values (12 ± 1 and 22 ± 2 mg L−1 d−1, respectively).
The best YC/X and rc values (59 ± 3 mg g−1 and 111 mg L−1 d−1, respectively) were observed in A. blakesleeana NRRL 2696 cultures attaining a chitosan volumetric production of 444 ± 18 mg L−1. Among the other strains screened, R. oryzae NRRL 1510 cultures gave promising results with chitosan volumetric productions, rc and YC/X being 324 ± 34 mg L−1, 81 mg L−1 d−1 and 40 mg g−1 biomass, respectively. Figure 3 displays the process kinetics of A. blakesleeana NRRL 2696 and R. oryzae NRRL 1510 shaken cultures grown on the non-supplemented ELP medium.
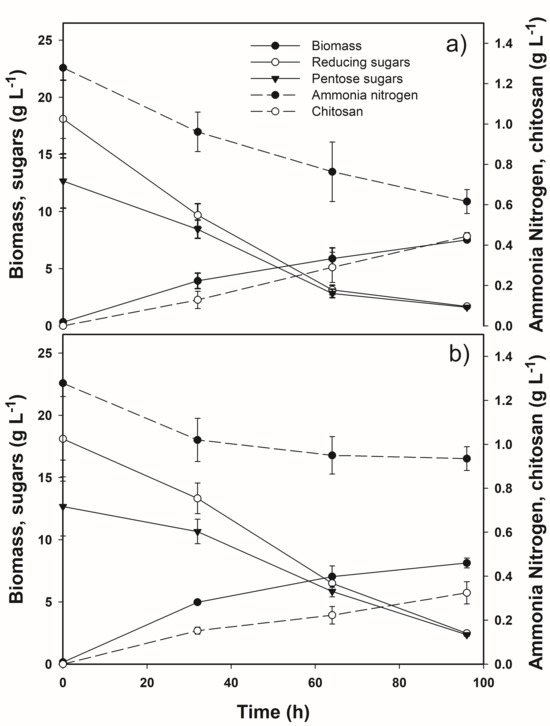
Figure 3.
Time courses of biomass and chitosan productions and consumptions of reducing sugars, pentoses and ammonia nitrogen in shaken liquid cultures of the selected strains: (a) A. blakesleeana NRRL 2696 and (b) R. oryzae NRRL 1510.
The process endpoint was set at 96 h since preliminary experiments showed that, at that time, the cultures of both strains had reached the late exponential phase. Several studies pointed out that this phase is the optimal harvesting time since, during the subsequent stationary phase, chitosan molecules establish cross-links with other cell wall constituents, making extraction less effective [28,29,30]. Both fungal cultures removed reducing sugars and pentoses from the ELP medium to similar extents at the end of the fermentation. A. blakesleeana NRRL 2696 cultures consumed ammonia nitrogen at a faster rate and to a much greater extent than those of R. oryzae NRRL 1510. Although this disparity did not result in significant differences in biomass formation at the end of the process, it did impact chitosan production.
For comparison, Table 6 shows the volumetric biomass and chitosan production, and the average daily productivity (rc) values obtained with the two strains A. blakesleeana NRRL 2696 and R. oryzae NRRL 1510, along with values from other studies that investigated fungal chitosan production efficiency in shaken cultures on chemically defined liquid media and various wastewater and industrial by-products.
Notably, A. blakesleeana NRRL 1340 performed well as a chitosan producer in the pioneering study of Rane and Hoover [22], and a subsequent study reported it as a species of great interest to produce chitin and chitosan [31]. Despite these findings, we only found one pertinent study regarding this species, mentioned with its synonym Lichtheimia blakesleeana [27], that uniquely reported the value of YC/X (12.04 mg g−1 biomass) obtained in a medium made of a mixture of corn steep liquor (CSL) and papaya peel juice (PPJ). For this reason, Table 6 also includes data on chitosan production by other Absidia species, most of which were obtained on glucose-peptone-yeast extract (GPY) media [7,22,32,33], except for the study of Jiang et al. [34], which used a glucose-based medium with added soybean pomace (GBMSP) to investigate the chitosan-producing ability of A. coerulea CTCC93105 cultures. Among these studies, A. coerulea cultures grown on GPY [33] and GBMSP [34] media stood out due to the high Yc/x and rc values, which were about 6-fold higher than those obtained by A. blakesleeana NRLL 2696 cultures grown on the ELP medium.
For R. oryzae, in addition to studies conducted on synthetic media, mostly consisting of GPY to which was added (or not) ammonium sulfate [29,35], which attained similar chitosan production results to those obtained with R. oryzae NRRL 1510 on ELP medium, considerable efforts have been devoted to the development of low-cost production media [36,37,38,39,40,41,42]. Among these studies, the best performance was attained by R. oryzae MTCC62 and PAS17 cultures grown on deproteinized whey with addition of gibberellic acid [36] and a molasses-based medium [37], respectively.
The most similar medium to the ELP one was that used by Tai et al. [38], which cultivated R. oryzae ME-F12 cultures on a corn straw hemicellulose hydrolysate (HH)-based medium, obtained by dilute acid hydrolysis, supplemented with urea and MgSO4 (2.0 and 0.5 g L−1, respectively). When the HH was used in lieu of a glucose-based medium with the same supplements, biomass and chitosan productions increased by 10 and 82%, respectively [38]. This hydrolysate mostly contained xylose, which was confirmed to be a preferential sugar source over glucose in the production of biomass and chitosan by R. oryzae [40]. In this respect, although the ELP medium composition resembled that used by Tai et al. [38], the chitosan volumetric production and YC/X obtained therein by R. oryzae NRRL 1510 were 1.4- and 1.8-fold lower than those of R. oryzae ME-F12, likely because the ELP medium was not supplemented with additional organic or inorganic nutrients.
Table 6.
Comparing figures of merit of the developed work with the reported ones for chitosan production in shaken cultures of the same or similar fungal species.
Irrespective of these considerations, all these comparisons must be interpreted not only with respect to the differences in the growth medium but also with respect to the variability of the strains used, the cultivation conditions and the chitosan extraction methods used.
3.3. Characterization of Fungal Chitosans
The infrared spectroscopic characterization of samples produced by A. blakesleeana NRRL 2696 and R. oryzae NRRL 1510, from here onwards referred to as Ab-Cht and Ro-Cht, respectively, is reported in Figure 4. FT-IR spectra were used to identify and confirm the characteristic functional groups of the produced chitosan. Both samples exhibited similar trends in their FT-IR spectra, showing the same peaks, with slight differences in their intensities, with the typical peaks assigned to polysaccharide structures.
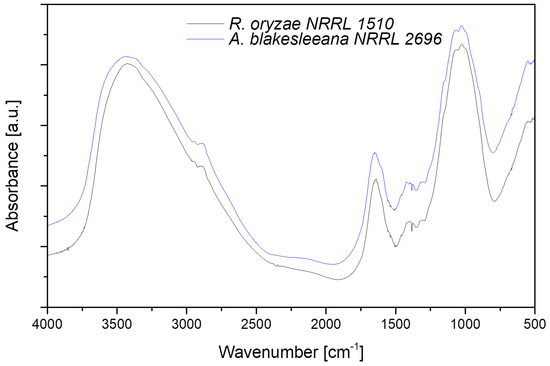
Figure 4.
Absorbance FT-IR spectra of chitosan samples (A. blakesleeana NRRL 2696 in blue, R. oryzae NRRL 1510 in black) in the 4000–500 cm−1 range collected in transmission mode.
A broad absorption band in the range of 3000–3500 cm−1 was found in both samples, and it was attributed to O–H and N–H stretching, centered at 3440 cm−1, while a small absorption band was registered at 2870–2880 cm−1, due to C–H aliphatic stretching vibration. The distinctive absorption peaks of amide I, centered at 1650 cm−1 and due to axial C=O stretching, and amide II, centered at 1558 cm−1 due to N-H in plane deformation coupled with C–N stretching, were clearly visible in the fingerprint region. Furthermore, between 1250 cm−1 and 750 cm−1, a broad band was present, which was extremely useful for evidencing chitosan presence even in trace amounts, due to the vibrations of glycosidic bonds, C–O and C–O–C stretching. FT-IR was also used to determine DD% value of the chitosan samples, and the chosen bands were at 1420 and 1320 cm−1. The DD% values calculated with Equation (4), proposed by Brugnerotto et al. [24], were 79.0 and 84.2% for Ab-Cht and Ro-Cht, respectively.
Table 7 shows the elemental analysis of Ab-Cht and Ro-Cht samples and the respective DD% values, calculated according to the Equation (5), proposed by Dos Santos et al. [25] and relying on the C/N ratios. The DD% value for the Ab-Cht was higher than that determined by FT-IR spectroscopy (86.5 vs. 79.0%), while the DD% value of Ro-Cht was very similar to that determined from FT-IR spectroscopy.
Table 7.
Elemental analysis of the chitosan preparations derived from the late exponential phase of A. blakesleeana NRRL2696 and R. oryzae NRRL 1511 shaken cultures grown on non-supplemented enriched liquid phase derived from the digestate. Data are the means of duplicate cultures, and the relative standard deviations of data were less than 7%.
Regardless of the technique employed, these DD% values are well above the minimum threshold suggested by various authors for a clear separation between chitin and chitosan [4,5,6]. The DD% is an important parameter affecting the physicochemical properties of this polymer, since a high degree of deacetylation enhances its polycationic nature and water-solubility, thus making it very suitable for both environmental and food applications as a coagulating or a clarifying agent [2,3,4,5,6].
The determination of the intrinsic viscosity through a rolling-ball viscometer and the subsequent application of the Mark–Houwink–Sakurada equation showed that the average molecular weights of Ab-Cht and Ro-Cht samples were 20 and 5.39 kDa, respectively (Table 8).
Table 8.
Intrinsic viscosity values [η], R2 values of the fitting lines and average molecular weight (Mv) of chitosan obtained from shaken cultures of A. blakesleeana NRRL 2696 and R. oryzae NRRL 1510 shaken cultures grown on the ELP medium.
These findings indicate that the cultivation of both strains on the ELP medium yielded low-molecular-weight chitosans (LMWChs), a group of polymers which have attracted considerable attention due to their strong bactericidal activities [43], and potential in DNA delivery systems as a carrier [44]. Until now, the primary processes to obtain LMWCh have been thermally assisted acid hydrolysis [45] or biochemical hydrolysis [43] of high-molecular-weight chitosan. Alternatively, Niederhofer and Muller [46] were able to obtain A. coerulea LMWCh with average MW of 45 kDa and polydispersity of 2.63 through a radical modification of the extraction procedure. Wang and collaborators [47], instead, used Absidia coerulea AF93105 solid-state cultures on potato waste as a direct production method leading to a chitosan with an average molecular weight of 6.4 kDa and a very low degree of polydispersity.
Thermogravimetric analysis (TGA) was employed to evaluate the thermal degradation profile and thermal stability of fungal chitosan. Figure 5a,b illustrate the residual weights (TG) and derivative thermogravimetric (DTG) curves vs. temperature (30–500 °C) for Ab-Cht and Ro-Cht samples, respectively, in an oxygen-free atmosphere. The TGA curves revealed that both chitosan samples underwent a two-stage thermal decomposition process within the 30–500 °C range, consistent with previous findings [48].
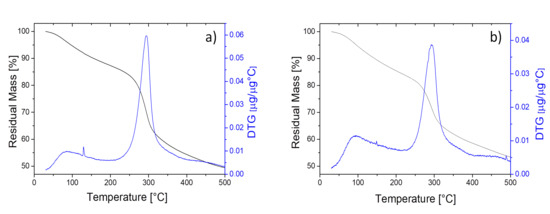
Figure 5.
Residual mass (black line) and derivative thermal gravimetry (blue line) profiles under nitrogen atmosphere, in the 30–500 °C temperature range, of two chitosan preparations extracted from: (a) A. blakesleeana NRRL 2696 and (b) R. oryzae NRRL 1510 cultures.
In the first degradation stage (30–200 °C), Ab-Cht and Ro-Cht samples demonstrated weight losses of 11% and 13%, respectively. This initial weight reduction can be attributed to the evaporation of absorbed moisture, as chitosan’s hydrophilic functional groups (-OH and-NH2) readily form hydrogen bonds with water molecules [27]. The second, more substantial decomposition stage occurred at 200–400 °C, with weight losses of 34% for Ab-Cht and 37% for Ro-Cht. This stage corresponds to the complex thermal degradation of the chitosan polymer, including deacetylation, depolymerization and dehydration of saccharide rings, followed by pyranose ring decomposition [49]. The onset of significant thermal degradation began at approximately 250 °C, with maximum decomposition rate (Tmax) observed at 290 °C, as indicated by the DTG peak. While the thermal profile patterns of both fungal chitosans resembled those of commercial chitosan , a slight shift toward lower temperatures was noted for the main thermal events, suggesting reduced thermal stability. After 350 °C, the decomposition rate notably decreased, likely due to cross-linking reactions or the formation of thermally stable carbonaceous residues [49]. The observed thermal behavior aligns with previous reports on chitosan thermal properties [48,50].
3.4. Antibacterial Activity of Fungal Chitosans
Chitosan has demonstrated antimicrobial activity against a broad range of target organisms, including bacteria, fungi, yeasts and algae [4]. Among its physico-chemical properties, the degree of deacetylation (DD%) and the molecular weight exert the most significant influence on chitosan’s antimicrobial activity. The positively charged amino groups of chitosan can compete with bivalent ions, such as Ca2+ and Mg2+, in binding to phosphate and carboxyl groups commonly found in lipopolysaccharide; this interaction destabilizes the Gram-negative cell wall [51]. However, other studies suggest that chitosan exhibits stronger antimicrobial activity on Gram-positive bacteria than Gram-negative ones [4,52]. In this case, the polycationic nature of chitosan binds to anionic glycerophosphate units of lipoteichoic acids present in the Gram-positive wall, disrupting the structural stability of the cell wall [51]. Table 9 shows the minimum inhibitory concentration (MIC) values for one Gram-positive and two Gram-negative bacterial species tested with fungal-derived chitosans, compared to a commercial LMWCh. Among the tested bacteria, Pseudomonas syringae DSM 21482 was the most sensitive, with the lowest MIC values (160 mg L−1 for chitosan extracted from both Ab-Cht and Ro-Cht). The MIC values of the former and the latter fungal chitosan for Escherichia coli ATCC 9637 were 1.9-and 2.6-fold higher than those for P. syringae DSM 21482.
Table 9.
Minimum inhibitory concentrations (mg L−1) of chitosan preparations from A. blakesleeana NRRL 2696, R. oryzae NRRL 1510 and a commercial source.
The lowest antibacterial activity was detected against the Gram-positive strain B. subtilis DIBAF23–97, regardless of the chitosan source. Notably, the commercial chitosan preparation exhibited the highest antibacterial activity across all tested bacterial species (Table 9). The commercial chitosan had a molecular weight of 70 kDa, significantly higher than that of the two fungal-derived preparations, while its percentage of deacetylation (88%) was only slightly higher. Although a general trend is reported where antibacterial activity increases with decreasing molecular weight and increasing DD% [53,54], the superior antimicrobial performance of the commercial chitosan observed here suggests that additional factors influence activity. These include the charge density, which depends on the degree of protonation of amino groups under assay conditions and governs the strength of electrostatic interactions with the negatively charged bacterial surfaces [51]. Fungal chitosans can possess unique structural features and different acetylation patterns compared to commercial chitosans derived from crustaceans, potentially influencing their conformation and biological activities [55]. These combined factors likely contribute to the observed superior antibacterial activity of the commercial low-molecular-weight chitosan despite its higher molecular weight. Our MIC values for fungal chitosans (160–480 mg L−1) were substantially lower than those reported for other fungal chitosans (750–2000 mg L−1) against the same tested bacterial species [56,57], confirming the relatively strong performance of our samples within the fungal chitosan category. In summary, although MW and DD% are important determinants, the antibacterial effectiveness of chitosan is multifactorial, wherein charge density and acetylation patterns also play significant roles.
4. Conclusions
This study pioneers the innovative valorization of both liquid and solid fractions of digestate, demonstrating their potential as a growth substrate for producing fungal chitosan. Through mild acid hydrolysis, optimized using the response surface methodology, a liquid production medium was developed that, even in its non-supplemented form, proved highly effective for fungal cultivation. Out of 17 fungal strains tested, nine exhibited robust growth on this medium, achieving satisfactory biomass yields. Notably, Absidia blakesleeana NRRL 2696 and Rhizopus oryzae NRRL 1510 emerged as standout performers in chitosan production, achieving CVP values of 444 mg/L and 324 mg/L, respectively. The extracted chitosans displayed desirable characteristics, including high degrees of deacetylation (79% for A. blakesleeana and 84.2% for R. oryzae) and remarkably low viscosimetric molecular weights (20 kDa and 5.4 kDa, respectively). Such low-molecular-weight chitosans (LMWChs) are obtained exceptionally rarely directly through fungal fermentation and are highly sought after due to their superior solubility, bioavailability and enhanced biological activities compared to their high-molecular-weight counterparts [58]. Furthermore, both chitosan preparations exhibited potent antibacterial properties against Gram-positive and Gram-negative bacteria, with minimum inhibitory concentrations (MICs) significantly lower than those reported for other fungal-derived chitosans. This underscores their potential as effective antimicrobial agents.
Author Contributions
Conceptualization, S.C., M.P. and A.D.; methodology, S.C., A.D., A.C. and I.A.; validation, A.D., I.A. and S.C.; formal analysis, A.D.; writing—review and editing, A.D., S.C. and I.A.; investigation, E.C., C.R., F.D.G. and I.A.; visualization, I.A., C.R. and F.D.G.; supervision, M.P.; project administration, M.P.; funding acquisition, M.P. All authors have read and agreed to the published version of the manuscript.
Funding
This research was partially supported by the “Network 4 Energy Sustainable Transition—NEST” project (Ministero dell’Istruzione dell’Università e della Ricerca: MIUR project code PE000021, Concession Degree No. 1561 of 11 October 2022) in the framework of the Next Generation EU PNRR plan (CUP C93C22005230007).
Institutional Review Board Statement
Not applicable.
Informed Consent Statement
Not applicable.
Data Availability Statement
The raw data supporting the conclusions of this article will be made available by the authors on request.
Conflicts of Interest
The authors declare no conflicts of interest.
Abbreviations
The following abbreviations are used in this manuscript:
| Ab-Cht | Absidia blakesleeana chitosan |
| AIM | Alkali-insoluble material |
| CVP | Chitosan volumetric production |
| DD | Deacetylation degree |
| DLF | Digestate liquid fraction |
| DSF | Digestate solid fraction |
| DTG | Derivative thermogravimetry |
| ELP | Enriched liquid phase |
| FT-IR | Fourier transform infrared |
| GPY | Glucose-peptone-yeast extract |
| HH | Hemicellulose hydrolysate |
| LMWCh | Low-molecular-weight chitosan |
| MIC | Minimum inhibitory concentration |
| Mv | Viscosimetric average molecular weight |
| rc | Average daily productivity |
| Ro-Cht | Rhizopus oryzae chitosan |
| RY | Recovery yield |
| TGA | Thermogravimetric analysis |
| TS | Total sugars |
| Yc/x | Chitosan yield referred to biomass dry weight |
| Yx/s | Biomass yield referred to the substrate consumed |
References
- Kim, S.K.; Rajapakse, N. Enzymatic production and biological activities of chitosan oligosaccharides (COS): A review. Carbohydr. Polym. 2005, 62, 357–368. [Google Scholar] [CrossRef]
- Elsoud, M.M.A.; El Kady, E.M. Current trends in fungal biosynthesis of chitin and chitosan. Bull. Natl. Res. Cent. 2019, 43, 43–59. [Google Scholar] [CrossRef]
- Crognale, S.; Russo, C.; Petruccioli, M.; D’Annibale, A. Chitosan production by fungi: Current state of knowledge, future opportunities and constraints. Fermentation 2022, 8, 76. [Google Scholar] [CrossRef]
- Dhillon, G.S.; Kaur, S.; Brar, S.K.; Verma, M. Green synthesis approach: Extraction of chitosan from fungus mycelia. Crit. Rev. Biotechnol. 2013, 33, 379–403. [Google Scholar] [CrossRef]
- Chien, R.; Yen, M.; Mau, J. Antimicrobial and antitumor activities of chitosan from shiitake stipes, compared to commercial chitosan from crab shells. Carbohydr. Polym. 2016, 138, 259–264. [Google Scholar] [CrossRef]
- Huq, T.; Khan, A.; Brown, D.; Dhayagude, N.; He, Z.; Ni, Y. Sources, production and commercial applications of fungal chitosan: A review. J. Biores. Bioprod. 2022, 7, 85–98. [Google Scholar] [CrossRef]
- Hu, K.J.; Hu, J.L.; Ho, K.P.; Yeung, K.W. Fungal screening for chitosan producers and copper adsorption capabilities of fungal chitosan and chitosanaceous materials. Carbohydr. Polym. 2004, 58, 45–52. [Google Scholar] [CrossRef]
- Streit, F.; Koch, F.; Laranjeira, M.; Ninow, J.L. Production of fungal chitosan in liquid cultivation using apple pomace as substrate. Brazil. J. Microbiol. 2009, 40, 20–25. [Google Scholar] [CrossRef] [PubMed]
- Cardoso, A.; Lins, C.I.M.; Dos Santos, E.R.; Silva, M.C.F.; Campos-Takaki, G.M. Microbial enhance of chitosan production by Rhizopus arrhizus using agroindustrial substrates. Molecules 2012, 17, 4904–4914. [Google Scholar] [CrossRef] [PubMed]
- Berger, L.R.; Stamford, T.C.; Stamford-Arnaud, T.M.; de Oliveira Franco, L.; do Nascimento, A.E.; Cavalcante, H.M.; Macedo, R.O.; de Campos-Takaki, G.M. Effect of corn steep liquor (CSL) and cassava wastewater (CW) on chitin and chitosan production by Cunninghamella elegans and their physicochemical characteristics and cytotoxicity. Molecules 2014, 19, 2771–2792. [Google Scholar] [CrossRef]
- Namboodiri, M.M.T.; Pakshirajan, K. Sustainable and green approach of chitosan production from Penicillium citrinum biomass using industrial wastewater as a cheap substrate. J. Environ. Manag. 2019, 240, 431–440. [Google Scholar] [CrossRef]
- Chozhavendhan, S.; Karthigadevi, G.; Bharathiraja, B.; Kumar, R.P.; Abo, L.D.; Prabhu, S.V.; Balachandar, R.; Jayakumar, M. Current and prognostic overview on the strategic exploitation of anaerobic digestion and digestate: A review. Environ. Res. 2023, 216, 114526. [Google Scholar] [CrossRef]
- Fuchs, W.; Drosg, B. Assessment of the state of the art of technologies for the processing of digestate residue from anaerobic digesters. Water Sci. Technol. 2013, 67, 1984–1993. [Google Scholar] [CrossRef]
- Carota, E.; Crognale, S.; Russo, C.; Petruccioli, M.; D’Annibale, A. Lignocellulolytic potential of the recently described species Aspergillus olivimuriae on different solid wastes. Appl. Sci. 2021, 11, 5349. [Google Scholar] [CrossRef]
- Dubois, M.; Gilles, K.A.; Hamilton, J.K.; Rebers, P.A.; Smith, F. Colorimetric method for determination of sugars and related substances. Anal. Chem. 1956, 28, 350–356. [Google Scholar] [CrossRef]
- Miller, G.L. Use of dinitrosalicylic acid reagent for determination of reducing sugar. Anal. Chem. 1959, 31, 426–428. [Google Scholar] [CrossRef]
- Deschatelets, L.; Yu, E.K. A simple pentose assay for biomass conversion studies. Appl. Microbiol. Biotechnol. 1986, 24, 379–385. [Google Scholar] [CrossRef]
- Jüttner, F. Interference with ammonium determination by the indophenol-type reaction of salicylate and dichloroisocyanurate. Fresen. J. Anal. Chem. 1999, 363, 128–129. [Google Scholar] [CrossRef]
- Bradford, M.M. A rapid and sensitive method for the quantitation of microgram quantities of protein utilizing the principle of protein-dye binding. Anal. Biochem. 1976, 72, 248–254. [Google Scholar] [CrossRef]
- Sun, S.W.; Lin, Y.C.; Weng, Y.M.; Chen, M.J. Efficiency improvements on ninhydrin method for amino acid quantification. J. Food Comp. Anal. 2006, 19, 112–117. [Google Scholar] [CrossRef]
- Ainsworth, E.; Gillespie, K. Estimation of total phenolic content and other oxidation substrates in plant tissues using Folin-Ciocalteu reagent. Nat. Protoc. 2007, 2, 875–877. [Google Scholar] [CrossRef]
- Rane, K.D.; Hoover, D.G. Production of chitosan by fungi. Food Biotechnol. 1993, 7, 11–33. [Google Scholar] [CrossRef]
- Standard’s CLSI Document M07-A9; Methods for Dilution Antimicrobial Susceptibility Tests for Bacteria That Grow Aerobically; Approved Standard—Ninth Edition. Clinical and Laboratory Standards Institute: Wayne, PA, USA, 2012.
- Brugnerotto, J.; Lizardi, J.; Goycoolea, F.M.; Argüelles-Monal, W.; Desbrieres, J.; Rinaudo, M. An infrared investigation in relation with chitin and chitosan characterization. Polymer 2001, 42, 3569–3580. [Google Scholar] [CrossRef]
- Dos Santos, Z.M.; Caroni, A.L.P.F.; Pereira, M.R.; Da Silva, D.R.; Fonseca, J.L.C. Determination of deacetylation degree of chitosan: A comparison between conductometric titration and CHN elemental analysis. Carbohydr. Res. 2009, 344, 2591–2595. [Google Scholar] [CrossRef]
- Amitaye, A.N.; Elemike, E.E.; Akpeji, H.B.; Amitaye, E.; Hossain, I.; Mbonu, J.I.; Aziza, A.E. Chitosan: A sustainable biobased material for diverse applications. J. Environ. Chem. Eng. 2024, 12, 113208. [Google Scholar] [CrossRef]
- Berger, L.R.R.; Stamford, T.C.M.; de Oliveira, K.Á.R.; Pessoa, A.D.M.P.; de Lima, M.A.B.; Pintado, M.M.E.; Câmara, M.P.S.; de Oliveira Franco, L.; Magnani, M.; de Souza, E.L. Chitosan produced from Mucorales fungi using agroindustrial by-products and its efficacy to inhibit Colletotrichum species. Int. J. Biol. Macromol. 2018, 108, 635–641. [Google Scholar] [CrossRef] [PubMed]
- Davis, L.L.; Bartnicki-Garcia, S. Chitosan synthesis by the tandem action of chitin synthetase and chitin deacetylase from Mucor rouxii. Biochemistry 1984, 23, 1065–1073. [Google Scholar] [CrossRef]
- Tan, S.C.; Tan, T.K.; Wong, S.M.; Khor, E. The chitosan yield of zygomycetes at their optimum harvesting time. Carbohydr. Polym. 1996, 30, 239–242. [Google Scholar] [CrossRef]
- El-Mekawy, A.; El-Baz, A.F.; Soliman, A.E.; Hudson, S. Statistical modeling and optimization of chitosan production from Absidia coerulea using response surface methodology. Curr. Biotechnol. 2013, 2, 125–133. [Google Scholar] [CrossRef]
- Campos-Takaki, G.M.; Beakes, G.W.; Dietrich, S.M.C. Electron microscopic X-ray microprobe and cytochemical study of isolated cell walls of mucoralean fungi. Trans. Brit. Mycol. Soc. 1983, 80, 536–541. [Google Scholar] [CrossRef]
- Vaingankar, P.N.; Juvekar, R.A. Fermentative production of mycelial chitosan from zygomycetes: Soil optimization and chemical-physical characterization. Adv. Biosci. Biotechnol. 2014, 5, 940. [Google Scholar] [CrossRef]
- Muzzarelli, R.A.; Ilari, P.; Tarsi, R.; Dubini, B.; Xia, W. Chitosan from Absidia coerulea. Carbohydr. Polym. 1994, 25, 45–50. [Google Scholar] [CrossRef]
- Jiang, L.; Pan, S.; Kim, J.M. Influence of nitrogen source on chitosan production by Absidia coerulea CTCC AF 93105. Carbohydr. Polym. 2011, 86, 359–361. [Google Scholar] [CrossRef]
- Nadarajah, K.; Kader, J.; Mazmira, M.; Paul, D.C. Production of chitosan by fungi. Pak. J. Biol. Sci. 2001, 4, 263–265. [Google Scholar] [CrossRef]
- Chatterjee, S.; Chatterjee, S.; Chatterjee, B.P.; Guha, A.K. Enhancement of growth and chitosan production by Rhizopus oryzae in whey medium by plant growth hormones. Int. J. Biol. Macromol. 2008, 42, 120–126. [Google Scholar] [CrossRef] [PubMed]
- Tasar, O.C.; Erdal, S.; Taskin, M. Production of chitosan by psychrotolerant Rhizopus oryzae under non-sterile open fermentation conditions. Int. J. Biol. Macromol. 2016, 89, 428–433. [Google Scholar] [CrossRef]
- Tai, C.; Li, S.; Xu, Q.; Ying, H.; Huang, H.; Ouyang, P. Production of chitosan from maize straw hemicellulose hydrolysate: Impact of degradation products on Rhizopus oryzae growth and chitosan fermentation. Lett. Appl. Microbiol. 2010, 51, 278–284. [Google Scholar] [CrossRef]
- Chatterjee, S.; Guha, A.K.; Chatterjee, B.P. Evaluation of the quantity and quality of chitosan products from Rhizopus oryzae using processing waste from food, whey and molasses. J. Environ. Manag. 2019, 251, 109565. [Google Scholar] [CrossRef] [PubMed]
- Yang, L.; Li, X.; Lai, C.; Fan, Y.; Ouyang, J.; Yong, Q. Fungal chitosan production using xylose rich of corn stover prehydrolysate by Rhizopus oryzae. Biotechnol. Biotechnol. Equip. 2017, 31, 1160–1166. [Google Scholar] [CrossRef]
- Hang, Y.D. Chitosan production from Rhizopus oryzae mycelia. Biotechnol. Lett. 1990, 12, 911–912. [Google Scholar] [CrossRef]
- Al-Sharnouby, S.; Abd-Elfatah, S.I. Fermentative production, characterization and antimicrobial activity of chitosan from some zygomycetes fungi. Egypt. J. Chem. 2022, 65, 1579–1589. [Google Scholar] [CrossRef]
- Kittur, F.S.; Kumar, A.B.V.; Tharanathan, R.N. Low molecular weight chitosans preparation by depolymerization with Aspergillus niger pectinase, and characterization. Carbohydr. Res. 2003, 338, 1283–1290. [Google Scholar] [CrossRef]
- Nimesh, S.; Thibault, M.M.; Lavertu, M.; Buschmann, M.D. Enhanced gene delivery mediated by low molecular weight chitosan/DNA complexes: Effect of pH and serum. Mol. Biotechnol. 2010, 46, 182–196. [Google Scholar] [CrossRef]
- Gonçalves, C.; Ferreira, N.; Lourenço, L. Production of low molecular weight chitosan and chitooligosaccharides (COS): A review. Polymers 2021, 13, 2466. [Google Scholar] [CrossRef]
- Niederhofer, A.; Müller, B.W. A method for direct preparation of chitosan with low molecular weight from fungi. Eur. J. Pharm. Biopharm. 2004, 57, 101–105. [Google Scholar] [CrossRef] [PubMed]
- Wang, W.; Du, Y.; Qiu, Y.; Wang, X.; Hu, Y.; Yang, J.; Cai, J.; Kennedy, J.F. A new green technology for direct production of low molecular weight chitosan. Carbohydr. Polym. 2008, 74, 127–132. [Google Scholar] [CrossRef]
- Abdou, E.S.; Nagy, K.S.A.; Elsabee, M.Z. Extraction and characterization of chitin and chitosan from local sources. Bioresour. Technol. 2008, 99, 1359–1367. [Google Scholar] [CrossRef] [PubMed]
- Rao, V.; Johns, J. Thermal behavior of chitosan/natural rubber latex blends TG and DSC analysis. J. Therm. Anal. Calorim. 2008, 92, 801–806. [Google Scholar] [CrossRef]
- Fai, A.E.C.; Stamford, T.C.; Stamford-Arnaud, T.M.; Santa-Cruz, P.D.A.; da Silva, M.C.F.; Campos-Takaki, G.M.; Stamford, T.L. Physico-chemical characteristics and functional properties of chitin and chitosan produced by Mucor circinelloides using yam bean as substrate. Molecules 2011, 16, 7143–7154. [Google Scholar] [CrossRef]
- Kong, M.; Chen, X.G.; Xing, K.; Park, H.J. Antimicrobial properties of chitosan and mode of action: A state-of-the-art review. Int. J. Food Microbiol. 2010, 144, 51–63. [Google Scholar] [CrossRef]
- Li, J.; Zhuang, S. Antibacterial activity of chitosan and its derivatives and their interaction mechanism with bacteria: Current state and perspectives. Eur. Polym. J. 2020, 138, 109984. [Google Scholar] [CrossRef]
- Mellegård, H.; Strand, S.P.; Christensen, B.E.; Granum, P.E.; Hardy, S.P. Antibacterial activity of chemically defined chitosans: Influence of molecular weight, degree of acetylation and test organism. Int. J. Food Microbiol. 2011, 148, 48–54. [Google Scholar] [CrossRef] [PubMed]
- Younes, I.; Sellimi, S.; Rinaudo, M.; Jellouli, K.; Nasri, M. Influence of acetylation degree and molecular weight of homogeneous chitosans on antibacterial and antifungal activities. Int. J. Food Microbiol. 2014, 185, 57–63. [Google Scholar] [CrossRef] [PubMed]
- Sahariah, P.; Másson, M. Antimicrobial chitosan and chitosan derivatives: A review of the structure–activity relationship. Biomacromolecules 2017, 18, 3846–3868. [Google Scholar] [CrossRef]
- Tajdini, F.; Amini, M.A.; Nafissi-Varcheh, N.; Faramarzi, M.A. Production, physiochemical and antimicrobial properties of fungal chitosan from Rhizomucor miehei and Mucor racemosus. Int. J. Biol. Macromol. 2010, 47, 180–183. [Google Scholar] [CrossRef]
- Tayel, A.A.; Moussa, S.; Opwis, K.; Knittel, D.; Schollmeyer, E.; Nickisch-Hartfiel, A. Inhibition of microbial pathogens by fungal chitosan. Int. J. Biol. Macromol. 2010, 47, 10–14. [Google Scholar] [CrossRef]
- Boamah, P.O.; Onumah, J.; Agolisi, M.H.; Idan, F. Application of low molecular weight chitosan in animal nutrition, husbandry, and health: A review. Carbohydr. Polym. Technol. Appl. 2023, 6, 100329. [Google Scholar] [CrossRef]


Disclaimer/Publisher’s Note: The statements, opinions and data contained in all publications are solely those of the individual author(s) and contributor(s) and not of MDPI and/or the editor(s). MDPI and/or the editor(s) disclaim responsibility for any injury to people or property resulting from any ideas, methods, instructions or products referred to in the content. |
© 2025 by the authors. Licensee MDPI, Basel, Switzerland. This article is an open access article distributed under the terms and conditions of the Creative Commons Attribution (CC BY) license (https://creativecommons.org/licenses/by/4.0/).