Article

The Production Optimization of a Thermostable Phytase from Bacillus subtilis SP11 Utilizing Mustard Meal as a Substrate

by
Md. Al Muid Khan
1,
Sabina Akhter
1,
Tanjil Arif
1,
Md. Mahmuduzzaman Mian
1,
Md. Arafat Al Mamun
2,
Muhammad Manjurul Karim
1 and
Shakila Nargis Khan
1,*
1
Department of Microbiology, University of Dhaka, Dhaka 1000, Bangladesh
2
Centre for Advanced Research in Sciences (CARS), University of Dhaka, Dhaka 1000, Bangladesh
*
Author to whom correspondence should be addressed.
Fermentation 2025, 11(8), 452; https://doi.org/10.3390/fermentation11080452
Submission received: 17 April 2025 / Revised: 19 May 2025 / Accepted: 29 May 2025 / Published: 3 August 2025

Abstract

Phytate, an antinutritional molecule in poultry feed, can be degraded by applying phytase, but its use in low- and middle-income countries is often limited due to importation instead of local production. Here, inexpensive raw materials were used to optimize the production of a thermostable phytase from an indigenous strain of Bacillus subtilis SP11 that was isolated from a broiler farm in Dhaka. SP11 was identified using 16s rDNA and the fermentation of phytase was optimized using a Plackett–Burman design and response surface methodology, revealing that three substrates, including the raw material mustard meal (2.21% w/v), caused a maximum phytase production of 436 U/L at 37 °C and 120 rpm for 72 h, resulting in a 3.7-fold increase compared to unoptimized media. The crude enzyme showed thermostability up to 80 °C (may withstand the feed pelleting process) with an optimum pH of 6 (near pH of poultry small-intestine), while retaining 96% activity at 41 °C (the body temperature of the chicken). In vitro dephytinization demonstrated its applicability, releasing 978 µg of inorganic phosphate per g of wheat bran per hour. This phytase has the potential to reduce the burden of phytase importation in Bangladesh by making local production and application possible, contributing to sustainable poultry nutrition.

1. Introduction

Phytate makes up more than 85% of the total phosphorus in oilseeds and cereal grains and is the main organic phosphorus storage form in plants [1]. Non-ruminant animals like pigs and poultry eat diets high in phytate phosphorus, which is poorly digested as they do not produce the enzyme phytase that degrades phytic acid [2]. Phytate can complex with protein at a low pH (stomach) and bind with divalent metal cations at a high pH (intestine), which makes these nutrients less available to the animal [3]. Besides being an antinutritional molecule for monogastric animals, it can also cause eutrophication [4].
Phytase can catalyze the removal of inorganic phosphate from phytate along with the bound nutrients [5]. As non-ruminants lack this enzyme, adding exogenous phytase to feed can enhance nutrition availability, thus enhancing growth and resulting in less eutrophication [6]. Exogenous phytase addition in feed can also exert a positive effect on the immune system, intestinal microbiota, and antioxidant status [7]. There are several types of phytases from several sources, and they have different advantages over each other [8,9,10,11,12,13]. Phytases from Bacillus species are beta-propeller phytase (BPP) as opposed to the usual commercial phytase from fungal or other bacterial sources, which are mostly histidine acid phosphatases (HAPs). Although BPP has, in general, less activity than HAP, it has the advantages of having a strict substrate specificity for phytate only (thus, unlike HAP, it avoids ATP, GTP, and NADH) and being inherently thermostable (so it can withstand the necessary industrial feed pelleting process) [14,15]. Nevertheless, partly due to inefficient enzyme production methods, Bacillus phytases have not been applied on a large scale [16].
The global market size for phytase was valued at USD 547.74 million in 2022 and is predicted to reach USD 949.96 million by the year 2031 [17]. In Bangladesh, however, phytases are not locally produced, but rather imported [18], which increases the cost and causes less use of phytase in poultry feed. If they are not thermostable enough, they lose significant activity when undergoing industrial feed pelleting processes. Therefore, thermostable phytase production from an indigenous strain within the country can address these issues in Bangladesh.
This study focused on 1. isolating and identifying phytase-producing indigenous bacteria, 2. the production optimization of phytase using both statistical (Plackett–Burman and central composite design) and classical (change one factor at a time) approaches, and 3. the characterization of the crude enzyme.

2. Materials and Methods

2.1. Sample Collection

Soil samples were collected from three different poultry farms in Dhaka city, Bangladesh. Samples were immediately taken to the Enzyme and Fermentation biotechnology laboratory, Department of Microbiology at the University of Dhaka, and preserved in dry conditions at −4 °C until processing.

2.2. Isolation of Phytase-Producing Bacteria

To isolate the phytase-producing bacteria from these samples, approximately 1 g of soil was suspended in 0.85% saline up to 10 mL. Diluted samples (10−4 or 10−5) were then spread onto the phytate-specific medium (PSM) plate adapted from Howsan et al. [19] (glucose 15.0 g/L, NH4NO3 5.0 g/L, Na-phytate 5.0 g/L, CaCl2 0.3 g/L, MgSO4 0.5 g/L, MnSO4 0.01 g/L, FeSO4 0.01 g/L, and 15 g/L agar, pH adjusted to 6) and incubated at 37 °C for 3 days. The PSM plates were later observed for clear hydrolysis zones around the colonies, which indicate the production of extracellular phytase. Clear zones around the colonies were evaluated by the plate detection method described by Bea et al. [20] using cobalt chloride and ammonium molybdate/ammonium vanadate solution.
The zone ratio was calculated to determine the efficiency of phytate degradation on the PSM plates [21] using the following formula:
Z = zone diameter/colony diameter

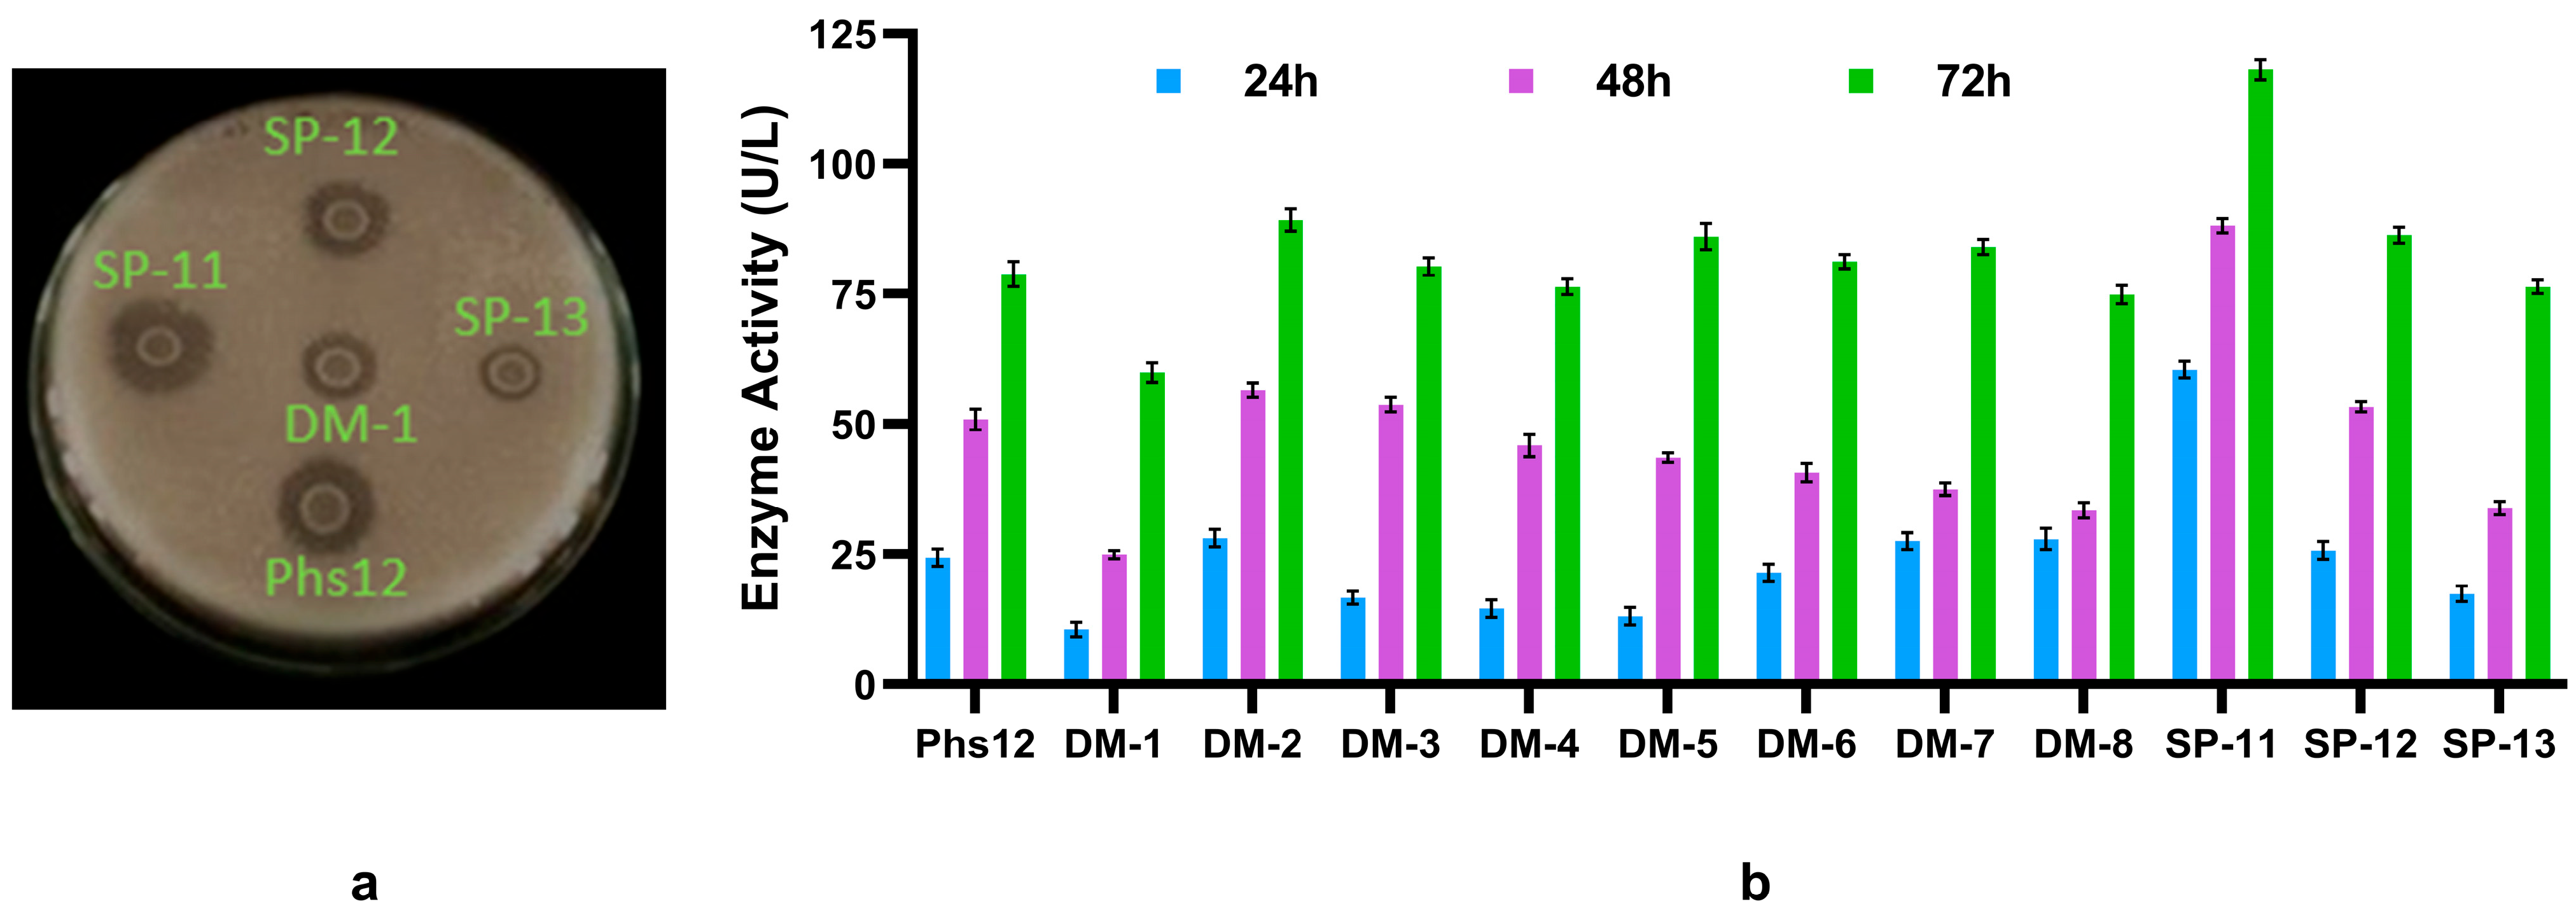
2.3. Quantitative Screening of Phytase-Producing Bacteria

Bacteria showing clear zones on the PSM were selected for further evaluation of their capacity to produce enzymes in liquid medium. Submerged fermentation was carried out in a 250 mL flask containing 50 mL of Phytase Production Medium (PPM—same composition as PSM without agar) with a 5% (v/v) inoculum size for 3 days at 37 °C and 120 rpm. The inoculum was prepared by taking a loopful of colonies from the plates and inoculating them into 5 mL TSB broth. At 24 h intervals, the phytase activity was measured.

2.4. Phytase Assay

For phytase assay, the method used in this experiment was adopted from Bea et al. [20], which is based on the detection of inorganic phosphate. The cell-free supernatant (CFS) was collected by centrifugation of the fermented broth at 10,000 g for 10 min. Phytase activity was determined by incubating 300 µL of the enzyme solution (CFS) with 1.2 mL of substrate solution [0.2% (w/v) sodium phytate (Sigma, St Louis, MO, USA) in 0.1 M sodium acetate buffer, pH 5.0] for 30 min at 37 °C. The reaction was stopped by adding 1.5 mL of 10% (w/v) trichloroacetic acid. From this mixture, 1.5 mL was transferred to a new tube and mixed with 1.5 mL of ammonium molybdate ferrous sulfate mixture, which had been prepared by mixing 4 volumes of 1.5% (w/v) ammonium molybdate (Merck, Germany) in 5.5% sulfuric acid (Merck, Germany) with 1 volume of 2.7% (w/v) ferrous sulfate solution. The production of phosphomolybdate was measured spectrophotometrically at 700 nm. From the phosphate standard curve, the amount of liberated phosphate per ml was found and the enzyme activity was calculated (U/mL). One U is defined as the activity that releases 1 μmol of inorganic phosphate from 0.2% (w/v) sodium phytate per minute at pH 5 and 37 °C.

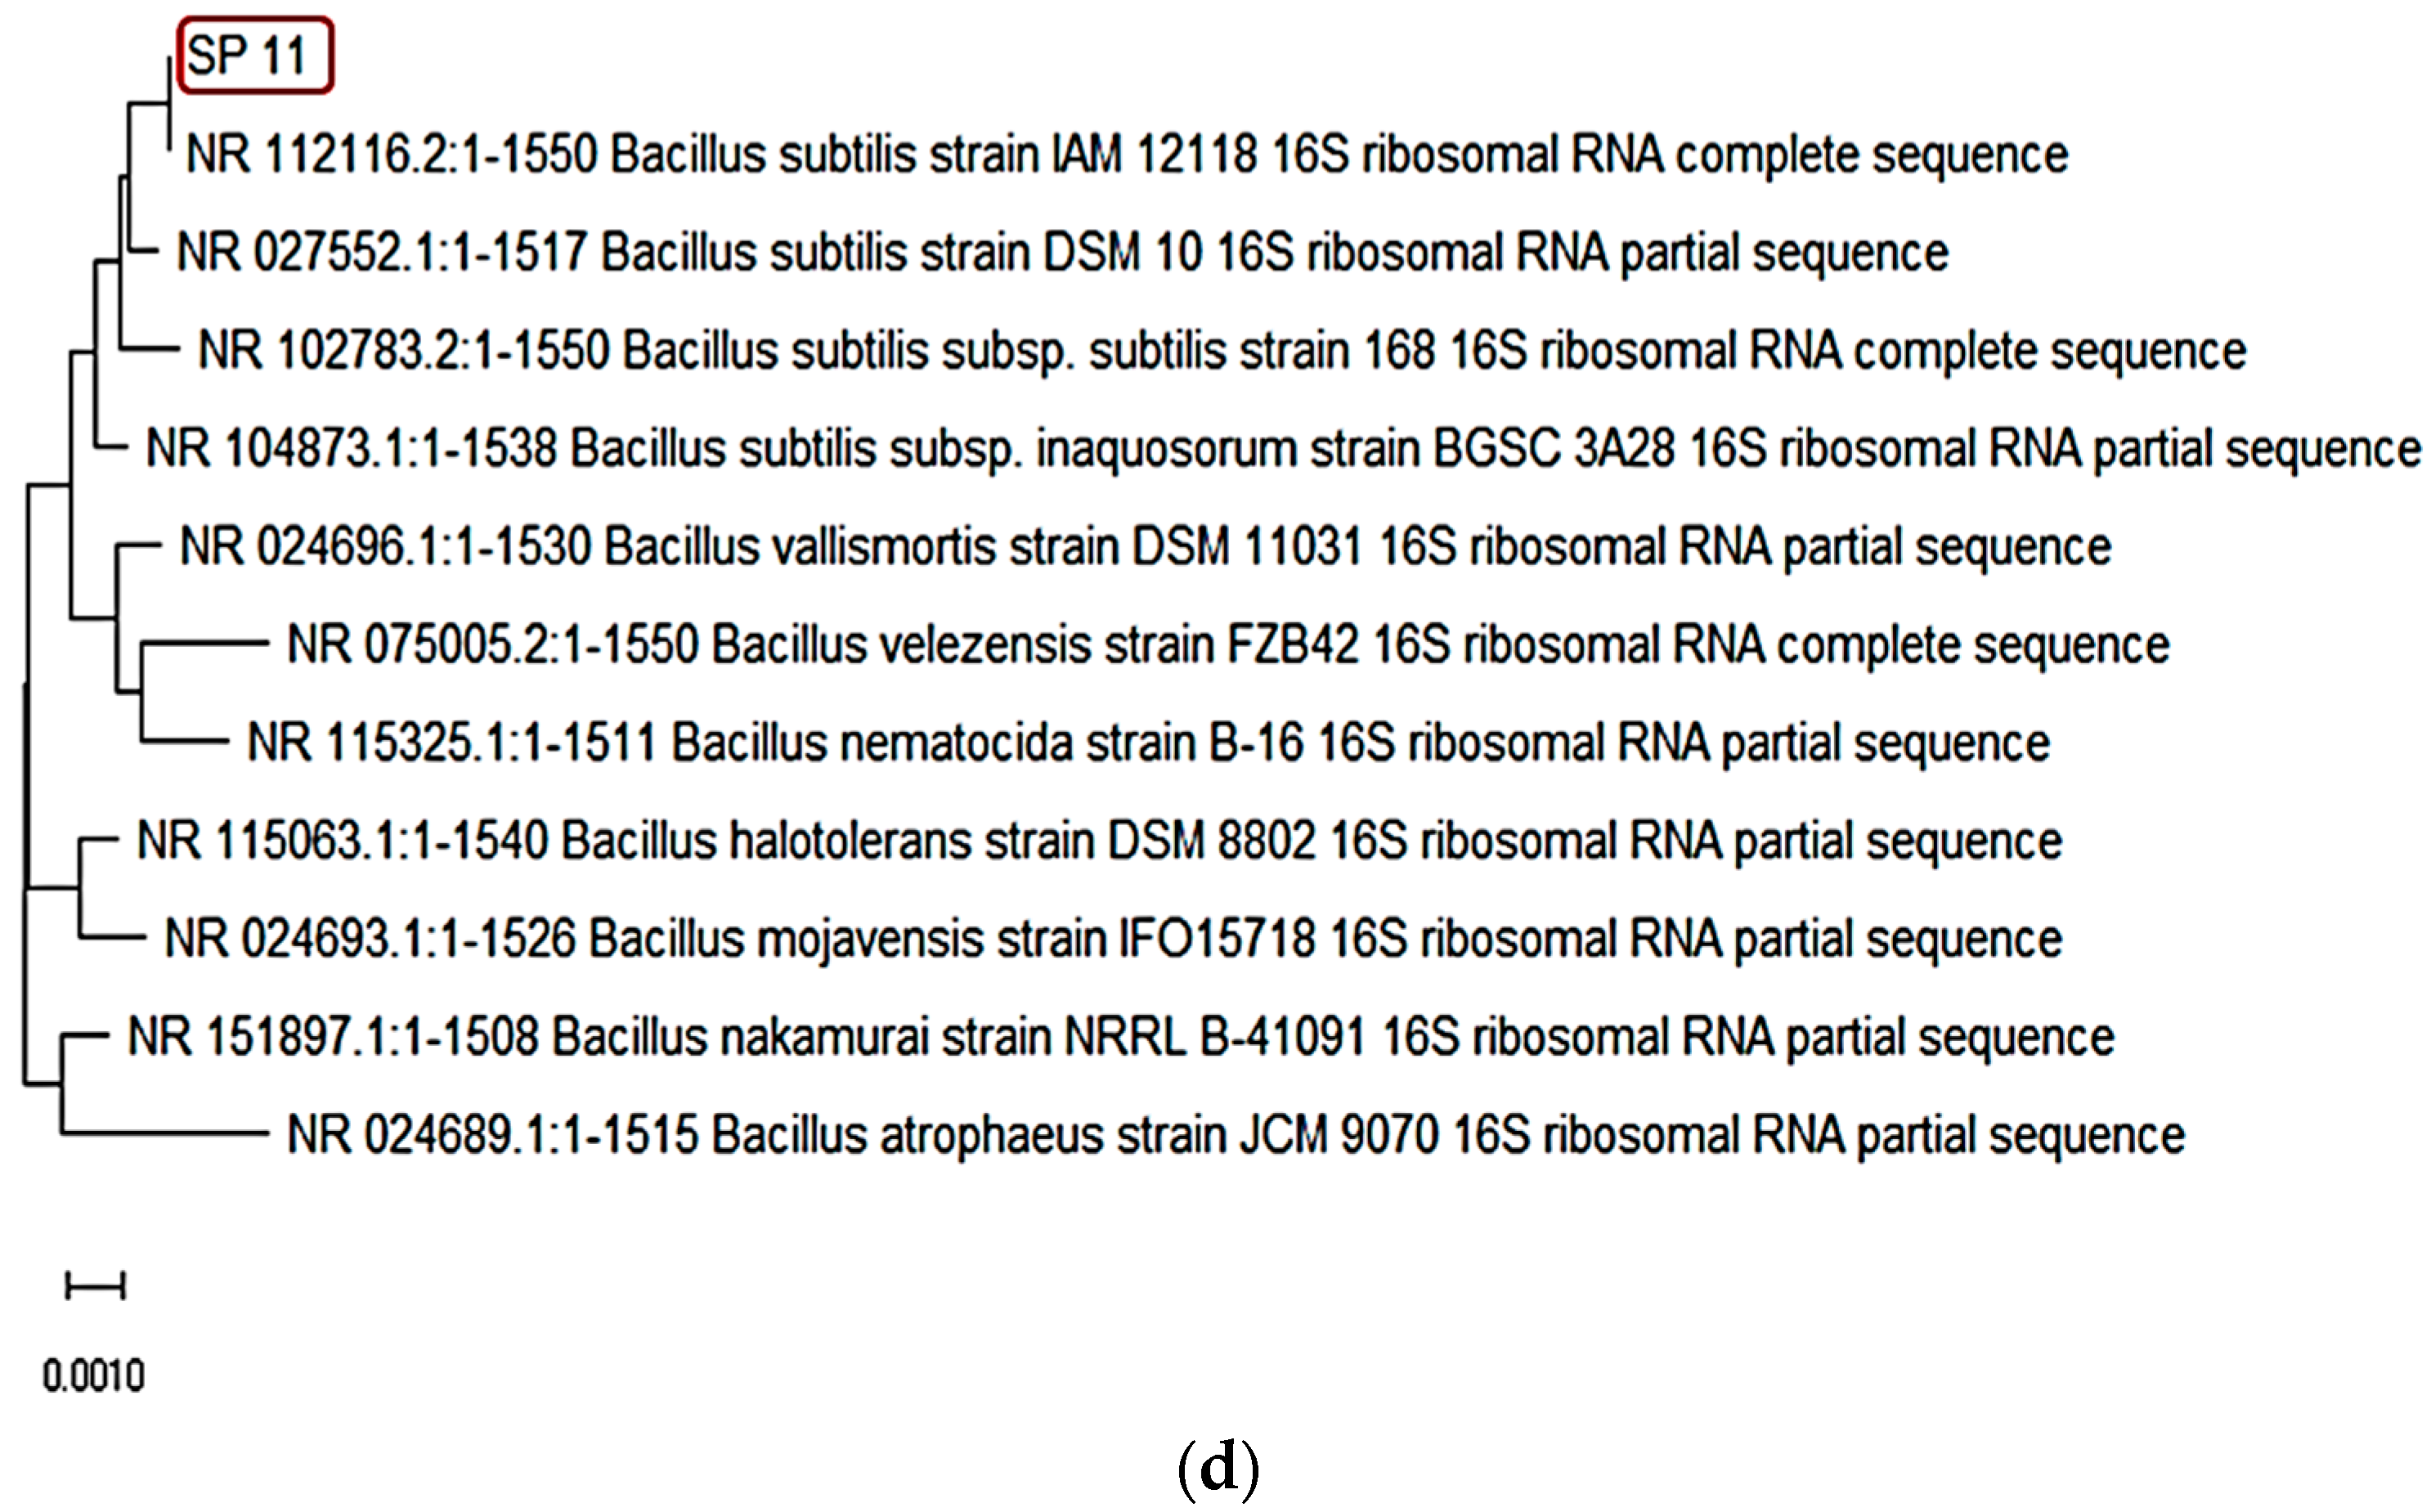
2.5. Identification of SP11 Isolate

Morphological, microscopic, and various biochemical tests [Kligler Iron Agar (KIA), citrate utilization, Motility Indole Urease (MIU), Methyl Red- Voges Proskauer (MR-VP), Starch hydrolysis] were performed for the presumptive identification of the SP 11 strain.
To confirm the identification, 16s rDNA sequencing was performed. Total DNA was prepared from isolates using the technique described by Bravo et al. [22]. 16s rDNA (1465 bp) was PCR-amplified using universal primers, 27F (Forward Primer: 5′AGAGTTTGATCMTGGCTCAG3′) and 1492R (Reverse Primer: 5′CGGTTACCTTGTTACGACTT3′), using a thermocycler (annealing temperature of 50 °C). PCR products were verified by agarose gel electrophoresis and purified using a purification kit (ATPTM Gel/PCR Fragment DNA Extraction Kit, ATP biotech Inc., Miami, FL, USA). Purified PCR products were sequenced by the chain termination method from DNA Solution Lab, Dhaka, Bangladesh. Bio Edit Sequence Alignment Editor and Mega 7.0 software were used for sequence alignments and the construction of phylogenetic trees, respectively.

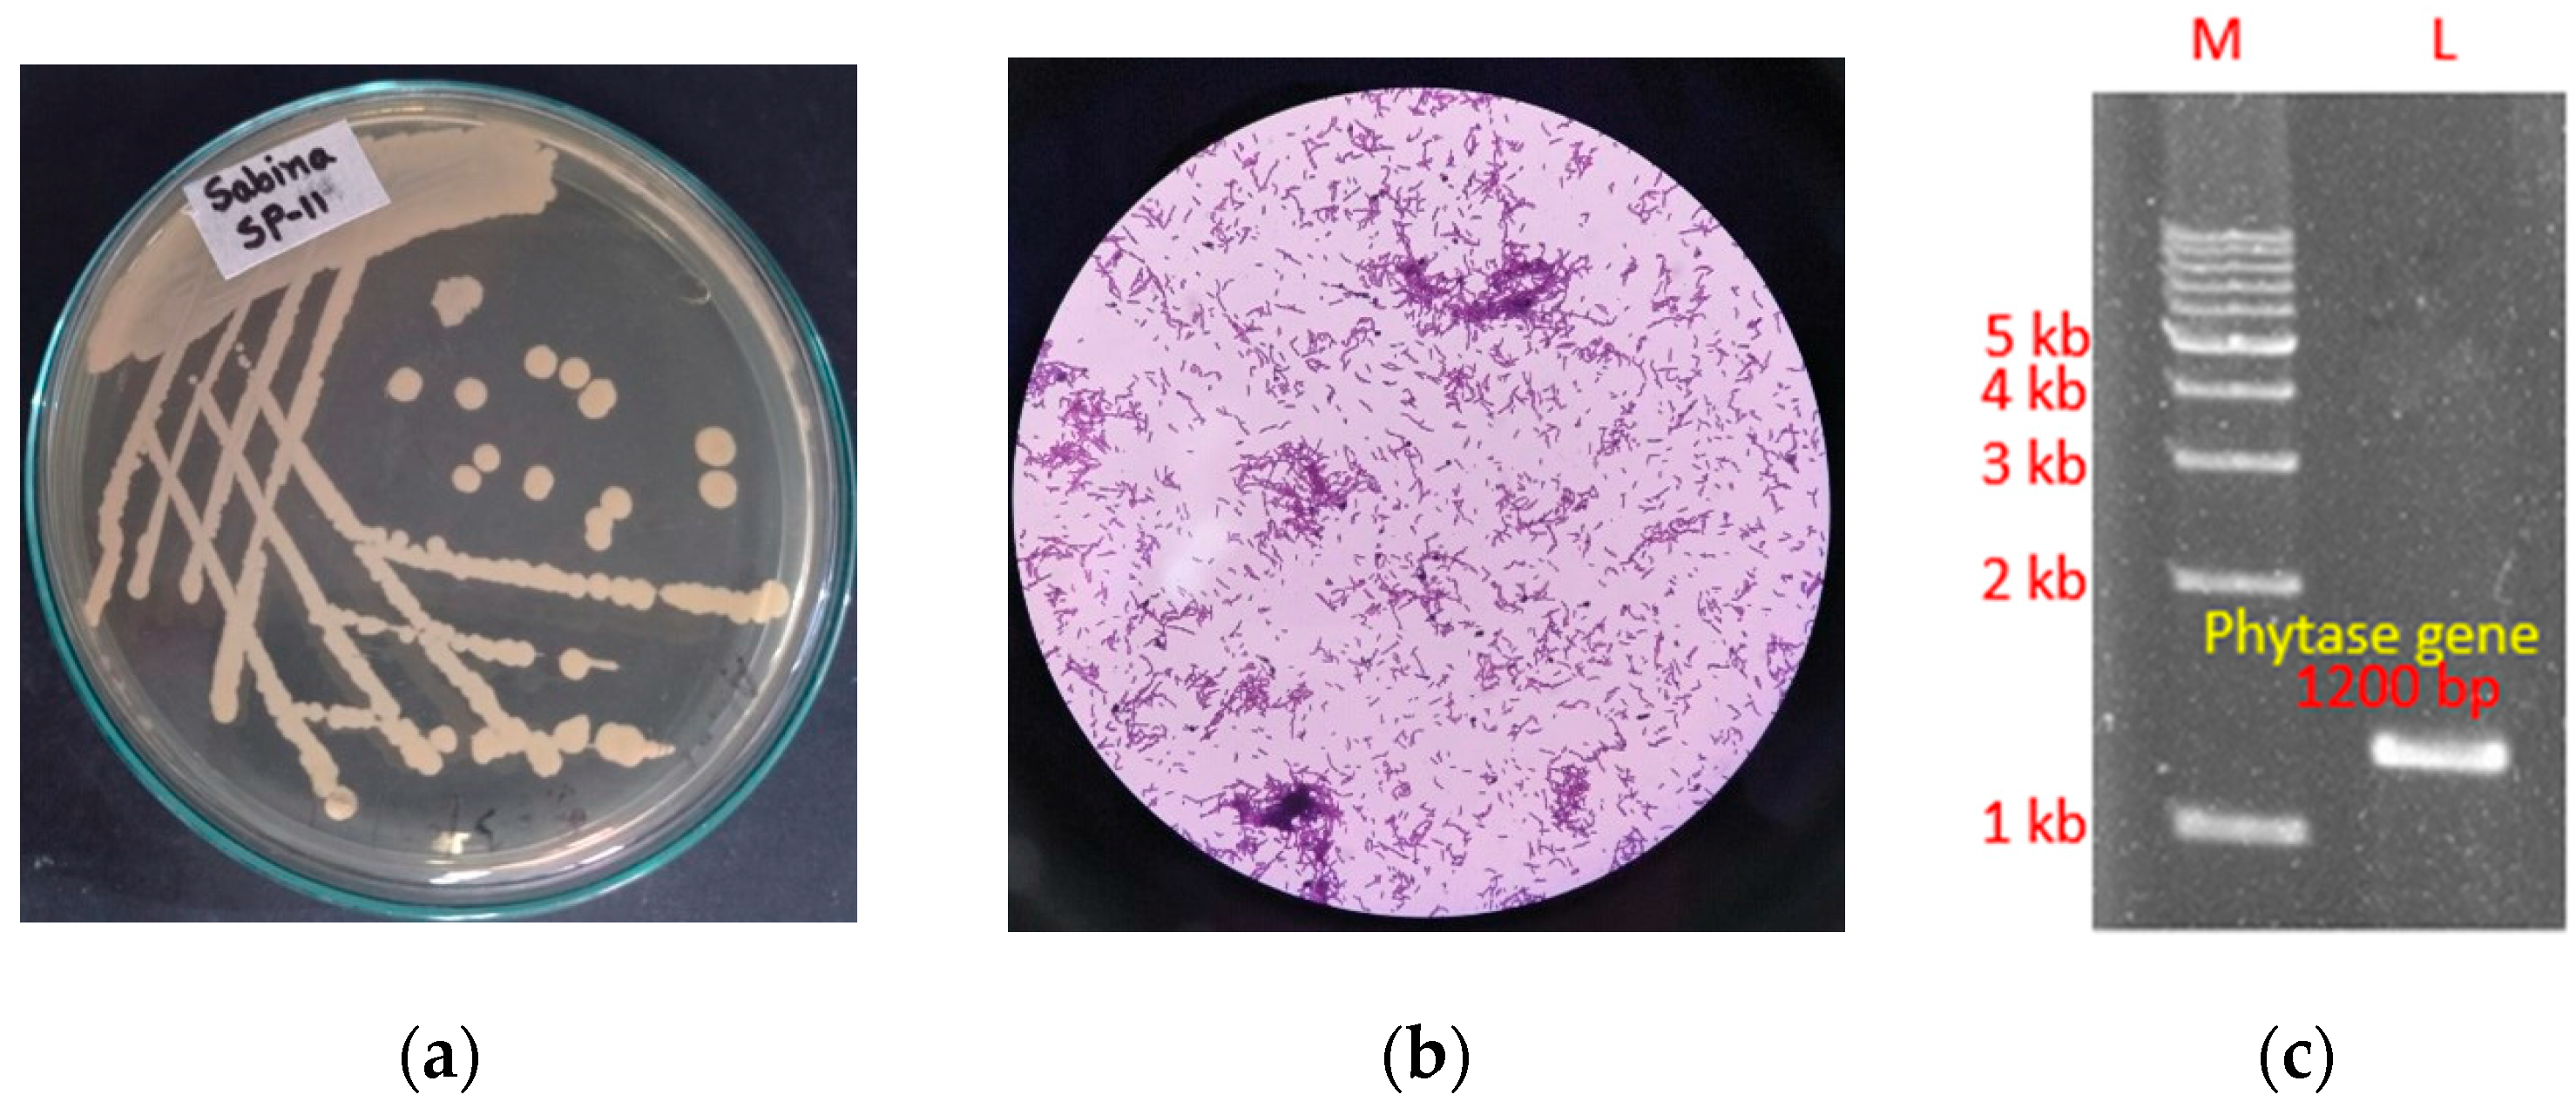
2.6. Detection of Full-Length Gene Encoding Phytase

DNA was isolated by the method described previously. Related sequences were collected from NCBI and primers with overhangs (for later cloning) were designed using MEGA to amplify a 1200 bp phytase gene. The primers were analyzed with OligoAnalyzer. Phyt.CD S-F: 5′-GGATCCATGAAGGTTCCAAAAACAATGCTGC-3′ (Tm = 61 °C) and Phyt.CD S-R: 5′-CTCGAGCTAGCCGTCAGAACGGTCTTTCA-3′ (Tm = 63.5 °C). PCR was performed (each step took 30 s for 35 cycles) to obtain the amplicon with an annealing temperature of 58 °C.

2.7. Single-Factor Analysis

The effects of inoculum size, incubation temperature, pH, and shaking speed on phytase production by Bacillus subtilis SP11 were evaluated by changing a single factor at a time. Fermentation was conducted using various inoculum sizes (1, 5, and 10 (% v/v) of overnight (20 h) grown culture), temperatures (30 °C, 37 °C, and 42 °C), media pHs (3, 4, 5, 6, control, 7, 8, 9, and 10), and shaking speeds (0, 60, 120, and 180 rpm).

2.8. Plackett–Burman Design (PBD)

PBD was used to evaluate the effects of different media components on phytase production. In total, 19 factors were assessed, including 7 cheap raw materials for carbon, nitrogen, and mainly for phytate sources (rice bran, wheat bran, soybean meal, corn meal, mustard meal, linseed meal, and sesame meal; these substrates were bought from the local market of Dhaka city), 4 carbon sources (sugar cane molasses bought from the local market and glucose as rapid metabolizing, sucrose and citrate as slow metabolizing), 3 nitrogen sources [inorganic (ammonium nitrate) and organic (tryptone and yeast extract)], 1 phosphate source (K2HPO4), and 4 mineral sources (CaCl2, MgCl2, FeSO4, and MnSO4). Each factor had 2 levels, a high level (+1) and a low level (−1), as shown in Table 1.
A total of 24 experimental runs were performed and the responses were expressed by the first-order model, as shown in the following equation:
Y = β 0 + n = 1 19 β i X i
where Y represents the response variable, β0 is the interception coefficient, and βi is the coefficient of the linear effects of the 19 independent variables (X1X19).

2.9. Central Composite Design (CCD)

CCD was used to determine the optimum levels of three positive significant factors identified in the Plackett–Burman Design (mustard meal, tryptone, and yeast extract) and study the interactions among them for maximum phytase production. Each variable had the following five levels: two axial points (−α, +α), two cube points (−1,+1), and a center point (0), where α is 1.68. In total, 20 experimental runs were conducted, with center points repeated six times, as per the design. The following quadratic polynomial equation depicts the statistical relationship between the dependent variable phytase activity (Y) and the selected independent variables:
Y = β 0 i   β i X i i i   β i i X i 2 i j   β i j X i X j
where Y is the predicted response (phytase activity U/L); β0 is the model intercept; Xi and Xj are the independent variables, βi is linear coefficients; βij is the cross-product coefficients; and βii is the quadratic coefficients. For optimizing and determining the interaction coefficients across many parameters, the analysis of contour and surface plots utilized Rstudio.

2.10. Characterization of Crude Phytase

The thermostability of the enzyme was evaluated by treating the crude enzyme at 20 °C, 30 °C, 40 °C, 50 °C, 60 °C,70 °C, 80 °C, and 90 °C in a water bath for 1 h. After heat treatment, the enzyme assay was performed under standard assay conditions. A control was set which was not subject to any heat treatment. To investigate the optimum temperature for the enzyme, the enzyme assay was performed at varying assay temperatures, including 25 °C, 30 °C, 37 °C, 41 °C, 50 °C, 56 °C, 65 °C, and 70 °C. Other conditions were as per the standard assay conditions. To determine the optimum pH for phytase activity, the enzyme assay was performed in various pH buffers (3,4,5,6,7, and 8). All the standard protocols for the phytase assay were followed, except the use of specific buffers for different pHs, and individual standard curves were used for the buffers. The effect of metal ions on the enzyme’s catalytic behavior was studied by pre-incubating phytase enzyme at room temperature in a specified ion (5 mM final concentration)-containing buffer solution. The metals ions were Ca2+, Cu2+, Mg2+, Fe2+, Zn2+, Mn2+, (as CaCl2·2H2O, CuSO4·5H2O, MgSO4·7H2O, FeSO4·7H2O, and ZnSO4·7H2O), and EDTA. After 1 h of incubation, substrate (0.2% Na-phytate) was added, and the relative activity of the enzyme was measured under standard assay conditions (untreated enzyme was taken as control).

2.11. In Vitro Dephytinization

A modified method from Suresh S and Radha K [23] was adapted to test the applicability of the crude enzyme in dephytinization. In total, 1 g of wheat bran or mustard meal was placed into 18 mL of 0.1 M pH 5 acetate buffer in a 100 mL Erlenmeyer flask. Then, 2 mL of crude phytase was added and incubated at 120 rpm and 37 °C. After incubation for 30, 60, 90, and 120 min, the suspension was centrifuged at 10,000× g for 10 min and the amount of inorganic phosphorus was detected by the method described previously.

2.12. Statistical Analysis

For statistical analyses, experiment designs, and data visualization, Minitab 21.4.2, Graphpad prism 9, and Rstudio 4.1 were used. Statistical significance among means was assumed at a 5% significance level

3. Results

3.1. Isolation and Quantitative Screening of Phytase-Producing Bacteria

After 72 h of incubation in the phytate-specific medium, twelve isolates were found to be positive, indicated by clear zones around the colonies. Here, SP11 showed the largest zone ratio (2.3) while SP13 showed the smallest zone ratio (1.3), as shown in Table S1 and Figure 1a. The highest activities were seen after 72 h for all 12 isolates (Figure 1b). Among the isolates, SP11 showed the highest activity (118 U/L) while DM1 showed the least activity (60 U/L) in the broth.

3.2. Identification of the SP11 Isolate and Detection of Full-Length Gene Encoding Phytase

The colonies (Figure 2a) were opaque and creamy-white, flat circular, and large. Microscopic observation showed that SP11 was a Gram-positive rod-shaped bacterium (Figure 2b). Biochemical test results are provided in Table S2. Based on these observations, the presumptive identification was Bacillus spp. Amplification of the 1200 bp long gene encoding phytase was performed by polymerase chain reaction, as shown by the agarose gel electrophoresis in the second lane (Figure 2c), which confirmed the presence of the gene in the strain. Blast analysis of the 16S rDNA sequence showed that the similarity of the 16S rDNA sequence of the strain was as high as 99.85% with one of the Bacillus subtilis strains. Using MEGA 7.0 for cluster analysis, we found that the strain could be clustered with Bacillus subtilis IAM 12118 (Figure 2d). Therefore, the strain was named Bacillus subtilis SP11.

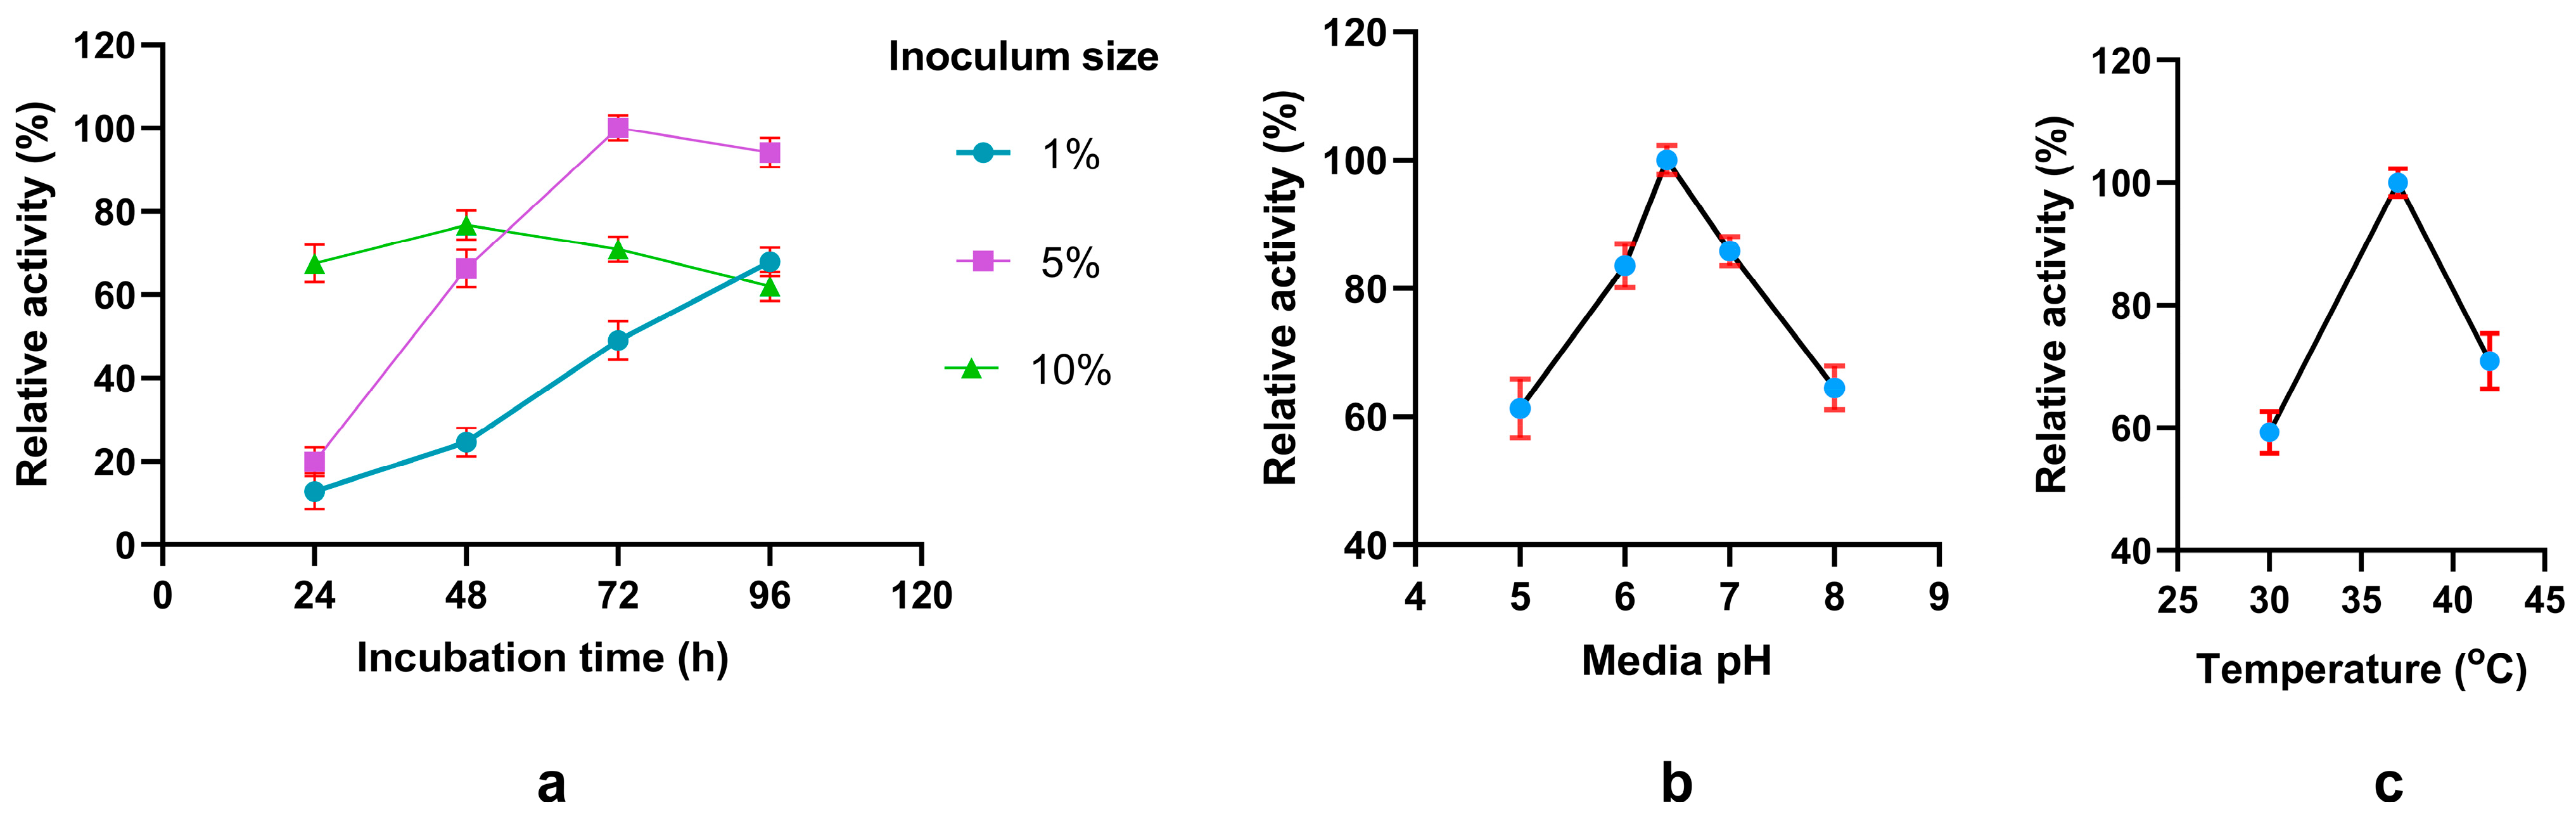
3.3. Single-Factor Analysis

The effects of different incubation times, inoculum sizes, incubation temperatures, and media pHs on phytase production were evaluated. Phytase production was maximum for a 5% inoculum size at 72 h (Figure 3a), while the optimum pH and temperature were pH 6.5 and 37 °C, respectively (Figure 3b, c). Within the tested periods, the effect of a 10% inoculum size was not very sharp and a 1% inoculum size did not reach its peak, but the time to reach its peak can be safely assumed to not be optimum for fermentation.

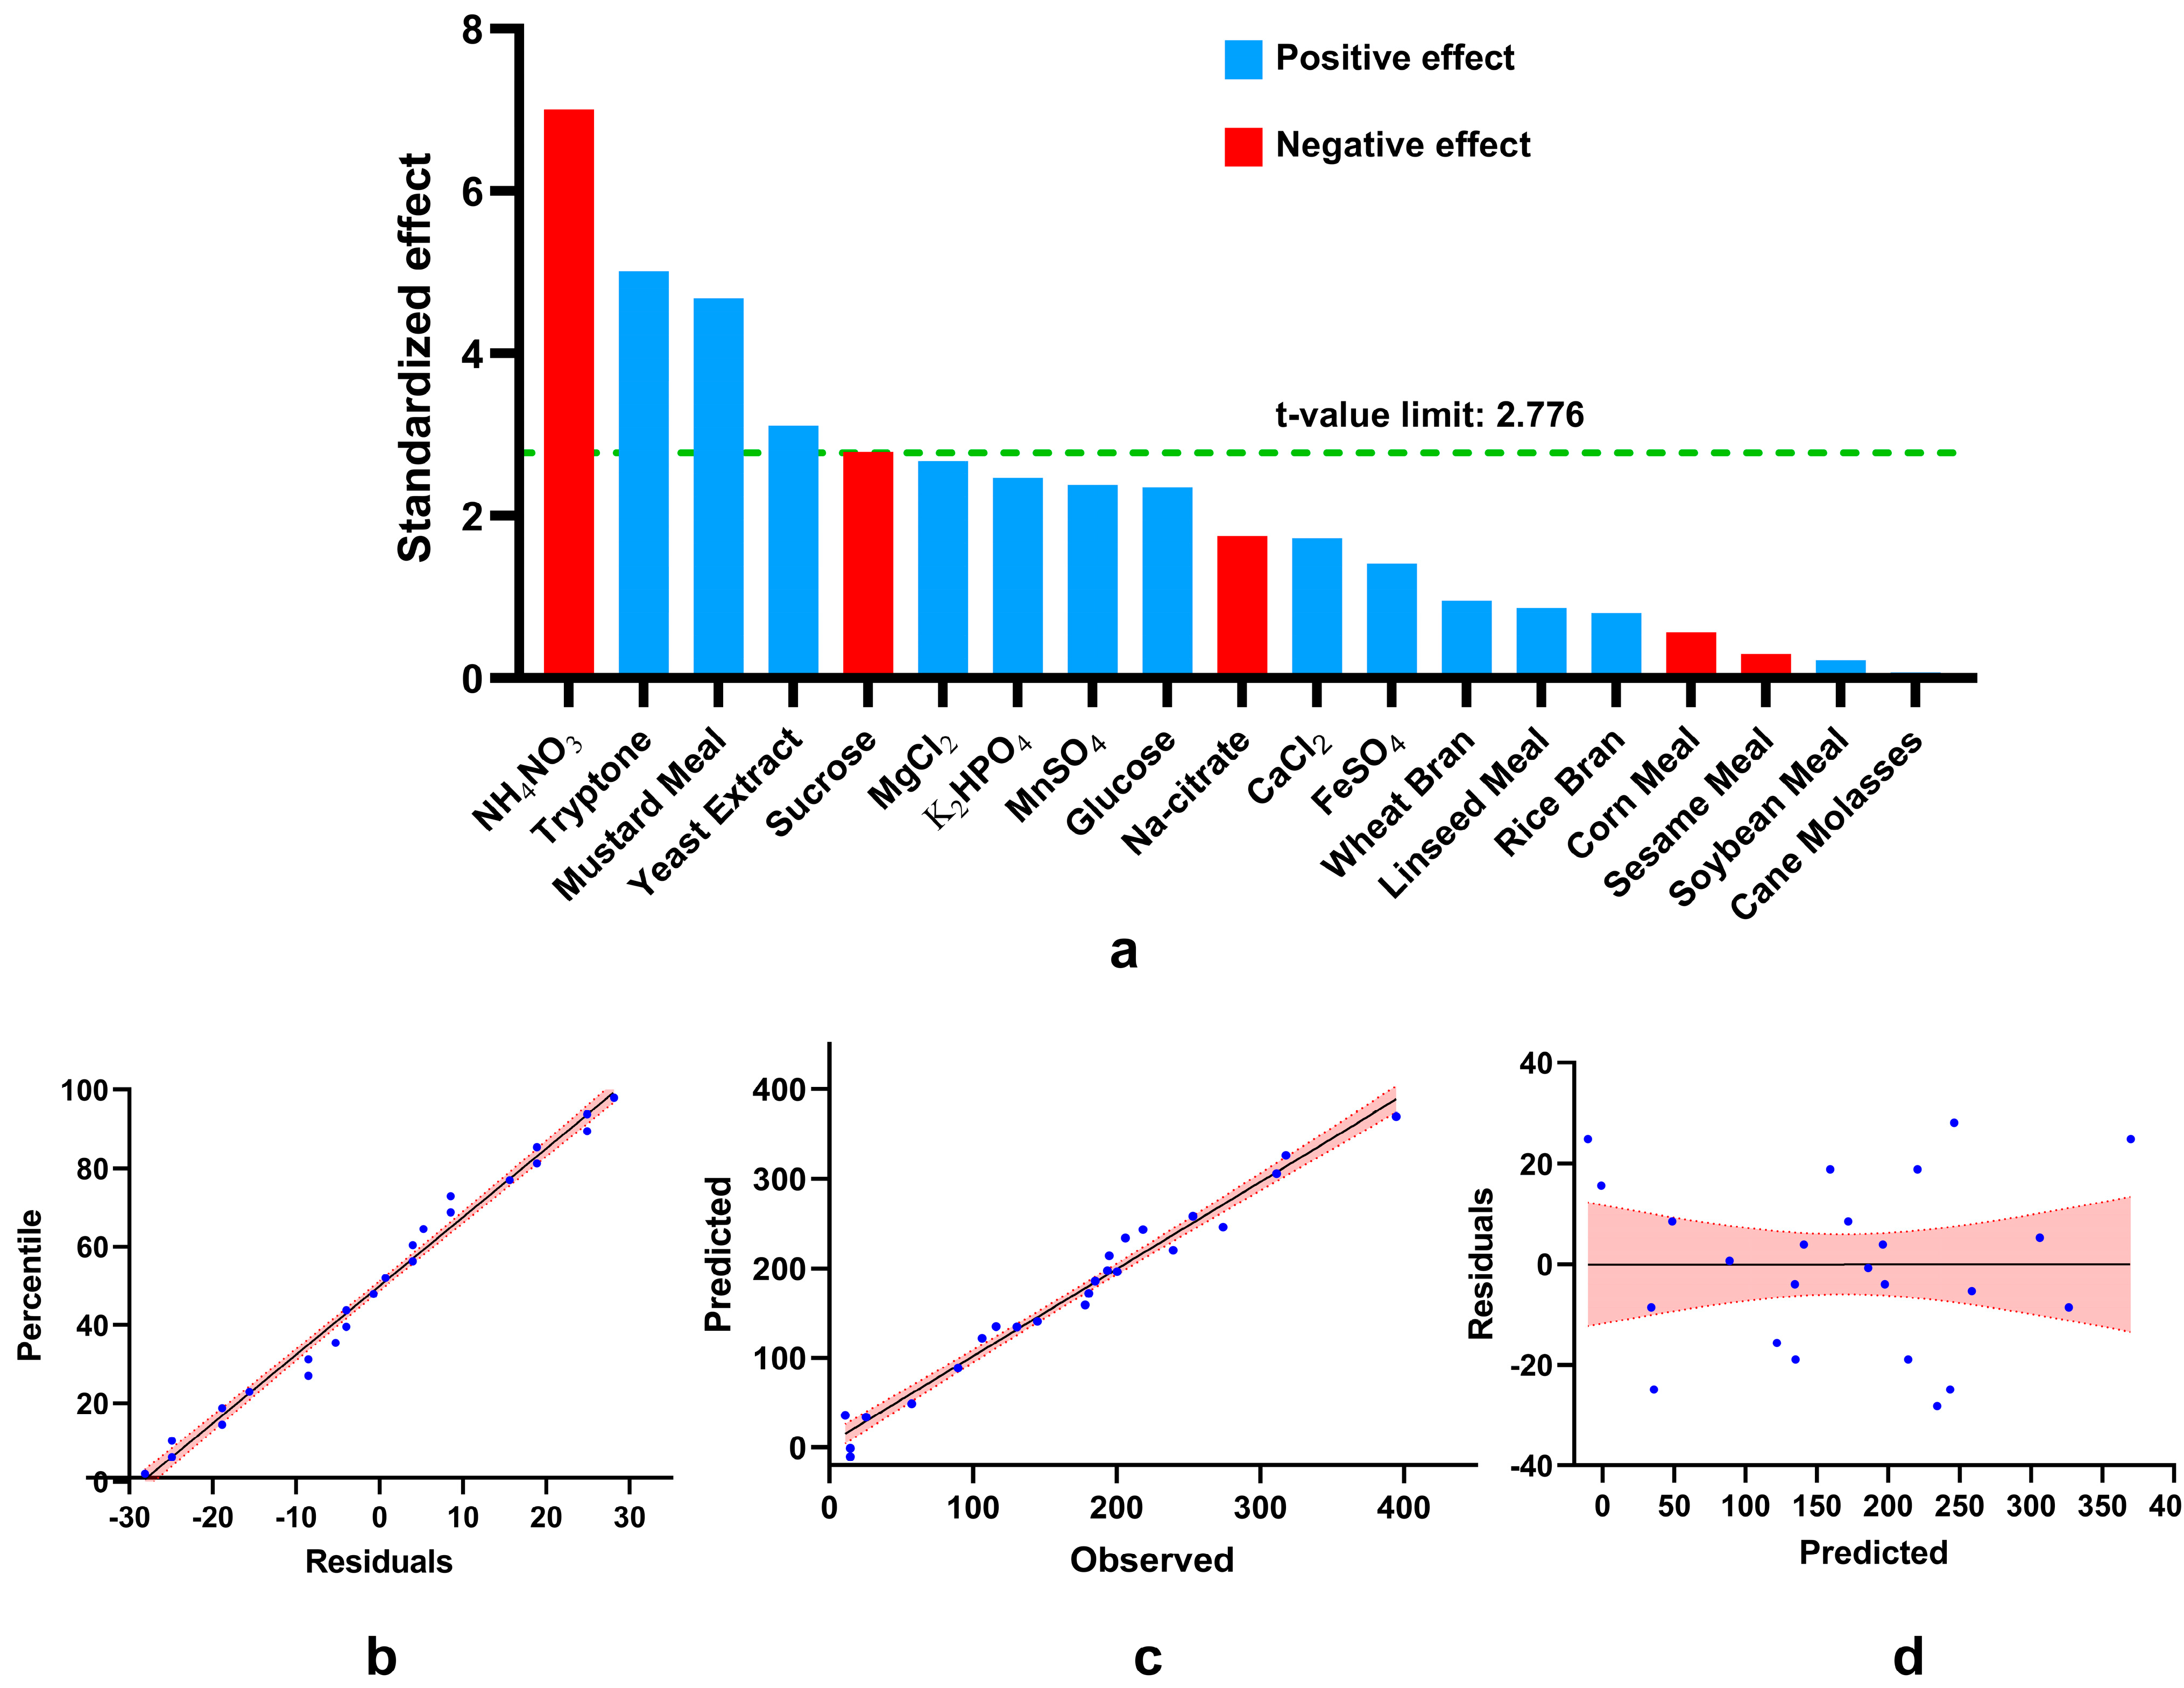
3.4. Determining Significant Variable for Phytase Production Using Plackett–Burman Design

In order to screen the most significant variables that affected phytase production by Bacillus subtilis SP11, a Plackett–Burman Design (PBD) was utilized with the 19 independent variables shown in Table 1.
The experimental design with 24 experimental runs is shown in Table 2, along with the results. Phytase production ranged from 11.05 U/L to 394.57 U/L, a wide range, indicating the importance of optimization and finding significant variables.
The coefficients, p-values, and t-statistics obtained by statistical analysis are shown in Table 3, where smaller p-values (at a 5% significance level) and larger absolute values of t-statistics (critical value 2.776) indicate significant variables; positive and negative signs of the coefficients or t-values indicate positive and negative effects, respectively.
By analyzing the results, five variables were found to be significant, where three were positively significant (mustard meal, tryptone, and yeast extract) and two were negatively significant (NH4NO3 and sucrose), as depicted in Figure 4a.
The remaining fourteen variables were nonsignificant, where some had positive effects (rice bran, wheat bran, soybean meal, linseed meal, cane molasses, glucose, K2HPO4, CaCl2, MgCl2, FeSO4, and MnSO4) while others had negative effect (corn meal, sesame meal, and sodium citrate). The maximum production was seen in fourth run, where positive significant variables had high values and negative significant variables had low values. The first-order polynomial regression equation representing the production of phytase activity is as follows:
Y phytase activity = 169.09 + 6.56 X1 + 7.73 X2 − 4.55 X3 + 1.83 X4 − 2.45 X5 + 38.22 X6
+ 7.01 X7 + 0.57 X8 + 19.14 X9 − 57.08 X10 + 40.87 X11 + 25.40 X12 + 20.15 X13
22.77 X14 + 14.04 X15 + 21.80 X16 + 11.50 X17 + 19.41 X18 − 14.24 X19

3.5. Evaluation of the Model’s Fitness

ANOVA results (Table 3) show that the model has a p-value of 0.03, indicating that changes in the variables are significantly associated with changes in phytase production. A high R2 value (97.38%) indicates a good fit for the model, as it is unable to explain only 2.62% variation in the results. The normal probability plot (Figure 4b) shows that the residuals are near the diagonal line, which indicates that they are distributed normally, verified with a p-value of 0.768. Figure 4c presents the plot of the predicted vs. observed values of phytase production. Data points that gather around the diagonal line suggest a good correlation between the predicted and observed values. This shows that the predicted phytase production fits well with the observed results. In Figure 4d, predicted values are plotted against the residuals, showing the random but equal distribution of residuals below and above the x-axis, suggesting a lack of any recognizable pattern; thus, it supports the adequacy of the appropriate model. Overall, this indicates that the model is well fitted.

3.6. Central Composite Design to Determine the Optimum Amount

Based on the t-values from the PBD, three positive significant variables, mustard meal, tryptone, and yeast extract, were found. These three components were used in the response surface methodology model to determine their optimum level and interaction. Twenty experimental runs were conducted using the Central Composite Design, with six central points, fourteen factorial points, and six axial points (shown in Table 4). Phytase production varied depending on the composition and ranged from 153.9 U/L to 427 U/L, occurring in factorial points. The highest activity was achieved when each of the three factors were at a high level, and the lowest activity was seen when mustard meal and tryptone were at a low level but yeast extract was at a high level.

3.7. Statistical Analysis of the Central Composite Design

Multiple regression analysis (Table 5) shows that yeast extract (p-value: 0.003) has a critical role in optimization. It also suggests a significant positive interaction between mustard meal and yeast extract (p-value: 0.007) and tryptone and yeast extract (p value: 0.013). To determine the relationship between phytase production (response) and mustard meal (X6), tryptone (X11), and yeast extract (X12), a second-order polynomial equation is deducted to predict the response (Y) in terms of the independent variables X6, X11, and X12.
Y = 5 + 179.4 X 6 + 162 X 11 + 55 X 12 59.4 X 6 2 62.9 X 11 2 133.7 X 12 2 49.1 X 6 X 11 + 99.4 X 6 X 12 + 106.3 X 11 X 12
The ANOVA (Table 5) suggests that the model is very significant, with a high F-value (9.26) and low p-value (0.001). Overall, this CCD’s linear, square, and two-way interaction effects are significant, with a p-value less than 0.05. The model has a good fit of data, as suggested by a ‘lack of fit’ value of 0.061, which indicates that the probability of concluding that the model does not explain the data well when it actually does is 6.1%. So, it is not evident that the model does not fit the data considering the 5% significance level. An R2 value of 89.28% suggests that it can explain the 89.28% variability in the results and cannot account for the rest of the 10.72% error.

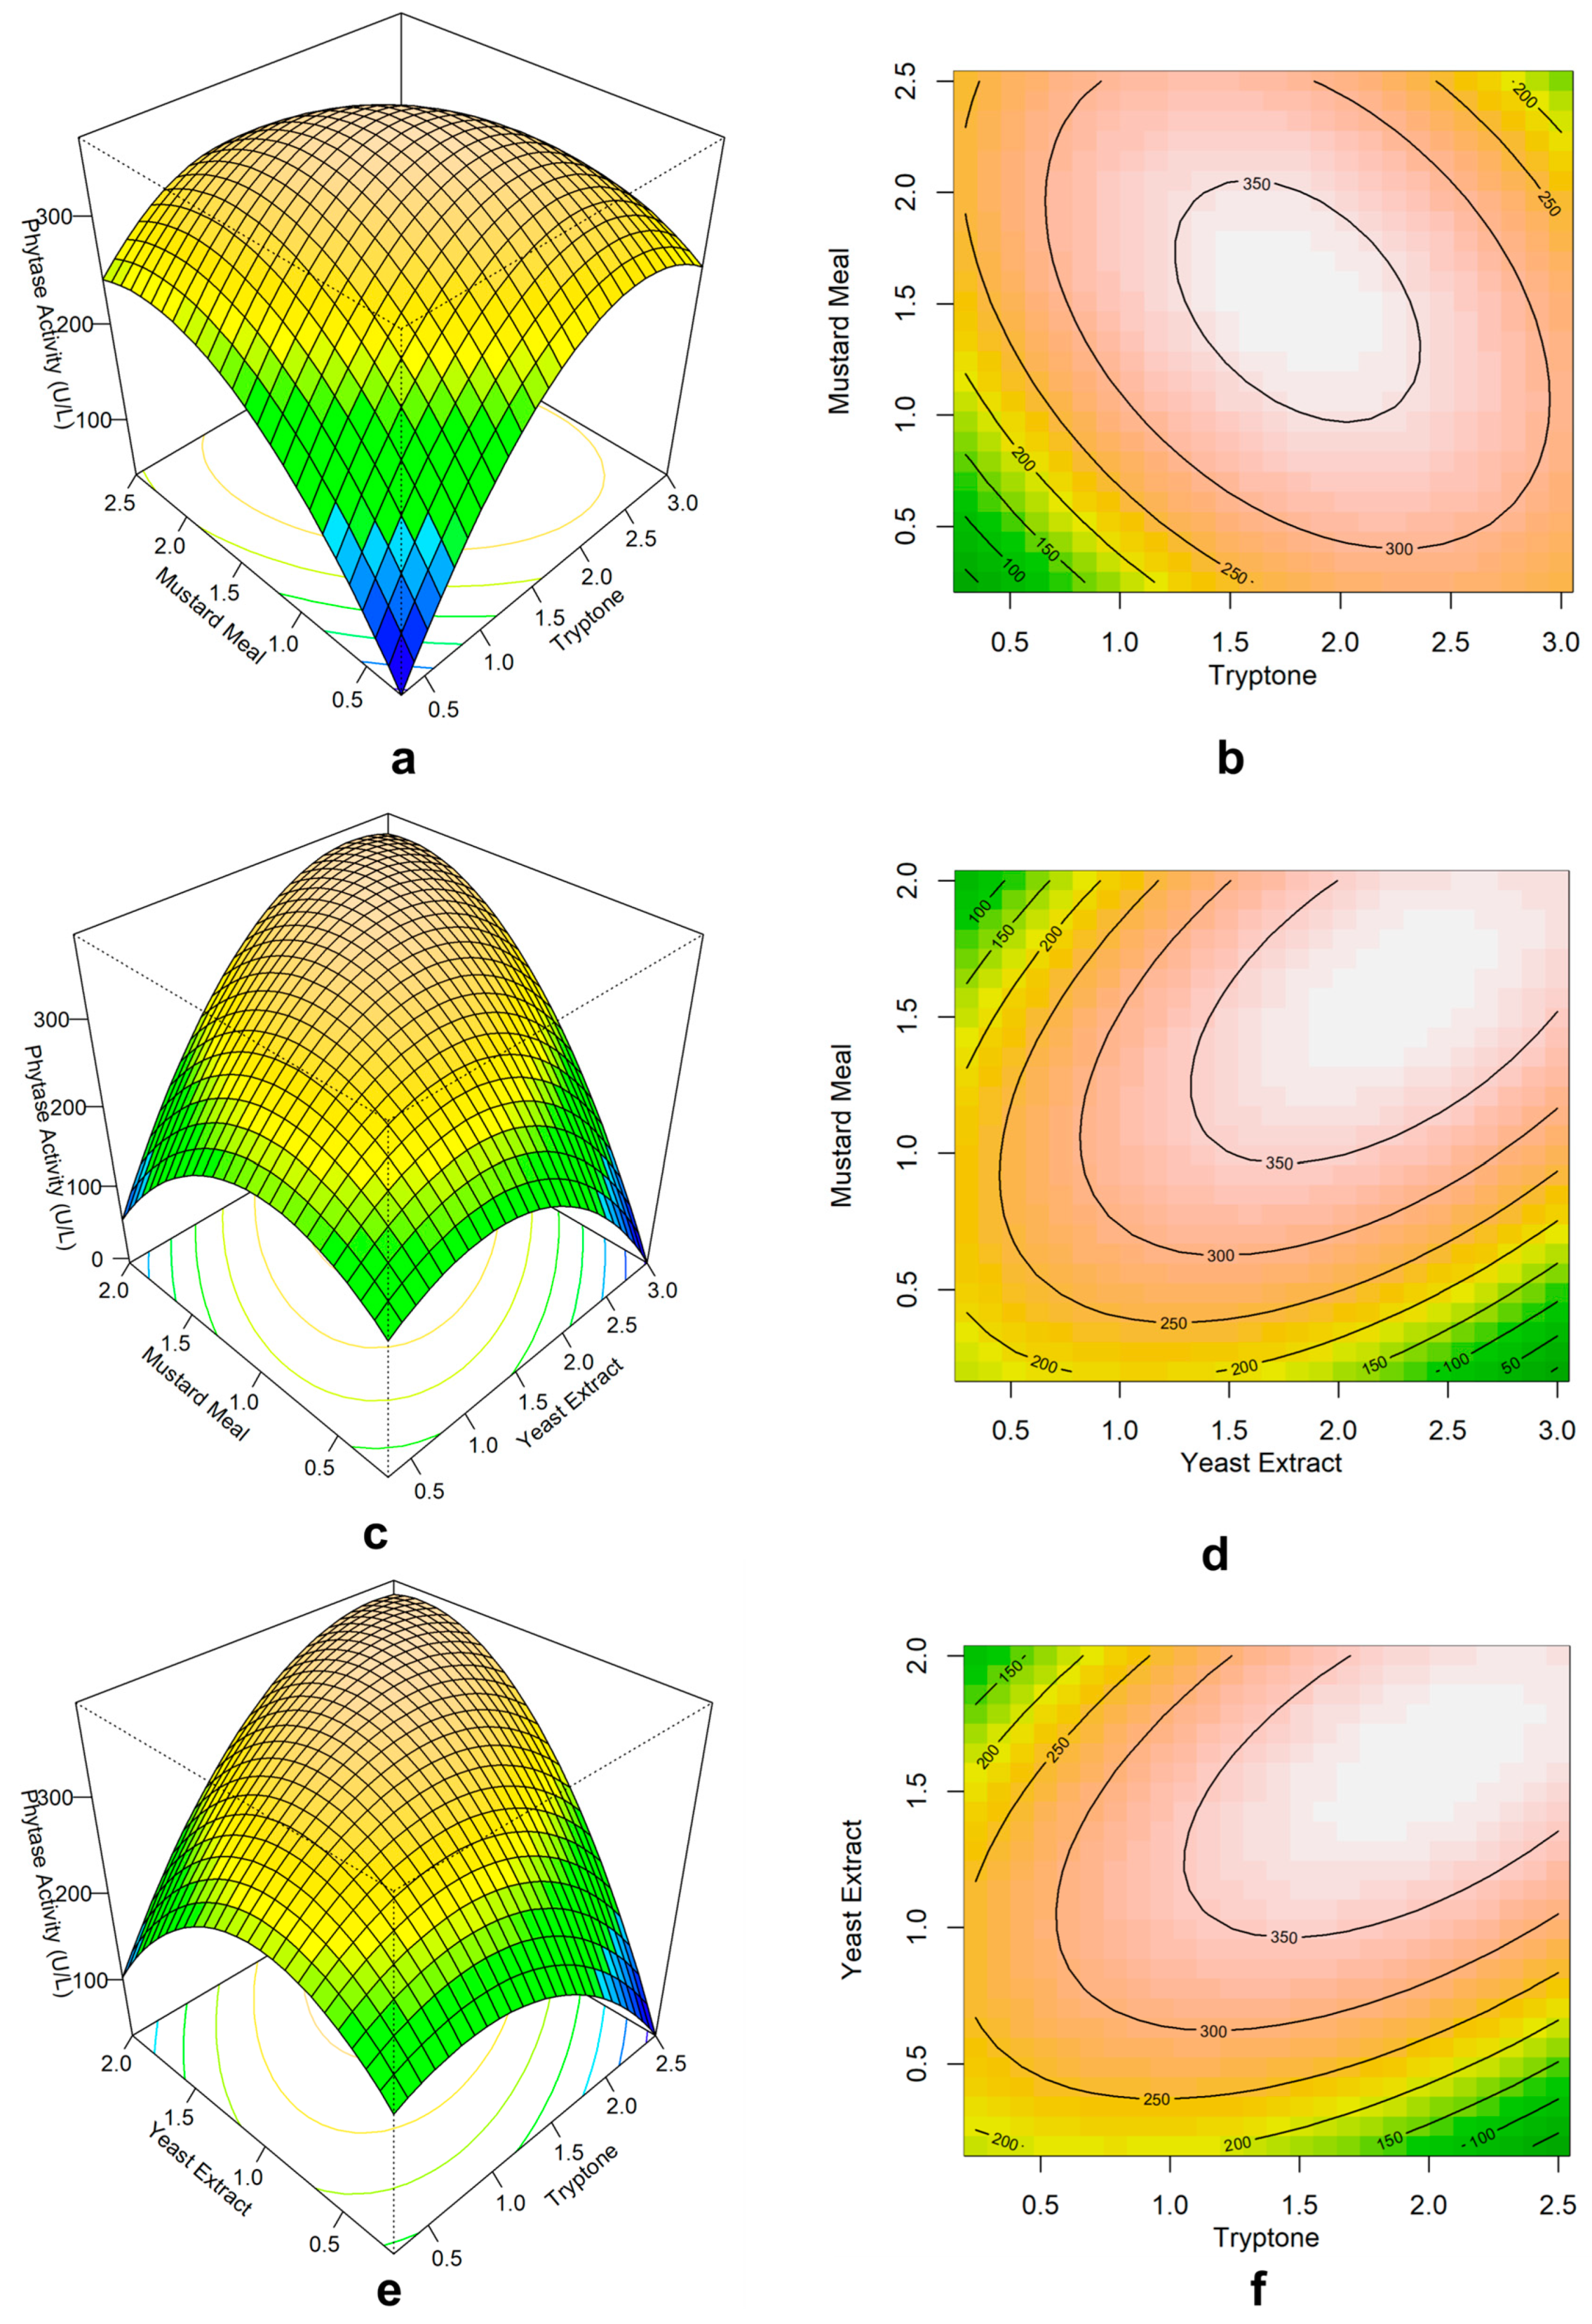
3.8. Response Surface Plots and Contour Plots

To investigate the interactive effects of the three variables on phytase production, response surface plots and contour plots (Figure 5) were drawn against any two variables while having another variable fixed at its central level. In the response surface plots, the Z-axis refers to the phytase activity (response variable). Figure 5a,b demonstrate the interactive effect of mustard meal (X6) and tryptone (X11) on phytase production. Their mutual interaction is antagonistic (negative coefficient) but non-significant (p-value: 0.063) considering a 5% significance level. While yeast extract is held at the central level, it can be seen that phytase production is maximized when the level of mustard meal and tryptone is between moderate and high levels. There is low phytase activity when both are at the lowest level, but when one variable is at the highest level and the other one is at the lowest level, a modest amount of phytase activity is shown. However, when both factors are at the highest level, production decreases. This suggests that the antagonism between these two factors when yeast extract is moderate is least evident when both are between moderate and high levels, but more evident when they are at low levels.
Figure 5c,d show the phytase activity as a function of mustard meal and yeast extract. These two components have significant synergistic effects (p-value: 0.007) on phytase production, and there is still a modest amount of phytase activity even when both variables are at the lowest level. When tryptone is fixed at the central level, phytase production decreases when mustard meal and yeast extract levels are below moderate levels, while maximum production occurs around high levels. A similar case is seen in Figure 5e,f, which indicate a significant synergistic effect of tryptone and yeast extract on phytase production. These graphs show that there is increased phytase activity when yeast extract is present, indicating the critical role of yeast extract in the production of phytase from B. subtilis SP11, also evident from the regression analysis (p-value: 0.003, t-value: 3.95). In our experimental observations, we obtained the highest activity at the factorial points where each of the three variables was at a high level; this can be justified by the plots. The antagonism of mustard meal and tryptone at a high level might have been slightly masked by the synergistic effect of high levels of yeast extract with both of them.

3.9. Verification of the Model

Response optimizer in Minitab was used to find the optimum composition of the three factors for the maximum phytase production. The predicted value was 401 U/L for 2.21% mustard meal, 1.95% tryptone, and 1.8% yeast extract, with 0.91 composite desirability and a 95% confidence level from 337 to 465.3 U/L activity. Experimental runs were conducted to verify the prediction, and we obtained 436 U/L, which falls within the 95% confidence level. The verification experiment demonstrated that the model efficiently predicted the ideal media composition for phytase production by B. subtilis SP11 with an approximately 92% accuracy (Table 6). Although one of the experimental results (third run) in the CCD had higher activity than the predicted maximum, the verification run confirmed the acceptability of the prediction. The reason for this discrepancy is that the regression equation predicted a lower activity for the third run than the observed result.

3.10. Time Course Profile

Figure 6 demonstrates the kinetics of the shake flask fermentation of phytase. The bacterial growth reaches the stationary phase within 24 h and the death phase at 60 h, as indicated by cell density (absorbance at O.D600). Carbohydrates are rapidly utilized within 12 h from 12.6 g/L to 2.6 g/L and then maintained at an almost stationary level with a very slight decrease to 1.9 g/L. However, protein content initially increases from 1.5 g/L to 1.67 g/L at 6 h and slowly decreases afterward to 1 g/L. Both phytase and protease have peaks (90 U/mL and 435 U/L, respectively) during the death phase, at 72 h and 84 h, respectively.

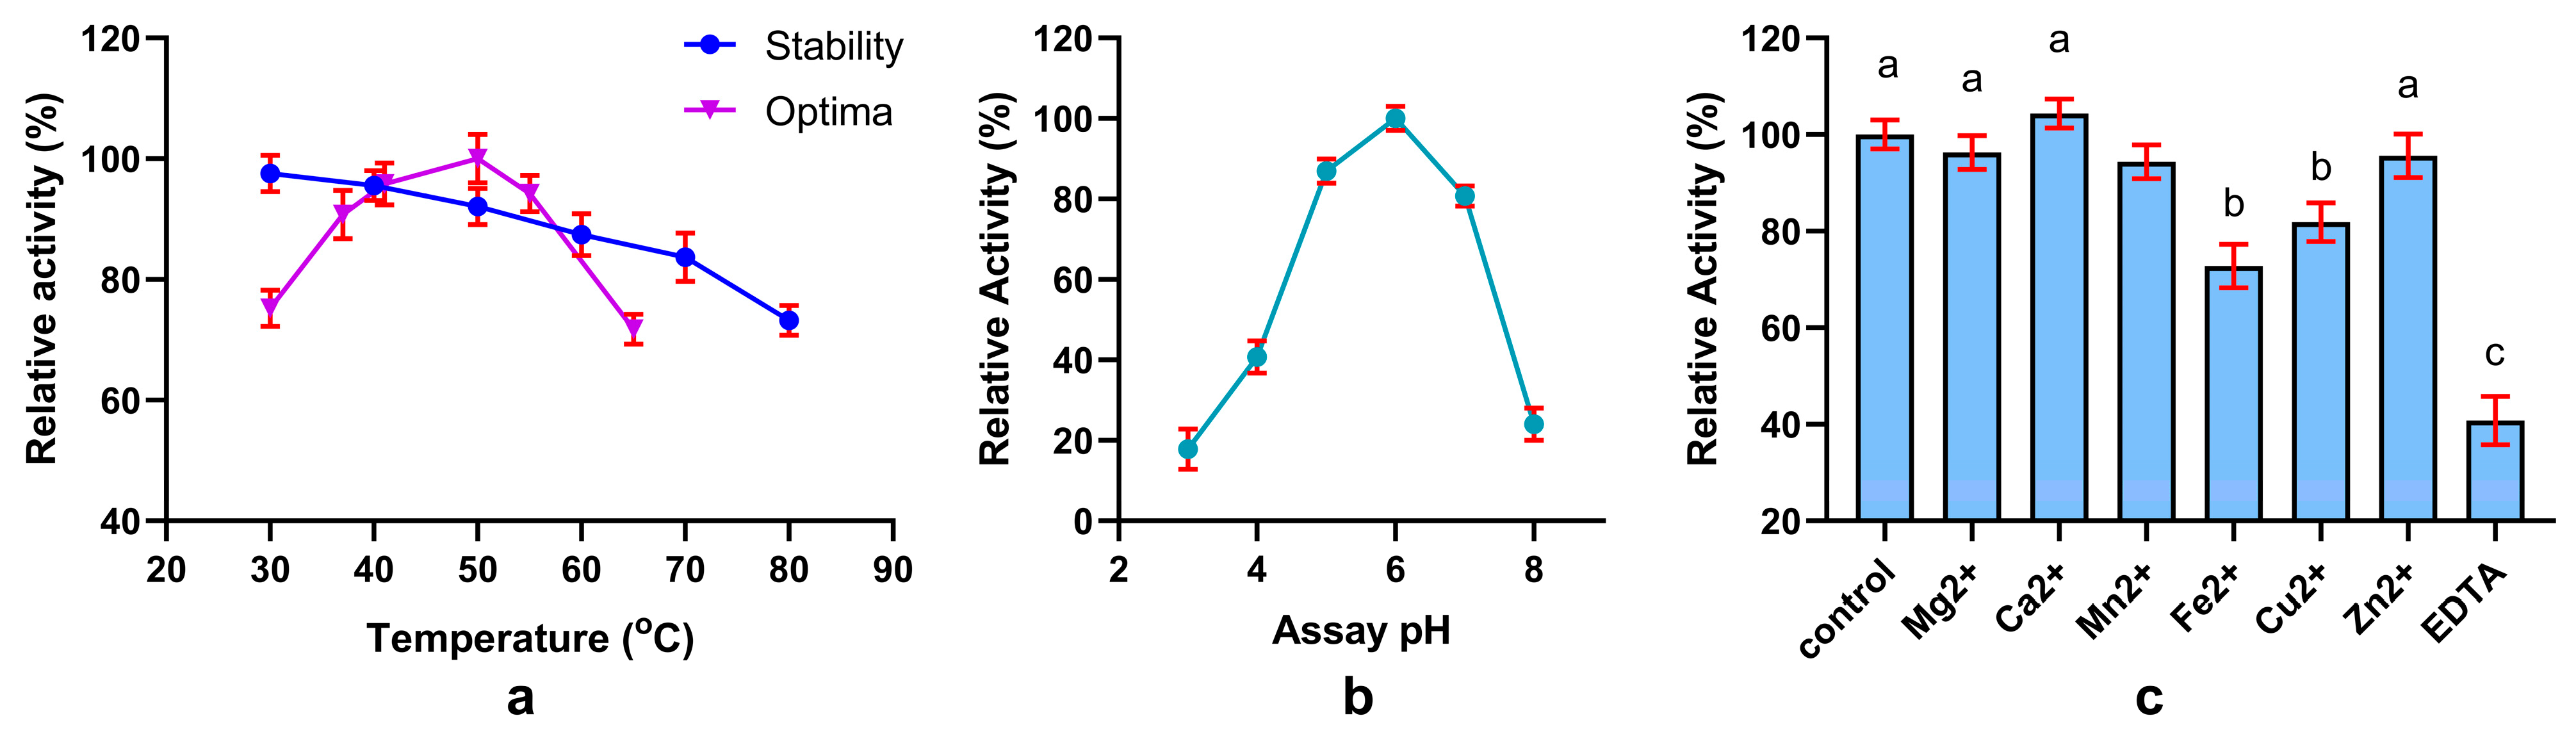
3.11. Characterization of Crude Phytase

Crude phytase in the cell-free supernatant was characterized for its thermal stability, optimum temperature, and the effect of metal ions and EDTA. Figure 7a shows that crude phytase retains more than 70% activity even after being treated at 80 °C for 1 h, indicating that it is thermostable. It also shows that crude phytase has an optimum temperature of 50 °C while retaining more than 95% of its activity at 41 °C. As shown in Figure 7b, the optimum pH of the enzyme is pH 6, and activity greatly decreases below pH 5 and above pH 7. Figure 7c suggests that metal ions like Mg2+, Ca2+, Mn2+, and Zn2+ do not significantly affect phytase activity. Cu2+ and Fe2+, on the other hand, show an inhibitory effect on phytase. EDTA severely reduces phytase activity, making it less than half of its maximum activity. This indicates that this enzyme requires metal ions as co-factors to function, as EDTA chelates metal ions.

3.12. In Vitro Dephytinization of Wheat Bran

The crude phytase released inorganic phosphate from the raw materials in a time-dependent manner (Figure 8). Mustard meal showed the highest phosphate release rate and corn meal showed the least. Within its two hours of incubation, the average velocities of inorganic phosphate release were 896, 725, 870, and 1057 μg/g/h for wheat bran, corn meal, soybean meal, and mustard meal, respectively.

4. Discussion

The goal of this study was to isolate a thermostable phytase-producing bacteria from broiler farms and optimize media composition using agro-industrial by-products to maximize phytase production. Twelve isolates were selected based on the zone ratio in the PSM plate, ranging from 1.3 to 2.3. Quantitative screening with the phytase production medium and the earlier zone ratio helped to conclude that the SP11 strain was the best phytase producer among these isolated strains. Bacterial identification with microscopic, biochemical, and 16s rDNA characterization revealed that the species was Bacillus subtilis and the presence of the phytase gene was confirmed by PCR amplification. Mussa et al. screened for phytase-producing bacteria from and around poultry farms, but found no Bacillus species as a notable producer [24].
To optimize the fermentation protocol, including both conditions and media composition, we initially performed analysis by changing a single fermentation condition per experiment, followed by statistical optimization using a Plackett–Burman design (PBD) to identify significant media components and response surface methodology (RSM) to determine the optimum amount. Single-factor analysis revealed that phytase production maximally occurred at pH 6.4 and 37 °C for 72 h of fermentation, conditions that were applied later in the experiments. A similar case was seen for another Bacillus species [25], but the optimum temperature (30 °C) and incubation time (48 h) differed for B. subtilis US417 [16]. As B. subtilis is a mesophilic bacterium, it is not unusual for the ideal temperature to be 37 °C.
The Plackett–Burman design (PBD) showed that mustard meal, tryptone, and yeast extract enhanced, but ammonium nitrate and sucrose inhibited phytase production significantly. The substantial positive effects of yeast extract [16] and tryptone [26] and the negative effect of ammonium nitrate [27] on Bacillus spp. have been previously reported, which agrees with our findings. This indicates the critical role of nitrogen sources in phytase production. Mustard meal might have a multifunctional role here, serving as the main source of carbon (crude fiber: 12–13%) and phytate (2–3%) and also providing nitrogen (crude protein: 30–32%) and required minerals [28,29]. Our study found mustard meal as a fermentation media component for the first time, as no previous report could be retrieved. However, our findings with sucrose as a significant inhibitor of phytase synthesis contradict a previous report on B. subtilis MJA, where sucrose was the best carbon source for phytase production [30].
Three positive factors from the PBD were used in response surface methodology (RSM) to find the ideal amount. Central Composite Design (CCD) analysis suggested the optimum amount to be 2.21% mustard meal, 1.95% tryptone, and 1.8% yeast extract for a maximum phytase activity of 436 U/L, with a 92% accuracy. Kammoun R. et al. [16] used 5% w/v wheat bran for B. subtilis US417 and found 0.75 g yeast extract per gram of wheat bran to be the optimum amount. Our study found a similar ratio (0.81 g yeast extract per gram of mustard meal), but the amount was half. However, 0.5% w/v tryptone was optimal for Bacillus sp. HCYL03 [26], which is almost one-fourth of our finding with tryptone. This creates a significant limitation of the study, as it will increase the cost of production. The CCD obtained a 3.7-fold increase in phytase production compared to the initial unoptimized media. The high amounts of required tryptone, yeast extract, and mustard meal, along with the inhibition by ammonium nitrate and lack of dependence on simple carbon sources like cane molasses, glucose, and sucrose, suggest that this strain’s phytase production is highly associated with the utilization of polysaccharides, as well as protein and peptide.
The monitoring of cell growth, nutrient utilization, and enzyme production was performed at various time points up to 96 h. Choi et al. reported that phytase production in Bacillus spp. is increased in the stationary phase [31]. However, Figure 7c shows that B. subtilis SP11 has the highest phytase activity in the death phase. Their study also suggested that phytase production may be related to nutrient limitation, which gives an idea about the effect of the inhibition of ammonium nitrate and sucrose on phytase production by B. subtilis SP11, while yeast extract, tryptone, and complex substrates like mustard meal enhance it. The initial increase in protein concentration may have been due to the release of protein from mustard meal, and then with the rise in protease activity, it started being utilized.
McCapes et al. suggested a combination of an 85.7 °C conditioning temperature and a 4.1 min heating time for effective feed pelleting processes [32], due to which the feed enzymes need to be thermostable. Our crude phytase, being thermostable, as shown in Figure 7a, is, thus, compatible with the industrial feed pelleting process. The optimum temperature for the crude phytase of this strain is 50 °C, which is close to various previous reports stating temperatures from 45 °C [24] to 55 °C [33]. It retains more than 95% of its activity at the body temperature of a chicken, which is near 41 °C, thus making it ideal for poultry application [34]. Crude phytase from B. subtilis SP11 shows an optimum pH of 6, which agrees with the study on B. subtilis B.S.46 [35]. Nonetheless, their study showed a high phytase activity even at pH 10 and no activity below pH 5, whereas our crude phytase is active in the pH range 3–8. The pH of the crop and duodenum of different poultry birds is near 6 [36,37], making this enzyme suitable for poultry. Figure 7c suggests that the enzyme requires metal ions as co-factors because EDTA, which chelates metal ions, causes a massive decrease in phytase activity. This supports the mechanism of action of beta-propeller phytase, found in B. subtilis, requiring calcium ions for its action [38]. However, Mg2+, Zn2+, and Mn2+ do not affect phytase activity significantly, which opposes the result shown by Rocky-Salimi et al., where metal ions inhibited phytase [34]. Fe2+ and Cu2+ inhibiting crude phytase may be due to the complex formation of phytate with these ions, which leads to insufficient binding to the active site and poor substrate availability [39].
Although the final optimized production was still lower than many other reports on other bacteria and fungi, Bangladesh, however, like many other countries, does not locally produce phytase and relies on imports from other countries [18], which is why this represents an opportunity for local poultry application and food security. To test the applicability of crude phytase, the in vitro dephytinization of different raw materials such as corn meal, soybean meal, wheat bran, and mustard meal was conducted. It was shown that the crude phytase released higher phytate phosphates per gram of substrate per hour (896 to 1057 μg) than some of the previous reports on Bacillus subtilis (759 μg), indicating its applicability in poultry feed dephytinization [40]. The highest release seen in mustard meal may explain why it was the best substrate for phytase production.

5. Conclusions

Bacillus subtilis SP11 produces thermostable phytase for which media formulations were optimized utilizing agro-industrial by-product mustard meal. The strain’s ability to retain enzyme activity under industrial and poultry physiological conditions and its higher dephytinization activity hold industrial potential for application in poultry feed. These findings can help to mitigate feed enzyme import reliance in Bangladesh and address sustainable poultry farms.

Supplementary Materials

The following supporting information can be downloaded at: https://www.mdpi.com/article/10.3390/fermentation11080452/s1, Table S1: Zone ratio (Z) of various isolates in Phytate Specific Medium (PSM), qualitatively indicating the production of phytase; Table S2: Biochemical test results of SP11 isolate.

Author Contributions

Conceptualization, S.N.K., M.M.M., and M.A.M.K.; methodology, S.A., M.M.M., M.A.M.K., and T.A.; software, M.A.M.K. and M.M.M.; validation, S.N.K. and M.A.M.K.; formal analysis, M.M.K.; investigation, S.N.K., M.M.K., and M.A.A.M.; resources, S.N.K., M.M.K., and M.A.A.M.; data curation, M.A.M.K.; writing—original draft preparation, M.A.M.K.; writing—review and editing, S.N.K., M.M.K., and M.A.A.M.; visualization, M.A.M.K.; supervision, S.N.K.; project administration, S.N.K. All authors have read and agreed to the published version of the manuscript.

Funding

The authors gratefully acknowledge the Ministry of Education, People’s Republic of Bangladesh, for funding this research under the Project ID: LS20191139.

Institutional Review Board Statement

Not applicable.

Informed Consent Statement

Not applicable.

Data Availability Statement

The original contributions presented in this study are included in the article/Supplementary Material. Further inquiries can be directed to the corresponding author.

Conflicts of Interest

The authors declare no conflicts of interest.

References

  1. Haefner, S.; Knietsch, A.; Scholten, E.; Braun, J.; Lohscheidt, M.; Zelder, O. Biotechnological Production and Applications of Phytases. Appl. Microbiol. Biotechnol. 2005, 68, 588–597. [Google Scholar] [CrossRef] [PubMed]
  2. Greiner, R.; Egli, I. Determination of the Activity of Acidic Phytate-Degrading Enzymes in Cereal Seeds. J. Agric. Food Chem. 2003, 51, 847–850. [Google Scholar] [CrossRef] [PubMed]
  3. Charles Bai, S.; Hardy, R.W.; Hamidoghli, A. Diet Analysis and Evaluation. In Fish Nutrition; Hardy, R.W., Kaushik, S.J., Eds.; Elsevier: Amsterdam, The Netherlands, 2022; pp. 709–743. [Google Scholar]
  4. Kumar, A.; Singh, B.; Raigond, P.; Sahu, C.; Mishra, U.N.; Sharma, S.; Lal, M.K. Phytic Acid: Blessing in Disguise, a Prime Compound Required for Both Plant and Human Nutrition. Food Res. Int. 2021, 142, 110193. [Google Scholar] [CrossRef] [PubMed]
  5. Dersjant-Li, Y.; Awati, A.; Schulze, H.; Partridge, G. Phytase in Non-ruminant Animal Nutrition: A Critical Review on Phytase Activities in the Gastrointestinal Tract and Influencing Factors. J. Sci. Food Agric. 2015, 95, 878–896. [Google Scholar] [CrossRef]
  6. Joudaki, H.; Aria, N.; Moravej, R.; Rezaei Yazdi, M.; Emami-Karvani, Z.; Hamblin, M.R. Microbial Phytases: Properties and Applications in the Food Industry. Curr. Microbiol. 2023, 80, 374. [Google Scholar] [CrossRef]
  7. Valente Junior, D.T.; Genova, J.L.; Kim, S.W.; Saraiva, A.; Rocha, G.C. Carbohydrases and Phytase in Poultry and Pig Nutrition: A Review beyond the Nutrients and Energy Matrix. Animals 2024, 14, 226. [Google Scholar] [CrossRef]
  8. Mullaney, E.J.; Ullah, A.H.J. The Term Phytase Comprises Several Different Classes of Enzymes. Biochem. Biophys. Res. Commun. 2003, 312, 179–184. [Google Scholar] [CrossRef]
  9. Mullaney, E.J.; Daly, C.B.; Ullah, A.H.J. Advances in Phytase Research; Elsevier: Amsterdam, The Netherlands, 2000; pp. 157–199. [Google Scholar]
  10. Balaban, N.P.; Suleimanova, A.D.; Shakirov, E.V.; Sharipova, M.R. Histidine Acid Phytases of Microbial Origin. Microbiology 2018, 87, 745–756. [Google Scholar] [CrossRef]
  11. Kumar, V.; Yadav, A.N.; Verma, P.; Sangwan, P.; Saxena, A.; Kumar, K.; Singh, B. β-Propeller Phytases: Diversity, Catalytic Attributes, Current Developments and Potential Biotechnological Applications. Int. J. Biol. Macromol. 2017, 98, 595–609. [Google Scholar] [CrossRef]
  12. Hegeman, C.E.; Grabau, E.A. A Novel Phytase with Sequence Similarity to Purple Acid Phosphatases Is Expressed in Cotyledons of Germinating Soybean Seedlings. Plant Physiol. 2001, 126, 1598–1608. [Google Scholar] [CrossRef]
  13. Puhl, A.A.; Gruninger, R.J.; Greiner, R.; Janzen, T.W.; Mosimann, S.C.; Selinger, L.B. Kinetic and Structural Analysis of a Bacterial Protein Tyrosine Phosphatase-like Myo -inositol Polyphosphatase. Protein Sci. 2007, 16, 1368–1378. [Google Scholar] [CrossRef] [PubMed]
  14. Konietzny, U.; Greiner, R. Molecular and Catalytic Properties of Phytate-degrading Enzymes (Phytases). Int. J. Food Sci. Technol. 2002, 37, 791–812. [Google Scholar] [CrossRef]
  15. Chen, C.; Cheng, K.; Ko, T.; Guo, R. Current Progresses in Phytase Research: Three-Dimensional Structure and Protein Engineering. ChemBioEng Rev. 2015, 2, 76–86. [Google Scholar] [CrossRef]
  16. Kammoun, R.; Farhat, A.; Chouayekh, H.; Bouchaala, K.; Bejar, S. Phytase Production by Bacillus subtilis US417 in Submerged and Solid State Fermentations. Ann. Microbiol. 2012, 62, 155–164. [Google Scholar] [CrossRef]
  17. Animal Feed Phytase Market Size, Share & Trends Analysis Report by Form (Liquid, Granules or Powder), By Class (3-Phytase, 6-Phytase, Others), By Source (Plants, Microorganisms), By Livestock, By Region, And by Segment Forecasts, 2025–2034. Available online: https://www.insightaceanalytic.com/report/global-animal-feed-phytase-market/1460 (accessed on 28 May 2025).
  18. Phytase Imports In Bangladesh Market Size & Demand Based On Import Trade Data. Available online: https://www.volza.com/p/phytase/import/import-in-bangladesh/ (accessed on 28 May 2025).
  19. Howson, S.J.; Davis, R.P. Production of Phytate-Hydrolysing Enzyme by Some Fungi. Enzyme Microb. Technol. 1983, 5, 377–382. [Google Scholar] [CrossRef]
  20. Bae, H.D.; Yanke, L.J.; Cheng, K.-J.; Selinger, L.B. A Novel Staining Method for Detecting Phytase Activity. J. Microbiol. Methods 1999, 39, 17–22. [Google Scholar] [CrossRef]
  21. Li, G.-E.; Wu, X.-Q.; Ye, J.-R.; Hou, L.; Zhou, A.-D.; Zhao, L. Isolation and Identification of Phytate-Degrading Rhizobacteria with Activity of Improving Growth of Poplar and Masson Pine. World J. Microbiol. Biotechnol. 2013, 29, 2181–2193. [Google Scholar] [CrossRef]
  22. Bravo, A.; Sarabia, S.; Lopez, L.; Ontiveros, H.; Abarca, C.; Ortiz, A.; Ortiz, M.; Lina, L.; Villalobos, F.J.; Peña, G.; et al. Characterization of Cry Genes in a Mexican Bacillus Thuringiensis Strain Collection. Appl. Environ. Microbiol. 1998, 64, 4965–4972. [Google Scholar] [CrossRef]
  23. Suresh, S.; Radha, K. Effect of a Mixed Substrate on Phytase Production by Rhizopus oligosporus MTCC 556 Using Solid State Fermentation and Determination of Dephytinization Activities in Food Grains. Food Sci. Biotechnol. 2015, 24, 551–559. [Google Scholar] [CrossRef]
  24. Mussa, L.A.; Yadetie, D.M.; Temesgen, E.A.; Tefera, A.T.; Gemeda, M.T. Isolation and In-Vitro Characterization of Extracellular Phytase Producing Bacterial Isolates for Potential Application in Poultry Feed. BMC Microbiol. 2023, 23, 296. [Google Scholar] [CrossRef]
  25. Suliasih, S.; Widawati, S.; Ikhwani, A.; Suyadi, S.; Sudiana, I.M. Phytase Activity of Phytase-Producing Bacteria Isolated from Mangrove Sediment. IOP Conf. Ser. Earth Environ. Sci. 2022, 976, 12041. [Google Scholar] [CrossRef]
  26. Sardar, R.; Asad, M.; Ahmad, M.; Ahmad, T. Optimization of Phytase Production by Bacillus Sp. (HCYL03) under Solid-State Fermentation by Using Box-Behnken Design. Braz. Arch. Biol. Technol. 2022, 65, e22210307. [Google Scholar] [CrossRef]
  27. Rocky-Salimi, K.; Hashemi, M.; Safari, M.; Mousivand, M. Valorisation of Untreated Cane Molasses for Enhanced Phytase Production by Bacillus subtilis K46b and its Potential Role in Dephytinisation. J. Sci. Food Agric. 2017, 97, 222–229. [Google Scholar] [CrossRef]
  28. Cheva-Isarakul, B.; Tangtaweewipat, S.; Sangsrijun, P.; Yamauchi, K. Chemical Composition and Metabolizable Energy of Mustard Meal. J. Poult. Sci. 2003, 40, 221–225. [Google Scholar] [CrossRef]
  29. Sarker, A.K.; Saha, D.; Begum, H.; Zaman, A.; Rahman, M.M. Comparison of Cake Compositions, Pepsin Digestibility and Amino Acids Concentration of Proteins Isolated from Black Mustard and Yellow Mustard Cakes. AMB Express 2015, 5, 22. [Google Scholar] [CrossRef] [PubMed]
  30. El-Toukhy, N.M.K.; Youssef, A.S.; Mikhail, M. Isolation, Purification and Characterization of Phytase from Bacillus subtilis MJA. Afr. J. Biotechnol. 2013, 12, 2957–2967. [Google Scholar]
  31. Choi, Y.M.; Suh, H.J.; Kim, J.M. Purification and Properties of Extracellular Phytase from Bacillus Sp. KHU-10. J. Protein Chem. 2001, 20, 287–292. [Google Scholar] [CrossRef]
  32. McCapes, R.H.; Ekperigin, H.E.; Cameron, W.J.; Ritchie, W.L.; Slagter, J.; Stangeland, V.; Nagaraja, K.V. Effect of a New Pelleting Process on the Level of Contamination of Poultry Mash by Escherichia coli and Salmonella. Avian Dis. 1989, 33, 103–111. [Google Scholar] [CrossRef]
  33. Kerovuo, J.; Lauraeus, M.; Nurminen, P.; Kalkkinen, N.; Apajalahti, J. Isolation, Characterization, Molecular Gene Cloning, and Sequencing of a Novel Phytase from Bacillus subtilis. Appl. Environ. Microbiol. 1998, 64, 2079–2085. [Google Scholar] [CrossRef]
  34. Troxell, B.; Petri, N.; Daron, C.; Pereira, R.; Mendoza, M.; Hassan, H.M.; Koci, M.D. Poultry Body Temperature Contributes to Invasion Control through Reduced Expression of Salmonella Pathogenicity Island 1 Genes in Salmonella enterica Serovars Typhimurium and Enteritidis. Appl. Environ. Microbiol. 2015, 81, 8192–8201. [Google Scholar] [CrossRef]
  35. Rocky-Salimi, K.; Hashemi, M.; Safari, M.; Mousivand, M. A Novel Phytase Characterized by Thermostability and High PH Tolerance from Rice Phyllosphere Isolated Bacillus subtilis B.S.46. J. Adv. Res. 2016, 7, 381–390. [Google Scholar] [CrossRef] [PubMed]
  36. Kierończyk, B.; Rawski, M.; Długosz, J.; Swiatkiewicz, S.; Józefiak, D. Avian Crop Function—A Review. Ann. Anim. Sci. 2016, 16, 653–678. [Google Scholar] [CrossRef]
  37. Farner, D.S. The Hydrogen Ion Concentration in Avian Digestive Tracts. Poult. Sci. 1942, 21, 445–450. [Google Scholar] [CrossRef]
  38. Shin, S.; Ha, N.-C.; Oh, B.-C.; Oh, T.-K.; Oh, B.-H. Enzyme Mechanism and Catalytic Property of β Propeller Phytase. Structure 2001, 9, 851–858. [Google Scholar] [CrossRef]
  39. Zhao, T.; Yong, X.; Zhao, Z.; Dolce, V.; Li, Y.; Curcio, R. Research Status of Bacillus Phytase. 3 Biotech. 2021, 11, 415. [Google Scholar] [CrossRef]
  40. Jain, J.; Singh, B. Phytase Production and Development of an Ideal Dephytinization Process for Amelioration of Food Nutrition Using Microbial Phytases. Appl. Biochem. Biotechnol. 2017, 181, 1485–1495. [Google Scholar] [CrossRef]
Figure 1. Isolation and screening of phytase-producing bacteria. (a) Isolation of phytase-producing bacteria on phytate-specific medium (PSM) plate. The halo zones indicate zones of phytate degradation. (b) Phytase production by the bacteria in the phytase production medium (broth) was measured at 24 h intervals for 3 days.
Fermentation 11 00452 g001
Figure 2. Identification of the phytase-producing SP11 isolate. (a) Colony morphology of SP11 isolate, (b) 100x microscopic observation of SP11, (c) PCR confirmation of phytase gene yielding a 1200 bp amplicon, and (d) 16s rDNA-based phylogenetic tree showing SP11 as a Bacillus subtilis species.
Fermentation 11 00452 g002aFermentation 11 00452 g002b
Figure 3. Factors influencing the production of phytase. Effect of (a) incubation time and inoculum size, (b) various media pHs, and (c) different temperatures. Relative activity has been measured compared to the highest observed value for a particular experiment.
Fermentation 11 00452 g003
Figure 4. Analysis of results obtained by Plackett–Burman design. (a) Pareto chart of standardized effect (absolute values of t-statistics) draws a reference line (α) on the chart. Any effect greater than α is statistically significant). Evaluation of the model’s fitness (bd), where the red region indicates 95% confidence bands. (b) Normal probability plot of residuals for phytase production. (c) Correlation between observed value and predicted values. (d) Residual versus predicted values show the equal distribution of residuals along both sides of the y-axis with no recognizable pattern.
Fermentation 11 00452 g004
Figure 5. Response surface plots and contour plots showing how the tryptone, mustard meal, and yeast extract composition affect the production of phytase. (a) Surface plot and (b) contour plot of mustard meal vs. tryptone (yeast extract held at 1.1%), (c) Surface plot and (d) contour plot of mustard meal vs. yeast extract (tryptone held at 1.4%), (e) Surface plot and (f) contour plot of tryptone vs. yeast extract (mustard meal held at 1.6%).
Fermentation 11 00452 g005
Figure 6. Time course profile of cell growth and enzyme production by B. subtilis SP11.
Fermentation 11 00452 g006
Figure 7. Characterization of the crude phytase. (a) Thermal stability (activity relative to untreated control) and temperature optima. (b) pH optima and (c) effect of metal ions and EDTA (activity relative to untreated control). Different letters differ at 5% significance level at turkey’s test.
Fermentation 11 00452 g007
Figure 8. In vitro dephytinization of wheat bran, corn meal, soybean meal, and mustard meal using crude phytase.
Fermentation 11 00452 g008
Table 1. Nineteen independent variables used for Plackett–Burman Design for the optimization of phytase production by Bacillus subtilis SP11 with two levels: high (+1) and low (−1).
CodeVariableLow Value (−1) (%w/v)High Value (+1) (% w/v)
X1Rice Bran01
X2Wheat Bran01
X3Corn Meal01
X4Soybean Meal01
X5Sesame Meal01
X6Mustard Meal01
X7Linseed Meal01
X8Cane Molasses02
X9Glucose0.4%1
X10NH4NO30.2%0.5
X11Tryptone01
X12Yeast Extract00.5
X13K2HPO40.02%0.1
X14Sucrose01
X15CaCl20.002%0.02
X16MgCl20.002%0.02
X17FeSO40.002%0.02
X18MnSO40.002%0.02
X19Sodium Citrate01
Table 2. Twenty-four experimental runs for Plackett–Burman Design with nineteen different variables with low and high values and their phytase activity. Red- and green-colored boxes indicate low value (−1) and high value (+1), respectively.
RunABCDEFGHJKLMNOPQRSTPhytase Activity (U/L)
ObservedPredictedResiduals
1 89.5988.8680.7225
2 194.99213.874−18.8842
3 180.54171.9988.5425
4 394.57369.67924.8908
5 185.13185.852−0.7225
6 57.2948.7488.5425
7 253.13258.414−5.2842
8 317.90326.443−8.5425
9 193.63197.611−3.9808
10 11.0535.941−24.8908
11 218.45243.341−24.8908
12 144.84140.8593.9808
13 14.62−1.00615.6258
14 130.56134.541−3.9808
15 106.25121.876−15.6258
16 178.16159.27618.8842
17 25.5034.043−8.5425
18 116.11134.994−18.8842
19 239.36220.47618.8842
20 206.04234.189−28.1492
21 274.21246.06128.1492
22 311.44306.1565.2842
23 14.62−10.27124.8908
24 200.26196.2793.9808
Table 3. Statistical analysis of Plackett–Burman design experimental results.
TermCoefficientst-StatisticsF-Valuep-ValueContribution
Constant169.0920.73 0.000
Rice Bran6.560.80.650.4660.42%
Wheat Bran7.730.950.90.3970.59%
Corn Meal−4.55−0.560.310.6070.20%
Soybean Meal1.830.220.050.8340.03%
Sesame Meal−2.45−0.30.090.7790.06%
Mustard Meal38.224.6821.950.00914.38%
Linseed Meal7.010.860.740.4390.48%
Cane Molasses0.570.0700.9480.00%
Glucose19.142.355.50.0793.61%
NH4NO3−57.08−748.940.00232.07%
Tryptone40.875.0125.10.00716.45%
Yeast Extract25.43.119.690.0366.35%
K2HPO420.152.476.10.0694.00%
Sucrose−22.77−2.797.790.0495.10%
CaCl214.041.722.960.161.94%
MgCl221.82.677.140.0564.68%
FeSO411.51.411.990.2311.30%
MnSO419.412.385.660.0763.71%
Na-citrate−14.24−1.753.050.1562.00%
Analysis of Variance (ANOVA)
SourceDFAdj SSAdj MSF-Valuep-Value
Model19237,39212,4947.820.030
Residuals488402210
R2 = 97.38%
Table 4. Central Composite Design for phytase production by Bacillus subtilis SP11 along with results and residuals. For axial points α = 1.68, Low value = −1, Medium = 0, and High value = +1.
RunMustard Meal (X6)Tryptone (X11)Yeast Extract (X12)Phytase Activity (U/L)
ObservedPredictedResidual
1000388.8361.926.8
21−1−1257.2244.113.1
3111427.0386.540.5
4−1−1−1219.2236.4−17.2
5000374.7361.912.8
6000378.7361.916.8
7−111323.6313.410.2
800−1.68199.4189.310.1
9−11−1231.8246.4−14.6
10001.68274.6317.7−43.1
11000353.8361.9−8.2
12000349.7361.9−12.3
131.6800232.0287.4−55.4
14−1−11153.9151.22.7
151−11367.7329.837.9
1611−1169.2148.620.6
1701.680287.7310.2−22.5
18−1.6800242.0219.522.5
19000331.6361.9−30.3
200−1.680243.7254.1−10.5
LevelMustard meal
(% w/v)
Tryptone
(% w/v)
Yeast extract
(% w/v)
−α0.30.250.2
−10.850.710.57
01.651.381.1
+12.452.041.64
32.52
Table 5. Multiple regression analysis and ANOVA of the central composite design.
TermCoefficientt-Statisticsp-Value
Constant361.924.860.000
Mustard Meal20.192.090.063
Tryptone16.661.720.115
Yeast Extract38.163.950.003
Mustard Meal*Mustard Meal−38.35−4.080.002
Tryptone*Tryptone−28.2−30.013
Yeast Extract*Yeast Extract−38.33−4.080.002
Mustard Meal*Tryptone−26.4−2.090.063
Mustard Meal*Yeast Extract42.73.380.007
Tryptone*Yeast Extract38.13.020.013
SourceDFF-valuep-value
Model99.260.001
Linear37.650.006
Square311.820.001
2-Way Interaction38.30.005
Lack-of-Fit54.550.061
R2 = 89.28%
Table 6. Predicted optimum media composition for phytase production by CCD.
Mustard MealTryptoneYeast ExtractPredicted95% ClDesirabilityObservedAccuracy
2.21% w/v1.95% w/v1.85% w/v401.121 (U/L)(337 U/L, 465.3 U/L)0.91436 U/L92%
Disclaimer/Publisher’s Note: The statements, opinions and data contained in all publications are solely those of the individual author(s) and contributor(s) and not of MDPI and/or the editor(s). MDPI and/or the editor(s) disclaim responsibility for any injury to people or property resulting from any ideas, methods, instructions or products referred to in the content.

