Article

Potential Prebiotic Effect of Caatinga Bee Honeys from the Pajeú Hinterland (Pernambuco, Brazil) on Synbiotic Alcoholic Beverages Fermented by Saccharomyces boulardii CNCM I-745

by
Walter de Paula Pinto-Neto
1,2,3,4,*,
Luis Loureiro
4,5,
Raquel F. S. Gonçalves
4,5,
Márcia Cristina Teixeira Marques
4,
Rui Miguel Martins Rodrigues
4,5,
Luís Abrunhosa
4,5,
Aline Magalhães de Barros
4,
Neide Kazue Sakugawa Shinohara
3,
Ana Cristina Pinheiro
4,5,
Antonio Augusto Vicente
4,5,
Rafael Barros de Souza
1 and
Marcos Antonio de Morais Junior
2,*
1
Institute of Biological Sciences, University of Pernambuco, Campus of Recife, Recife 50100-130, Brazil
2
Department of Genetics, Centre of Biosciences, Federal University of Pernambuco, Campus of Recife, Recife 50670-901, Brazil
3
Department of Rural Technology, Federal Rural University of Pernambuco, Campus of Recife, Recife 58050-900, Brazil
4
Centre of Biological Engineering, University of Minho, Campus of Gualtar, 4710-057 Braga, Portugal
5
LABBELS—Associate Laboratory, 4710-057 Braga, Portugal
*
Authors to whom correspondence should be addressed.
Fermentation 2025, 11(7), 405; https://doi.org/10.3390/fermentation11070405
Submission received: 16 May 2025 / Revised: 4 July 2025 / Accepted: 10 July 2025 / Published: 15 July 2025
(This article belongs to the Section Probiotic Strains and Fermentation)

Abstract

The singular biodiversity of the Brazilian Caatinga inspires innovative solutions in food science. In this study, we evaluated the prebiotic potential of honeys produced by Apis mellifera in the Pajeú hinterland, Pernambuco, Brazil (Caatinga Biome), with different floral origins: Mastic (Aroeira), Mesquite (Algaroba), and mixed flowers. These were used to formulate synbiotic and alcoholic beverages fermented by Saccharomyces boulardii CNCM I-745. Static and dynamic simulations of the human gastrointestinal tract (GIT) were used, as well as physicochemical, rheological, and microbiological analyses. The results revealed that honey positively influences the viability and resilience of probiotic yeast, especially honey with a predominance of Algaroba, which promoted the highest survival rate (>89%) even after 28 days of refrigeration and in dynamic in vitro simulation of the GIT (more realistic to human physio-anatomical conditions). The phenolic composition of the honeys showed a correlation with this tolerance. The use of complementary methodologies, such as flow cytometry, validated the findings and highlighted the functional value of these natural matrices, revealing an even greater longevity potential compared to conventional microbiological methodology. The data reinforces the potential of the Caatinga as a source of bioactive and sustainable compounds, proposing honey as a promising non-dairy synbiotic vehicle. This work contributes to the appreciation of the biome and the development of functional food products with a positive social, economic, and ecological impact.

1. Introduction

Honey is a naturally occurring sweet substance produced by honeybees. It is derived from the nectar of flowers, secretions from living plant tissues, or excretions of sap-feeding insects on plant surfaces. Bees gather these substances, process them by blending with their own enzymes, deposit and dehydrate the mixture, then store it in the honeycomb, allowing it to ripen and reach maturity. Honey is primarily composed of various sugars, with fructose and glucose being the most abundant. It also contains other components, including organic acids, enzymes, and solid particles from the honey collection process [1].
Notably, its chemical composition is strongly influenced by geographical and botanical factors, resulting in unique profiles of bioactive compounds. This phenomenon is particularly relevant in honeys originating in the Caatinga Biome, an ecosystem unique to the Brazilian semi-arid region, characterized by a highly adapted and endemic flora. The uniqueness of this biome’s vegetation can give honey distinctive chemical and functional properties, highlighting its potential for applications in health and nutrition [2]. Two notable plant species within this ecosystem are Myracrodruon urundeuva (Mastic or popularly known “Aroeira”) and Neltuma juliflora (Mesquite or popularly known “Algaroba”), both of which hold significant ecological, medicinal, and economic value [3,4]. Aroeira has long been utilized in traditional folk medicine and ethnobotanical practices due to its reputed therapeutic properties. Meanwhile, Algaroba is widely recognized for its versatility, being employed as a food source, a tool for restoring degraded landscapes, and a promising raw material for applications in the cosmetics industry [5]. These species exemplify the rich biodiversity and potential biotechnological applications of plant resources from this region. Because of its rich chemical composition, honey has been tested as a potential nutraceutical ingredient in fermented beverages, mainly related to its antioxidant properties [6]. Recent evidence from our research group suggests that these compounds may confer honey a potential prebiotic effect by selectively modulating the growth and activity of beneficial microorganisms [2].
These beneficial microorganisms, when administered in adequate quantities, are classified as probiotics and play a crucial role in promoting the health of the host, offering a wide range of physiological benefits [7]. These effects can be enhanced by the provision of specific substrates that favour their growth and competitiveness in the intestinal environment, improving their adaptation to the habitat. These substrates, known as prebiotics, when combined with probiotics in the same formulation, give rise to synbiotic, synergistic systems capable of optimizing the modulation of the microbiota and enhancing the beneficial effects on health [8,9].
The most widely commercialized probiotic foods and beverages predominantly contain Lactobacillus species and other lactic acid bacteria [10]. However, the yeast Saccharomyces boulardii has been extensively researched over several decades for its probiotic potential. Its strain, CNCM I-745, became the first commercially available probiotic product due to its beneficial effects in the management of various human ailments [11,12,13]. A notable advantage of yeast over probiotic bacteria lies in the immune-enhancing properties of its cell wall components, which stimulate the innate immune response in the intestinal mucosa. Additionally, yeast strains possess an inherent resistance to antibiotics and do not facilitate the transfer of antibiotic resistance genes via horizontal gene transfer with other microorganisms within the gut microbiota [14,15]. These unique characteristics have spurred the growing inclusion of yeast in the development of probiotic beverages [16].
It is essential to highlight that no previous studies have investigated the prebiotic effects of honeys derived from different floral predominance within the Caatinga biome. The only known evidence regarding the prebiotic potential of bee honey from this biome was recently demonstrated by our research group [2]. Consequently, the objective of the present study was to assess the key physicochemical parameters of bee honey from various floral sources within the Caatinga biome, with predominance of Aroeira or Algaroba, and mixed floral varieties, in the context of the production of fermented alcoholic beverages. Additionally, the study aimed to evaluate the prebiotic effect of these honeys on the survival of Saccharomyces boulardii CNCM I-745 during refrigerated storage and under in vitro conditions simulating the human gastrointestinal tract (GIT). For this purpose, standardized methodologies were employed using both static and dynamic systems, designed to more accurately replicate the physiologically realistic conditions of the human digestive system.

2. Materials and Methods

2.1. Origin of Bee Honeys

Three fresh honey samples produced by Apis mellifera were collected from the micro-region of Pajeú hinterland in Pernambuco, Brazil, within the Caatinga Biome, located between the coordinates 07°16′2″ and 08°56′01″ south latitude and 36°59′0″ and 38°57′45″ west longitude. Although categorized as containing nectar from different plants, two of these honeys were primarily derived during the peak blooming seasons of Myracrodruon urundeuva (Aroeira) and Prosopis juliflora (Algaroba), respectively. The samples were taken directly from the hives in 2022 and stored at a stable room temperature (25 ± 2 °C) until experimental analyses were performed.

2.2. Physicochemical and Microbiological Analysis of Bee Honey

The bee honeys were evaluated following the methodologies outlined by Pinto-Neto et al. [2]. Colour was assessed using the Pfund colour scale. Moisture, ash content, diastatic activity, free acidity, 5-hydroxymethylfurfural (5-HMF) content, the Lugol reaction, and the Lund reaction were analysed according to standardized procedures from the Adolfo Lutz Institute [17]. The pH was measured with a potentiometer, while the soluble solids content was determined using a portable refractometer, with results expressed in °Brix. Density measurements were conducted with a 5 mL glass pycnometer calibrated with distilled water. Electrical conductivity was measured by diluting 10 g of the sample in 75 mL of distilled water and using a conductivity meter model W12D (Bel Engineering, Monza, Italy). Water activity was measured at 25 °C using the AquaLab 4TE water activity analyser (São José dos Campos, Brazil). Carbohydrates were quantified using High-Performance Liquid Chromatography (HPLC). Total protein content was determined via the bicinchoninic acid (BCA) method, as described by Smith et al. [18].
The viscosity profiles of the bee honey samples were measured in a controlled tension rheometer DHR-1 (TA Instruments, New Castle, DE, USA) with TRIOS software version 4.6 (TA Instruments, New Castle, DE, USA) at 20 °C using a cone and plate geometry (60 mm, cone angle 2.006°, gap 64 µm). Before analysis, the samples were heated to 50 °C, homogenized and cooled naturally to room temperature. The flow tests were carried out in duplicate at increasing shear rates (1 to 500 s−1). The texture analysis was conducted using a TA.HD Plus Texture Analyser (Stable Micro Systems, Godalming, UK) equipped with a 5 kg load cell. The samples were placed in cylindrical containers (50 mm in diameter, 75 mm in height) with a sample height of 35 mm. A penetration test was carried out using a P/10 probe with a pre-test speed of 0.5 mm/s, a test speed of 2 mm/s, and a post-test speed of 2 mm/s. The trigger force was set at 0.5 g, and the probe penetrated 20 mm into the sample. Firmness (maximum penetration force) and consistency (work of penetration, represented by the area under the curve up to the maximum force) were automatically calculated using TRIOS software version 4.6 (TA Instruments, New Castle, DE, USA). For the back-extrusion test, a disc with a 45 mm diameter was used. The pre-test speed was set to 1 mm/s, the test speed to 1 mm/s, and the post-test speed to 2 mm/s. The trigger force was 0.5 g, and the disc penetrated 35 mm into the sample. Firmness, consistency, cohesiveness (maximum negative force), and the viscosity index (or “work of cohesion,” represented by the area under the negative region of the curve indicating resistance to withdrawal) were automatically calculated using Exponent software version 6 for Windows (Stable Micro Systems).
Antioxidant activity was analysed using the 2,2-diphenyl-1-picrylhydrazyl (DPPH) radical reduction assay [19] and the ferric reducing antioxidant power (FRAP) method. Total phenolic content was assessed using the Folin–Ciocalteu method [20], while flavonoid content was determined following the protocols of Araújo et al. [21], and flavonol content was evaluated as per the methods of Woisky and Salatino [22] and Bencherif et al. [23]. Microbiological analysis included testing for Coliforms and Escherichia coli [24] as well as Salmonella [25]. All results are reported as the average of at least two technical replicates.

2.3. Probiotic Yeast and Cultivation Conditions

S. boulardii CNCM I-745 was cultivated in 25 mL of YPD medium at 37 °C with agitation at 150 rpm for 24 h to prepare stock cultures, which were preserved in 30% (v/v) glycerol and stored at −20 °C. For each experiment, 2 mL of the frozen stock was used to inoculate 25 mL of YPD. The cells were grown at 37 °C with agitation at 150 rpm for 24 h. Subsequently, 2.5 mL of this culture was transferred to 22.5 mL of fresh YPD, and the cells were cultivated again under the same conditions. The resulting 25 mL culture was centrifuged at 10,000 rpm for 10 min, and the supernatant was discarded. The cells were then washed twice with 0.9% (w/v) saline solution and resuspended in 5 mL of the same saline solution to prepare the beverage inoculum. An aliquot of this suspension was diluted and plated on solid YPD medium, with the plates incubated at 37 °C for 48 h. Colony counts were performed to determine the initial viability of the cell population, expressed as colony-forming units (CFU), and the cells were subsequently analysed by flow cytometry.

2.4. Formulation and Experimental Design of Bee Honey Beverages

The four fermented synbiotic beverage conditions, each containing different types of honey and 30 mL, were prepared according to the scheme presented in Figure 1. The honeys (#2: Aroeira; #3: Algaroba; #4: mixed) were diluted to 24 °Brix and adjusted to pH 6 using 1 M NaOH. For the control condition (#1: analogue honey), a honey simulation was prepared with carbohydrate sources (fructose, glucose, and sucrose) adjusted to match the average proportions found in the fresh honeys analyzed, in order to produce the analogue beverage, and without the other bioactive compounds present in honey related to the potential prebiotic effect. All the beverages were pasteurized at 67 °C (±2 °C) for 35 min, followed by thermal shock cooling in an ice bath to 7 °C (±2 °C) for 5 min. Each of the beverages was inoculated with 3 mL of seeding inoculum (10% v/v) and incubated at 37 °C for 24 h. Samples were taken before fermentation and after 24 h of fermentation. The yield was calculated using the formulae YP/S = ∆Product/∆Substrate. The beverages, prepared in biological duplicates, were immediately packaged and stored at 4 °C for refrigeration. Samples were taken for in vitro GIT simulations and storage time analysis on days 0, 14, and 28 of incubation.

2.5. Assessment of Probiotic Metabolic Activity

2.5.1. Carbohydrates, Glycerol, and Ethanol

The quantification of carbohydrates (sucrose, glucose, and fructose) as well as glycerol and ethanol production were carried out by HPLC, using a Shimadzu device model LC 2060C (Kyoto, Japan) equipped with a quaternary gradient pump, an automatic injector, a refractive index (RID-20A), and diode array detectors. The isocratic chromatographic separation was performed on a Bio-Rad Aminex® HPX-87H ion exchange column (300 × 7.8 mm, 9 µm) (Hercules, CA, USA). The mobile phase was 5 mM sulfuric acid, the flow rate was set to 0.5 mL/min, the column temperature was set to 25 °C, and the injection volume to 20 µL. The samples were diluted with deionized water and filtered through 0.22 µm polyethersulfone filters. The metabolites were identified by their relative elution times and quantified using the calibration curves prepared with commercial standards. The results are presented as the average of two biological replicates and the respective standard deviation.

2.5.2. Phenylethyl Alcohol Ester

The samples were prepared by liquid-liquid extraction using diethyl ether (50% v/v), pre-chilled to −20 °C, containing octanol (1 μg/mL) as the internal standard. The extraction was performed by vortexing for 1 min, followed by centrifugation at 10,000 rpm for 5 min to separate the phases. The upper organic phase, containing the extracted compounds, was collected for GC-MS analysis. The samples were analysed using GC-MS SCION SQ1/436 GC device (Billerica, MA, USA), equipped with an Rxi-5Sil MS capillary column (30 m × 0.25 mm i.d., 0.25 μm film thickness) (Restek Cooporation, Bellefonte, PA, USA). The initial oven temperature was set to 40 °C and held for 5 min, followed by a first temperature ramp of 10 °C/min up to 100 °C, and a second ramp of 34.5 °C/min up to 250 °C, where it was held for 1 min. The injector and detector temperatures were set to 250 °C [26,27]. Compound identification was performed based on fragmentation pattern interpretation, supported by the NIST/EPA/NIH 2020 mass spectral libraries (National Institute of Standards and Technology, Gaithersburg, MD, USA). The relative abundance of the compounds was calculated based on peak areas in the total ion chromatogram (TIC). The results are reported as the mean values of two biological replicates.

2.6. In Vitro Simulation Tests of the GIT

The beverage samples containing different types of bee honey were subjected to two in vitro GIT simulation methods. A static system, based on the harmonized INFOGEST 2.0 protocol [28], was applied to all samples, while a dynamic system, which more closely replicates human physio-anatomical conditions, was used for the sample with the best performance in log UFC/mL and survival (%) in the static simulation. This dynamic system followed standardized conditions established in the international consensus for static [29] and semi-dynamic systems [30]. Thus, the static method was used to evaluate the samples immediately after formulation and during refrigerated storage, while the dynamic method provided a more reliable evaluation of the freshly prepared sample and during storage time, making it possible to compare the different GIT in vitro simulation strategies applied.

2.6.1. Static Simulation of the GIT Under Refrigerated Storage

The viability and cell vitality of S. boulardii CNCM I-745 under gastrointestinal digestion conditions were evaluated using the standardized INFOGEST 2.0 in vitro digestion method [28]. Cell vitality, in this case, means Viable but non-culturable/VBNC. This method simulates the conditions of the digestive tract, including the mouth, stomach, and small intestine, using appropriate electrolyte solutions, specific enzymes, pH adjustments, and corresponding digestion times. Briefly, in the oral phase, the sample was mixed with a simulated salivary fluid (SSF) solution (Table 1) and incubated at 37 °C in a shaking water bath (B. Braun Biotech, Certomat WR model, Melsungen, Germany) under horizontal agitation at 120 rpm for 2 min. In the gastric phase, simulated gastric fluid (SGF) (Table 1) was added along with porcine pepsin (Sigma-Aldrich P7012; final concentration of 2000 U/mL, St. Louis, MO, USA). The pH was adjusted to 3.0 using 1 M HCl, and the mixture was incubated at 37 °C for 2 h under agitation at 120 rpm. The intestinal phase was simulated by adding simulated intestinal fluid (SIF) (Table 1), porcine pancreatin (Sigma-Aldrich P7545; final concentration of 100 (p-Toluene-sulfonyl-L-arginine methyl ester/TAME) U/mL), and a 10 mmol/L bile solution. The pH was adjusted to 7.0 using 1 M NaOH, and the mixture was incubated at 37 °C for 2 h under agitation at 120 rpm. Samples were collected before digestion and after the gastric and intestinal phases, then plated for CFU counting and analysed by flow cytometry according to the methodologies described below. The experiment was performed in biological duplicates.

2.6.2. Dynamic Simulation of the GIT Under Refrigerated Storage

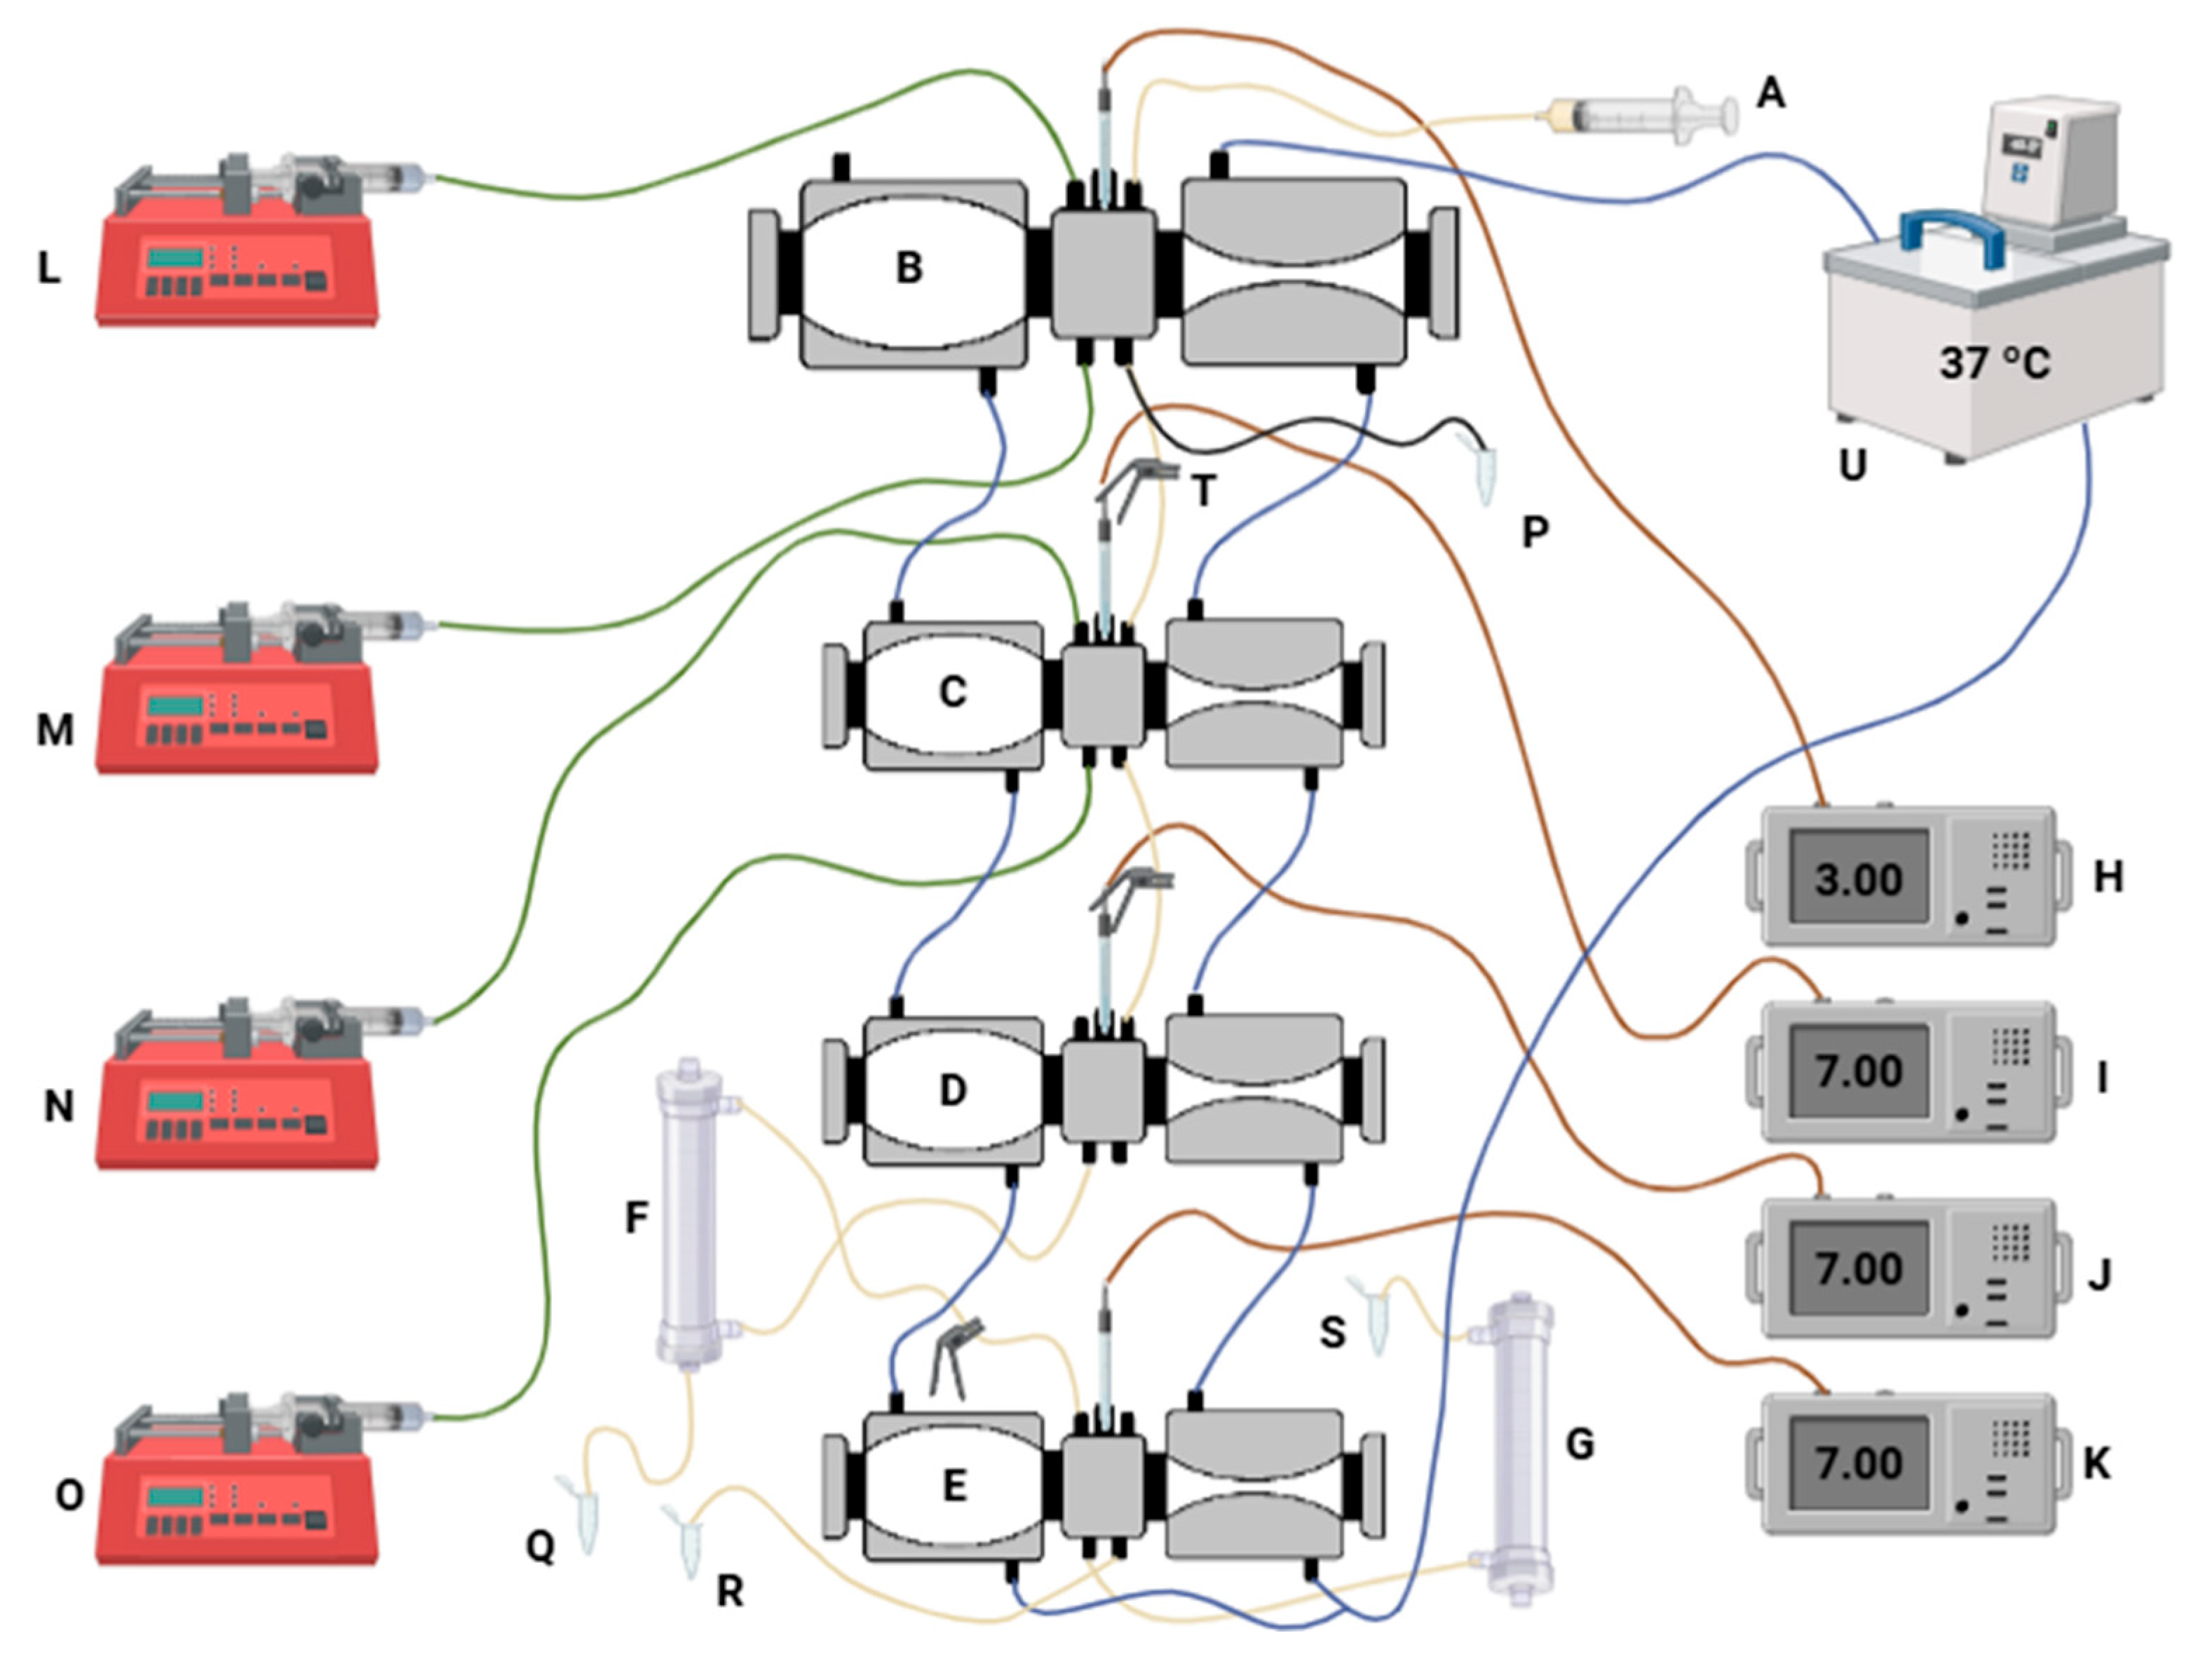
The viability and cellular vitality of S. boulardii CNCM I-74 under gastrointestinal digestion conditions were also evaluated based on standardized conditions established in international consensus protocols for static [29] and semi-dynamic [30] in vitro digestion. The oral phase is performed outside the dynamic system reactor, in the same way as described for the static simulation. Subsequently, the analyses were performed using an inhouse Dynamic In Vitro GastroIntestinal Simulator (DIVGIS), as described by Pinheiro et al. [31]. The DIVGIS (Figure 2) consists of four compartments (stomach, duodenum, jejunum, and ileum) that replicate the key conditions of human gastrointestinal digestion. Each compartment comprises two interconnected acrylic reactors with flexible walls (stomacher bags) connected by silicone tubing. Peristaltic movements were simulated through the cyclic compression and relaxation of the flexible walls, achieved by circulating water at 37 °C through each reactor. Gastric and intestinal secretions were freshly prepared and continuously delivered into the reactors via syringe pumps programmed at specific flow rates. The jejunum and ileum compartments were connected to hollow fibre membranes (Repligen Minikros, S02-S05U-05-P; Breda, Waltham, MA, USA) to mimic nutrient absorption in the small intestine. These membranes separated the fluids into three distinct fractions: jejunal filtrate, ileal filtrate, and non-ileal filtrate [32]. The digestion parameters were assessed following the method outlined by Fernandes et al. [33].
A volume of 50 mL of the sample that exhibited the best performance in the in vitro static GIT simulation was used in biological duplicate under the following conditions. The oral phase was conducted in a static digestion bath at 37 °C by adding SSF (Table 1) and stirring at 120 rpm for 2 min [28]. Following the oral phase, the sample was introduced into the system through the gastric compartment, where SGF (Table 1), pepsin (2000 U/mL), and lipase (120 U/mL) were continuously secreted at a flow rate of 0.4 mL/min. At predefined intervals, fixed volumes were transferred to the duodenal compartment, where SIF (Table 1), bile salts, and pancreatin solution were continuously secreted at a flow rate of 0.8 mL/min. Chyme was transferred to the next compartment at scheduled times. The pH was continuously adjusted using 1 M HCl or 1 M NaOH to maintain pH 3.0 in the gastric phase and pH 7.0 in the intestinal phase. The digestion experiments lasted approximately 4 h.
During in vitro digestion, samples were collected directly from the lumen of different compartments, immediately after passage through the stomach, as well as from the jejunal and ileal filtrates and the non-filtered fraction. All samples were kept in an ice bath throughout the digestion process. The unfiltered portion, which under real physio-anatomical conditions would go on to the colon and help form the microbiome, was analysed for colony-forming units (CFU) and subjected to flow cytometry to assess the viability, vitality, and survival of the cells during their passage through the GIT.

2.7. Assessment of Probiotic Viability and Survival

All collected samples were diluted in sterile 0.9% (w/v) saline solution and plated on YPD medium. The plates were then incubated at 37 °C for 48 h to determine the Colony Forming Units (CFU). Probiotic viability was expressed in CFU/mL. Additionally, bee honey beverage samples stored under refrigeration for 30 days were analysed for probiotic cell viability and survival under GIT simulation conditions, as previously described. Thus, cell viability was assessed at three points: at the beginning of the experiment, after acid stress from the gastric tract to the static system, and at the conclusion of the simulation. The number of surviving cells was calculated using Equations (1) and (2) [34]:
S 1 = L o g   C F U   N 2 L o g   C F U   N 0 · 100
S 4 = L o g   C F U   N 4 L o g   C F U   N 0 · 100
where S is the percentage of cell survival (%), N0 is the total viable count (CFU/mL) before exposure to simulated gastrointestinal conditions, N2 is the total viable count (CFU/mL) after 2 h gastric trait exposure, and N4 is the total viable count (CFU/mL) after enteric trait exposure.

2.8. Assessment of Probiotic Cell Membrane Integrity

The integrity of the S. boulardii CNCM I-745 cell membrane was evaluated before the fermentation process, after the synbiotic beverage, during refrigerated storage, and under in vitro dynamic GIT simulations. S. boulardii CNCM I-745 cell suspensions were incubated with propidium iodide (8 μg/mL) for 5 min at 25 °C, followed by flow cytometry analysis.
Yeast samples stained with propidium iodide (PI) were analysed using a CytoFLEX flow cytometer (Beckman Coulter, Inc., Brea, CA, USA). Signal acquisition was optimized by applying a primary threshold on forward scatter (FSC-H) and a secondary threshold on the fluorescence channel FL1-H to reduce background noise while preserving bacterial events. The gating strategy for distinguishing viable from non-viable populations was adapted to be based on PI fluorescence emission detected in channel FL3-A (670 nm long-pass filter), following methodologies previously described [35,36].

2.9. Statistical Analysis

The metabolite concentrations and yeast survival were assessed in biological duplicate and analysed using a one-way analysis of variance (ANOVA), followed by the Tukey test. The data were processed with GraphPad Prism 8, and a significance level of 5% (p ≤ 0.05) was considered.

3. Results and Discussion

3.1. Physicochemical and Microbiological Parameters of Bee Honeys

The physicochemical characterization of the honeys is presented in Table 2. Parameters such as brix, humidity, density, and pH values indicated its maturity, while negative lugol reactions showed the absence of starch and dextrin, and positive Lund reaction values confirmed the presence and integrity of albuminoids. Although it does not constitute the parameters of Brazilian legislation, the pH values measured follow other studies carried out and influence the texture, stability, and shelf life of honey, as well as the formation of 5-HMF [37,38,39]. The concentrations of 5-HMF detected were below the established limits of 60 mg/kg of Brazilian legislation, except for honey with a predominance of Aroeira blossom [40,41,42]. However, the Codex Alimentarius Committee established a maximum value of 40 mg/kg of 5-HMF, accepting values of up to 80 mg/kg for honeys from tropical climates. As previously mentioned, the Caatinga biome is characterized by a semi-arid climate, which may explain this high value of 5-HMF. The honeys with a predominance of Algaroba and mixed flowers showed low diastatic or enzymatic activity, lower than 8 on the Göthe scale recommended by Brazilian legislation. However, the legislation also establishes that honeys with a low enzymatic content must have a minimum diastatic activity corresponding to 3 on the Göthe scale, provided that the hydroxymethylfurfural content does not exceed 15 mg/kg (Table 2) [40].
The total acidity values are close to the 50 mEq/kg set by Brazilian legislation for Apis mellifera honey, except for honey with a predominance of Aroeira blossom [40,41,42]. This may be a reflection of the botanical origin and climate with high annual temperatures, since this honey had adequate 5-HMF values, diastatic activity, and contaminants below those established by Mercosur. The ash content was lower than the maximum defined [40]. The presence of minerals and electrical conductivity are related parameters, which explains the higher electrical conductivity in honey with a predominance of Algaroba blossom. The glucose and fructose values are within the defined parameters [40,41,42,43]. On the other hand, the apparent sucrose content was higher than that recommended by the Codex Alimentarius [42] and European Community (EC) [41] of 5 g/100 g of honey and by Brazilian legislation of 6 g/100 g of honey [40]. The concentration of total sugars was consistent with the °Brix value measured. Honey with a predominance of mixed blooms stood out for having the highest values of firmness (66.95 ± 1.42 g), consistency (753.78 ± 17.15 g/s), cohesiveness (−40.50 ± 2.28 g), and work of cohesion (−396.23 ± 17.79 g/s), indicating a more viscous, consistent, and cohesive behaviour compared to the others (Table 2). On the other hand, the honey with a predominance of Aroeira blossom had the lowest values and, consequently, the lowest viscosity. Surprisingly, it had the lowest humidity, which was not expected as it was the least viscous sample [44].
Both the antioxidant activity and the total phenolic concentration of the mixed honey detected in this study (Table 2) were in the range of values presented for other mixed honey samples analysed from the same region [2], with intermediate values among the honeys with floral predominance. The honey with Aroeira predominance presented higher antioxidant activities measured by FRAP (404 µM FeSO4/mL), while the honey with Algaroba predominance presented higher levels of total phenolics (256 mg Tannic Acid/100 g of honey), flavonoids, and flavanols (Table 2). The antioxidant activity measured by the FRAP method for all three tested honeys and their phenolic content varied within the range described for honeys from the state of Bahia, also in the northeastern region of Brazil, which includes hinterland regions [45]. These compounds are produced by plants as a defence mechanism against high incidences of UV rays and thermal stress [46]; both variables are typical of the hinterland region of northeastern Brazil. The darker colour of Algaroba honey may be a result of the combination of higher ash, 5-HMF, and phenolic compounds content compared to Aroeira honey (Table 2). It has been shown that honeys from the Pajeú hinterland of mixed botanical origin, presenting 378 µM FeSO4/mL of FRAP antioxidant activity, protected yeast cells from TGI stress and prolonged their viability for long storage [2]. The results were discussed in light of the literature that relates the antioxidant activity of honey with its phenolic composition, which protects cells from oxidative stress and increases chronological longevity [47,48].

3.2. The Performance of Saccharomyces Boulardii CNCM I-745 During Fermentation and Storage Under Refrigeration

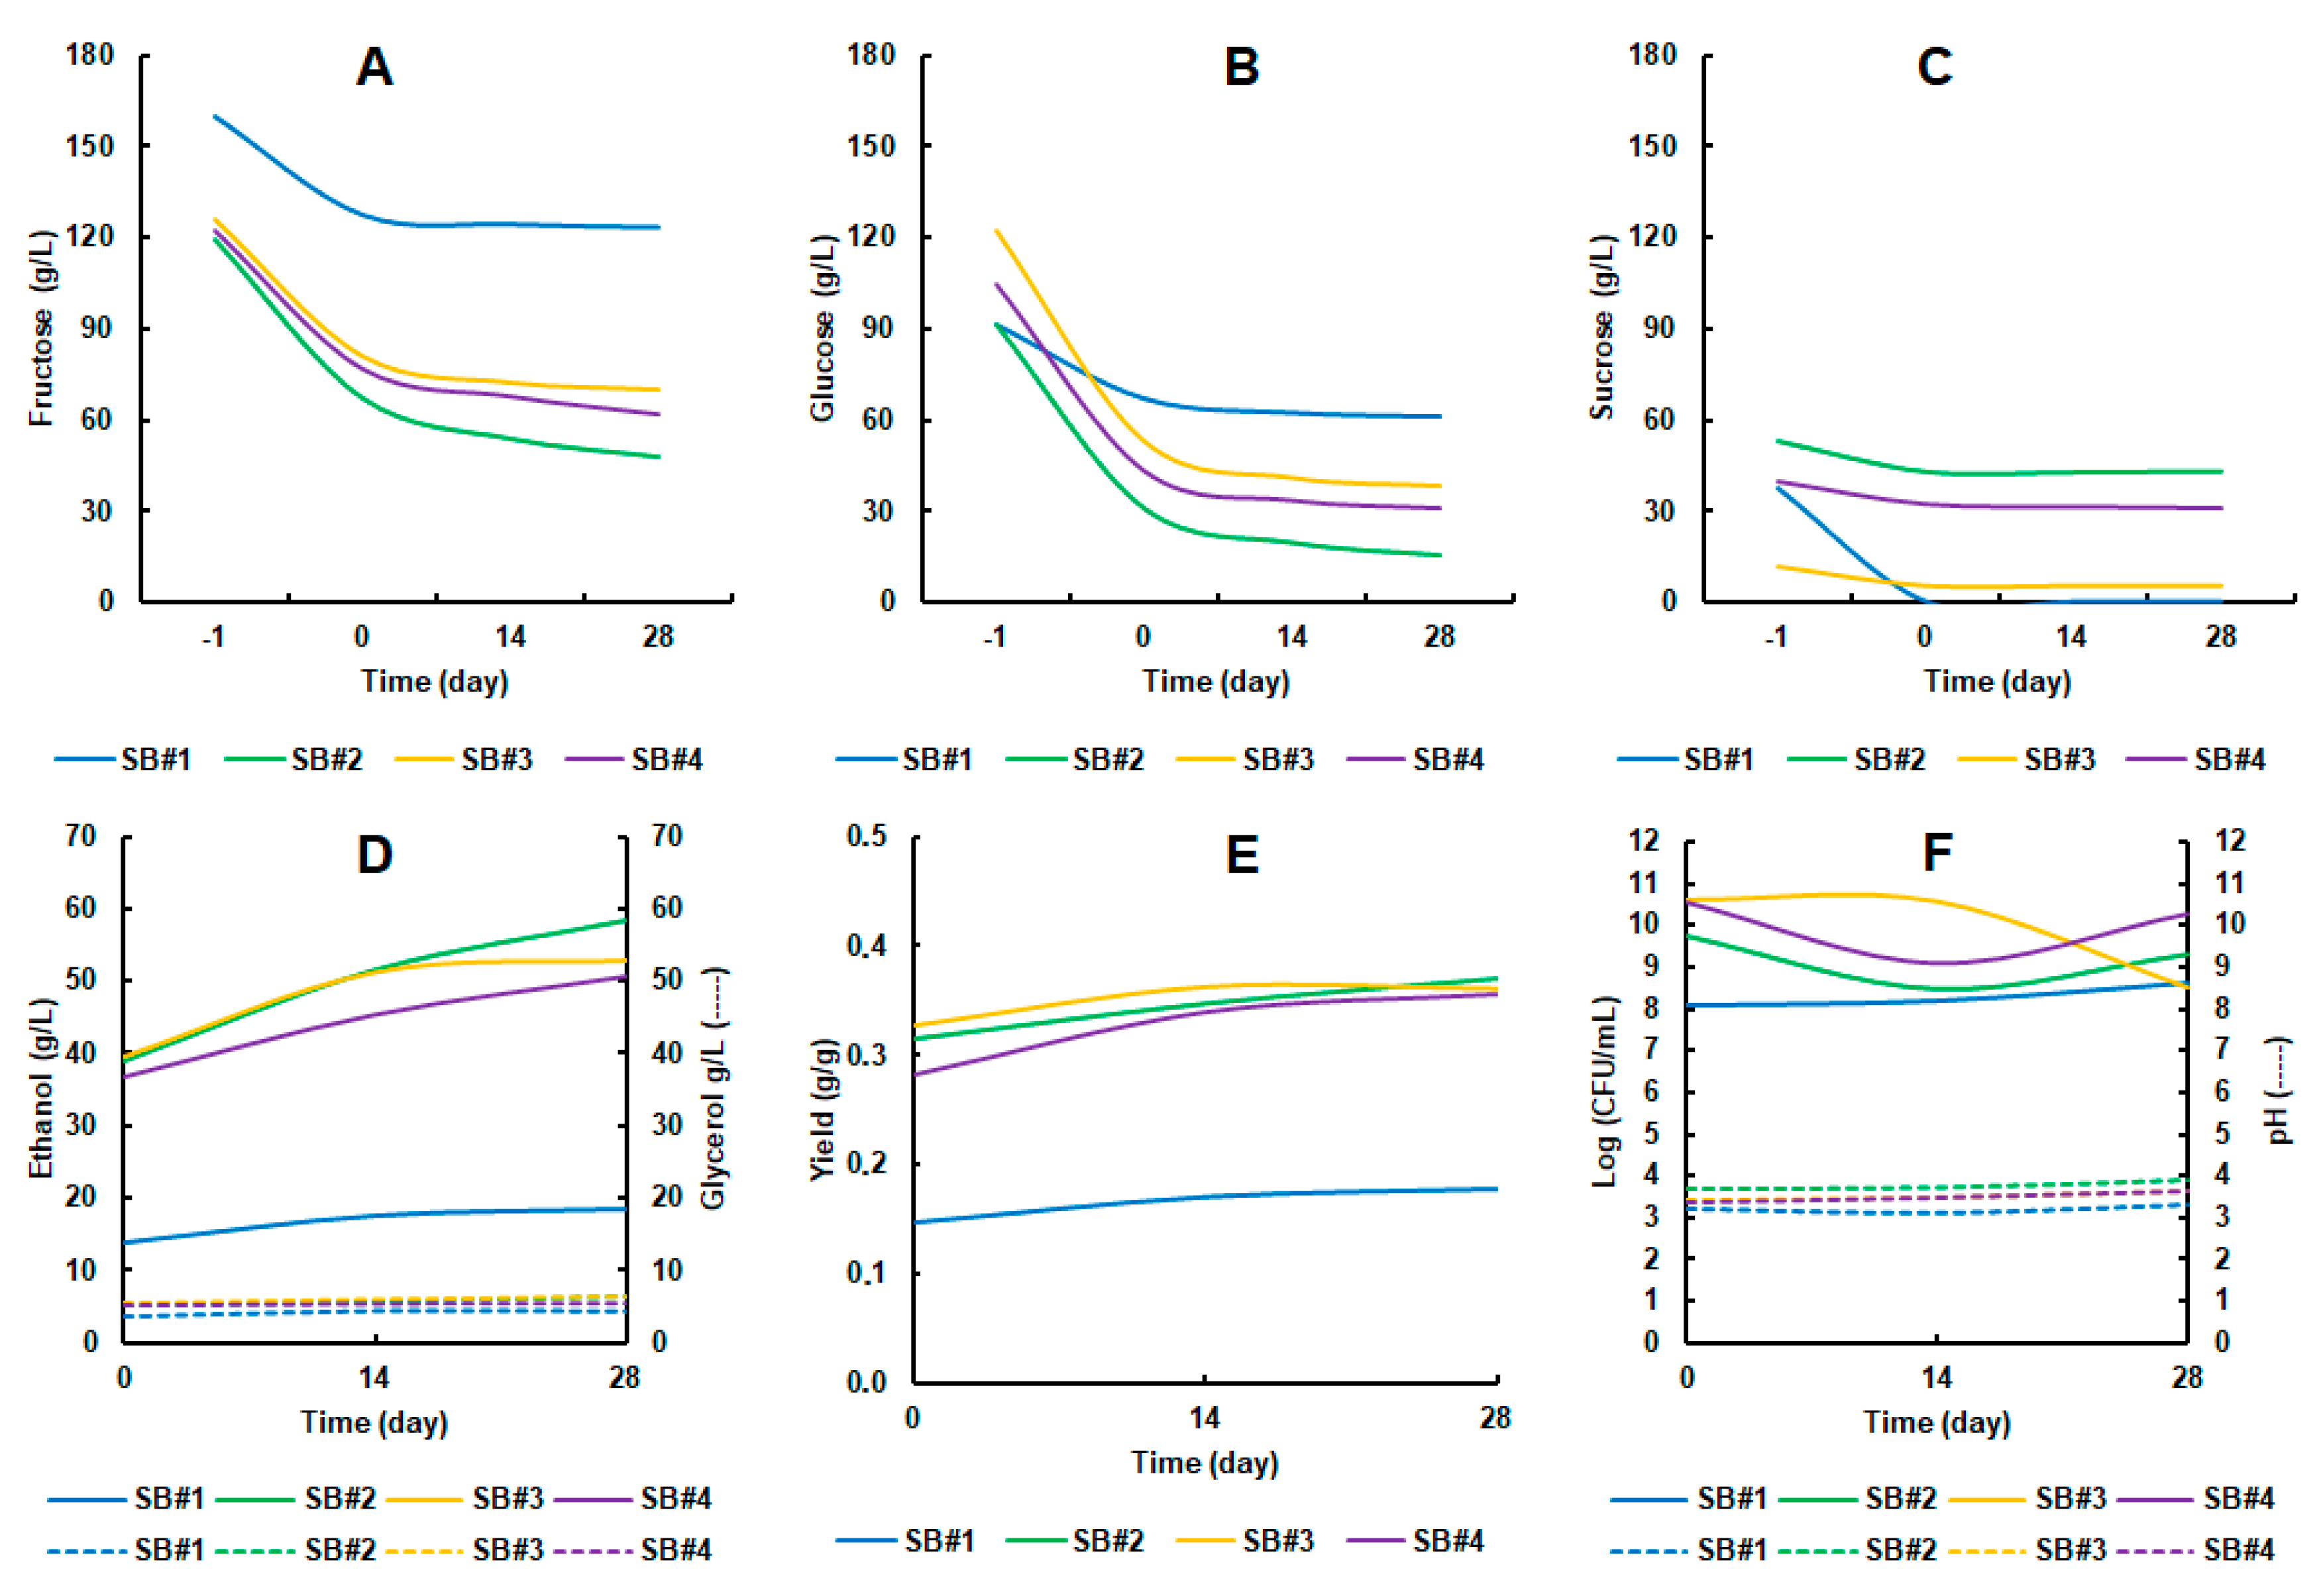
Initially, different sugar concentration was observed in the honeywort. All beverages formulated showed higher concentrations of fructose (Figure 3A) than glucose (Figure 3B), which in turn exceeded the values found for sucrose (Figure 3C). In general, this is the expected proportion, given that raw bee honey has the same ratio. Mongi and Ruhembe [49] showed that the sugar profile in Tanzanian bee honeys is significantly dominated by fructose (39.5 to 42 g/100 g), followed by glucose (32.0 to 33.7 g/100 g) and sucrose (5.1 to 7.1 g/100 g). None of the sugars were completely consumed during the fermentation process and during refrigerated storage, with the exception of sucrose in SB#1 after fermentation at time 0. The contrast between the sucrose that was completely consumed in SB#1 (control condition) and the other synbiotic beverages may be related to what is known as apparent sucrose, present in the synbiotic beverages with bee honey (SB#2 to SB#3). This term refers to some unconventional di- or trisaccharide present in bee honey, which coincides with the sucrose peak in the HPLC analysis carried out [50]. On the other hand, the high residual sugar content of 133.99 ± 13.18 g/L on average is not necessarily a problem, given that the Brazilian population is highly receptive to sweet beverages, such as the popular sugar cane juice, which is widely consumed in the country [51]. In addition, according to Pinto-Neto et al. [2], synbiotic bee honey beverages may have beneficial properties against metabolic diseases such as insulin resistance and hyperglycemia.
The metabolic activity of the yeast cells was confirmed by the production of fermentation products such as ethanol and glycerol in the four synbiotic beverages. The alcohol content in SB#2 to SB#4 was already in the 40 g/L range, while the glycerol content was declared at 5 g/L at the start of the storage period. All the beverages reached a peak of 50 to 60 g/L of ethanol and a yield in the range of 0.36 g/g on the 28th day of storage, except SB#1, which maintained its concentration range of 10 to 20 g/L throughout the analysis and an average yield of 0.18 g/g (Figure 3D,E). Hinojosa-Avila et al. [52,53] showed the benefits of using probiotics even in alcoholic matrices such as beer, emphasizing the moderate and conscious intake of the product. However, alternatives for reducing ethanol yield may include reducing fermentation time or temperature. In addition, the use of a yeast strain with lower ethanol production rates may also be considered. On the other hand, the concentration of glycerol can reach 10 g/L in alcoholic beverages such as beer, which can make the product softer and attenuate the alcoholic sensation, contributing to its flavour and reducing the dryness of the probiotic beverage, along with the apparent presence of sucrose from the honey [54].
The metabolic activity of the yeast and the stability of the synbiotic beverages under refrigeration were evaluated for up to 28 days. The cell population of S. bourlardii CNCM I-745 started at between 8 and 11 Log CFU/mL and remained stable for 28 days of storage and greater than 6 Log CFU/mL (Figure 3F). It is important to note that, for the health-promoting effect of a probiotic beverage, a minimum of 6 to 7 Log CFU/mL of viable cells is required at the time of consumption [55]. The cell viability of SB#3, formulated with bee honey from the Algaroba flower, showed the greatest decline during storage, although it was above the recommended values. However, as will be seen below, this factor is not correlated with survival during passage through simulated GIT conditions. The pH of the medium fell to values in the 3 to 4 range in all the drinks over the 28 days of storage (Figure 3F). This is the pH range observed for some of the synbiotic beverages containing Lacticaseibacillus rhamnosus [34].
Regarding the production of phenylethyl alcohol ester, it was observed that, among the synbiotic beverages containing bee honey, Only SB#3 and SB#4 presented the compound and with relatively high average values of 12.99 ± 0.41% and 20.27 ± 0.85%, respectively, among the more than 35 volatile organic compounds detected during the entire storage time of the beverages. Phenylethyl alcohol ester is a volatile substance with a rose-like odour, widely used in food, fragrances, and cosmetics, and can be produced microbiologically by yeasts [56]. It is a compound widely associated with floral and sweet notes in the aroma of honey, as well as being important in differentiating honey based on its botanical and geographical origin [57]. In other words, it is a desirable component for adding sensory and, therefore, commercial value to a functional beverage.

3.3. Survival of the Saccharomyces Boulardii CNCM I-745 Cell in Synbiotic Beverages Under GIT Static Simulation

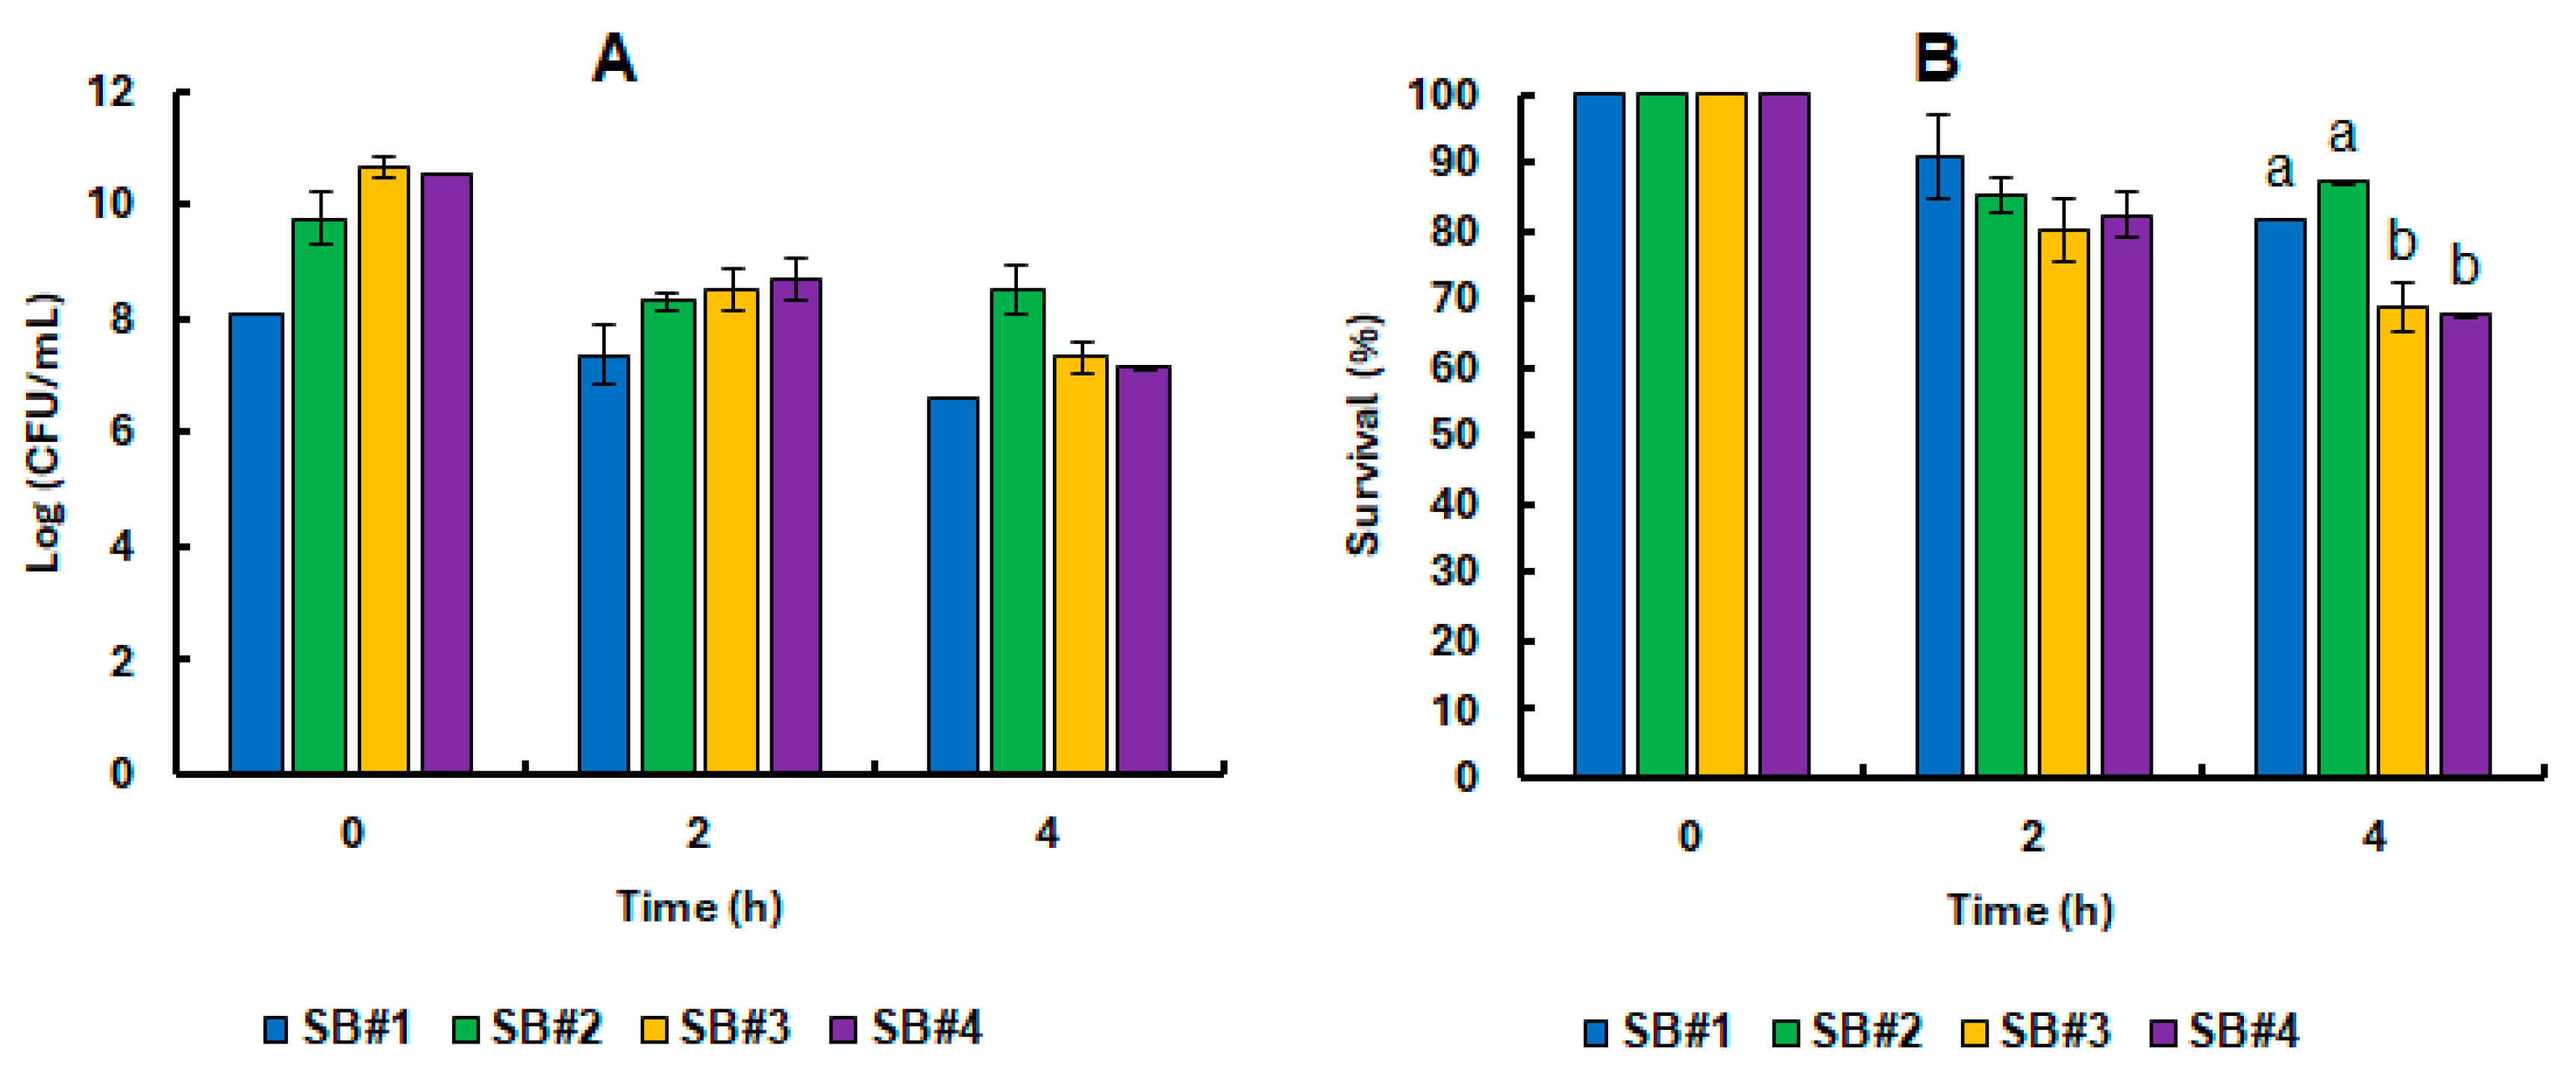
Samples from the SBs and the analogue medium were collected after the fermentation step and used for the static GIT simulation experiment. The initial cell concentration of the beverages was in the range of 8 to 11 Log CFU/mL. These populations remained active after two h of simulated stomach conditions characterized by intense acid stress (Figure 4). The average cell viability value of 8.50 ± 0.19 Log CFU/mL (Figure 4A), which corresponds to a survival of 82.56 ± 2.51% (Figure 4B) found in this work for all the synbiotic beverages containing bee honeys after gastric juice simulation. This survival was maintained at a high level even with the enzymatic action of pepsin in conjunction with acid stress. In the stomach, hydrochloric acid is released at a concentration of 160 mmol/L by the oxyntic glands, which lowers the pH to around 0.8, activating pepsin to break down the peptide bonds of food proteins and release free amino acids that enter the bloodstream [58]. This extremely low pH also contributes to eliminating the presence of pathogenic microorganisms by the entry of protons into microbial cells and by decreasing intracellular pH, producing damage to cellular components such as proteins and DNA, and draining energy from anabolic reactions to maintenance mechanisms, thus inhibiting cell growth [10,59,60].
Previous results from work carried out in our research group indicate that the tolerance of S. cerevisiae to acid stress is associated with attenuation of the activity of the protein kinase A pathway, promoting a reduction in overall metabolism and the rate of protein synthesis [61,62]. This response seems to reflect a cellular strategy to redirect energy to essential maintenance and survival processes. At the same time, the activation of the protein kinase C pathway, which is essential for preserving the integrity of the cell wall, and the Hog1-regulated cascade, which is responsible for adapting to osmotic stress, reveals the complexity of the adaptive response of yeast in adverse environments [63,64]. Thus, the capacity of the cell to drastically slow down its central metabolism, temporarily suspending the cell cycle and growth, is decisive for its survival until more favourable environmental conditions are re-established [65]. These data reinforce the remarkable natural metabolic competence of S. boulardii CNCM I-745 to orchestrate multiple defence mechanisms against acid stress in a coordinated manner.
At the end of the static GIT conditions, the number of viable cells decreased to an average of 7.65 ± 0.73 Log CFU/mL (Figure 4A), representing an average survival rate of 74.53 ± 10.84% (Figure 4B) for the beverages containing bee honey (#SB2 to #SB4). In this last phase, the yeast cells face high concentrations of bile salts and pancreatic and hydrolytic enzymes, which severely affect the plasma membrane. Moreover, alkaline stress can damage cells by inactivating the transporters of vital compounds such as glucose and phosphate [66,67,68,69,70]. In addition, pH equal to or greater than neutrality also reduces the ionization of enzyme cofactor metals such as iron and copper [71]. The results obtained in this work were much higher, even under a more aggressive methodology, than those observed for cells of the same yeast strain pre-exposed to other honeys from the Caatinga Biome, which recorded a survival range of between 40 and 50% [2]. This difference may be related to the GIT simulation methodology applied in both studies and the composition of the beverages themselves. This study used the standardized INFOGEST 2.0 in vitro protocol for static simulation. This is an international consensus of more than 35 countries and multidisciplinary experts who have established a standard mechanistic methodology for static GIT simulation systems that most closely approximates human physio-anatomical conditions and is easy to reproduce [28]. In addition, the beverages in this work were prepared using bee honey as the main matrix for the formulated beverages, whereas in Pinto-Neto et al. [2], honey represented only 10% (w/v) of the overall content of a synbiotic beverage.

3.4. Impact of Bee Honeys from Different Blooms on the Tolerance of Probiotic Yeast in Refrigerated Stock and Under GIT Static Simulation

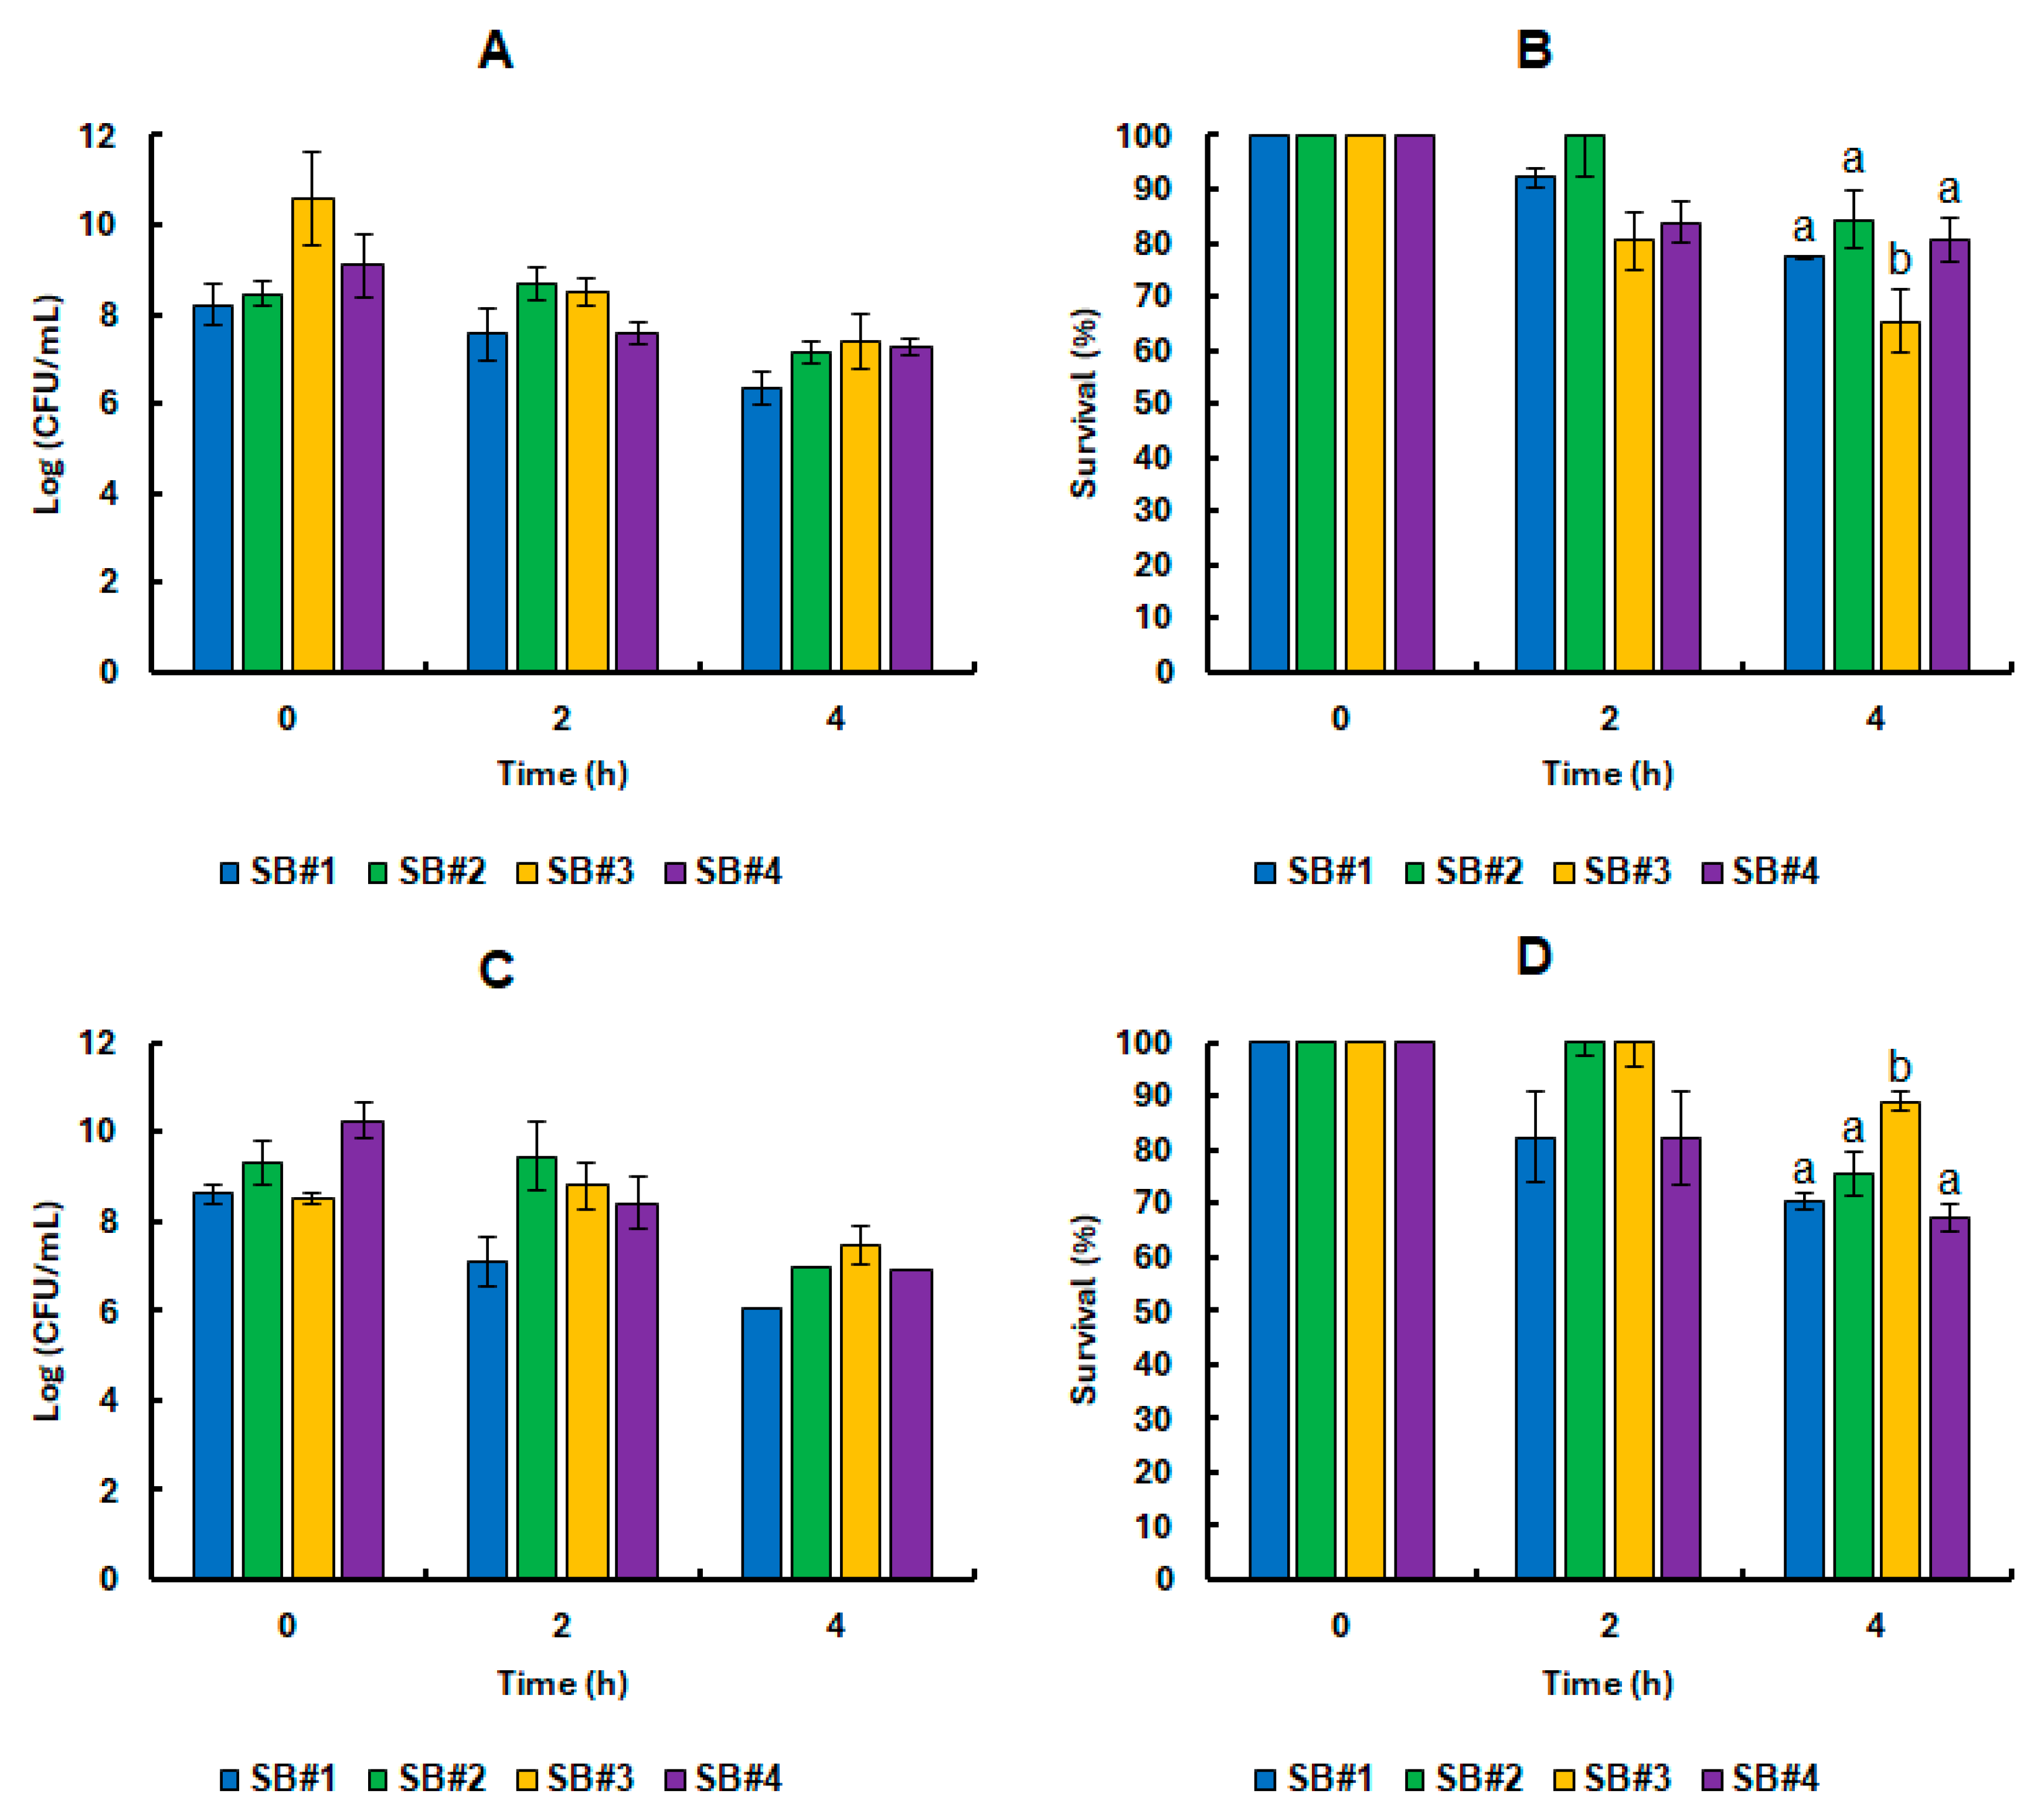
The presence of bee honey in the synbiotic beverages had a slight positive effect on the tolerance yeast cells to the GIT simulation test by prolonged contact in SB#2 (75.30 ± 4.11%) at the end of the storage period, and there was no positive effect for SB#4 (67.25 ± 2.48%), which had a lower survival rate to the static GIT simulation than SB#1 (70.40 ± 1.74%) (Figure 5D). On the other hand, the SB#3 containing bee honey with a predominance of Algaroba flower had a significantly higher survival rate than the other conditions (89.07 ± 1.91%). Furthermore, it can be seen that the cell viability of the probiotic yeast was always higher in the synbiotic beverages containing bee honey, even when they were all subjected to the same cell proliferation treatment.
Our recent publication also reported this GIT tolerance induced by bee honey on yeast cells [2]. This indicates that the shelf life of this product may be longer when in contact with the honey mixture. In addition, we can now prove that the predominant honey bloom also impacts the tolerance of S. boulardii CNCM I-745 cells during static simulation of the GIT during refrigerated storage of the product. These results are also in line with the review carried out by our research group on the benefits of using bee honey with different physicochemical properties in synbiotic beverages [72]. In this sense, it can be speculated that this action is due to the presence of phenolic compounds and the antioxidant activity detected (Table 2). These molecules are reported to protect cells against oxidative damage [73,74,75]. Dimitriu et al. [76] proposed a relationship between the antioxidant and prebiotic activities of honey used in the daily diet, precisely because they are readily absorbed by the GIT microbiota of animals, protecting microbial cells. Agarbati et al. [77] demonstrated the resilience of this probiotic yeast by maintaining 23% of cell viability after 120 h of incubation in the YNB medium adjusted to pH 2.5 and containing bile salts at 3 g/L. This work also demonstrated the greater resistance of other strains of S. cerevisiae from natural home-made yeast and S. bayanus from Verdicchio wine to this test. This arouses curiosity to test other yeast strains that we isolate from industrial processes that withstand great stress challenges, for which the yeasts must have been adapted, such as the industrial fermentation of fuel ethanol [78].

3.5. Honey Confers Resilience to Saccharomyces Boulardii CNCM I-745 Under More Realistic GIT Conditions: A Multimethodological Approach

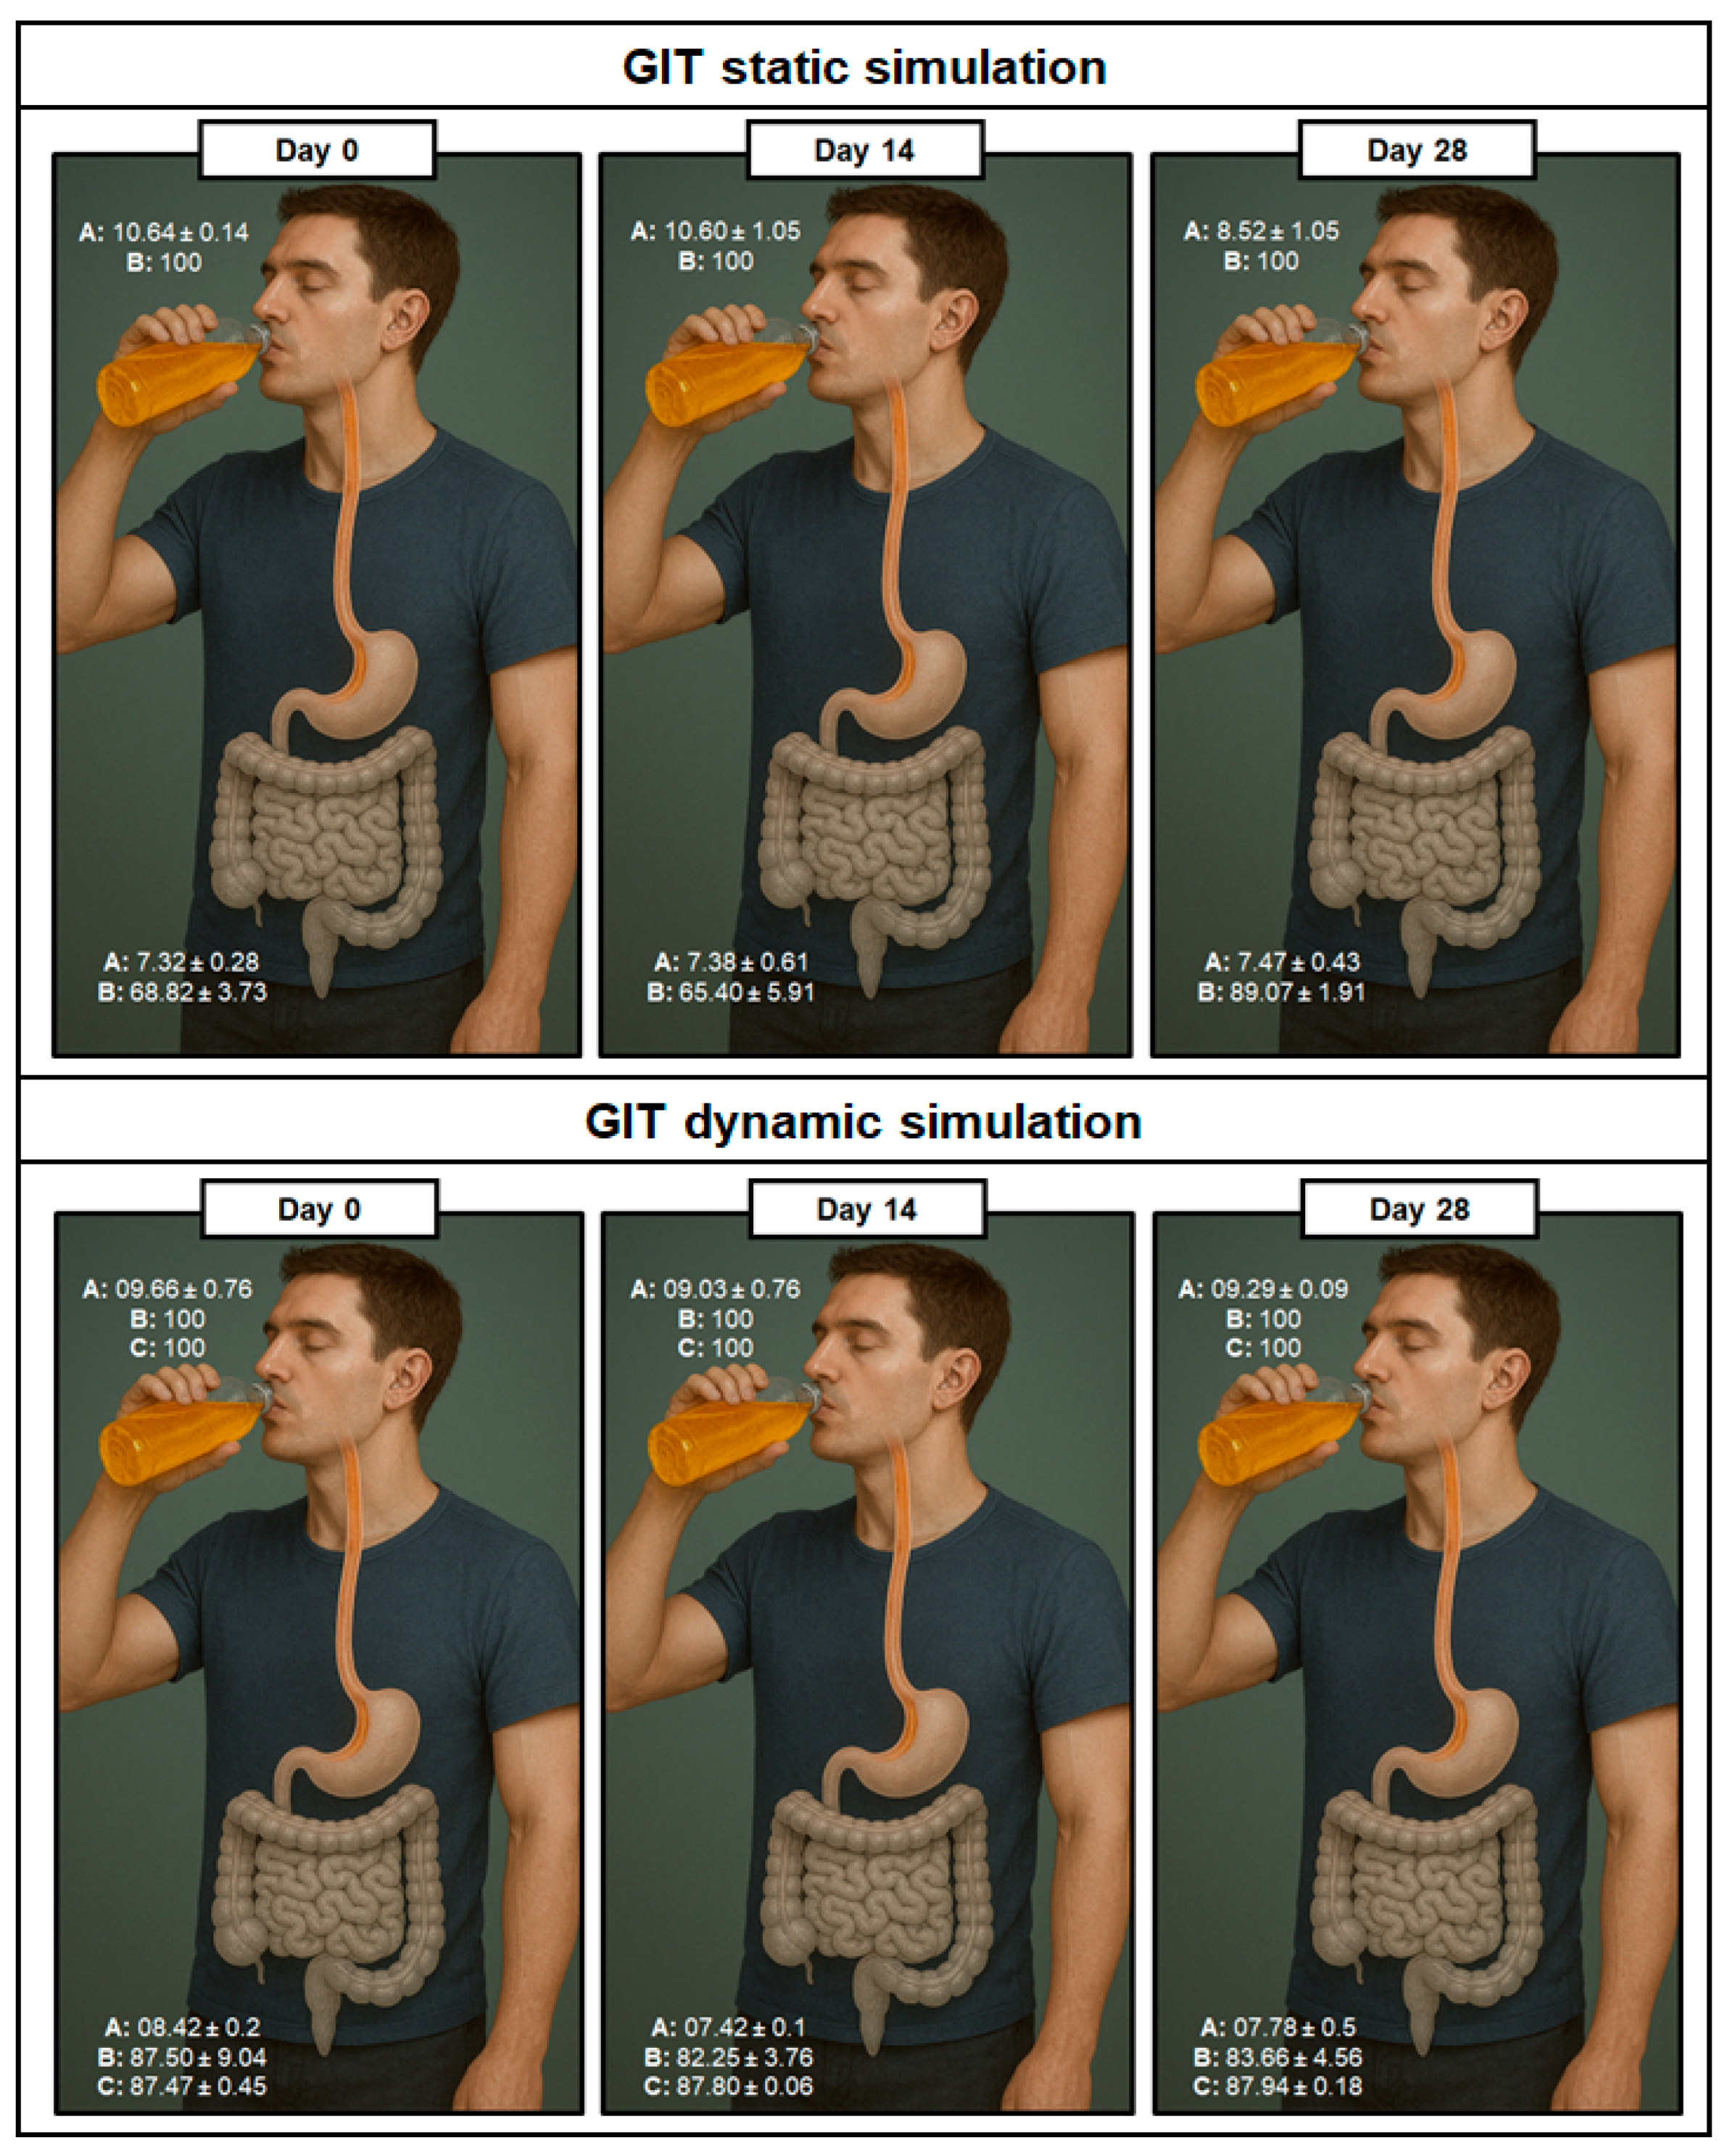
It is now known that Apis mellifera bee honeys from the Caatinga Biome, as well as having a potential prebiotic effect, also have a direct impact on the tolerance of the probiotic yeast, depending on the predominance of its bloom. The SB#3 with a predominance of Algaroba flowers, which showed the best results in the static in vitro GIT simulation tests, was chosen to be followed by dynamic in vitro GIT simulation tests to reinforce the prebiotic potential of this matrix under more realistic physio-anatomical conditions simulating the human GIT. To this end, in addition to the two GIT simulation methodologies adopted, the estimation of the number of viable cells of the probiotic yeast was also analysed by flow cytometry for the dynamic in vitro GIT simulation trials. The results suggest that the tolerance of S. boulardii CNCM I-745 cells immersed in the prebiotic effect of honey with predominant Algaroba blossom has an even higher survival rate when subjected to more realistic human physio-anatomical conditions up to the day 14 of storage of the beverage (static simulation: 65.40 ± 5.91%; dynamic simulation: 82.25 ± 3.76%) (Figure 6). These values show a small reduction in the observation time of the beverage under refrigerated storage and GIT simulations (static simulation: 89.07 ± 1.91%; dynamic simulation: 83.66 ± 4.56%). However, the survival values observed using flow cytometry counting were equal to or even higher than those observed using the classic microbiological method, with an average between the different analysis times of 87.74 ± 0.24% survival compared to 84.47 ± 2.72%. (Figure 6). This observed difference may also be related to the number of viable cells that no longer have the ability to reproduce and are therefore not taken into account in the classical microbiological method [78]. The next step now is to conduct further research into the other varieties of honey produced in the Caatinga biome, both from Africanized bees and native bees of the Brazilian fauna. In addition, test different strains of yeast and probiotic bacteria beyond the static and dynamic in vitro simulation systems of the TGI, but observe the behavior of these beverages in well-controlled in vivo systems.

4. Conclusions

The results of this study showed the potential of honey from the Pajeú hinterland (Caatinga Biome) to induce cell tolerance of the probiotic yeast S. bourlardii CNCM I-745 present in a synbiotic bee honey beverage. This is of great relevance to the probiotic industry, as the biggest challenge is to offer consumers a product that is as effective as possible from a population of metabolically active cells that reach the intestine. In this sense, the prebiotic potential of this honey was presented, as well as how the different botanical origins impact its potential for use in the formulation of an innovative synbiotic alcoholic beverage. The use of yeast to produce alcoholic beverages, as presented here, is being widely investigated in the literature and should absolutely be restricted to adult consumers. This investment in research is due to the nutraceutical potential of these beverages and how they can mitigate any problems caused by the consumption of alcohol in a conventional alcoholic beverage.
This work has contributed to a better understanding of how bee honey (Apis mellifera), especially from the Caatinga Biome and with different botanical origins, behaves during storage and in the human gastrointestinal tract from the perspective of having a potential prebiotic effect on probiotic yeasts. This knowledge will be useful to optimize functional products based on honey with greater stability and free of milk and dairy products, as well as encouraging the promotion of sustainable management of the Caatinga Biome and, consequently, benefiting the local productive arrangement made up of socio-economically weakened beneficiaries. The future plans of our research group are to test this prebiotic potential in other honeys from the Caatinga Biome and against other strains of microorganisms and in vivo GIT systems.

Author Contributions

W.d.P.P.-N.: Conceptualization, Data curation, Formal analysis, Investigation, Methodology, Writing—original draft. L.L.: Data curation, Formal analysis, Investigation, Methodology. R.F.S.G.: Data curation, Formal analysis, Investigation, Methodology. M.C.T.M.: Data curation, Formal analysis, Investigation, Methodology. R.M.M.R.: Data curation, Formal analysis, Investigation, Methodology. L.A.: Formal analysis; Investigation. A.M.d.B.: Formal analysis; Investigation. N.K.S.S.: Formal analysis; Investigation; Writing—review and editing. A.C.P.: Formal analysis, Investigation, Methodology, Supervision, Writing—review and editing. A.A.V.: Investigation, Supervision, Funding acquisition, Writing—review and editing. R.B.d.S.: Conceptualization, Data curation, Formal analysis, Investigation, Methodology, Supervision, Writing—original draft, Writing—review and editing. M.A.d.M.J.: Conceptualization, Data curation, Formal analysis, Investigation, Methodology, Supervision, Funding acquisition, Project administration Writing—original draft, Writing—review and editing. All authors have read and agreed to the published version of the manuscript.

Funding

This research was granted by Fundação de Amparo à Pesquisa do Estado de Pernambuco (FACEPE) through the Program Arranjos Produtivos Locais (APL) grant number APQ-0434-2.12/20 and the program Locus de Inovação 02/2022 grant number APQ-0161-9.26/22. W.P.P.N. acknowledges FACEPE for his doctoral scholarship and the Coordination for the Improvement of Higher Education Personnel (CAPES) for his sandwich doctoral internship. This work was also supported by the Portuguese Foundation for Science and Technology (FCT) under the scope of the strategic funding of UIDB/04469/2020 unit, and by LABBELS—Associate Laboratory in Biotechnology, Bioengineering and Microelectromechanical Systems, LA/P/0029/2020.

Data Availability Statement

The original contributions presented in this study are included in the article. Further inquiries can be directed to the corresponding author.

Acknowledgments

A.C.P. acknowledges FCT for her Assistant Research contract obtained under the scope of Scientific Stimulus Employment with reference 2023.06513.CEECIND. During the preparation of this work, the author(s) used ChatGPT v4.5 to create visual elements to compose some of the figures in the work and assume(s) full responsibility for the content of the publication.

Conflicts of Interest

The authors declare no conflicts of interest.

References

  1. CXS 12-1981; FAO/WHO Standard for Honey. Codex Alimentarius: International Food Standards. United Nations Press: New York, NY, USA, 2019.
  2. Pinto-Neto, W.d.P.; Silva, R.K.; Lima, B.d.S.; Acioli, G.F.d.S.; Paixão, G.A.d.; Muniz, B.C.; Silva, P.K.N.d.; Costa, R.M.P.B.; Silva, F.S.B.d.; Melo, H.F.d.; et al. Bee Honey of the Pajeú Hinterland, Pernambuco, Brazil: Physicochemical Characterization and Biological Activity. Food Biosci. 2024, 60, 104289. [Google Scholar] [CrossRef]
  3. Sabóia Guerra Diógenes, É.; Da Silva, A.L.C.; Chagas Neto, F.C.D.; Silveira, E.R.; Leal, L.K.A.M.; Nicolete, R.; De Araújo, T.G. Evaluation of the Skin Whitening and Antioxidant Activity of Myracrodruon urundeuva Extract (Aroeira-Do-Sertão). Nat. Prod. Res. 2024, 38, 3663–3668. [Google Scholar] [CrossRef]
  4. Aguirre-Loredo, R.Y. Mesquite Tree (Prosopis spp.): A Native Resource for the Potential for Human Consumption and Healthcare. Plant Foods Hum. Nutr. Dordr. Neth. 2024, 80, 5. [Google Scholar] [CrossRef]
  5. Falcão, M.P.M.M.; Oliveira, T.K.B.; do Ó, N.P.R.; Sarmento, D.A.; Gadelha, N.C. Schinus terebinthifolius Raddi (Aroeira) e suas propriedades na Medicina Popular. Rev. Verde Agroecol. E Desenvolv. Sustentável 2015, 10, 23–27. [Google Scholar] [CrossRef]
  6. Ogrodowczyk, A.M.; Markiewicz, L.; Szmatowicz, B.; Koźniewski, B.; Wróblewska, B. Improved Quality, Sensory Properties and Nutraceutical Potential of the Fermented Beverages Fortified with Freeze-Dried Berries and Acacia Honey. Food Chem. 2025, 486, 144469. [Google Scholar] [CrossRef]
  7. FAO. WHO Guidelines for the Evaluation of Probiotics in Food; FAO: London, UK, 2002. [Google Scholar]
  8. Gibson, G.R.; Hutkins, R.; Sanders, M.E.; Prescott, S.L.; Reimer, R.A.; Salminen, S.J.; Scott, K.; Stanton, C.; Swanson, K.S.; Cani, P.D.; et al. Expert Consensus Document: The International Scientific Association for Probiotics and Prebiotics (ISAPP) Consensus Statement on the Definition and Scope of Prebiotics. Nat. Rev. Gastroenterol. Hepatol. 2017, 14, 491–502. [Google Scholar] [CrossRef]
  9. Markowiak, P.; Śliżewska, K. Effects of Probiotics, Prebiotics, and Synbiotics on Human Health. Nutrients 2017, 9, 1021. [Google Scholar] [CrossRef]
  10. Mendonça, A.A.; Pinto-Neto, W.d.P.; da Paixão, G.A.; Santos, D.d.S.; De Morais, M.A., Jr.; De Souza, R.B. Journey of the Probiotic Bacteria: Survival of the Fittest. Microorganisms 2023, 11, 95. [Google Scholar] [CrossRef]
  11. Czerucka, D.; Rampal, P. Diversity of Saccharomyces Boulardii CNCM I-745 Mechanisms of Action against Intestinal Infections. World J. Gastroenterol. 2019, 25, 2188–2203. [Google Scholar] [CrossRef]
  12. Kaźmierczak-Siedlecka, K.; Ruszkowski, J.; Fic, M.; Folwarski, M.; Makarewicz, W. Saccharomyces Boulardii CNCM I-745: A Non-Bacterial Microorganism Used as Probiotic Agent in Supporting Treatment of Selected Diseases. Curr. Microbiol. 2020, 77, 1987–1996. [Google Scholar] [CrossRef]
  13. Gopalan, S.; Ganapathy, S.; Mitra, M.; Neha; Kumar Joshi, D.; Veligandla, K.C.; Rathod, R.; Kotak, B.P. Unique Properties of Yeast Probiotic Saccharomyces Boulardii CNCM I-745: A Narrative Review. Cureus 2023, 15, e46314. [Google Scholar] [CrossRef]
  14. Moré, M.I.; Swidsinski, A. Saccharomyces Boulardii CNCM I-745 Supports Regeneration of the Intestinal Microbiota after Diarrheic Dysbiosis—A Review. Clin. Exp. Gastroenterol. 2015, 8, 237–255. [Google Scholar] [CrossRef]
  15. Neut, C.; Mahieux, S.; Dubreuil, L.J. Antibiotic Susceptibility of Probiotic Strains: Is It Reasonable to Combine Probiotics with Antibiotics? Médecine Mal. Infect. 2017, 47, 477–483. [Google Scholar] [CrossRef]
  16. Tamang, J.P.; Lama, S. Probiotic Properties of Yeasts in Traditional Fermented Foods and Beverages. J. Appl. Microbiol. 2022, 132, 3533–3542. [Google Scholar] [CrossRef]
  17. Instituto Adolfo Lutz (Ed.) Métodos Físico-Químicos Para Análise de Alimentos, 1st digital ed.; Instituto Adolfo Lutz: São Paulo, Brazil, 2008. [Google Scholar]
  18. Smith, P.K.; Krohn, R.I.; Hermanson, G.T.; Mallia, A.K.; Gartner, F.H.; Provenzano, M.D.; Fujimoto, E.K.; Goeke, N.M.; Olson, B.J.; Klenk, D.C. Measurement of Protein Using Bicinchoninic Acid. Anal. Biochem. 1985, 150, 76–85. [Google Scholar] [CrossRef]
  19. Benzie, I.F.F.; Strain, J.J. The Ferric Reducing Ability of Plasma (FRAP) as a Measure of “Antioxidant Power”: The FRAP Assay. Anal. Biochem. 1996, 239, 70–76. [Google Scholar] [CrossRef]
  20. Orujei, Y.; Shabani, L.; Sharifi-Tehrani, M. Induction of Glycyrrhizin and Total Phenolic Compound Production in Licorice by Using Arbuscular Mycorrhizal Fungi. Russ. J. Plant Physiol. 2013, 60, 855–860. [Google Scholar] [CrossRef]
  21. de Sousa Araújo, T.A.; Alencar, N.L.; de Amorim, E.L.C.; de Albuquerque, U.P. A New Approach to Study Medicinal Plants with Tannins and Flavonoids Contents from the Local Knowledge. J. Ethnopharmacol. 2008, 120, 72–80. [Google Scholar] [CrossRef]
  22. Woisky, R.G.; and Salatino, A. Analysis of Propolis: Some Parameters and Procedures for Chemical Quality Control. J. Apic. Res. 1998, 37, 99–105. [Google Scholar] [CrossRef]
  23. Bencherif, K.; Djaballah, Z.; Brahimi, F.; Boutekrabt, A.; Dalpè, Y.; Lounès-Hadj Sahraoui, A. Arbuscular Mycorrhizal Fungi Affect Total Phenolic Content and Antimicrobial Activity of Tamarix Gallica in Natural Semi-Arid Algerian Areas. S. Afr. J. Bot. 2019, 125, 39–45. [Google Scholar] [CrossRef]
  24. AOAC International. Official Methods of Analysis of AOAC International, 17th ed.; AOAC International: Gaithersburg, MD, USA, 2002. [Google Scholar]
  25. AOAC International. Official Methods of Analysis of AOAC International, 18th ed.; AOAC International: Gaithersburg, MD, USA, 2005. [Google Scholar]
  26. Vidal, E.E.; de Billerbeck, G.M.; Simões, D.A.; Schuler, A.; François, J.M.; de Morais, M.A. Influence of Nitrogen Supply on the Production of Higher Alcohols/Esters and Expression of Flavour-Related Genes in Cachaça Fermentation. Food Chem. 2013, 138, 701–708. [Google Scholar] [CrossRef]
  27. Espinosa Vidal, E.; de Morais Jr, M.A.; François, J.M.; de Billerbeck, G.M. Biosynthesis of Higher Alcohol Flavour Compounds by the Yeast Saccharomyces Cerevisiae: Impact of Oxygen Availability and Responses to Glucose Pulse in Minimal Growth Medium with Leucine as Sole Nitrogen Source. Yeast 2015, 32, 47–56. [Google Scholar] [CrossRef]
  28. Brodkorb, A.; Egger, L.; Alminger, M.; Alvito, P.; Assunção, R.; Ballance, S.; Bohn, T.; Bourlieu-Lacanal, C.; Boutrou, R.; Carrière, F.; et al. INFOGEST Static in Vitro Simulation of Gastrointestinal Food Digestion. Nat. Protoc. 2019, 14, 991–1014. [Google Scholar] [CrossRef]
  29. Minekus, M.; Alminger, M.; Alvito, P.; Ballance, S.; Bohn, T.; Bourlieu, C.; Carrière, F.; Boutrou, R.; Corredig, M.; Dupont, D.; et al. A Standardised Static in Vitro Digestion Method Suitable for Food—An International Consensus. Food Funct. 2014, 5, 1113–1124. [Google Scholar] [CrossRef]
  30. Mulet-Cabero, A.-I.; Egger, L.; Portmann, R.; Ménard, O.; Marze, S.; Minekus, M.; Feunteun, S.L.; Sarkar, A.; Grundy, M.M.-L.; Carrière, F.; et al. A Standardised Semi-Dynamic in Vitro Digestion Method Suitable for Food—An International Consensus. Food Funct. 2020, 11, 1702–1720. [Google Scholar] [CrossRef]
  31. Pinheiro, A.C.; Coimbra, M.A.; Vicente, A.A. In Vitro Behaviour of Curcumin Nanoemulsions Stabilized by Biopolymer Emulsifiers—Effect of Interfacial Composition. Food Hydrocoll. 2016, 52, 460–467. [Google Scholar] [CrossRef]
  32. Pinheiro, A.C.; Gonçalves, R.F.; Madalena, D.A.; Vicente, A.A. Towards the Understanding of the Behavior of Bio-Based Nanostructures during in vitro Digestion. Curr. Opin. Food Sci. 2017, 15, 79–86. [Google Scholar] [CrossRef]
  33. Fernandes, J.-M.; Madalena, D.A.; Vicente, A.A.; Pinheiro, A.C. Influence of the Addition of Different Ingredients on the Bioaccessibility of Glucose Released from Rice during Dynamic in Vitro Gastrointestinal Digestion. Int. J. Food Sci. Nutr. 2021, 72, 45–56. [Google Scholar] [CrossRef]
  34. Günerken, E.; D’Hondt, E.; Eppink, M.; Elst, K.; Wijffels, R. Flow Cytometry to Estimate the Cell Disruption Yield and Biomass Release of Chlorella Sp. during Bead Milling. Algal Res. 2017, 25, 25–31. [Google Scholar] [CrossRef]
  35. Loureiro, L.; Machado, L.; Geada, P.; Vasconcelos, V.; Vicente, A.A. Evaluation of Efficiency of Disruption Methods for Coelastrella Sp. in Order to Obtain High Yields of Biochemical Compounds Release. Algal Res. 2023, 73, 103158. [Google Scholar] [CrossRef]
  36. Azeredo, L.d.C.; Azeredo, M.A.A.; de Souza, S.R.; Dutra, V.M.L. Protein Contents and Physicochemical Properties in Honey Samples of Apis Mellifera of Different Floral Origins. Food Chem. 2003, 80, 249–254. [Google Scholar] [CrossRef]
  37. Kadri, S.M.; Zaluski, R.; Pereira Lima, G.P.; Mazzafera, P.; de Oliveira Orsi, R. Characterization of Coffea Arabica Monofloral Honey from Espírito Santo, Brazil. Food Chem. 2016, 203, 252–257. [Google Scholar] [CrossRef]
  38. Yang, W.; Zhang, C.; Li, C.; Huang, Z.Y.; Miao, X. Pathway of 5-Hydroxymethyl-2-Furaldehyde Formation in Honey. J. Food Sci. Technol. 2019, 56, 2417–2425. [Google Scholar] [CrossRef]
  39. Ministério da Agricultura e Abastecimento. Regulamento Técnico de Identidade e Qualidade Do Mel; Ministério da Agricultura e Abastecimento: Brasilia, Brazil, 2000. [Google Scholar]
  40. European Community (EC) Council Directive 2001/110/EC of 20 December 2001 Relating to Honey; European Union: Brussels, Belgium, 2002.
  41. Codex Alimentarius Revised Codex Standard for Honey; United Nations Press: New York, NY, USA, 2022.
  42. Terrab, A.; Recamales, A.F.; Hernanz, D.; Heredia, F.J. Characterisation of Spanish Thyme Honeys by Their Physicochemical Characteristics and Mineral Contents. Food Chem. 2004, 88, 537–542. [Google Scholar] [CrossRef]
  43. Dekeba Tafa, K.; Sundramurthy, V.P.; Subramanian, N. Rheological and Thermal Properties of Honey Produced in Algeria and Ethiopia: A Review. Int. J. Food Prop. 2021, 24, 1117–1131. [Google Scholar] [CrossRef]
  44. Almeida, A.M.M.d.; Oliveira, M.B.S.; Costa, J.G.d.; Valentim, I.B.; Goulart, M.O.F. Antioxidant Capacity, Physicochemical and Floral Characterization of Honeys from the Northeast of Brazil. Rev. Virtual Química 2016, 8, 57–77. [Google Scholar] [CrossRef]
  45. Di Marco, G.; Manfredini, A.; Leonardi, D.; Canuti, L.; Impei, S.; Gismondi, A.; Canini, A. Geographical, Botanical and Chemical Profile of Monofloral Italian Honeys As Food Quality Guarantee and Territory Brand. Plant Biosyst. - Int. J. Deal. Asp. Plant Biol. 2016, 151, 450–463. [Google Scholar] [CrossRef]
  46. Alugoju, P.; Janardhanshetty, S.S.; Subaramanian, S.; Periyasamy, L.; Dyavaiah, M. Quercetin Protects Yeast Saccharomyces Cerevisiae Pep4 Mutant from Oxidative and Apoptotic Stress and Extends Chronological Lifespan. Curr. Microbiol. 2018, 75, 519–530. [Google Scholar] [CrossRef]
  47. Alevia, M.; Rasines, S.; Cantero, L.; Sancho, M.T.; Fernández-Muiño, M.A.; Osés, S.M. Chemical Extraction and Gastrointestinal Digestion of Honey: Influence on Its Antioxidant, Antimicrobial and Anti-Inflammatory Activities. Foods 2021, 10, 1412. [Google Scholar] [CrossRef]
  48. Mongi, R.J.; Ruhembe, C.C. Sugar Profile and Sensory Properties of Honey from Different Geographical Zones and Botanical Origins in Tanzania. Heliyon 2024, 10, e38094. [Google Scholar] [CrossRef]
  49. Anklam, E. A Review of the Analytical Methods to Determine the Geographical and Botanical Origin of Honey. Food Chem. 1998, 63, 549–562. [Google Scholar] [CrossRef]
  50. Silva, J.; Lima, C.; Miranda, R.; Seraglio, S.; Barbosa, E.; Souza, A.; Cardoso, D. Sensorial Quality of Sugarcane Juice with the Addition of Fruits Pulp from the Semi-Arid. Res. Soc. Dev. 2020, 9, 200973745. [Google Scholar] [CrossRef]
  51. Pinto Neto, W.d.P.; Costa de Lucena, T.M.; Alves da Paixão, G.; Shinohara, N.K.S.; Pinheiro, A.C.; Vicente, A.A.; de Souza, R.B.; de Morais Junior, M.A. Symbiotic Honey Beverages: A Matrix Which Tells a Story of Survival and Protection of Human Health from a Gastronomic and Industrial Perspective. Int. J. Gastron. Food Sci. 2025, 40, 101183. [Google Scholar] [CrossRef]
  52. Hinojosa-Avila, C.R.; García-Gamboa, R.; Chedraui-Urrea, J.J.T.; García-Cayuela, T. Exploring the Potential of Probiotic-Enriched Beer: Microorganisms, Fermentation Strategies, Sensory Attributes, and Health Implications. Food Res. Int. 2024, 175, 113717. [Google Scholar] [CrossRef]
  53. Zhao, X.; Procopio, S.; Becker, T. Flavor Impacts of Glycerol in the Processing of Yeast Fermented Beverages: A Review. J. Food Sci. Technol. 2015, 52, 7588–7598. [Google Scholar] [CrossRef]
  54. Rasika, D.M.; Vidanarachchi, J.K.; Rocha, R.S.; Balthazar, C.F.; Cruz, A.G.; Sant’Ana, A.S.; Ranadheera, C.S. Plant-Based Milk Substitutes as Emerging Probiotic Carriers. Curr. Opin. Food Sci. 2021, 38, 8–20. [Google Scholar] [CrossRef]
  55. Andrade, R.; Santos, E.; Azoubel, P.; Ribeiro, E. Increased Survival of Lactobacillus Rhamnosus ATCC 7469 in Guava Juices with Simulated Gastrointestinal Conditions during Refrigerated Storage. Food Biosci. 2019, 32, 100470. [Google Scholar] [CrossRef]
  56. de Melo Pereira, G.V.; Medeiros, A.B.P.; Camara, M.C.; Magalhães Júnior, A.I.; de Carvalho Neto, D.P.; Bier, M.C.J.; Soccol, C.R. Chapter 11—Production and Recovery of Bioaromas Synthesized by Microorganisms. In The Role of Alternative and Innovative Food Ingredients and Products in Consumer Wellness; Galanakis, C.M., Ed.; Academic Press: Cambridge, MA, USA, 2019; pp. 315–338. ISBN 978-0-12-816453-2. [Google Scholar]
  57. Mahmoud, M.A.A.; Kılıç-Büyükkurt, Ö.; Aboul Fotouh, M.M.; Selli, S. Aroma Active Compounds of Honey: Analysis with GC-MS, GC-O, and Molecular Sensory Techniques. J. Food Compos. Anal. 2024, 134, 106545. [Google Scholar] [CrossRef]
  58. Camilleri, M. Integrated Upper Gastrointestinal Response to Food Intake. Gastroenterology 2006, 131, 640–658. [Google Scholar] [CrossRef]
  59. Orij, R.; Brul, S.; Smits, G.J. Intracellular pH Is a Tightly Controlled Signal in Yeast. Biochim. Biophys. Acta BBA - Gen. Subj. 2011, 1810, 933–944. [Google Scholar] [CrossRef]
  60. Guan, N.; Liu, L. Microbial Response to Acid Stress: Mechanisms and Applications. Appl. Microbiol. Biotechnol. 2020, 104, 51–65. [Google Scholar] [CrossRef]
  61. De Melo, H.F.; Bonini, B.M.; Thevelein, J.; Simões, D.A.; Morais, M.A., Jr. Physiological and Molecular Analysis of the Stress Response of Saccharomyces Cerevisiae Imposed by Strong Inorganic Acid with Implication to Industrial Fermentations. J. Appl. Microbiol. 2010, 109, 116–127. [Google Scholar] [CrossRef]
  62. de Lucena, R.M.; Elsztein, C.; de Barros Pita, W.; de Souza, R.B.; de Sá Leitão Paiva Júnior, S.; de Morais Junior, M.A. Transcriptomic Response of Saccharomyces Cerevisiae for Its Adaptation to Sulphuric Acid-Induced Stress. Antonie Van Leeuwenhoek 2015, 108, 1147–1160. [Google Scholar] [CrossRef]
  63. de Lucena, R.M.; Elsztein, C.; Simões, D.A.; de Morais, M.A. Participation of CWI, HOG and Calcineurin Pathways in the Tolerance of Saccharomyces Cerevisiae to Low pH by Inorganic Acid. J. Appl. Microbiol. 2012, 113, 629–640. [Google Scholar] [CrossRef]
  64. de Lucena, R.M.; Elsztein, C.; Barros de Souza, R.; de Barros Pita, W.; Paiva, S.d.S.L.; de Morais, M.A. Genetic Interaction between HOG1 and SLT2 Genes in Signalling the Cellular Stress Caused by Sulphuric Acid in Saccharomyces Cerevisiae. J. Mol. Microbiol. Biotechnol. 2015, 25, 423–427. [Google Scholar] [CrossRef]
  65. Lucena, R.M.; Dolz-Edo, L.; Brul, S.; de Morais, M.A.; Smits, G. Extreme Low Cytosolic pH Is a Signal for Cell Survival in Acid Stressed Yeast. Genes 2020, 11, 656. [Google Scholar] [CrossRef]
  66. Alkalbani, N.S.; Osaili, T.M.; Al-Nabulsi, A.A.; Olaimat, A.N.; Liu, S.-Q.; Shah, N.P.; Apostolopoulos, V.; Ayyash, M.M. Assessment of Yeasts as Potential Probiotics: A Review of Gastrointestinal Tract Conditions and Investigation Methods. J. Fungi 2022, 8, 365. [Google Scholar] [CrossRef]
  67. Pais, P.; Almeida, V.; Yılmaz, M.; Teixeira, M.C. Saccharomyces Boulardii: What Makes It Tick as Successful Probiotic? J. Fungi 2020, 6, 78. [Google Scholar] [CrossRef]
  68. Aguilar-Ballester, M.; Herrero-Cervera, A.; Vinué, Á.; Martínez-Hervás, S.; González-Navarro, H. Impact of Cholesterol Metabolism in Immune Cell Function and Atherosclerosis. Nutrients 2020, 12, 2021. [Google Scholar] [CrossRef]
  69. Casamayor, A.; Serrano, R.; Platara, M.; Casado, C.; Ruiz, A.; Ariño, J. The Role of the Snf1 Kinase in the Adaptive Response of Saccharomyces Cerevisiae to Alkaline pH Stress. Biochem. J. 2012, 444, 39–49. [Google Scholar] [CrossRef]
  70. Serra-Cardona, A.; Petrezsélyová, S.; Canadell, D.; Ramos, J.; Ariño, J. Coregulated Expression of the Na+/Phosphate Pho89 Transporter and Ena1 Na+-ATPase Allows Their Functional Coupling under High-pH Stress. Mol. Cell. Biol. 2014, 34, 4420–4435. [Google Scholar] [CrossRef]
  71. Higuchi, Y.; Mori, H.; Kubota, T.; Takegawa, K. Analysis of Ambient pH Stress Response Mediated by Iron and Copper Intake in Schizosaccharomyces pombe. J. Biosci. Bioeng. 2018, 125, 92–96. [Google Scholar] [CrossRef]
  72. Dżugan, M.; Tomczyk, M.; Sowa, P.; Grabek-Lejko, D. Antioxidant Activity as Biomarker of Honey Variety. Molecules 2018, 23, 2069. [Google Scholar] [CrossRef]
  73. Becerril-Sánchez, A.L.; Quintero-Salazar, B.; Dublán-García, O.; Escalona-Buendía, H.B. Phenolic Compounds in Honey and Their Relationship with Antioxidant Activity, Botanical Origin, and Color. Antioxidants 2021, 10, 1700. [Google Scholar] [CrossRef]
  74. Schell, K.R.; Fernandes, K.E.; Shanahan, E.; Wilson, I.; Blair, S.E.; Carter, D.A.; Cokcetin, N.N. The Potential of Honey as a Prebiotic Food to Re-Engineer the Gut Microbiome Toward a Healthy State. Front. Nutr. 2022, 9, 957932. [Google Scholar] [CrossRef]
  75. Dimitriu, L.; Constantinescu-Aruxandei, D.; Preda, D.; Moraru, I.; Băbeanu, N.E.; Oancea, F. The Antioxidant and Prebiotic Activities of Mixtures Honey/Biomimetic NaDES and Polyphenols Show Differences between Honeysuckle and Raspberry Extracts. Antioxidants 2023, 12, 1678. [Google Scholar] [CrossRef]
  76. Agarbati, A.; Canonico, L.; Marini, E.; Zannini, E.; Ciani, M.; Comitini, F. Potential Probiotic Yeasts Sourced from Natural Environmental and Spontaneous Processed Foods. Foods 2020, 9, 287. [Google Scholar] [CrossRef]
  77. da Silva Filho, E.A.; de Melo, H.F.; Antunes, D.F.; dos Santos, S.K.B.; do Monte Resende, A.; Simões, D.A.; de Morais, M.A. Isolation by Genetic and Physiological Characteristics of a Fuel-Ethanol Fermentative Saccharomyces Cerevisiae Strain with Potential for Genetic Manipulation. J. Ind. Microbiol. Biotechnol. 2005, 32, 481–486. [Google Scholar] [CrossRef]
  78. Chiron, C.; Tompkins, T.A.; Burguière, P. Flow Cytometry: A Versatile Technology for Specific Quantification and Viability Assessment of Micro-Organisms in Multistrain Probiotic Products. J. Appl. Microbiol. 2018, 124, 572–584. [Google Scholar] [CrossRef]
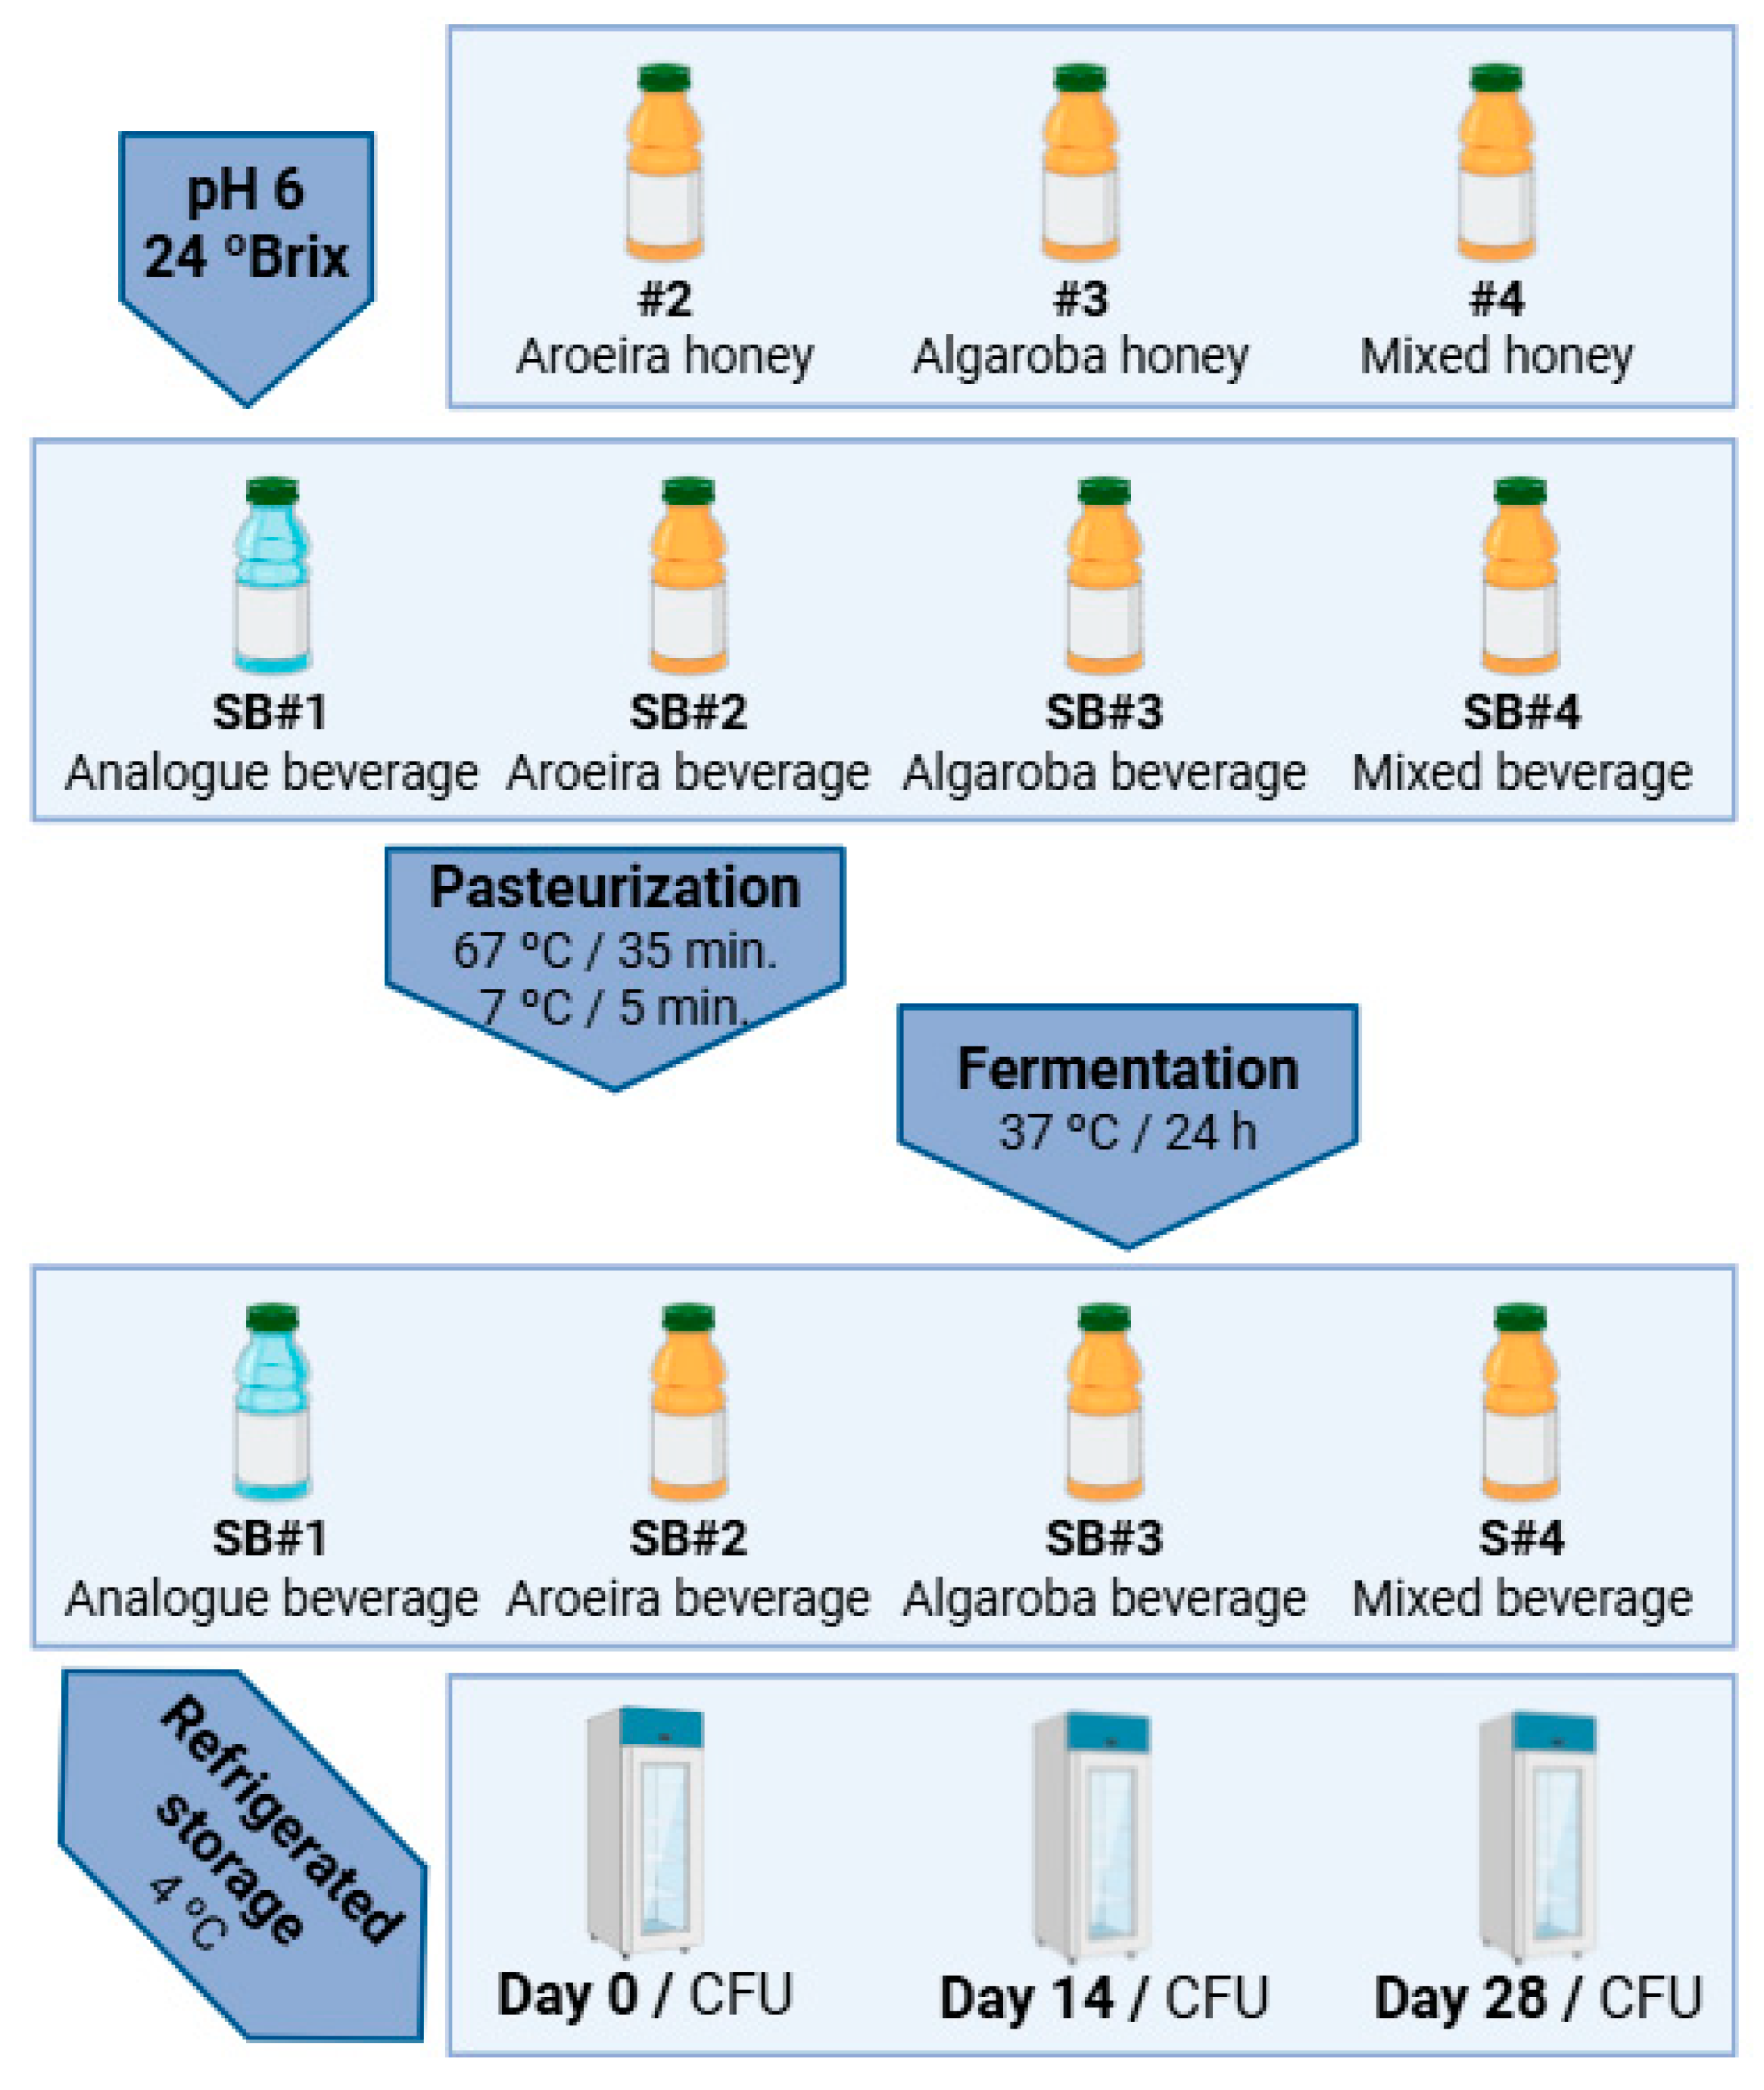
Figure 1. Development of synbiotic beverages using Apis mellifera bee honeys from predominant floral sources of the synbiotic beverages (SB). CFU: colony-forming unit. Image created on www.BioRender.com (accessed on 14 May 2025).
Fermentation 11 00405 g001
Figure 2. Schematic representation of the in vitro dynamic gastrointestinal digestion system. A: syringe containing the sample; B: stomach compartment with peristaltic membrane; C: duodenum compartment with peristaltic membrane; D: jejunum compartment with peristaltic membrane; E: ileum compartment with peristaltic membrane; F: jejunum filter column (0.05 µL); G: ileum filter column (0.05 µL); H: stomach pH meter; I: duodenum pH meter; J: jejunum pH meter; K: ileum pH meter; L: stomach injection pump; M: stomach injection pump; N: duodenum injection pump; O: injection pump for the duodenum; P: sample after gastric passage; Q: unfiltered sample after passage through the jejunum; R: filtered sample after passage through the jejunum; S: filtered sample after passage through the ileum; T: valve; U: water bath at 37 °C. There is a peristaltic pump for each compartment of the digestion system, as shown in the image. Image created at www.BioRender.com (accessed on 28 April 2025).
Fermentation 11 00405 g002
Figure 3. Metabolic activity of the probiotic yeast Saccharomyces boulardii CNCM I-745 in synbiotic beverages SB#1 to SB#4 described in Figure 1, during refrigerated storage. The samples were collected on the indicated days of storage and checked for the consumption of fructose (A), glucose (B), and sucrose (C), ethanol and glycerol production (D), ethanol yield (E), and the number of viable cells and pH variation (F). All replicates had standard deviations p ≤ 0.05.
Fermentation 11 00405 g003
Figure 4. Viability (A) and survival (B) of the cells of the probiotic yeast Saccharomyces boulardii CNCM I-745 collected from the synbiotic beverages SB#1 to SB#4, as described in Figure 1, subjected to static and gastrointestinal tract simulation. The cells from the initial population were subjected to oral simulation for 2 min, gastric simulation for 2 h, and enteric simulation for a further 2 h. Before each phase, samples were taken to check the number of viable cells. The values represent the mean with standard deviations. Different lowercase letters denote a statistically significant difference.
Fermentation 11 00405 g004
Figure 5. Viability (A,C) and survival (B,D) of the cells of the probiotic yeast Saccharomyces boulardii CNCM I-745 collected from the synbiotic beverages SB#1 to SB#4, as described in Figure 1, during different periods of refrigerated storage ((A,B): 14 days; (C,D): 28 days) and subjected to simulation of the gastrointestinal tract in vitro. The cells were collected at the start of the simulation (0 h), after the gastric simulation (2 h), and after the intestinal simulation (4 h). The percentage refers to the absolute number of viable cells at the start of the experiment. All replicates had standard deviations p ≤ 0.05. Different lowercase letters denote a statistically significant difference.
Fermentation 11 00405 g005
Figure 6. Comparison of the resilience of Saccharomyces boulardii CNCM I-745 incorporated into the synbiotic Algaroba honey beverage (SB#3) when subjected to static and dynamic in vitro GIT conditions and under refrigerated stock. A: cell viability (Log CFU/mL); B: survival per Log CFU (%); C: survival by flow cytometry (%). All replicates had standard deviations p ≤ 0.05. Image created from visual elements requested from Chatgpt.com.
Fermentation 11 00405 g006
Table 1. Composition of simulated digestion fluids.
SSF *1 (pH 7)SGF *2 (pH 7)SIF *3 (pH 7)
Stock
Concentrations
mL of Stock Added to Prepare 0.4 L (1.25×)Final Salt Conc. in SSFmL of Stock Added to Prepare 0.4 L
(1.25×)
Final Salt Conc. in SGFmL of Stock Added to Prepare 0.4 L
(1.25×)
Final Salt Conc. in SIF
Saltsg/Lmol/LmLmmol/LmLmmol/LmLmmol/L
KCl37.30.515.115.16.96.96.86.8
KH2PO468.00.53.73.70.90.90.80.8
NaHCO384.01.06.813.612.525.042.585.0
NaCl117.02.0--11.847.29.638.4
MgCl2(H2O)630.50.150.50.150.40.121.10.33
(NH4)2CO348.00.50.060.060.50.5--
CaCl2(H2O)244.10.3-1.5-0.15-0.6
HCl **-60.091.11.315.60.78.4
*1 Simulated salivary fluid; *2 Simulated gastric fluid; *3 Simulated intestinal fluid. ** Exclusive for static simulation fluids. H2Oup until the solution reached 0.4 L.
Table 2. Physicochemical and microbiological parameters of bee honeys produced by different flower predominance in the Caatinga biome of the state of Pernambuco, Brazil. All replicates had standard deviations p ≤ 0.05.
ParametersMastic (Aroeira)Mesquite
(Algaroba)
Mixed
Colour (Pfund)Light AmberDark amberDark amber
Water activity (Aw)0.61 ± 0.000.56 ± 0.020.59 ± 0.01
Humidity (%)14.01 ± 0.8019.56 ± 0.5219.71 ± 0.15
Soluble solids (°Brix)85.00 ± 0.0083.00 ± 0.0081.50 ± 0.00
Density (g/cm3)1.42 ± 0.061.42 ± 0.001.42 ± 0.00
pH3.92 ± 0.053.61 ± 0.073.78 ± 0.00
Free acidity (mEq/kg of honey)56.00 ± 0.0134.50 ± 0.1022.50 ± 0.06
Lactonic acidity (mEq/kg of honey)11.00 ± 0.0208.50 ± 0.0025.00 ± 0.20
Total acidity (mEq/kg of honey)67.00 ± 0.0443.00 ± 0.0247.50 ± 0.00
Electric conductivity (µS/cm)436.25 ± 2.06997.50 ± 0.71270.50 ± 0.71
Ashes (%)0.21 ± 0.020.57 ± 0.020.09 ± 0.01
Firmness (g)57.74 ± 2.7551.97 ± 0.1366.95 ± 1.42
Consistency (g/s)646.61 ± 27.09585.50 ± 3.18753.78 ± 17.15
Cohesiveness (g)−29.52 ± 2.98−26.34 ± 0.59−40.50 ± 2.28
Work of cohesion (g/s)−238.99 ± 25.55−204.36 ± 7.19−396.23 ± 17.79
Viscosity (Pa/s)14.67 ± 0.3718.46 ± 0.6417.66 ± 0.50
Hydroxymethyl furfural (mg/kg of honey)3.04 ± 0.099.45 ± 0.018.28 ± 0.11
Diastase activity (Gothe units/g of honey)19.17 ± 0.734.10 ± 0.403.50 ± 0.20
Glucose (g/100 g of honey)26.32 ± 0.2329.83 ± 0.7531.54 ± 0.16
Fructose (g/100 g of honey)41.42 ± 0.5632.41 ± 1.0432.92 ± 0.65
Apparent sucrose (g/100 g of honey)9.48 ± 0.689.82 ± 0.3310.33 ± 0.11
Total sugars (g/100 g of honey)85.90 ± 0.5172.05 ± 1.4574.79 ± 0.69
Total proteins (g/100 g of honey)0.29 ± 0.030.22 ± 0.010.22 ± 0.02
Antioxidant activity (FRAP method) (µM FeSO4/mL)403.92 ± 0.00145.43 ± 1.62301.38 ± 1.21
Antioxidant activity (DPPH method) (%)52.7 ± 3.0544.18 ± 2.3239.32 ± 2.27
Flavonoids (mg Rutin/100 g of honey)74.3 ± 0.00102.6 ± 0.0069.4 ± 0.00
Flavonols (mg Quercetin/100 g of honey)54.3 ± 0.0075.0 ± 0.0059.5 ± 0.00
Total phenolic (mg Tannic Acid/100 g of honey)185.72 ± 2.9256.40 ± 0.64191.31 ± 2.16
Lund reactionPositivePositivePositive
Lugol reactionNegativeNegativeNegative
Coliforms (CFU/g)<10<10<10
Escherichia coli (CFU/g)<10<10<10
Salmonella (in 25 g of honey)NegativeNegativeNegative
Disclaimer/Publisher’s Note: The statements, opinions and data contained in all publications are solely those of the individual author(s) and contributor(s) and not of MDPI and/or the editor(s). MDPI and/or the editor(s) disclaim responsibility for any injury to people or property resulting from any ideas, methods, instructions or products referred to in the content.