1. Introduction
Fermentation engineering is crucial for efficient enzyme production, as precise control of the fermentation process can substantially increase the cell density of production strains and enhance enzyme expression. Serving as the central phase of the overall fermentation process, fermentation engineering not only determines the maximal productivity of selected or genetically engineered strains, but also significantly affects the efficiency of downstream product isolation [
1]. However, fermentation processes are characterized by complexity, significant temporal variability, and batch-to-batch variation. With the rapid advancement of industrial biotechnology, there is an increasing demand for precise control and dynamic optimization of fermentation processes. When the intrinsic mechanisms of microbial metabolism are not fully understood, fermentation kinetics and mathematical modeling are employed to analyze fermentation behavior. This approach enables accurate prediction of experimental results and optimization of the fermentation process without considering the complex biochemical reactions involved. The application of kinetic models for fermentation process control has been widely adopted by researchers and successfully implemented in industrial practice [
2].
Given the aforementioned process optimization requirements, establishing an accurate fermentation kinetic model is essential to enhance process control. Specifically, such modeling involves employing mathematical methods to analyze process variables (e.g., state, operating, and measurement variables) and investigate the synthesis and metabolism of target products (e.g., microbial growth, product yield, and substrate consumption) in relation to their temporal dynamics. By analyzing extensive fermentation data and simulating relevant kinetic equations, parameter-specific models are developed, ultimately optimizing conditions and enhancing product yield [
3]. Non-structured mathematical models typically rely on ordinary differential equations, where fermentation time serves as the independent variable and process variables as dependent parameters. A suitable non-structured kinetic model is selected based on experimental data, followed by computational estimation of model parameters to identify the best-fit solution [
4]. This approach is commonly applied to model relationships between fermentation time and variables such as biomass, product concentration, and substrate concentration, providing insights into microbial growth and metabolic processes. For instance, in kinetic modeling of
Rhodopseudomonas geoides batch fermentation, logistic equations were used to fit bacterial growth patterns during mid-to-late fermentation phases, establishing a model linking biomass concentration to fermentation time. Similarly, Luedeking–Piret equations were applied to analyze extracellular polysaccharide synthesis, glucose consumption, and bacterial growth dynamics.
Notably, oxygen transfer kinetics critically influences model accuracy in aerobic fermentation systems. For example, the oxygen uptake rate (OUR) of
Bacillus subtilis (
B. subtilis) can reach 15 mmol/L/h, which requires the model to include the parameters of gas–liquid double-membrane theory, the cellular oxygen affinity constant and the dynamic mass balance equation. These differential equations must be solved concurrently with the Luedeking–Piret equation to predict dissolved oxygen limitation thresholds during high-density cultivation, thereby necessitating explicit modeling of the oxygen transfer rate (OTR) [
5]. The concentration of dissolved oxygen in the fermentation broth depends on the rate of oxygen transfer from the gas phase to the liquid phase, the rate at which oxygen enters the cells, and the rate of uptake of oxygen by microorganisms [
6]. The oxygen volumetric mass transfer coefficient (
KLa), a critical parameter in this process, directly correlates with OTR and OUR, significantly impacting bioreactor design, operation, and scale-up [
7]. Stirred aeration bioreactors are widely used in various biological reaction processes due to their good mass transfer, heat transfer and mixing properties, and mechanical and magnetic stirring are commonly used in small bioreactors. In the fermentation process, the most important variables affecting mass transfer and mixing are the number and selection of stirring paddles, stirrer speed and gas flow rate [
6]. In aerobic fermentation of prokaryotic microorganisms such as
B. subtilis, the availability of oxygen is a key factor in achieving an increase in cell density. By redesigning and optimizing the bioreactor in this study, it will be a key technological tool to enhance the level of dissolved oxygen in the tank and thus achieve high cell density fermentation.
The core advantage of multi-scale fermentation optimization and control technology lies in its capacity to precisely regulate fermentation processes through the integration of multi-dimensional data analytics at molecular, cellular, and systemic levels [
8]. This technology collects critical parameters across varying scales (e.g., agitation speed, temperature, pH, and dissolved oxygen [
9,
10,
11]) and dynamically adjusts process conditions via big data integration, significantly enhancing product synthesis efficiency [
12]. For instance, in
B. subtilis-mediated tetramethylpyrazine production, nutrient supplementation optimization doubled yield [
13], while transcriptome-guided medium refinement in
Pichia yeast (e.g.,
Komagataella phaffii) improved granulocyte colony-stimulating factor (G-CSF) synthesis by 5 fold. Furthermore, the technology enables cost reduction by employing metabolic dynamic models and computational fluid dynamics simulations to achieve precision process control and scale-up optimization [
14,
15]. Practical applications include growth kinetics-guided volume optimization in filamentous fungal fermentation [
16], development of two-stage continuous omega-3 fatty acid fermentation systems to boost productivity, and hydrodynamic reactor analyses for scale-up bottleneck prediction [
17]. These strategies operate synergistically to enhance product conversion rates (e.g., >90% biomass prediction accuracy) while minimizing feedstock waste and emissions, thereby establishing an optimized process equilibrium of high yield, high conversion, and low carbon expenditure [
18].
The back-propagation (BP) neural network is a feedforward artificial neural network comprising an input layer, one or more hidden layers, and an output layer. Each neuron is fully connected to all neurons in the preceding layer; signals are propagated via weighted summation and subsequently undergo nonlinear transformation through activation functions. Central to the BP neural network is the error back-propagation algorithm, which minimizes prediction errors by recursively propagating output-layer errors backward to hidden and input layers while iteratively adjusting synaptic weights and biases. This architecture enables autonomous learning and storage of extensive input–output mapping relationships without requiring prior mathematical formulation of these correlations [
12]. The model excels in modeling complex, highly nonlinear systems, provided a definable input–output relationship exists. For instance, researchers applied a BP neural network to predict volumetric mass transfer coefficients (
KLa) by training the model with rotational speeds and ventilation rates as input parameters, demonstrating its predictive capabilities in bioreactor optimization [
19].
Benefit from the rapid development of self-control technology, chip performance continues to improve, laboratory-level small benchtop mechanical stirring fermenter in the dissolved oxygen, acid-base, temperature and replenishment, the control is more accurate, The use of stirred bioreactors offers significant advantages over shaking flask culture. Mechanical stirring provides a substantially improved oxygen uptake rate for microbial cells and enhances oxygen distribution and transfer efficiency due to induced liquid circulation driven by density gradients. While the 1 L bioreactor is suitable for parallel experiments and exhibits lower operating costs, the available product yield for subsequent analysis is limited. Conversely, although the 10 L bioreactor provides greater product volume, its operating cost is higher than that of the 5 L system. Considering the balance between cost-effectiveness, scalability (as demonstrated by successful extrapolation to the 100 L scale in
Section 3.8), and sufficient product yield for robust analysis, the 5 L stirred bioreactor was selected as the optimal scale for this study. Monitoring within the fermentation tank was accomplished using biological sensors, while control was facilitated by a bespoke main control system developed in-house, compared with shaking flask culture, the use of mechanical stirring aeration fermenter, not only for the microbial cells of the oxygen uptake rate has been greatly improved, but also due to the formation of the liquid on both sides of the difference in density resulting in the circulation of the liquid inside the tank, which makes the distribution of oxygen in the fermentation liquid more reasonable, and the transfer efficiency is better. This leads to a more rational distribution of oxygen in the fermentation broth and a better transfer efficiency [
20]. The use of a 5 L stirred bioreactor for fermentation culture has the following advantages: (1) the rate of dissolved oxygen consumption in the fermentation process is accelerated, and the bacteria can exhibit faster growth; (2) the consumption of dissolved oxygen can effectively improve the efficiency of fermentation; (3) a precise control system through real-time recording of the parameter indicators in the process of fermentation. The present study is based on a strain of acidic phosphate-producing recombinant
B. subtilis 168/pMA5-
Acp already obtained from previous research [
21]. According to the characteristics of its specialized aerobic fermentation, in order to enhance the efficiency of the dissolved oxygen mass transfer and to improve the level of its fermentation enzyme production, the following studies were carried out: Firstly, the pneumatic structure of the existing commercially available 5 L mechanically stirred bioreactor was optimized and improved, and the optimal simulated mass transfer conditions were obtained through longitudinal comparison of CFD simulations, and at the same time, horizontal comparison of CFD simulations with the existing reactor was conducted to verify the necessity and reasonableness of the improvement, and the construction of the improved reactor was completed, which solved the problem of the adaptability of the laboratory’s general-purpose 5 L mechanically stirred bioreactor for aerobic fermentation of the recombinant bacteria in the present study. Secondly, based on the optimized aerodynamic structure of the bioreactor, the cell metabolism kinetics model of the 5 L fermentation system under the fermentation conditions using alternative media was experimentally established by combining with the BP neural network model.
Initially, the pneumatic structure of the commercially available 5 L mechanically stirred bioreactor in our laboratory was optimized and improved. Through longitudinal CFD simulation comparisons, the optimal mass transfer conditions were determined. Concurrently, horizontal CFD comparisons with the original reactor design validated the necessity and rationality of these modifications. The upgraded bioreactor construction resolved adaptability issues for aerobic fermentation of recombinant bacteria in this study. Subsequently, based on the optimized aerodynamic structure, a cell metabolism kinetics model for the 5 L fermentation system using alternative media was established experimentally, integrated with a BP neural network approach.
2. Materials and Methods
2.1. Experimental Strain and Medium
Recombinant bacterium
B. subtilis 168/pMA5-
Acp, stored in our laboratory [
21].
Seed medium (g/L): LB liquid medium: NaCl 10, peptone 10, yeast extract 5, sterilized at 121 °C for 20 min. For LB solid medium, 15 g agar was added to the liquid medium.
Initial medium (g/L): lactose 7.5; yeast 6.8; fishmeal peptone 12.5; MgSO4 0.5; NaCl 10; pH 7.6.
Alternative medium (g/L): reference to the industrial-grade medium for genetically engineered bacteria with modifications: molasses 7.5; urea 15; K2HPO4 1.2; MgSO4-7H2O 0.25; pH 7.2.
2.2. Turbulence Simulation Methods
Turbulent flow is the predominant form of fluid motion in fermentation broth during agitation within a bioreactor; thus, the accurate formulation of fluid dynamics equations for this flow type critically governs the precision of computational modeling. In this study, ANSYS Fluent 2022 and SolidWorks 2024 software were employed to simulate and derive key engineering parameters—including mass transfer, shear stress, and mixing efficiency—for the designed reactor. Building on the aerobic fermentation characteristics of the bacterial strain under investigation, the stirring and pneumatic structures of a commercially available bioreactor (previously utilized in the laboratory) were optimized to enhance mass transfer efficiency during recombinant bacterial fermentation, thereby establishing a robust hardware foundation.
Within computational fluid dynamics (CFD), multiple turbulence simulation methodologies exist. This study adopts the Reynolds-Averaged Navier–Stokes (RANS) approach, which incorporates turbulent viscosity via the RANS equations to resolve Reynolds stress. A suitable eddy-viscosity model was formulated using a turbulent viscosity differential equation, encompassing zero-, one-, and two-equation frameworks. Among these, the two-equation model (e.g., *k-ε* or *k-ω*) is most widely applied. The RANS method demonstrates superior performance in capturing time-averaged flow field behavior and is extensively utilized for solving complex engineering challenges [
22,
23].
2.3. The Blade Rotary Motion Processing Method
In the design of mechanically stirred bioreactors, simulating the interaction between moving and stationary components presents a significant challenge for CFD. This study addresses this issue by employing the multiple reference system (MRS) method. The fluid domain is partitioned into two distinct zones: an inner zone encompassing the stirrer and an outer zone containing the remaining vessel walls. The rotating coordinate system is applied to the inner zone, while the stationary coordinate system governs the outer zone. By eliminating the need for iterative solving between these zones, this approach substantially reduces computational demands. Owing to its efficiency, the MRS method has gained widespread adoption in numerical simulations within the field of stirred bioreactor research.
2.4. Interphase Forces
Two primary methods exist for modeling gas–liquid two-phase interactions: the Eulerian–Eulerian method and the Eulerian–Lagrangian method. The Eulerian–Lagrangian approach tracks individual bubbles and solves their motion equations, whereas the Eulerian–Eulerian method avoids bubble-level tracking by instead representing bubble motion through local air content. Studies demonstrate that the Eulerian–Eulerian method achieves more satisfactory results at higher fluid velocities. Conversely, the Eulerian–Lagrangian method becomes computationally expensive under high gas content conditions. Consequently, the Eulerian–Eulerian method is recommended for simulating mechanically stirred bioreactors [
22,
23]. The governing equations are as follows:
(1) Various continuity equations:
Various momentum equations:
represents the density, volume fraction, and velocity of each phase;
represents the effective viscosity; and
is the pressure. When the subscript
represents the gas phase,
represents the liquid phase.
are the interphase forces, including drag, lift, wall lubrication, and turbulent diffusion.
(2) Group equilibrium equations
The dimensionless equations for gas–liquid two-phase flow relate physical quantities such as φ, v, and ρ of bubbles, which determine momentum, energy and mass exchange during mass transfer, and CFD coupled-cluster equilibrium models are used to simulate local gas–liquid properties:
represents the number density of bubbles of mass
m at time
t;
represents the velocity of bubbles of mass
m at time
t;
represents the rate of large bubbles breaking up to form small bubbles, the rate of large bubbles decreasing, the rate of small bubbles polymerizing to form large bubbles, and the rate of small bubbles decreasing due to the polymerization of small bubbles, respectively.
2.5. Numerical Simulation Methods
(1) Modelling
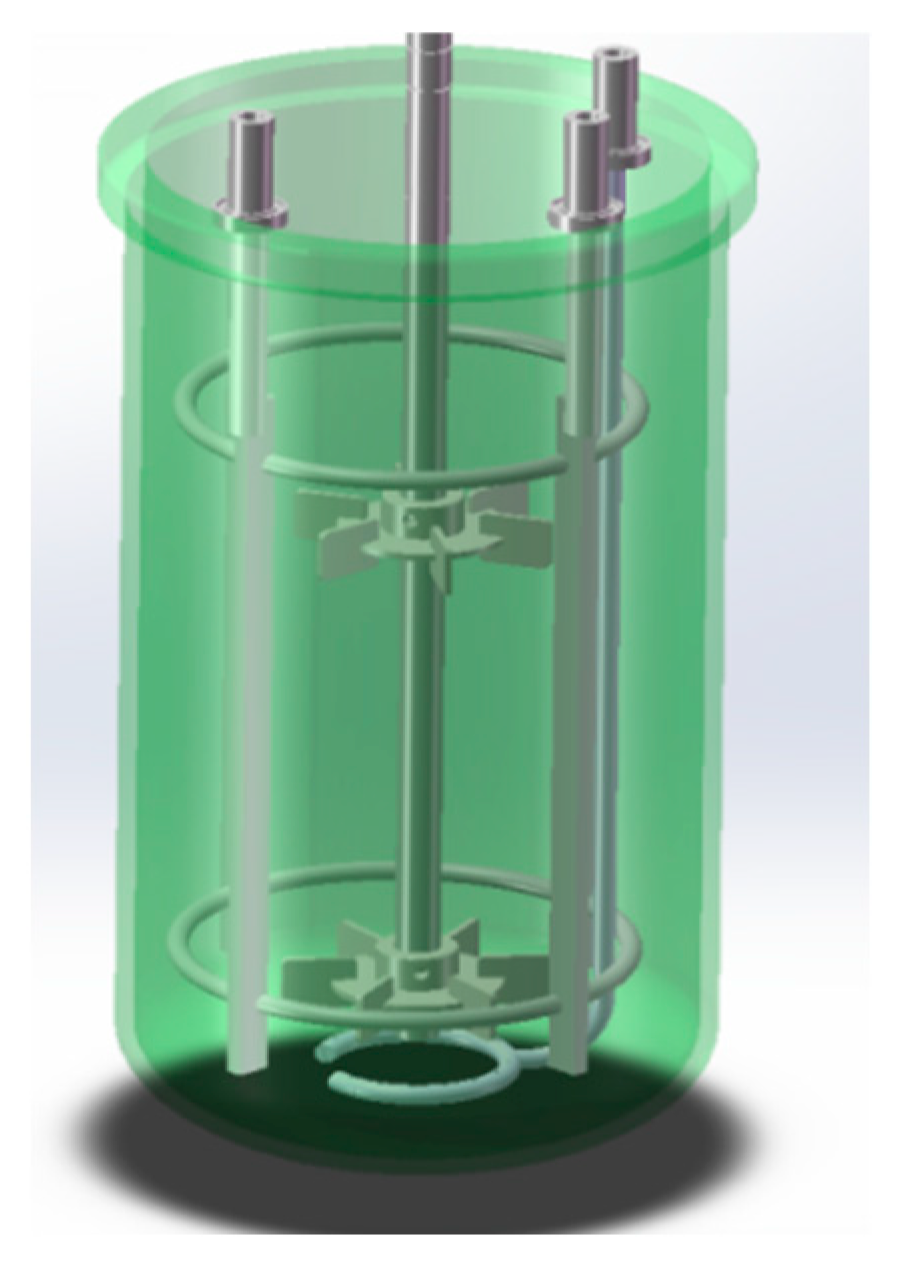
The modified reactor was designed as an elliptical bottom type with the structure shown in
Figure 1, with a nominal volume of 5 L, a loading factor η = 0.5–0.7, equipped with stirring paddles and baffles, and adopting a bottom ring for aeration, with 1 mm ventilation holes evenly distributed on the ventilation ring.
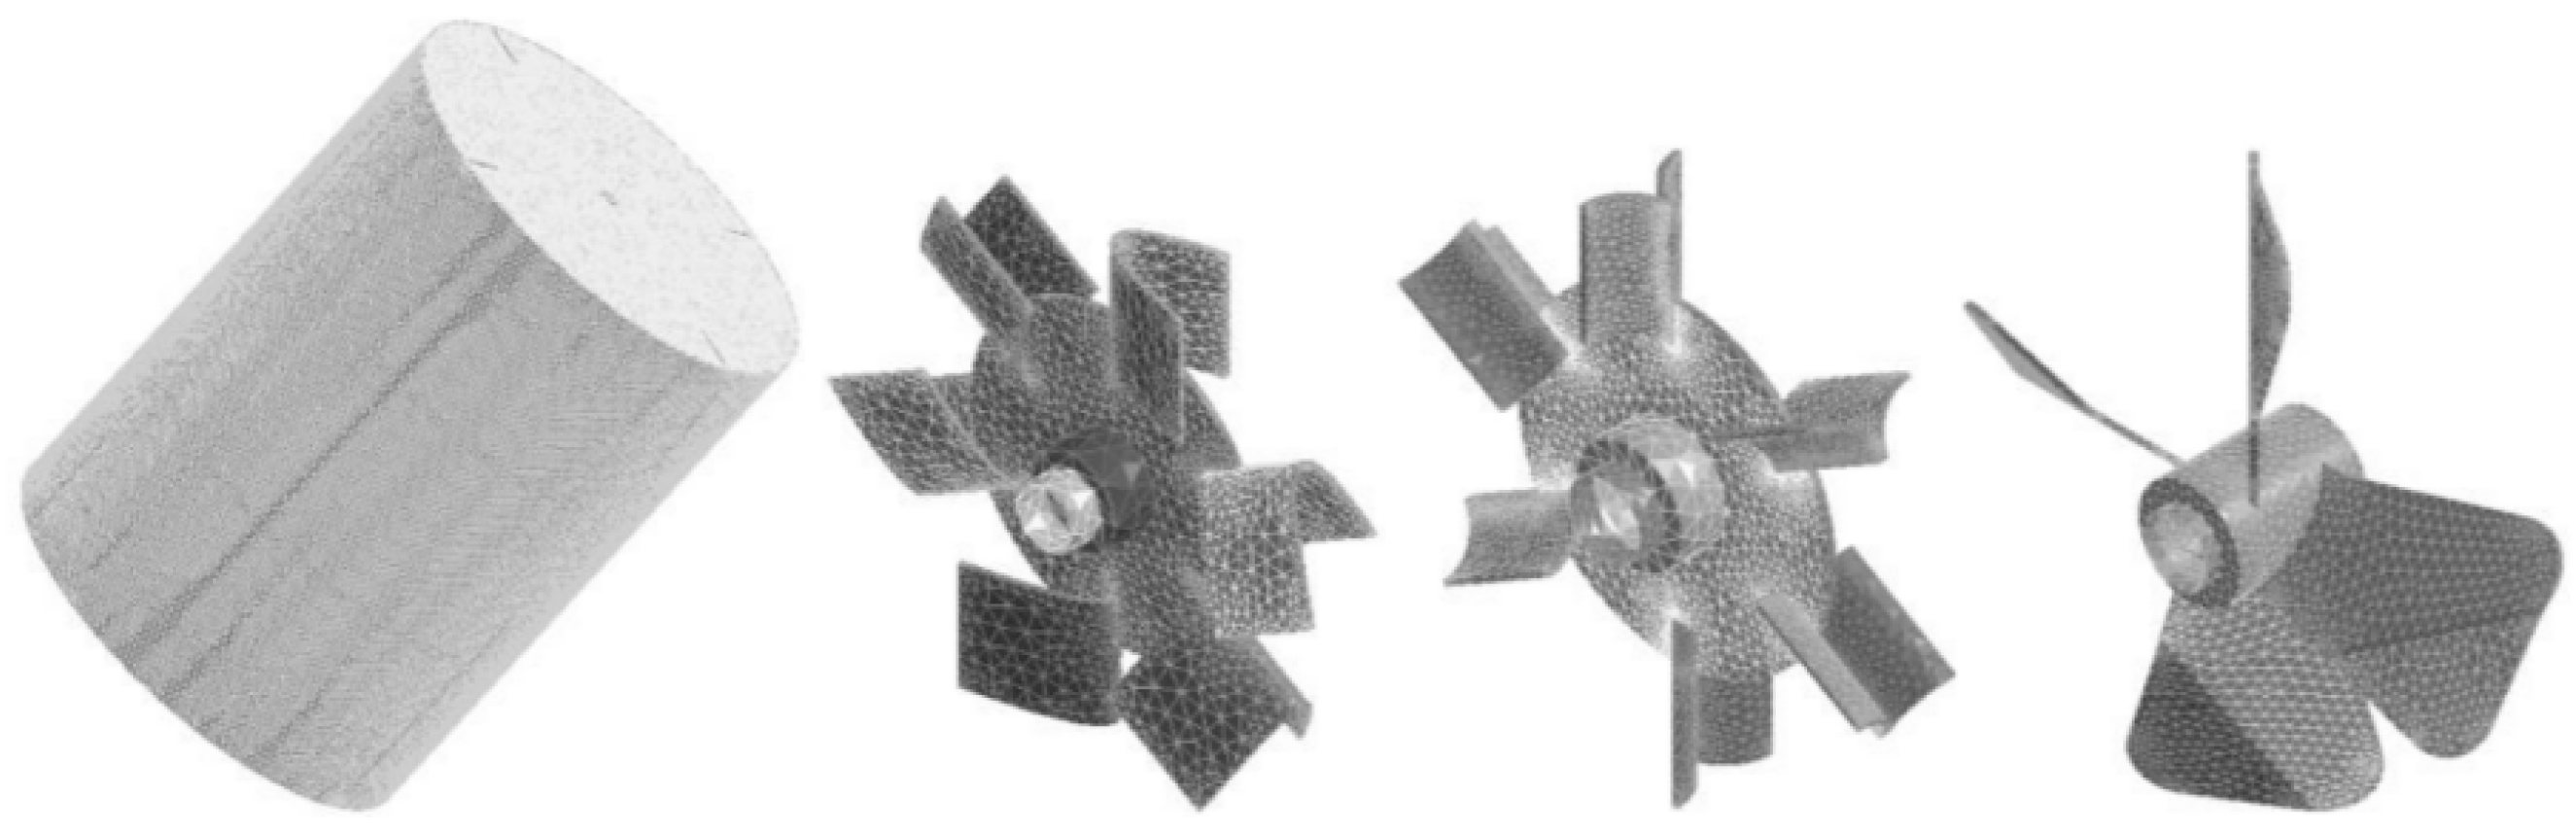
(2) Grid Division
The tetrahedral mesh technique was used in Fluent-Meshing meshing software to divide the computational model of the mechanically stirred bioreactor into a tetrahedral mesh, as shown in
Figure 2, and the total mesh number was divided into 1.72 × 10
6, the tank mesh was divided into 9.5 × 10
5, the radial paddle region was divided into 7.2 × 10
5, and the axial paddle region was divided into 5.5 × 10
5.
(3) Turbulence Equations
Considering the calculation accuracy as well as the calculation efficiency, this paper chooses the model for the improved design of the reactor. The preliminary analysis of the dissolved oxygen data of the fermentation process of the commercially available universal stirred reactor in the laboratory showed that the value of the gas content rate in the reactor was small, so the discrete model was more in line with the actual situation in the improved design of two-phase flow. The RNG turbulence model was verified by computer calculations to more accurately simulate the actual situation of the flow field. The model is described as follows:
For
equation:
where
is the turbulent kinetic energy production term due to the mean velocity gradient;
is the turbulent kinetic energy production term due to buoyancy;
is the contribution of excessive dissipation to the total dissipation rate in compressible turbulence;
is an additional term;
and
are the inverse effective Prandtl numbers of
and
, respectively;
is the effective viscosity; and
,
and
are constants taken as
= 1.2,
= 1.4 and
= 1.3, respectively.
(4) Mass Transfer Equation
Oxygen uptake rate, carbon dioxide release rate (CER) and respiratory quotient RQ were calculated based on gas analysis and the following three equations:
where
is the aeration rate,
V is the medium volume,
are the mass fractions of the input nitrogen, oxygen and carbon dioxide, respectively,
is the temperature of the input gas,
is the pressure of the input gas, and
is the humidity of the input gas.
(5) Initial and Boundary Conditions
The inner walls of the reactor (including the baffle, stirring shaft, and solid wall of the stirrer) are assigned no-slip boundary conditions for the liquid phase and free-slip boundary conditions for the gas phase. The reactor’s top boundary is defined as an exit condition, allowing the gas phase to freely escape while retaining the liquid phase. Finally, the inlet pipe is designated as the gas-phase inlet boundary condition, which is mathematically formulated as follows:
- (1)
The inlet air is set to air with a gas phase content of 1 and a liquid phase content of 0;
- (2)
The gas-phase velocity is perpendicular to the inlet plane, and the inlet ventilation is set to: 2–6 L/min;
- (3)
The diameter of the bubbles at the gas inlet is uniform, and the initial bubble diameter at the inlet is calculated using a formula.
where
—gas–liquid interfacial tension, N/m;
—diameter of inlet pipe, m;
—density of liquid phase, kg·m
−3;
is calculated according to the following formula:
where
is calculated according to the following formula
where
—Apparent air velocity, m/s.
For the 5 L mechanically stirred bioreactor, the Nw values were all less than 1, resulting in an initial bubble diameter of 0.02 m.
(6) Physical Parameters
CFD simulation conditions for the modified reactor were set: T = 25 °C, P = 1 atm. The structural parameters of the model and the physical parameters of the air–water system of the gas–liquid two-phase model are shown in
Table 1(7) Simulation Methods
In this study, ANSYS Fluent 2022 software is used to carry out numerical simulation, while a widely used steady-state solution method is adopted for the flow field motion in the bioreactor, which divides the flow area into internal dynamic domain and external static domain, and uses the INTERIOR surface to transfer the data between dynamic and static domains; the pressure-based coupling solver is selected for algorithmic debugging to obtain more satisfactory results. The discrete format is selected as the default setting of the system.
Finally, the following conditions are used to determine whether the solution to the design simulation converges: (1) the residuals of all variables must be less than e−4; (2) the flow rate magnitude and gas content satisfy the 1000-step iteration number < 1%. When both conditions are met, the solution is judged to be converged.
(8) Calculation of KLa
The oxygen transfer coefficient,
KLa, is an important parameter characterizing the effectiveness of mass transfer between the gas and liquid phases. The formula is calculated as follows:
where the diffusion coefficient DL at 20 °C is 2.01 × 10
−9 m
2·s
−1;
ε is the turbulent dissipation rate;
is the fluid density;
is the fluid viscosity.
The bubble interfacial area and average bubble diameter are calculated as:
respond in singing
where
is the local gas volume fraction;
is the average diameter of the bubble—if the bubble fragmentation and changes are not considered, take the average diameter of 2 mm.
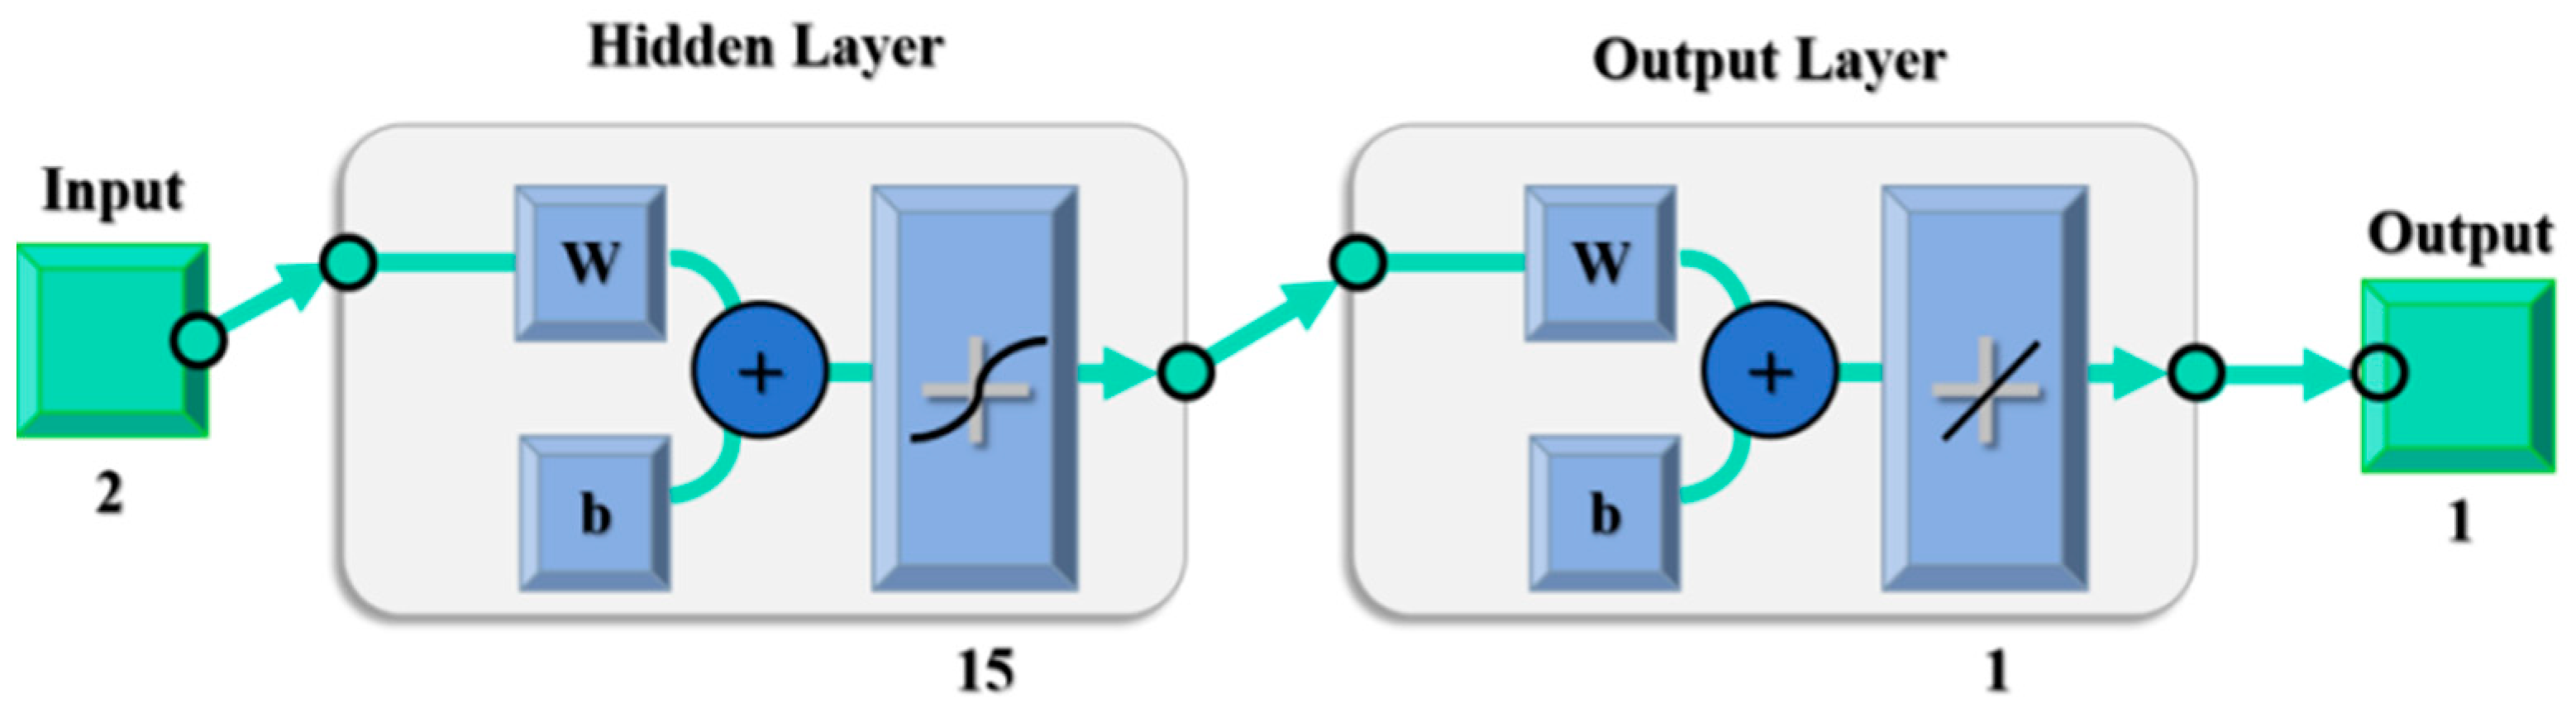
2.6. Modelling of 5 L Alternative Culture Fermentation Based on the BP Neural Network
In this study, the number of samples in the training set is set to be 40, the number of samples in the test set to be 16, and the number of nodes in the hidden layer to be 15. The logical structure is shown in
Figure 3:
2.7. Optimization of Alternative Media on 5 L Bioreactors
Based on the optimization model of the fermentation culture established in the 5 L fermenter, further optimization of the alternative medium was carried out by using the dissolved oxygen of the fermentation broth, the biomass OD600 and the enzyme activity during fermentation as reference standards.
Shake flask fermentation and fermenter fermentation exhibit significant differences in recombinant bacteria’s ability to synthesize target proteins, necessitating studies on fermentation conditions in small-scale bioreactors during the process [
24]. This experiment investigated the effects of temperature (32 °C vs. 37 °C) and carbon sources (glucose vs. glycerol) on recombinant bacterial growth and target protein expression in a 5 L bioreactor, establishing foundational insights for the industrial production of ACPase in
B. subtilis. Fermentation was conducted in a 5 L mechanically stirred bioreactor using optimized media. Prior to inoculation, the fermenter’s pH and airtightness were verified, and all piping was sterilized via autoclaving. Post-cooling, components including the stirrer head, condensate line, vent line, drain line, heating blanket, defoamer probe, temperature probe, and pH electrode wire were assembled. Initial dissolved oxygen calibration involved maximum aeration and a stirrer speed of 400 rpm, followed by operational parameters of 150 rpm and 25 L/min aeration. Fermentation commenced with a 5% inoculum of
B. subtilis 168/pMA5-
Acp. A 20 g/L initial carbon source was supplied, with continuous flow-through supplementation maintaining carbon concentration. Bacterial growth metrics and intra-/extracellular enzyme activities at each fermentation stage served as optimization indicators [
25].
2.8. Methods of Analysis
The bacterial concentration in fermentation broth was determined by measuring OD
600 biomass using a spectrophotometer (MAPADA UV-1800, Shanghai Mapade Instruments Co., Ltd., Shanghai, China). Fermentation stock was appropriately diluted prior to measurement, with uninoculated original medium serving as the blank control. Enzyme activity in the fermentation broth was quantified according to the method described in reference [
26].
3. Results and Analyses
3.1. CFD Simulation Study of Modified Reactor Structure Under Different Aerodynamic Conditions
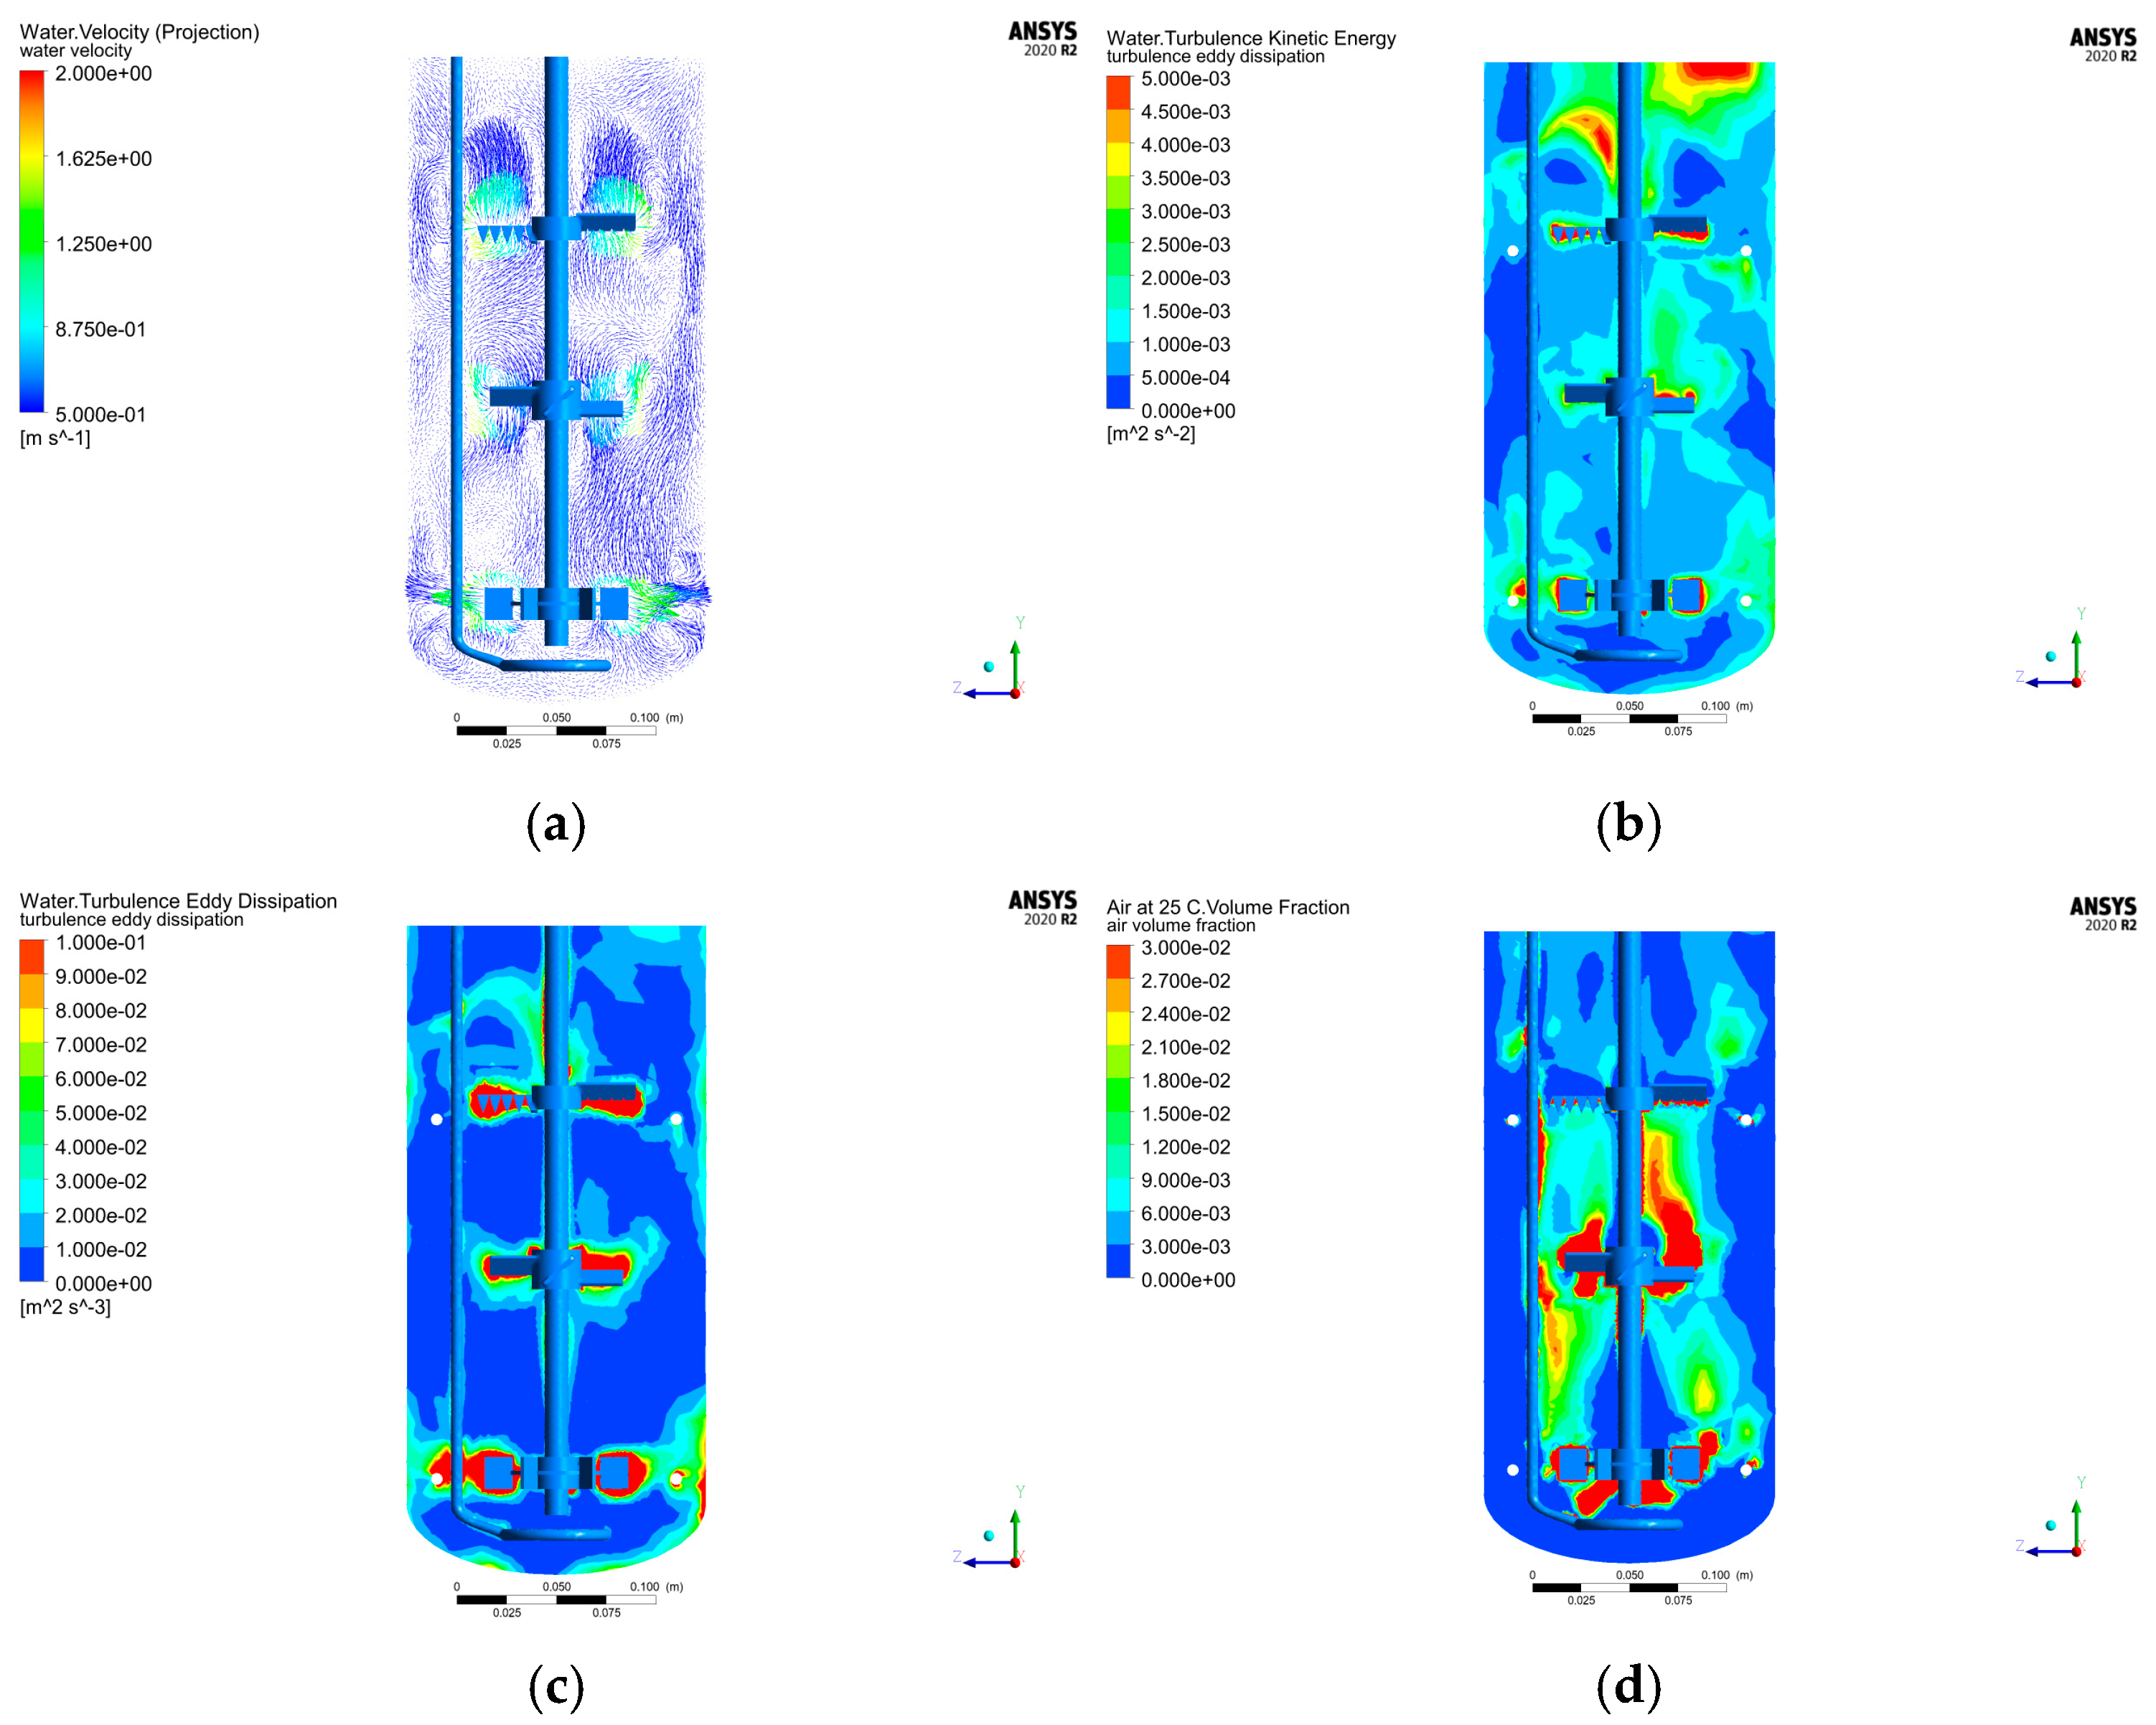
CFD simulations were performed to analyze flow field distribution, turbulent kinetic energy, eddy dissipation, and gas content in a 5 L bioreactor with a modified aerodynamic structure under cold mold (non-inoculated) conditions. Simulations evaluated combinations of aeration rates (0.571, 1.142, and 1.713 VVm) and rotational speeds (150, 250, and 350 rpm) [
27] (
Supplementary Figures S1–S3). Vertical comparative analysis revealed that the parameter combination of 1.142 VVm and 350 rpm exhibited optimal mass transfer performance, with flow field characteristics illustrated in
Figure 4.
The volumetric mass transfer coefficients (
KLa) corresponding to each aeration rate at 350 rpm were quantitatively analyzed by comparing simulation results across parameter combinations (
Supplementary Figure S1;
Table 2). Data demonstrated significantly higher (
KLa) values in the bottom radial-flow paddle region compared to the upper-middle region. This disparity was attributed to enhanced bubble fragmentation and dispersion effects driven by the radial flow of the bottom paddle, thereby optimizing oxygen supply efficiency. At 1.142 VVm, the global (
KLa) mean increased by 42.3% and 28.7% relative to 0.571 VVm and 1.713 VVm, respectively. Notably, lower aeration (0.571 VVm) led to over-fragmentation of bubbles by stirring, yielding localized high mass transfer efficiencies but reduced overall averages. Conversely, excessive aeration (1.713 VVm) hindered effective bubble breakup by stirring, preventing optimal mass transfer.
3.2. CFD Simulation Study of the Reactor with Baffles
For the aerodynamic parameter combination of 1.142 VVm aeration rate and 350 rpm rotational speed, a CFD model incorporating a baffle structure was constructed using numerical simulation (
Figure 4). Comparative analysis of flow field characteristics between the baffle-free (
Figure 5) and baffle-equipped configurations (
Figure 5a) revealed enhanced uniformity in the upper and middle paddle zones with the baffle, while the lower paddle zone formed an independent flow field structure.
Figure 5b demonstrates that turbulent kinetic energy distribution was concentrated in regions near the tank wall, the baffle-jacket connecting tube, and the upper/middle paddles, with clear separation from the lower paddle zone. Further analysis of
Figure 5c indicates that vortex dissipation was similarly localized in the upper-middle paddle zone, tank wall, and lower paddle zone, corroborating the spatial independence of radial flow (lower zone) from axial flow (upper-middle zones). This segregation suggests suboptimal mixing performance between the two regions.
Figure 5d highlights that gas entering via the distribution ring primarily accumulated near the aeration ring, between the middle/lower paddles, and above the upper paddle, with minimal distribution between the middle and upper paddles. To improve gas homogeneity, adjustments such as modifying paddle spacing or incorporating a Rushton paddle may be warranted [
28].
In summary, comparison of CFD simulations (
Section 3.1 and
Section 3.2) demonstrates that baffle integration reduces mass transfer dead zones and optimizes gas distribution, thereby enhancing oxygen mass transfer efficiency in the cold-mode reactor system.
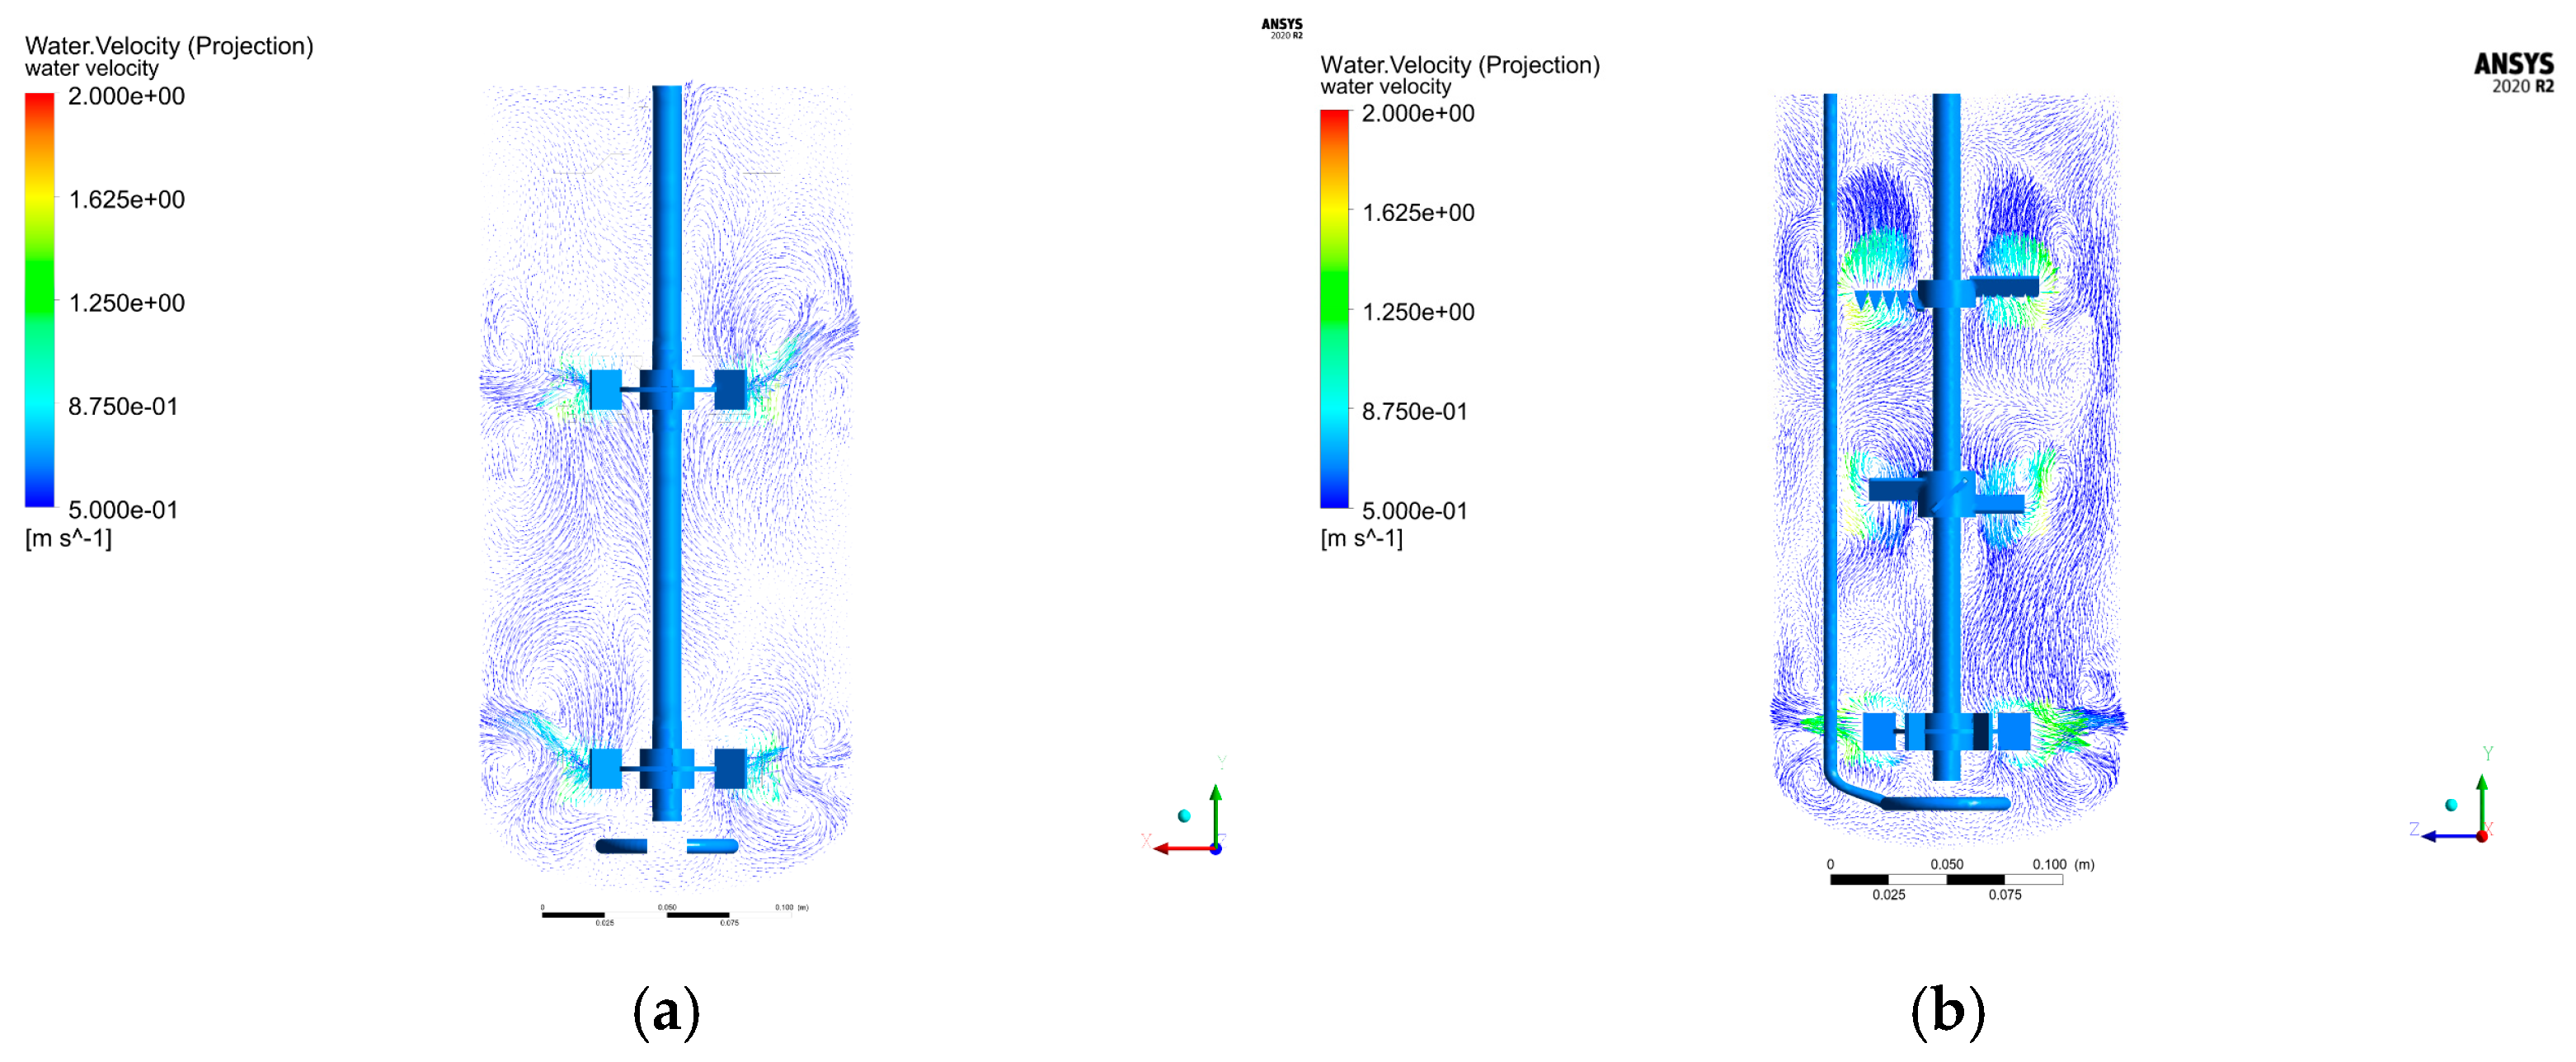
3.3. Comparative Study of CFD Simulation of the Mass Transfer Effect Before and After Optimization of Pneumatic Structure
In this study, the hydrodynamic performance of a commercial standard bioreactor was comparatively analyzed against a reactor with an optimized pneumatic structure using CFD simulations (
Supplementary Figure S4). Simulations conducted under the optimal pneumatic conditions (1.142 VVm and 350 rpm), as determined in
Section 3.1 and
Section 3.2, demonstrated enhanced uniformity in fluid flow pattern distribution and improved overall flow rates, resulting in superior mixing efficiency.
Comparative analysis revealed that while the commercial reactor with double-layer Rushton paddles generated typical radial flow patterns, the flow fields between the upper and lower paddles remained largely independent. The middle and upper regions of the two paddles failed to form a complete vortex, leading to inhomogeneous flow fields. Despite increased rotational speed elevating flow velocities near the paddle regions, global flow field homogeneity in the commercial reactor remained inferior to the optimized system (
Figure 6) [
29].
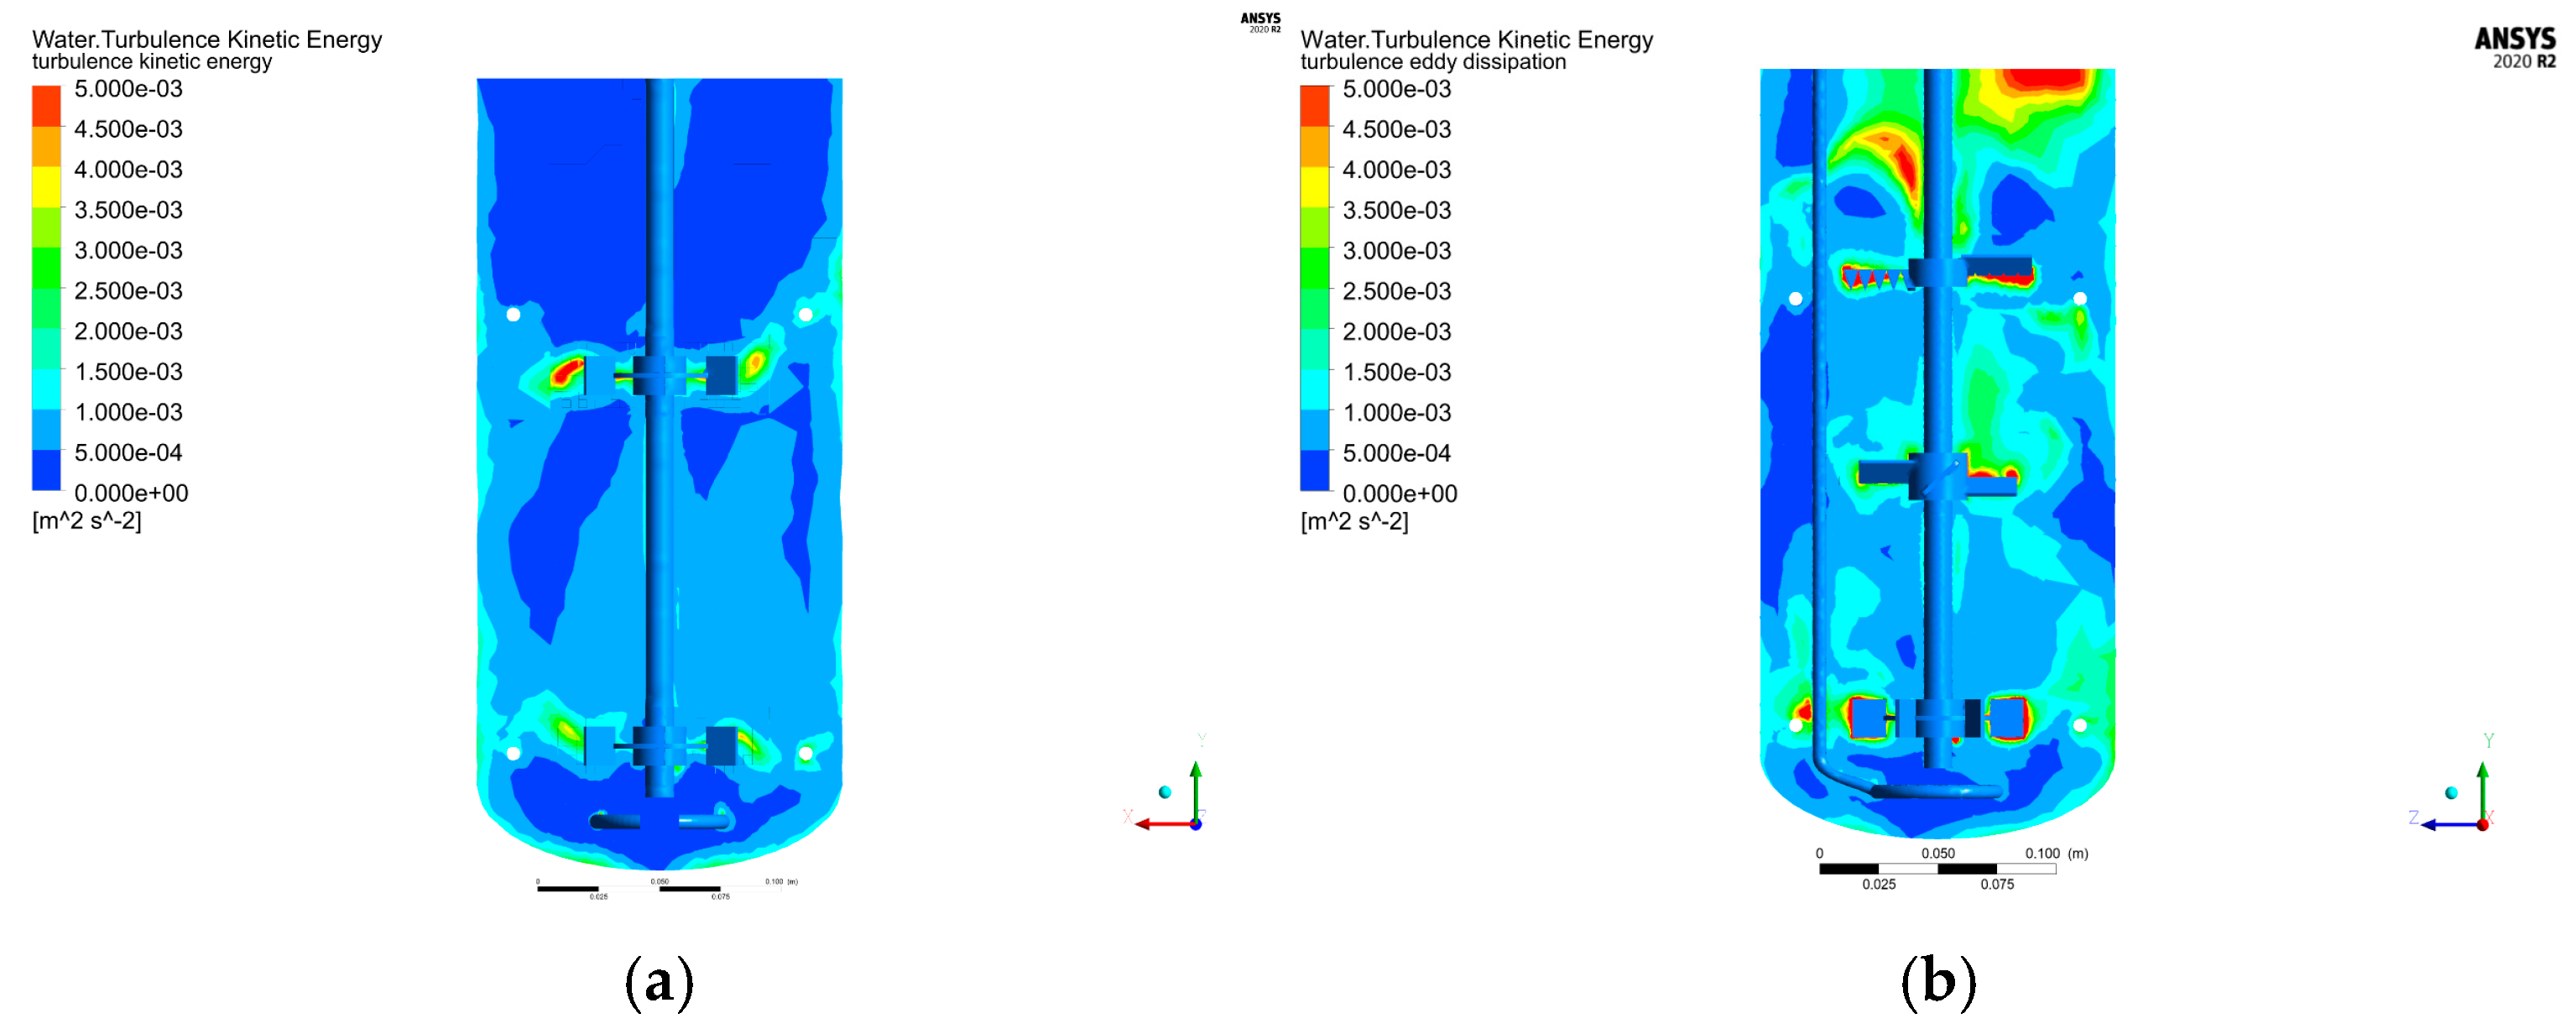
A comparative simulation analysis of turbulent kinetic energy and eddy dissipation was conducted for the reactor under identical operating conditions (1.142 VVm and 350 rpm) before and after structural optimization (
Figure 7). Results revealed that optimizing the aerodynamic structure significantly improved the uniformity of turbulent kinetic energy distribution. In the original configuration, high turbulent kinetic energy regions were concentrated near the paddles, while inactive zones (dead zones) occupied a substantially larger proportion. This spatial imbalance reduced mixing efficiency, necessitating higher rotational speeds to achieve equivalent performance—thereby increasing process complexity and energy costs. Post-optimization, turbulent kinetic energy distribution became more homogeneous under the same conditions, and spatial heterogeneity in vortex dissipation decreased, confirming enhanced uniformity in fluid energy distribution. Further analysis demonstrated that structural improvements effectively mitigated flow field energy localization, providing a theoretical foundation for reducing operational intensity and energy consumption.
Figure 8 vortex dissipation shows that the same power of mixing can result in a better mixing effect and significantly reduce the dead zone of mixing, while the vortex dissipation is still concentrated in the tip region of the paddle, and there is no significant effect after the baffle widening [
30].
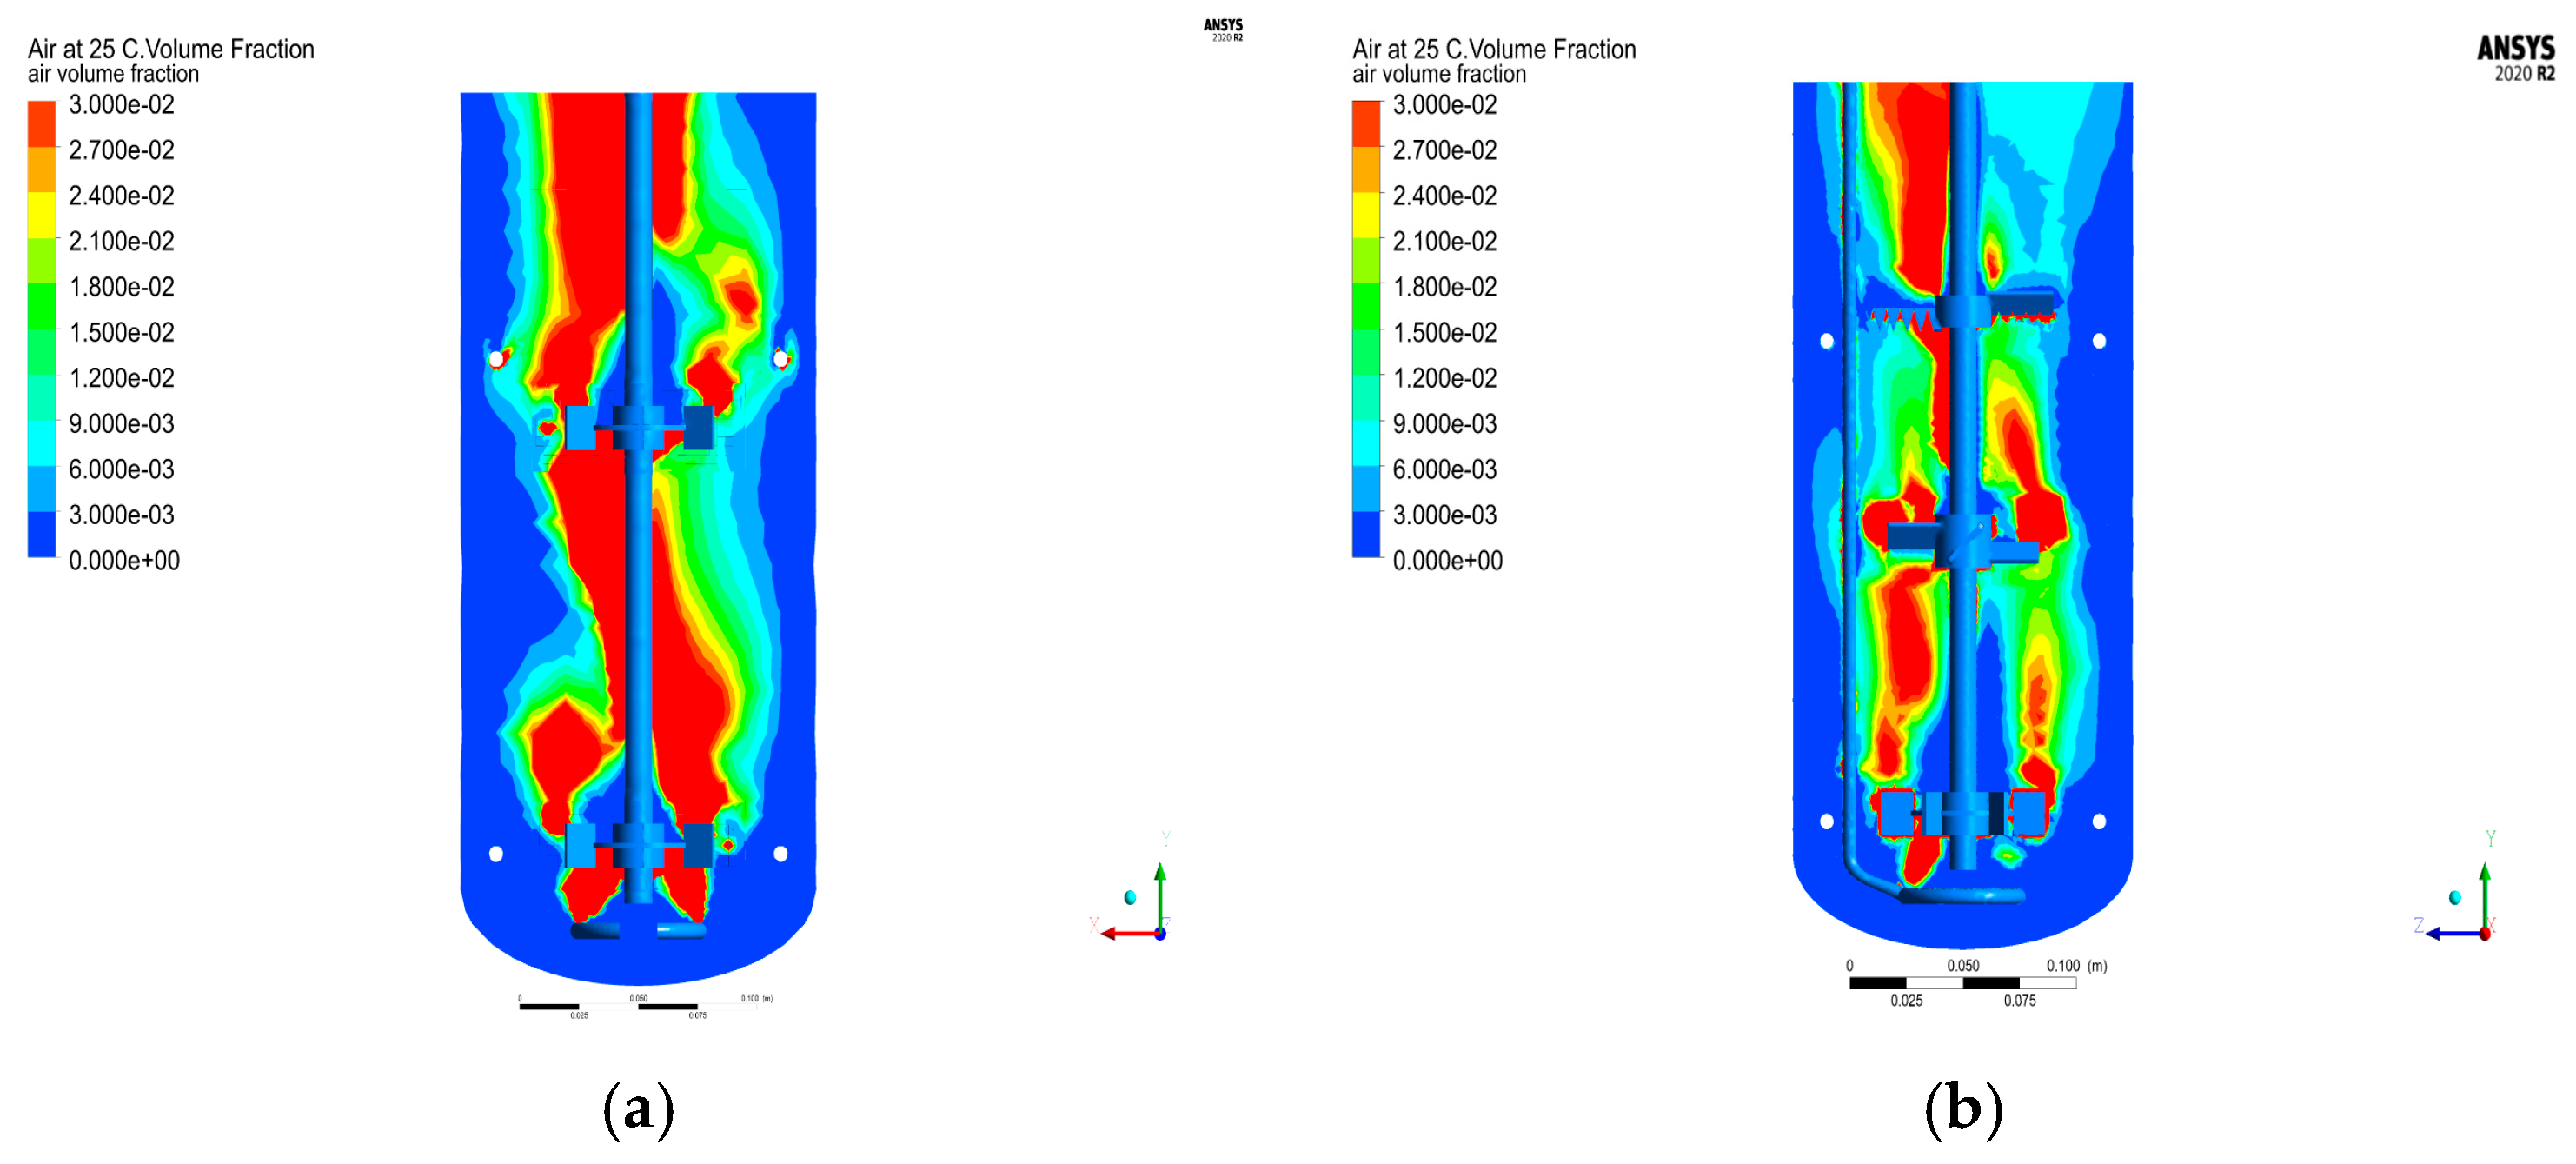
Analysis and comparison of gas content distribution under 1.142 VVm and 350 rpm cold mold conditions before and after structural optimization (
Figure 9) reveal significant differences. Prior to optimization, the gas content distribution exhibits greater uniformity, suggesting that the stirring induced by the ventilation groups was insufficient to fully disperse gas bubbles under this structural configuration. Consequently, the gas–liquid mass transfer efficiency was suboptimal. In contrast, after aerodynamic structural optimization, increasing the rotational speed enables the 1.142 VVm inlet airflow to synergize with stirring conditions, thereby achieving enhanced gas–liquid mass transfer. This improvement is attributed to the optimized pneumatic structure, which facilitates better interaction between the gas phase and the agitated liquid phase at elevated rotational speeds.
In summary, the computational fluid dynamics (CFD)-guided optimization of the pneumatic structure in a commercial standard bioreactor provides a reliable framework for enhancing the aerobic fermentation process of the recombinant bacterium
B. subtilis 168/pMA5-
Acp. Simulation results demonstrate that under the optimized structural configuration, controlling the rotational speed within 250–350 rpm and maintaining an aeration ratio of 1.14 VVm yields superior integration of stirring and mass transfer effects. These findings confirm that the reactor’s pneumatic structural modifications detailed in this chapter effectively support the successful execution of practical fermentation experiments [
31].
3.4. BP Neural Network Prediction of the Oxygen Mass Transfer KLa Model for the 5 L Fermenter System Under Alternative Media Fermentation Conditions
Based on predetermined culture parameters, this study constructed a dynamic correlation model to relate the oxygen mass transfer coefficient (
KLa) to aeration rate and stirring speed in an alternative medium system. As illustrated in
Figure 10, the BP neural network achieved a coefficient of determination (
R2) exceeding 0.99 between predicted and measured values, with residuals maintaining a standard deviation below 0.0082 (
Table 3), demonstrating exceptional model fitting accuracy.
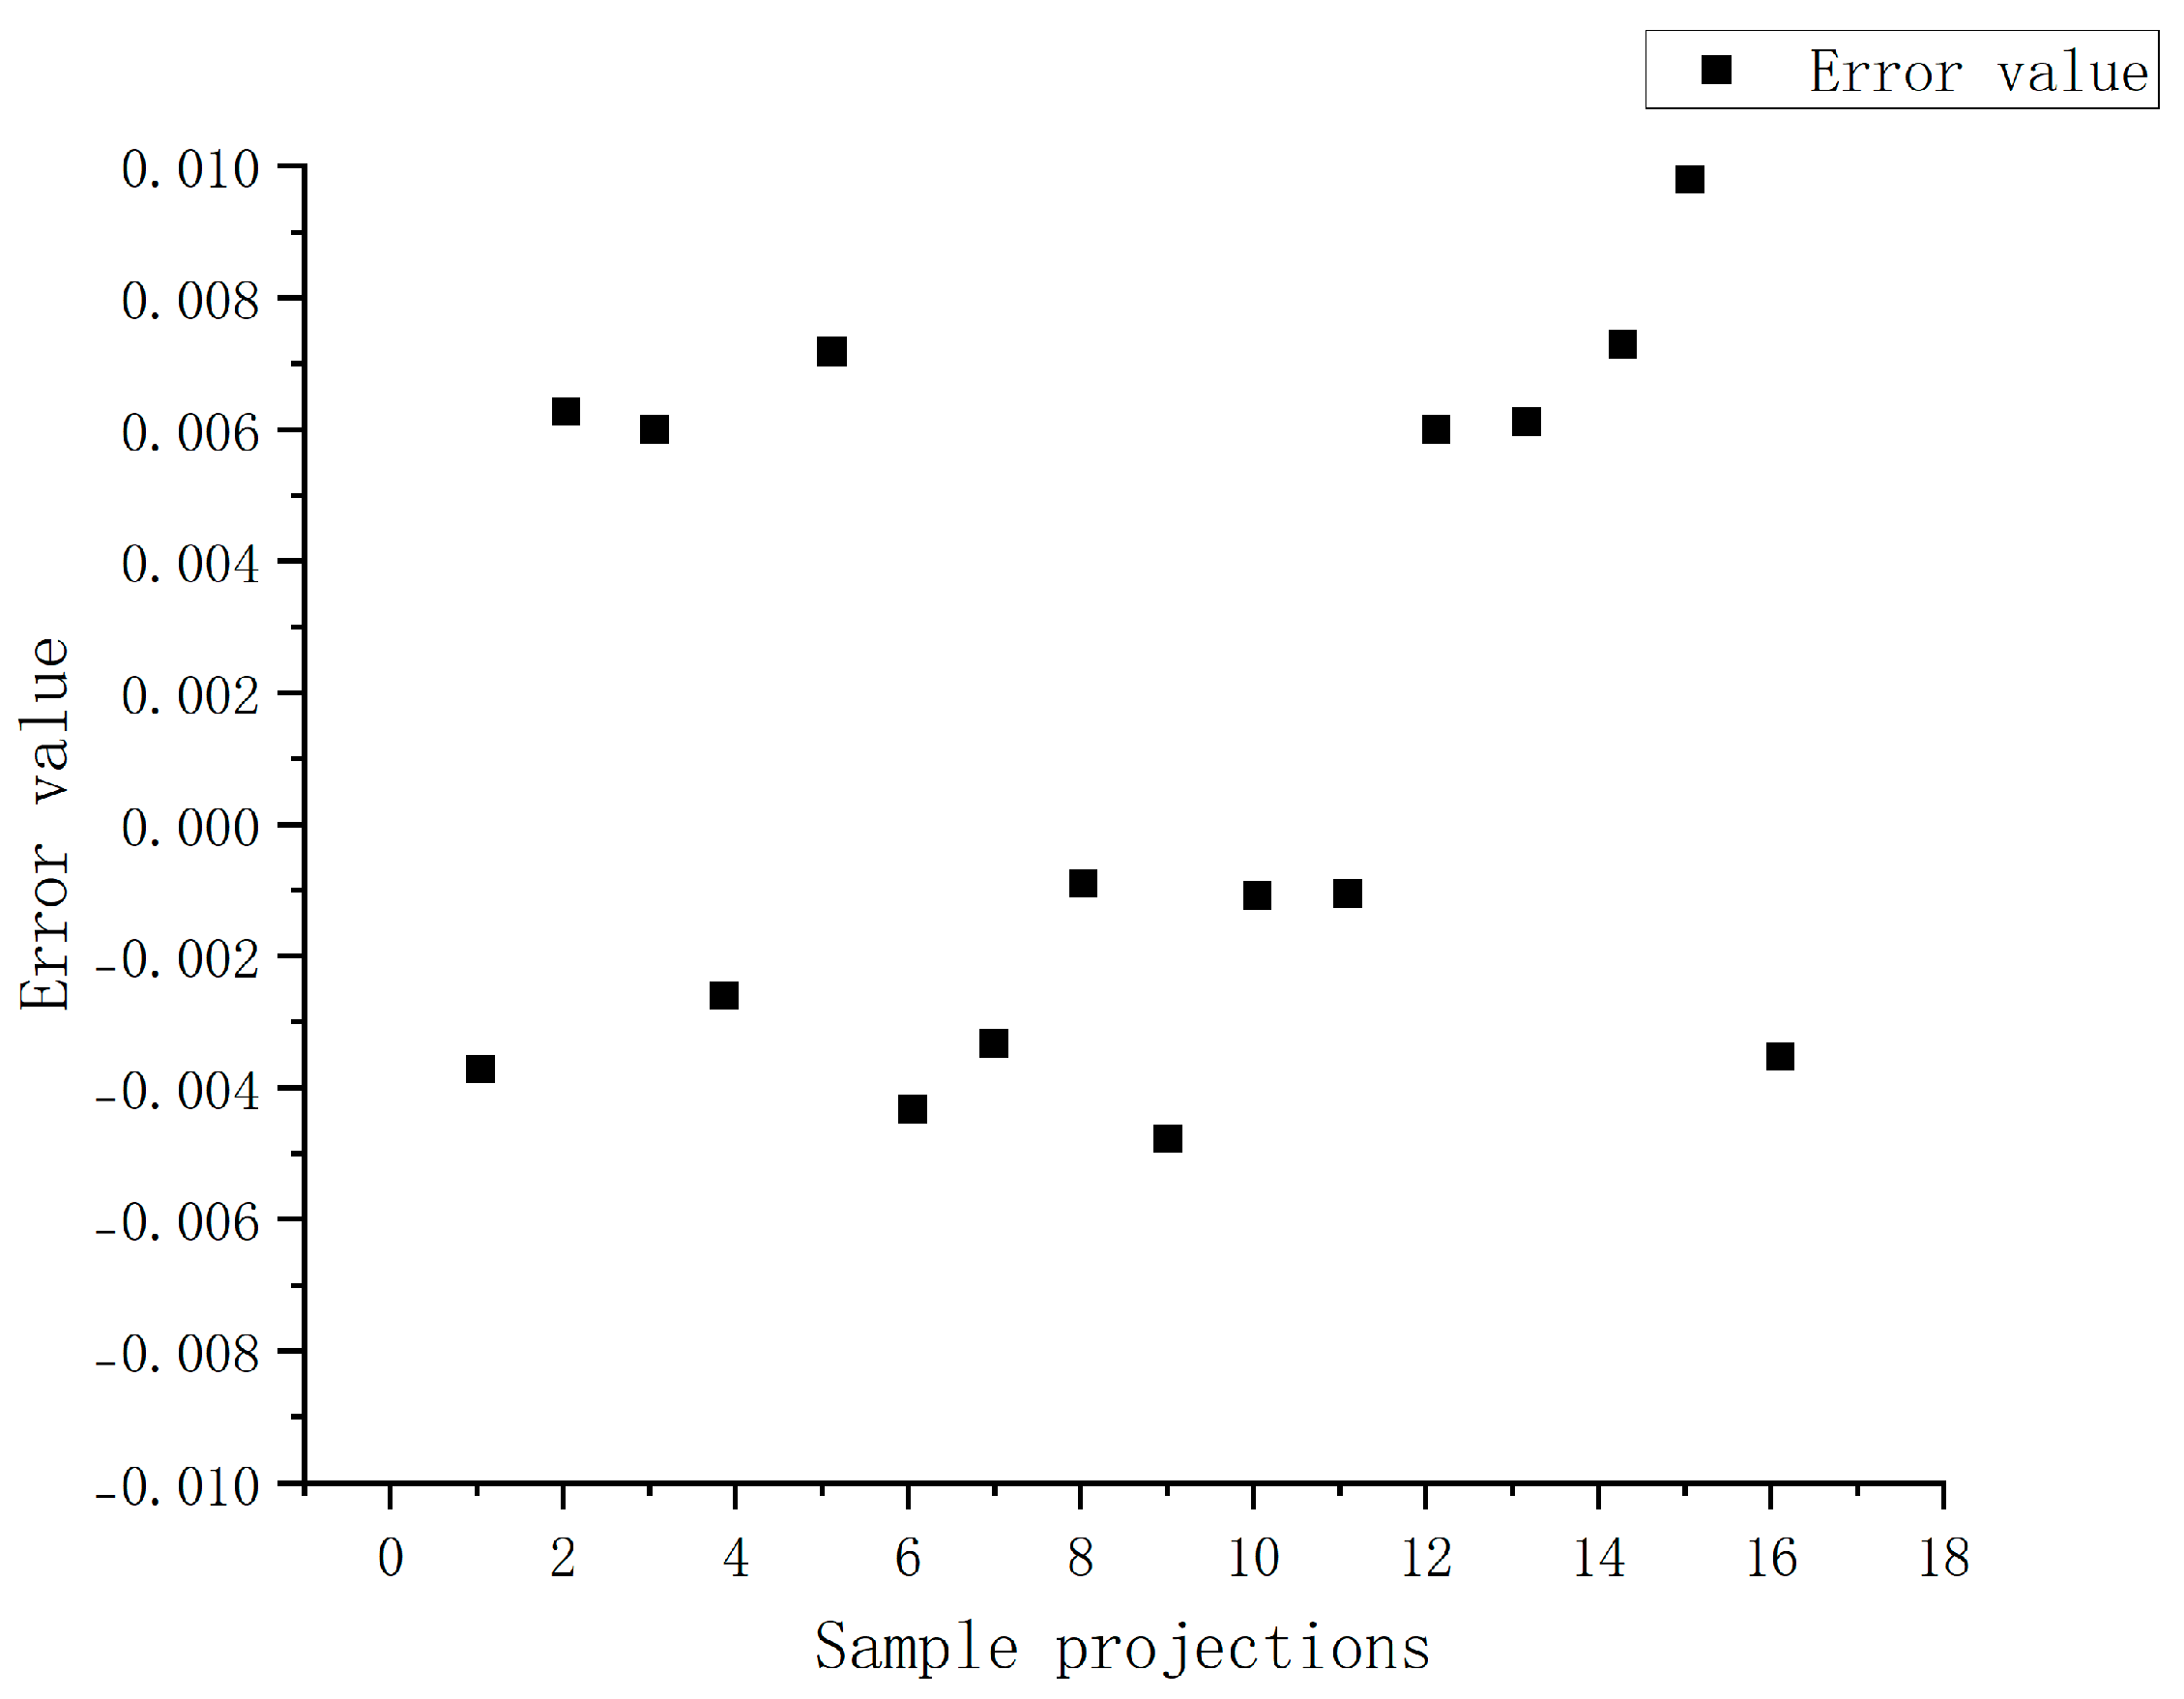
Table 3 summarizes prediction performance metrics for 16 randomly selected validation datasets. Residual analyses (
Figure 11) reveal a random distribution pattern, with absolute values confined to ±0.01, indicating no significant systematic bias or heteroscedasticity. These results confirm that the BP neural network effectively resolves (
KLa) values across varying rotational speeds and aeration rates in the alternative medium system.
3.5. Sensitivity and Uncertainty Analysis of the Parameters of the BP Model and the Dynamical Model
I. Parameter analysis of the BP model (back-propagation neural network)
(i) Sensitivity analysis of BP model parameters
The core parameters of the BP model include the weight matrix (W), bias vector (b) and activation function parameters, and the sensitivity analysis aims to quantify the impact of parameter changes on the output.
The Core method:
Gradient analysis: sensitivity is measured by calculating the gradient of the output to the parameters (
), the larger the absolute value of the gradient, the more significant the effect of the parameters. For example, the parameter sensitivity can be expressed under the mean square error loss function:
The parameter perturbation method: fix the other parameters, slightly perturb a parameter (e.g.,
θ +
Δθ), and calculate the rate of change in the output:
Importance ranking: Ranking the parameter importance by the gradient accumulation or the performance degradation after removing the parameter (e.g., weight decay in L1/L2 regularization indirectly reflects the sensitivity).
(ii) BP model parameter uncertainty analysis
The uncertainty of the BP model mainly comes from parameter initialization, training data noise and model complexity.
The Core method:
Monte Carlo dropout: the parameter distribution is simulated by randomly dropping neurons several times (dropout), and the variance of the output results reflects the uncertainty.
The Bayesian neural network (BNN): represent parameter uncertainty with probability distribution (e.g., Gaussian distribution), and estimate the posterior distribution by variational inference or the MCMC method.
Prediction interval estimation: Generate multiple sets of models by repeated training (with different initialization), and calculate confidence intervals (e.g., 95% intervals) for the output.
Parameter analysis of kinetic models
Kinetic models usually refer to systems described by differential equations (e.g., ) with parameters θ such as reaction rate constants, diffusion coefficients, etc.
(i) Sensitivity analysis of kinetic model parameters
Local sensitivity analysis (LSA):
The analytical method: sensitivity coefficients are calculated by Jacobi matrix, e.g., for parameter θ
i, sensitivity is defined as:
The numerical difference method: perturbation parameter
, calculate the state variable change:
Global Sensitivity Analysis (GSA):
The Sobol exponential method: decompose the output variance into the contribution of each parameter and its interaction, the first order exponent Si indicates the proportion of the effect of parameter θi alone, and the total exponent SiT indicates the effect of the inclusion of the interaction.
The Morris method: Generate parameter combinations by sequential sampling, calculate the mean and standard deviation of the output gradient, and distinguish between linear and nonlinear effects of parameters and interactions.
Example of tools: The SALib library for the Sobol index and the Morris method calculations, suitable for chemical reaction, ecological models, etc.
(ii) Parameter uncertainty analysis for kinetic models
Parameter uncertainty transfer:
Monte Carlo simulation: set probability distributions (e.g., normal and uniform) for the parameters, run the model repeatedly to generate output samples, and describe the uncertainty by statistical moments (mean, variance) or quartiles.
Likelihood inference: based on the observed data, update the posterior distribution of the parameters with a Bayesian approach (e.g., MCMC sampling), and then simulate the output uncertainty through the posterior parameter set.
Uncertainty quantification (UQ) framework: combined with sensitivity analyses, focuses on the impact of uncertainty in highly sensitive parameters on the output (e.g., approximating the output variance with the Delta method).
3.6. Growth Kinetic Equations Under Fermentation Conditions in Alternative Media Based on BP Neural Network Prediction
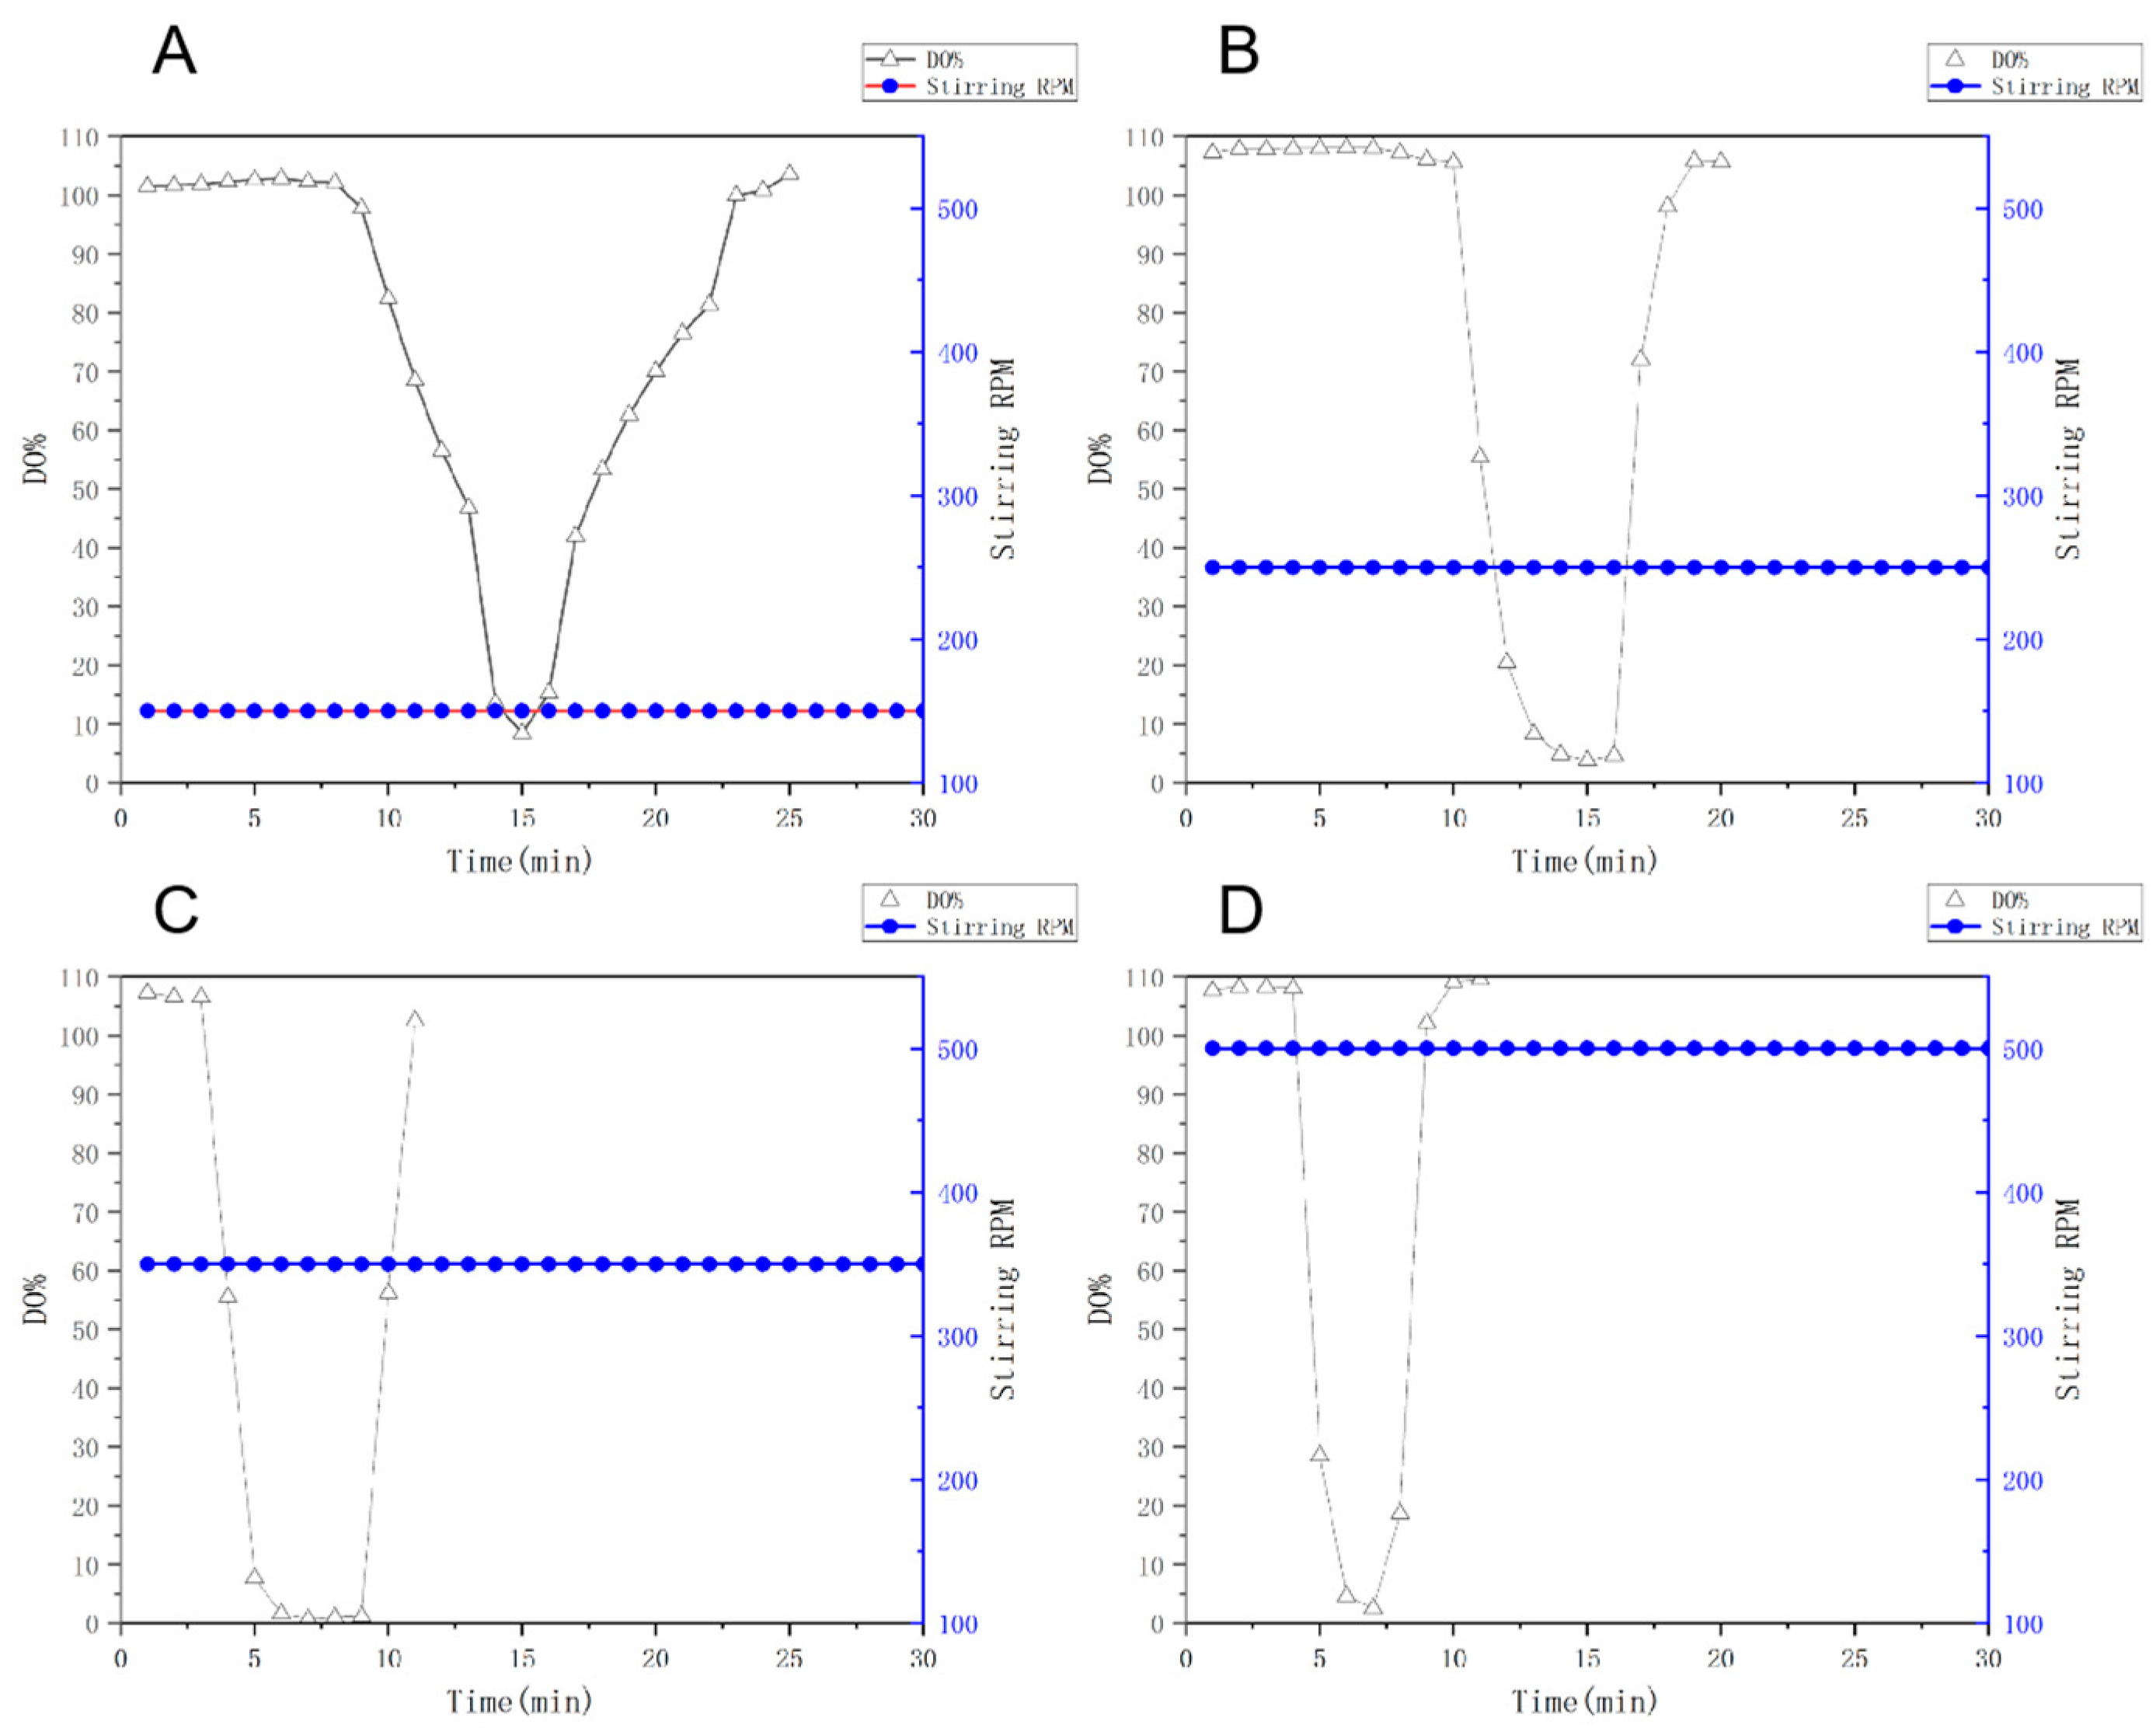
The kinetic properties of oxygen transfer were determined by the nitrogen gas displacement method under dynamic stirring-ventilation coupling conditions (constant air inlet 1.142 VVm). The specific operation procedure was as follows: firstly, nitrogen gas was ventilated into the system to drive out dissolved oxygen (DO), and when the DO value reached close to 0, it was switched to air supply, and the DO recovery curve [
32] was recorded synchronously (
Figure 12). The results showed that the slope of dissolved oxygen rise becomes steeper with the increase in rotational speed, and although the 350 rpm and 500 rpm speeds have a higher rate of oxygen transfer, there is a possibility of permanent damage to the cells due to the rapid speed of the stirring paddles resulting in the stirring which may cause strong shear action, which may then lead to a decrease in the value of the biomass of the bacterium OD
600, affecting the outcome of the fermentation. Therefore, it was decided that a speed of 350 rpm would be optimal.
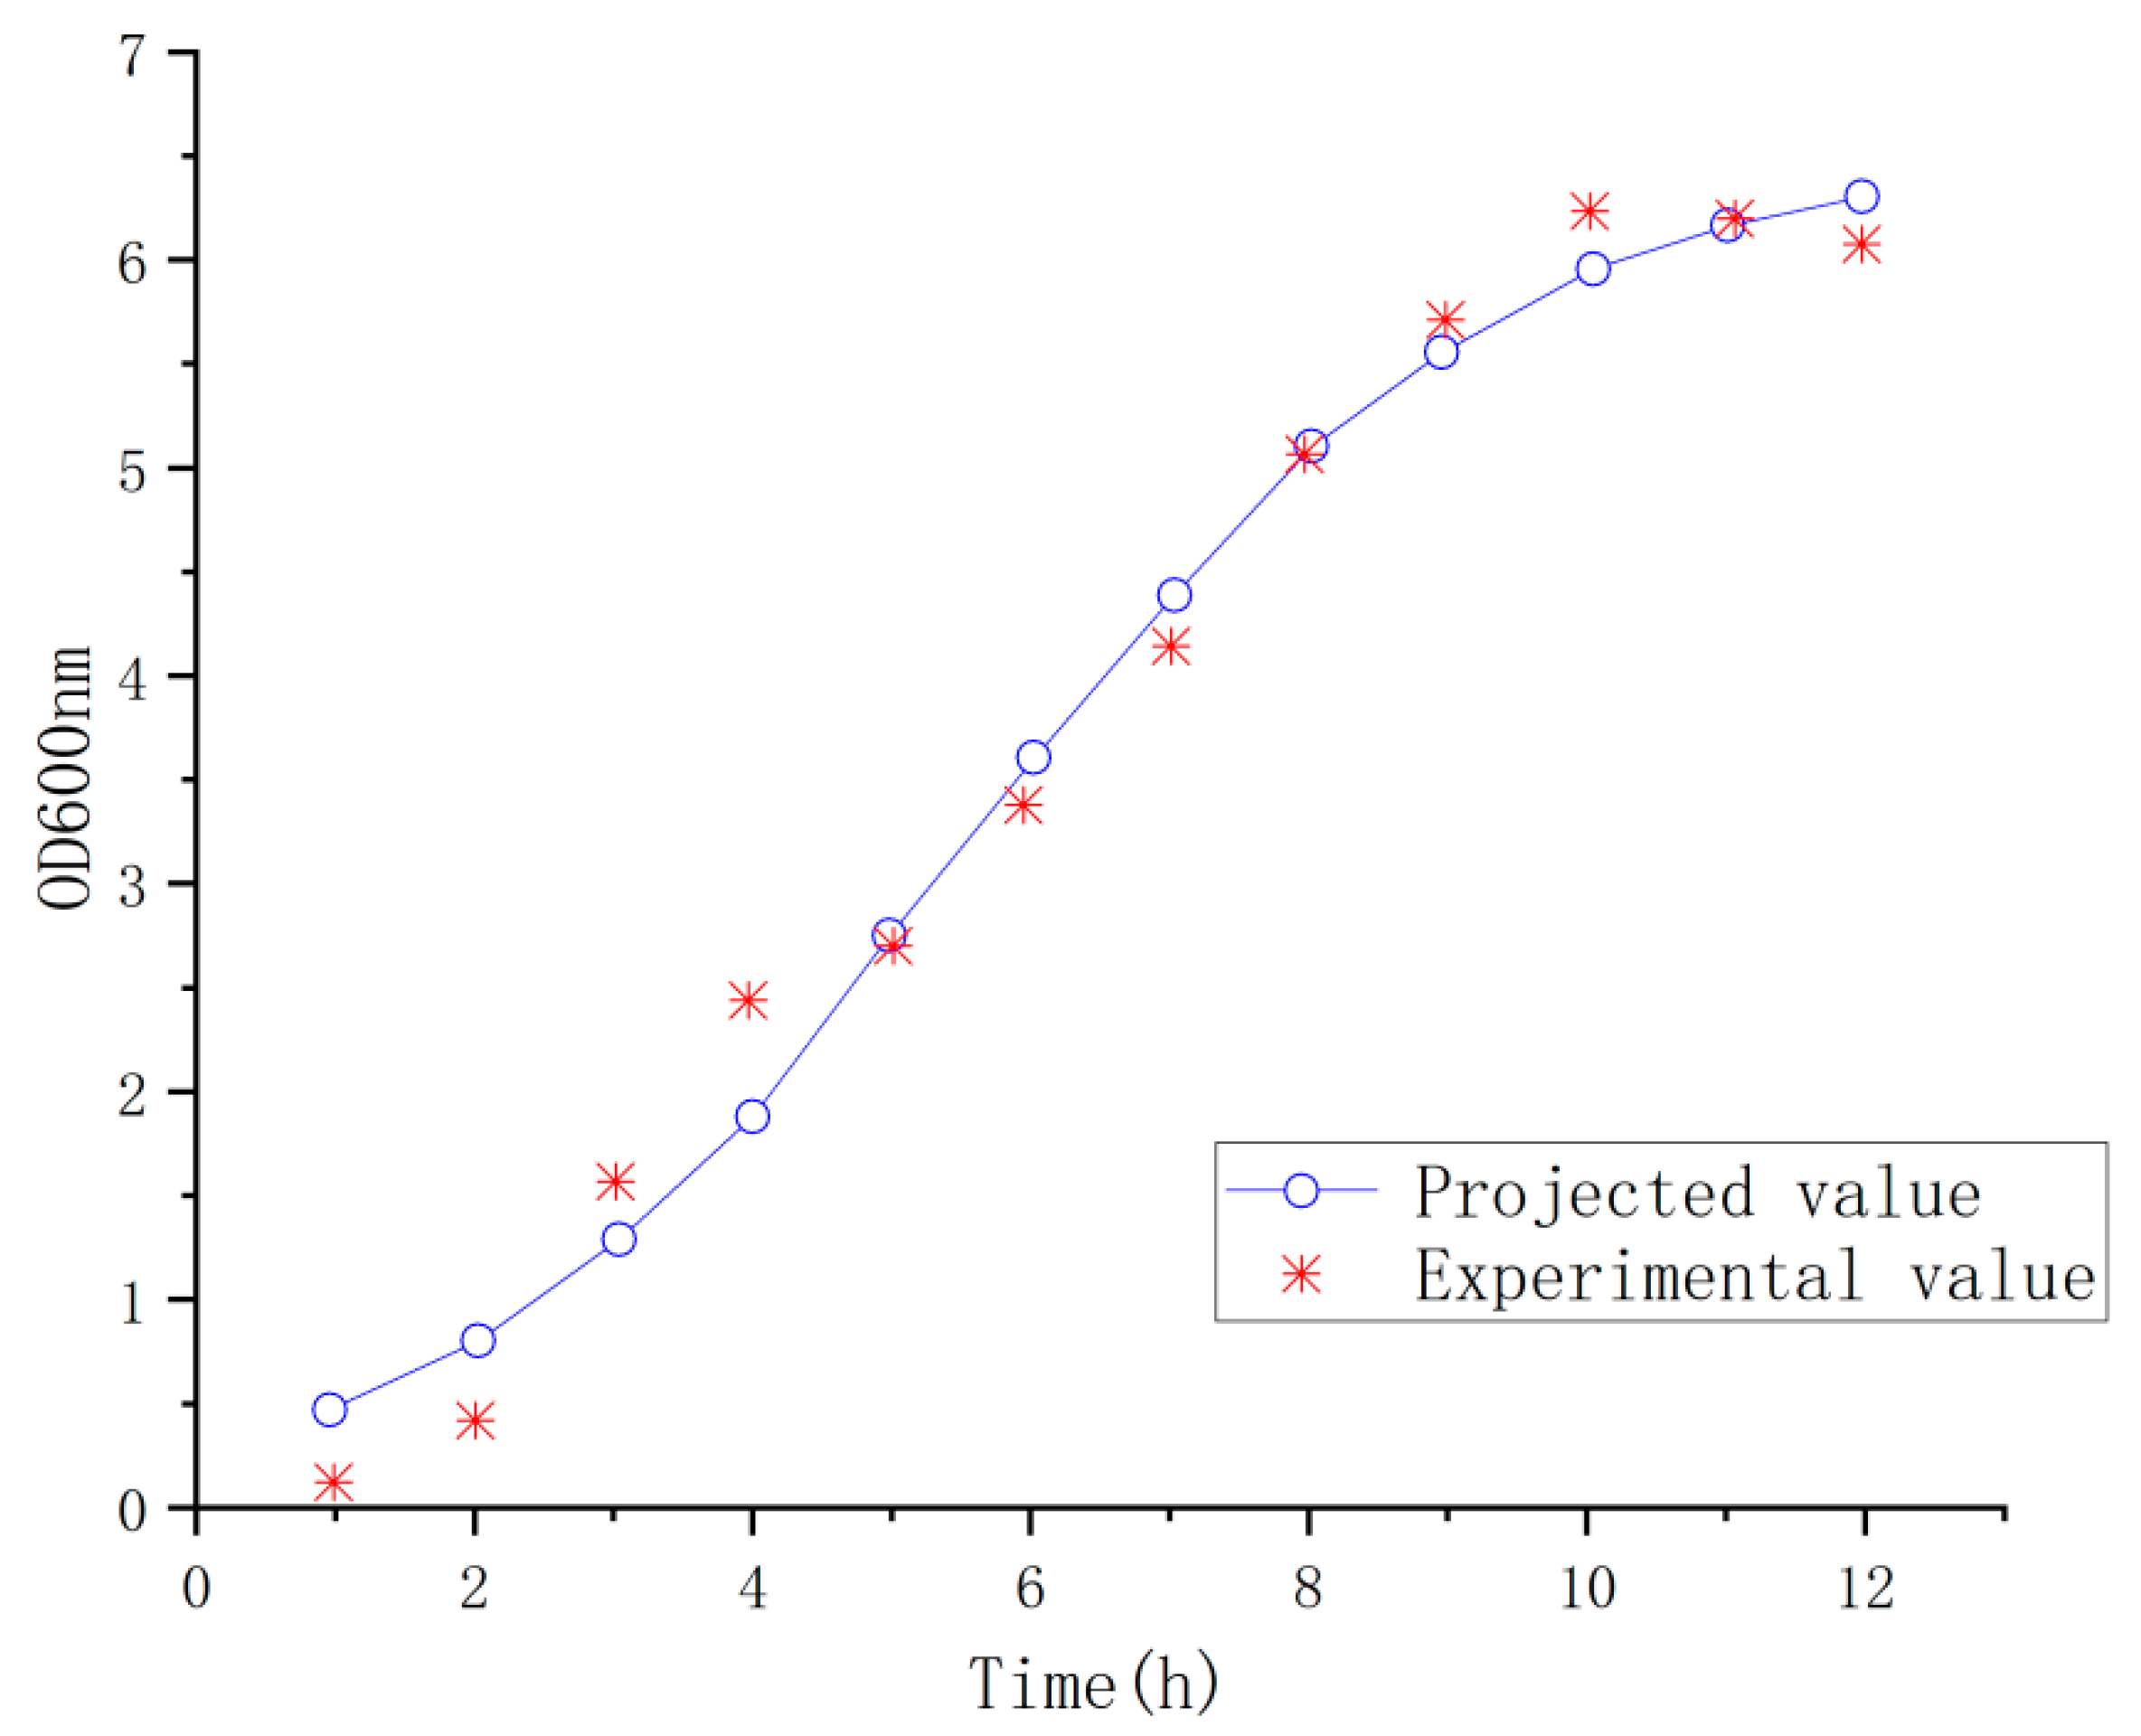
The best dissolved oxygen conditions for cell growth of 1.142 VVm and 350 rpm was chosen for fitting the concentration of the organisms, and the results of comparing the true values with the predicted values are shown in
Figure 13, which showed that the true values and the predicted values were in very good agreement (
R2 > 0.99), indicating that the prediction was successful [
33]. Then, Matlab (
https://www.mathworks.com/products/matlab.html) was used to fit the logistic model into the real values to obtain the values of each parameter X
0 = 0.3103, Xm = 6.5168, μm = 0.5335, and the growth kinetic equation of the bacteria was obtained:
3.7. Studies on the Effect of Using Alternative Media on the Growth and Enzyme Production of Bacteria in a 5 L Fermenter
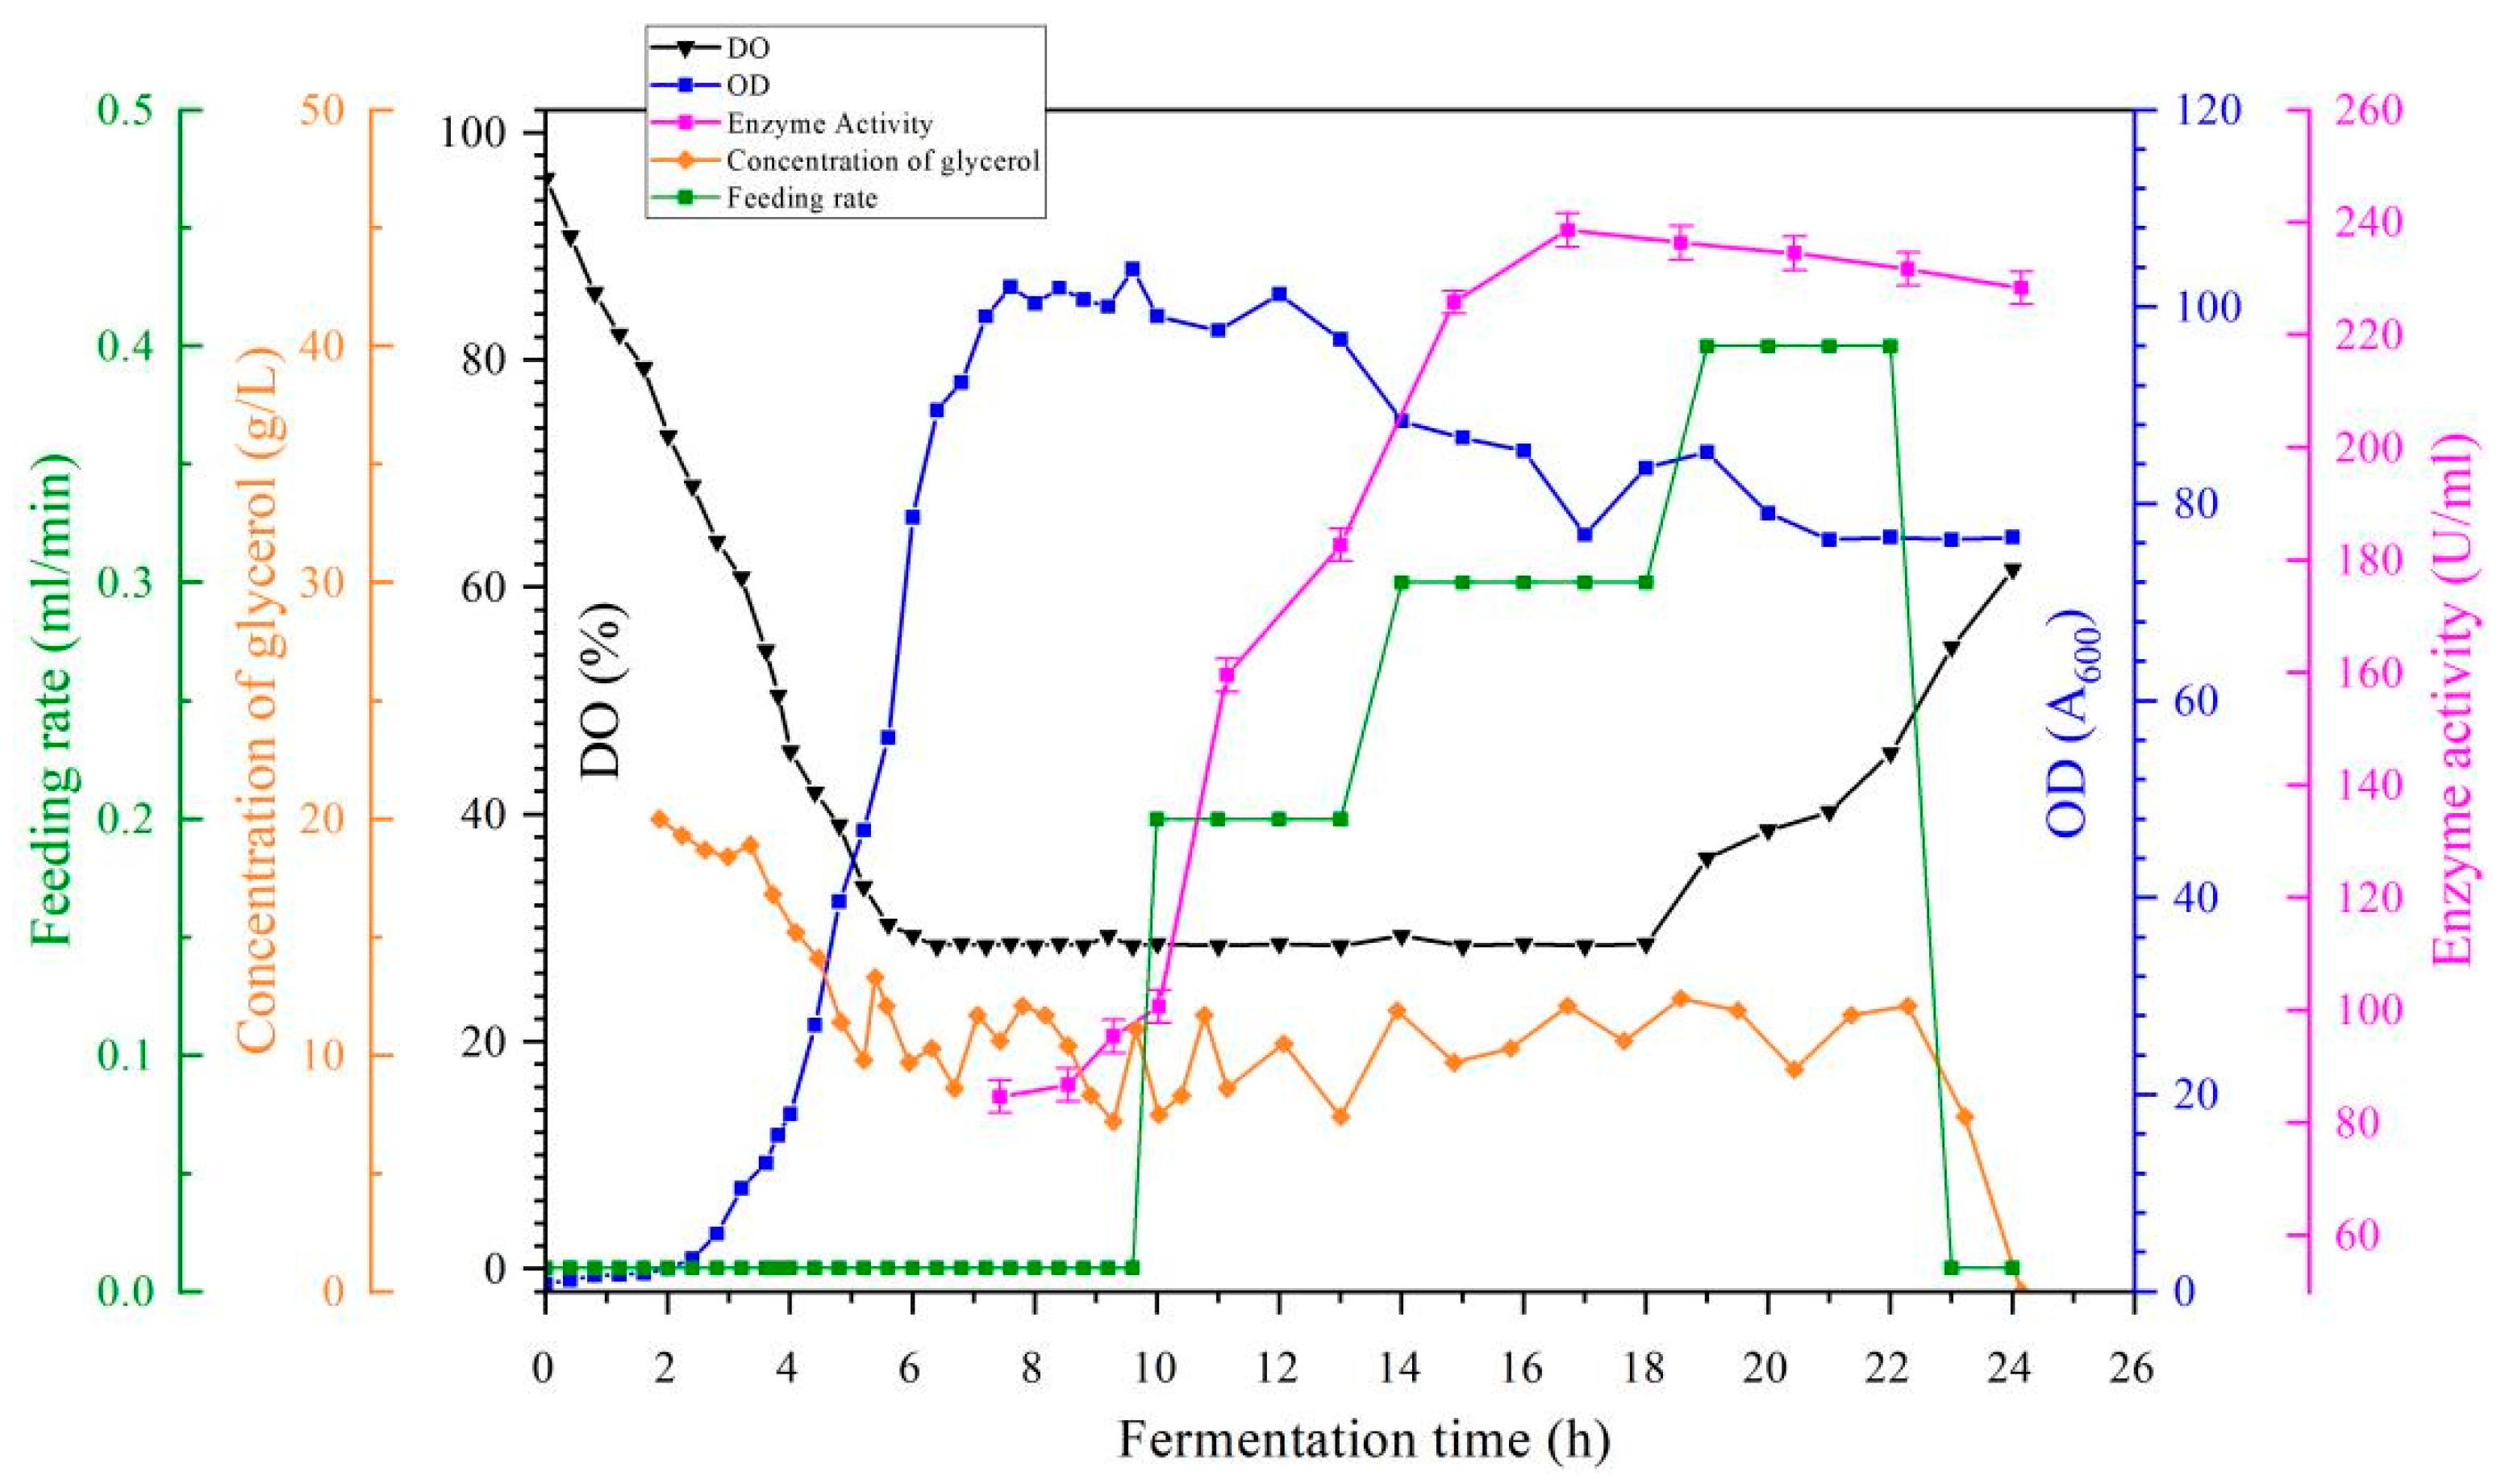
Based on the pre-constructed
B. subtilis 168/pMA5-
Acp engineered strain and its optimized fermentation parameter system, a low-cost alternative medium (7.5 g/L molasses; 15 g/L urea; 1.2 g/L K
2HPO
4; 0.25 g/L MgSO
4-7H
2O; pH 7.2) was used in the present study for the evaluation of the fermentation process (
Figure 14). Due to the high level of impurities in the alternative medium used and the change in the ratio of carbon and nitrogen sources resulting in a decrease in their utilization, the medium increased the overall DO level after the log phase of fermentation, indicating that the alternative medium contributed to the increase in DO limitation during fermentation, and also indicating that the alternative medium produced a reduced mass transfer drive and the end point of the fermentation was prolonged accordingly by four hours [
34]. The OD
600 reached 101.67 after 14 h of fermentation, a value that was not significantly different from the initial medium. Although the enzyme activity of the fermentation broth at 16 h was 215.99 U/mL, which was 9.5% lower than the initial medium, the cost of fermentation was reduced by 90.03%. Since the main function of the 5 L tank fermentation is to provide
B. subtilis 168/pMA5-
Acp for the fermentation process, the alternative medium can be further used in the pilot fermentation stage.
3.8. Establishment of a 100 L Pilot Fermentation Process
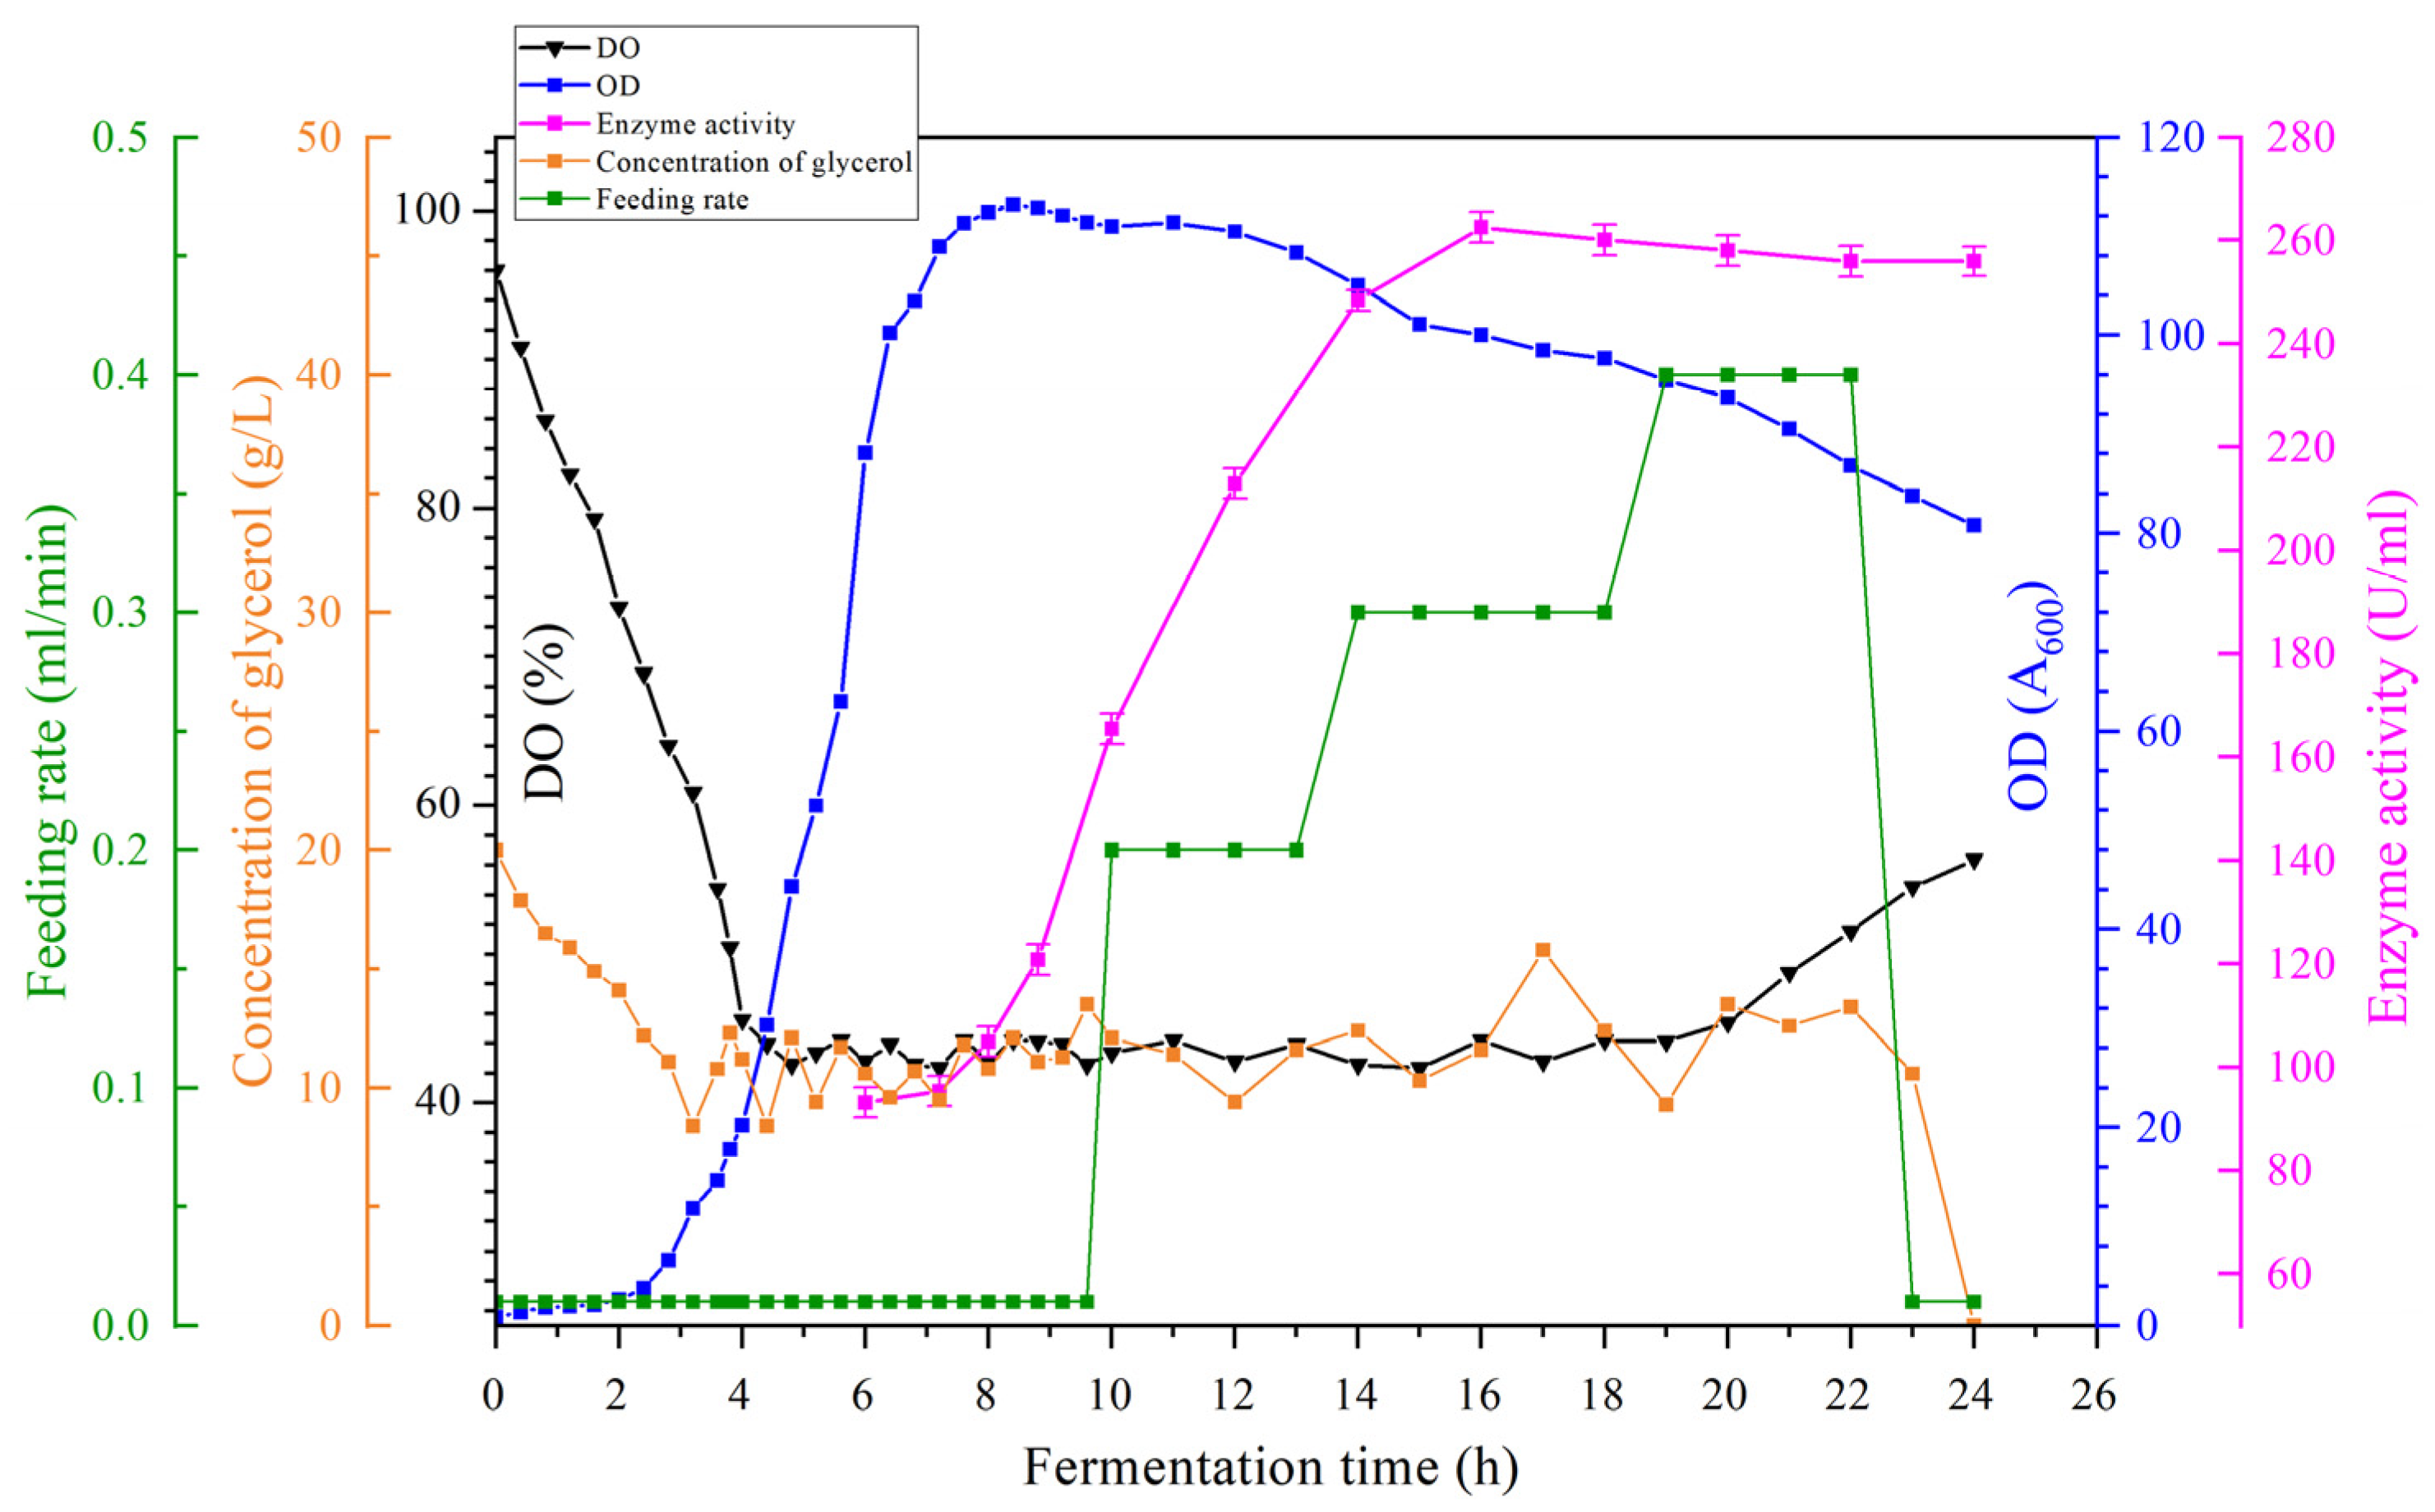
Fermentation experiments were conducted in a 100 L pilot-scale tank using industrial alternative culture media and the optimized fermentation parameters described above. The cultured seed solution was transferred to a 5 L mechanically stirred seed tank at a ratio of 1% (
v/
v) and further transferred to a 100 L tank after 10 h for continued cultivation. Considering the dissolved oxygen conditions of the fermentation tank and the operational requirements of the 100 L pilot-scale tank, the filling volume was set to 50 L. The fermentation temperature was maintained at 37 °C for the first 2 h, then reduced to 25 °C after 2 h to facilitate self-induction. At this point, the aeration rate was gradually increased from 24 L/h to 60 L/h, with a pH of 8.15. The fermentation results are shown in
Figure 15. As shown in the figure, changes in various parameters such as aeration rate, rotation speed, and loading volume, all resulted in lower dissolved oxygen levels in the 100 L pilot-scale fermenter compared to the 5 L fermenter. This led to the
KLa value of the 100 L fermenter used in the pilot-scale experiment being slightly higher than that of the 5 L fermenter, as calculated from the slope of the dissolved oxygen curve. This indicates that the model based on the fermentation kinetic parameters of the 5 L fermenter can be applied to construct an optimized process model for the 100 L pilot-scale fermenter. After batch feeding fermentation was conducted according to the optimized model, the maximum OD
600 value of
B. subtilis (113.16) increased compared to the fermentation level of the 5 L tank. After 16 h, the enzyme activity of the
B. subtilis fermentation broth reached 262.52 U/mL, significantly higher than the enzyme activity level of the 5 L fermentation tank, indicating that the optimized fermentation kinetic model parameters from the 5 L tank can be directly applied to construct the 100 L pilot-scale fermentation process.
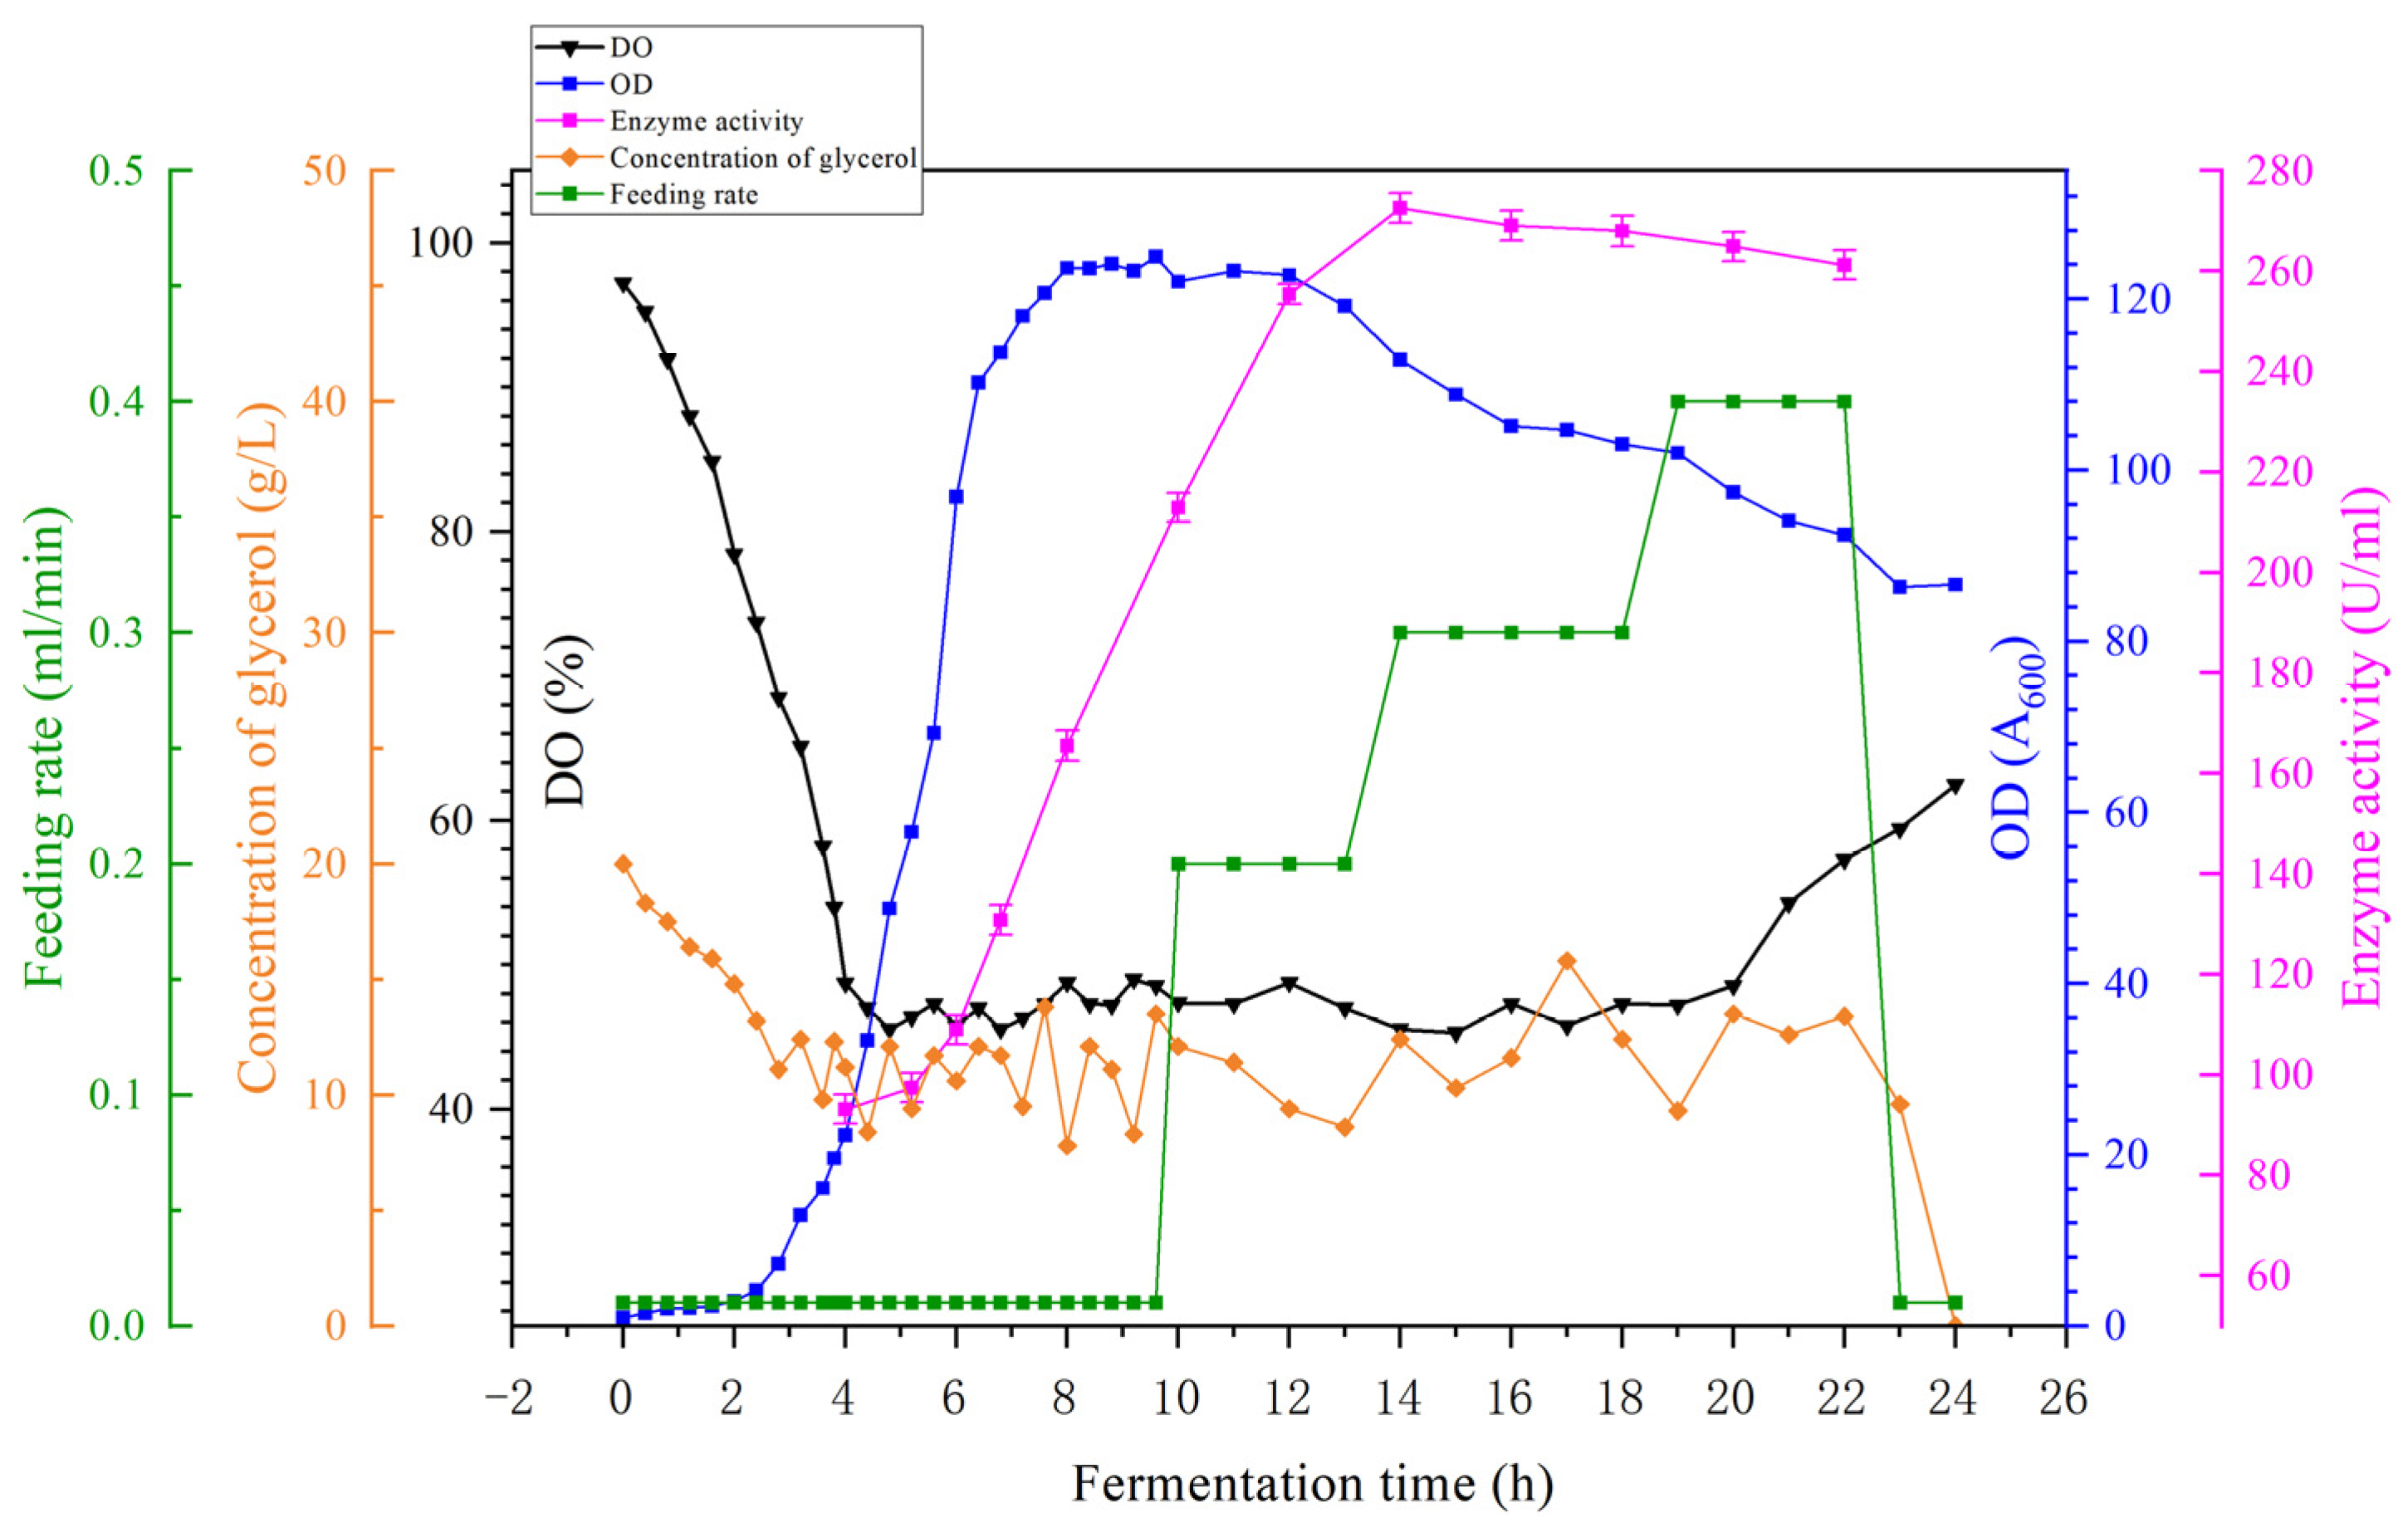
3.9. Industrial Fermentation Production Application on a Scale of 1 m3
Based on the aforementioned 100 L fermentation model, the fermentation scale will be further expanded to 1 m
3. The fermentation parameters are set as follows: the fermentation tank filling volume is 500 L; the medium is the aforementioned alternative medium; the fermentation temperature is maintained at 30 °C throughout the process, with a stirring speed of 400 rpm; after 3 h of fermentation, the aeration rate is adjusted, starting from 240 L/h and gradually increasing to 600 L/h. Once the pH reaches 8.15, the fermentation broth becomes alkaline, which is unfavorable for microbial growth, so the fermentation is terminated. The relationship between OD
600, dissolved oxygen, and enzyme activity during fermentation is shown in
Figure 16. As shown in the figures, glycerol supplementation begins at 10 h, with the maximum supplementation rate reaching 0.4 mL/min, resulting in a 24-fold increase in fermentation OD
600 compared to the highest level in shaking flasks, with the OD
600 reaching 124.97 during the stationary phase. Enzyme activity increased by 12 fold compared to the shaking flask, reaching 272.52 U/mL. This indicates that the optimal mass transfer kinetic fermentation model established under the precise control of parameters in the 5 L fully automated fermenter demonstrates excellent performance and can be scaled up to a 1 m
3 scale for industrial production.
4. Conclusions
In this study, a feasible pathway for scaling up the fermentation enzyme production process of the recombinant bacterium B. subtilis 168/pMA5-Acp from laboratory to industrial production was established. This was achieved through optimization of the bioreactor’s pneumatic structure, development of a fermentation kinetic model, and demonstration of process feasibility using an alternative medium. The results revealed that optimizing the pneumatic structure and implementing alternative media significantly enhanced fermentation efficiency while reducing costs, thereby providing robust technical support for industrial-scale production.
The optimized 5 L bioreactor demonstrated marked improvements in aerodynamic performance, as confirmed by CFD simulations and experimental validation. Under conditions of 1.142 VVm aeration and 350 rpm agitation, the reactor exhibited a higher oxygen transfer coefficient (KLa), improved mass transfer efficiency, and more uniform turbulent kinetic energy distribution, leading to superior mixing. Furthermore, the incorporation of baffles minimized mass transfer dead zones and optimized gas content distribution within the vessel. These enhancements not only increased dissolved oxygen transfer efficiency but also created a more favorable environment for recombinant bacterial growth and enzyme synthesis.
The BP neural network-based oxygen transfer model (KLa) and the logistic growth kinetic model accurately predicted dissolved oxygen transfer and bacterial growth during fermentation. Under alternative medium conditions, the models’ predictions closely aligned with experimental data, demonstrating strong fitting accuracy and predictive capability. Furthermore, optimization of fermentation parameters significantly enhanced the 5 L fermenter’s efficiency, and the models exhibited robust applicability in both pilot- and industrial-scale processes.
In this study, enzyme production via fermentation using alternative media in a 5 L fermenter demonstrated a 90.03% reduction in cost compared to experimental media, while maintaining equivalent fermentation efficacy. This outcome confirms the economic feasibility of industrial-scale implementation.
Although this study has made significant progress in enhancing recombinant bacterial fermentation enzyme production, several challenges remain for further exploration and optimization: (1) Automation and intelligence of the fermentation process: While the current control system achieves remote monitoring and PID parameter optimization, its automation and intelligence require refinement. Future work could integrate advanced sensor technologies and machine learning algorithms to enable fully automated control and real-time process optimization [
35]. (2) Alternative medium formulation: Despite the alternative medium’s cost advantages, its fermentation efficiency remains marginally lower than the original medium. Further optimization of carbon-to-nitrogen ratios and nutrient composition could improve performance while reducing impurity levels. (3) Large-scale fermentation stability and reproducibility: Although the 1 m
3 fermenter demonstrated improved efficiency, its consistency in industrial-scale production necessitates validation. Additional experimental data are required to refine parameters and ensure process reliability [
36]. (4) Enzyme extraction and purification: Current research prioritizes fermentation optimization, with limited focus on downstream processes. Developing efficient extraction and purification methods to enhance enzyme recovery rates and purity could further reduce costs [
37]. (5) Green fermentation and sustainability: As environmental concerns grow, adopting renewable energy sources (e.g., solar and wind) to power fermentation processes may reduce carbon emissions and align with sustainable development goals.


