Article

Anaerobic Co-Digestion of Cattle Manure and Sewage Sludge Using Different Inoculum Proportions

by
Caroline Carvalho Pinto
1,
Juliana Lobo Paes
1,2,*,
Alexia de Sousa Gomes
3,
Daiane Cecchin
2,4,
Igor Ferreira Oliva
1,
Romulo Cardoso Valadão
1 and
Vânia Reis de Souza Sant’Anna
5
1
Department of Engineering, Federal Rural University of Rio de Janeiro (UFRRJ), Seropédica 23890-000, Brazil
2
Graduate Program in Digital Agroenergy, Federal University of Tocantins (UFT), Palmas Campus, Palmas 77001-090, Brazil
3
Department of Veterinary Medicine and Surgery, Federal Rural University of Rio de Janeiro (UFRRJ), Seropédica 23890-000, Brazil
4
Department of Agricultural Engineering and Environment, Federal Fluminense University, Niterói 24220-900, Brazil
5
Independent Researcher, Viçosa 36570-240, Brazil
*
Author to whom correspondence should be addressed.
Fermentation 2025, 11(7), 373; https://doi.org/10.3390/fermentation11070373
Submission received: 5 May 2025 / Revised: 11 June 2025 / Accepted: 24 June 2025 / Published: 28 June 2025
(This article belongs to the Special Issue Biorefining for Biofuel Production)

Abstract

Anaerobic digestion (AD) is a sustainable strategy for converting hazardous wastes into renewable energy while supporting Sustainable Development Goals (SDGs). This study aimed to evaluate the effect of inoculum on optimizing biogas production from sewage sludge (SS) and cattle manure (CM). Bench-scale digesters were fed with 0, 20, and 40% inoculum prepared at a 1:3 SS:CM ratio. Substrate and digestate were analyzed for physicochemical properties, and biogas production data were fitted using nonlinear models. Kinetic parameters ranged from 0.0770 to 0.4691 L·kg−1 for Ymax, from 1.0263 to 2.1343 L·kg−1·week−1 for μmax, and from 0.8168 to 8.0114 weeks for λ, depending on the ratio. The 1:3 SS:CM with 40% inoculum significantly improved biogas production by reducing the lag phase and increasing weekly yield, with the Gompertz model showing the best fit to the digestion kinetics. This was particularly evident due to the favorable conditions for microbial adaptation and efficient substrate degradation. The results reinforce the concept of optimization as defined in this study, wherein the application of inoculum enhances the performance of AD by improving the physicochemical conditions of the substrate and accelerating microbial activity, thereby resulting in increased methane (CH4) generation and overall biogas yield.

1. Introduction

Globally, countries have been implementing regulations to limit greenhouse gas (GHG) emissions due to their high global warming potential. One of the key strategies for mitigating emissions involves the recovery and reuse of waste generated by urban and agro-industrial activities within their respective production chains. To this end, various technological routes can be employed, including physical (extraction), biological (AD and fermentation), and thermochemical (direct combustion, pyrolysis, and gasification) processes. Among these, AD stands out for its ability to convert environmentally harmful waste into valuable energy resources. This aligns with the global energy agenda focused on Low Carbon Agriculture, Energy Transition, and diversification of the energy matrix [1,2].
AD encompasses anaerobic mono-digestion (MoAD), co-digestion (CoAD), and the use of inoculum [3,4,5]. MoAD uses a single type of substrate as a carbon and energy source for microorganisms, while CoAD involves the combination of different residues, significantly enhancing the efficiency of the process [3,4]. The addition of inoculum can further enhance biogas production by introducing a robust microbial community already adapted to the methanogenesis process. The digestate produced in AD can itself be reused as inoculum, serving as a concentrated microbial consortium capable of accelerating subsequent digestion cycles [6,7]. Operationally, the use of inoculum is of great importance, as it reduces the hydraulic retention time, shortens the lag phase, and increases the rates of biogas and CH4 production [8,9].
Among the waste materials with high bioenergy potential for inoculum use, SS from wastewater treatment plants and CM are notable. Despite their high content of organic matter and nutrients, which provide significant gains and considerable potential for both energy recovery and agricultural use, these substrates are still underutilized or poorly managed [10]. Several studies have demonstrated the effectiveness of using these residues in co-digestion systems, with methane yield [9,11,12,13]. However, the continuous evaluation of anaerobic digestion performance, specifically focused on inoculum application, remains essential, given its operational significance and the current lack of comprehensive studies addressing its systematic use in the scientific literature.
To better understand and optimize the anaerobic digestion process, mathematical modeling is widely adopted. Such models allow for more accurate prediction of process behavior and improved decision-making, enabling the detailed analysis of each stage of digestion and the influence of experimental variables on CH4 production. Among the various modeling approaches, nonlinear regression models are particularly suited to describe the complexity of the biochemical transformations involved in biogas production. These models help identify the growth and decline phases of microbial populations, the dynamics of biogas production, and the transformation of substrates into digestate over time [8,9].
Therefore, the aim of this study was to evaluate the effect of different inoculum percentages (0, 20, and 40%) on the AD of CM and SS, as well as to apply and fit mathematical models to the biogas production data generated under these conditions.

2. Materials and Methods

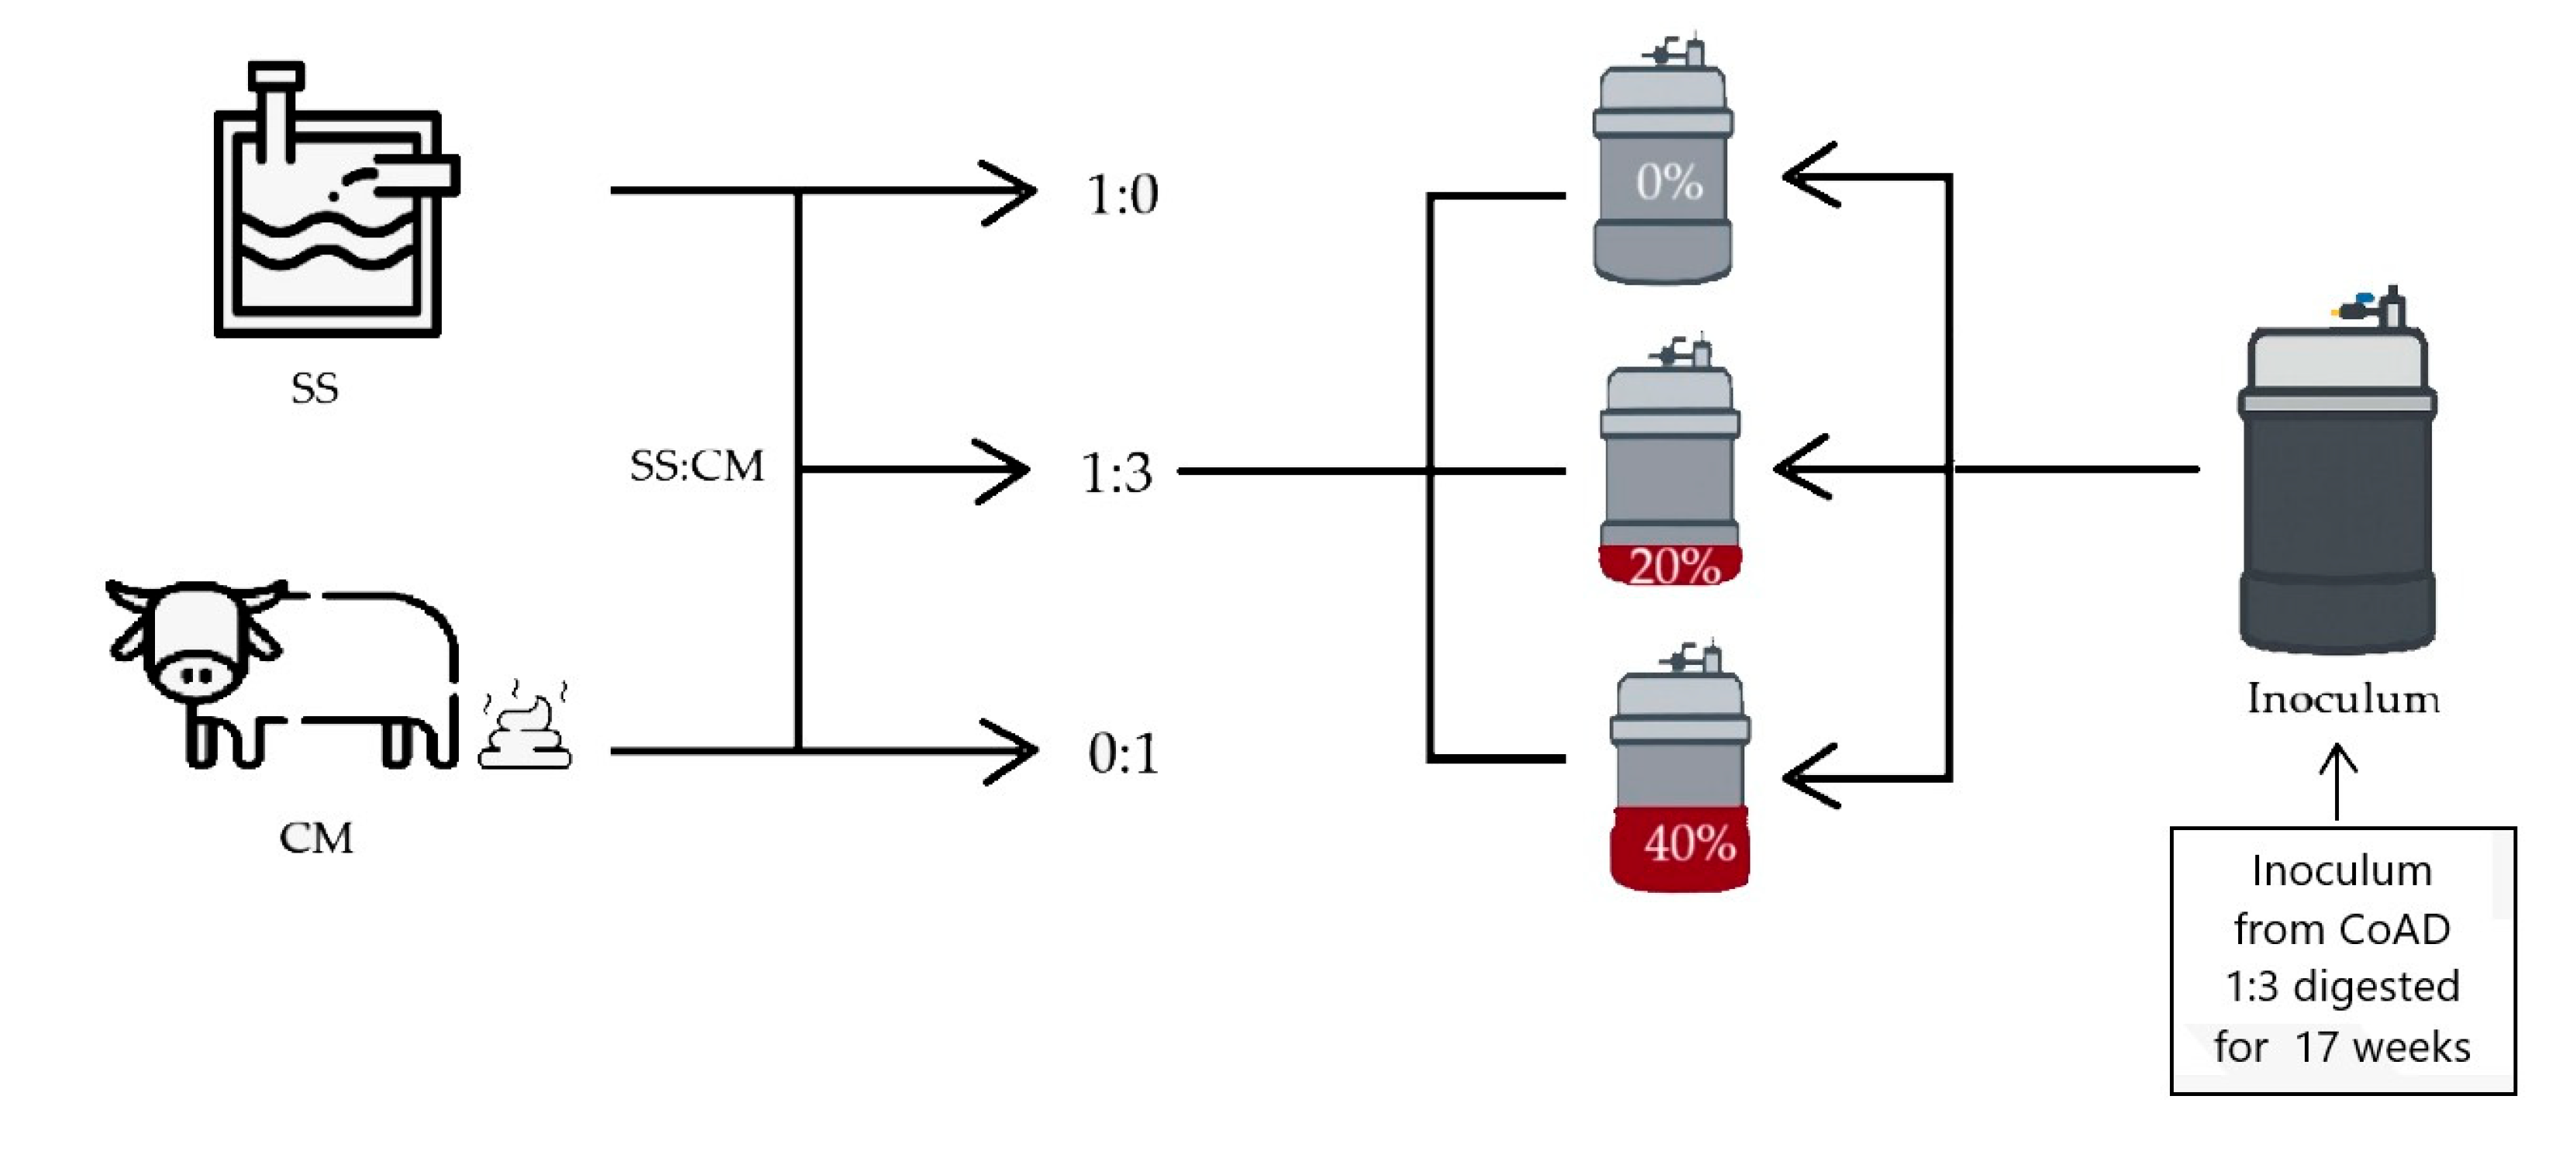
2.1. Experimental Site and Raw Materials

This study was conducted at the Rural Energy Efficiency Laboratory, linked to the Multi-User Research Laboratory of the Renewable and Alternative Rural Energy Group (LabGERAR), located at the Institute of Technology/Department of Engineering of the Federal Rural University of Rio de Janeiro (UFRRJ), Seropedica campus, Rio de Janeiro, Brazil.
The substrates (S) used for MoAD, CoAD, and inoculum consisted of cattle manure and sewage sludge. The CM was collected from the dairy cattle sector at UFRRJ, where animals are raised under conventional management and fed with a diet composed of Tanzania grass (Panicum maximum), corn, soybean meal, and wheat bran. The CM was collected using a masonry trowel, carefully avoiding the inclusion of foreign materials such as soil, grass, and stones.
The SS was sourced from the Palatinato Sewage Treatment Plant (STP), operated by Águas do Imperador (Grupo Águas do Brasil), also located in the state of Rio de Janeiro. The SS was previously thickened in a sludge thickening tank.
Both raw materials were collected and stored in plastic containers for transport to LabGERAR, where they were homogenized to obtain a representative sample. It is important to note that the materials were not subjected to any type of prior treatment.

2.2. Anaerobic Biodigester Configuration

The anaerobic biodigester used in the experiment was based on the Indian model, consisting of a water-seal containment chamber, digestion chamber, gasometer, and U-tube manometer with water as the manometric liquid. The anaerobic biodigesters were placed on a workbench at ambient temperature, protected from direct sunlight and rainfall. The digestion chamber was used to hold the substrate, while the gasometer stored the biogas produced [14,15,16].
Each anaerobic biodigester operated in batch mode and was loaded with 1.7 kg of substrate. The substrates consisted of SS:CM ratios of 0:1 and 1:0 for MoAD, and 1:3, with inoculum addition at 0, 20, and 40% of total volume, for CoAD. The inoculum percentages adopted were based on studies conducted by Paes et al. [15,16].
The inoculum used in the CoAD experiments was obtained from a prior 17-week AD of the 1:3 SS:CM (Figure 1) under mesophilic conditions (23.4 °C). The choice of inoculum was based on its higher biogas production potential, as reported by Paes et al. [16].

2.3. Analysis of Physicochemical Characteristics

The physicochemical characterization of the S and digestate (D) included total solids (TS), volatile total solids (VTS), pH, total alkalinity (TA), volatile fatty acids (VFA), chemical oxygen demand (COD), and nitrate nitrogen (N-NO3), in accordance with Brazilian CONAMA Resolution 375/06 [18].
TS, VTS, pH, TA, and VFA were determined following the standard procedures of the American Public Health Association (APHA) standard procedures [19]. COD and N-NO3 were analyzed using a DR3900 spectrophotometer (Hach, Loveland, CO, USA) with Alfakit® test kits. All analyses were performed in triplicate.
The digestion temperature was monitored using a digital K-type thermocouple (TM902C, Shenzhen Hongxin Hardware Co., Ltd., Shenzhen, China) with ±0.1 °C accuracy. The probe was inserted into the gasometer with the sensor tip immersed in the substrate at the midpoint of the digestion chamber.

2.4. Biogas Analysis

The biogas volume was estimated as the product of the vertical displacement of the gasometer and its cross-sectional area during 12 weeks of anaerobic digestion. Displacement was visually measured using a graduated scale fixed to the gasometer. Corrections to standard temperature (20 °C) and pressure (1 atm or 101.32 kPa) were applied based on Paes et al. [14,15,16], assuming ideal gas behavior.
Biogas yield was calculated based on the weekly production and the amount of substrate added to the anaerobic biodigesters (1.7 kg). Cumulative biogas production potential was obtained by summing the previous week’s production with that of the current week’s data collection. The values were expressed in liters of gas per kilogram of substrate (L kg−1) [14,15,16].

2.4.1. Flame Test

The presence of CH4 was confirmed through a flame test conducted during the gasometer discharge. A torch was connected to the biogas outlet using a flexible hose and lit. A self-sustained flame after removal of the external heat source was used as an indicator of sufficient CH4 to support combustion [14]. The moment at which a substance begins to burn rapidly and in a self-sustained manner is referred to as the onset of combustion (OC).

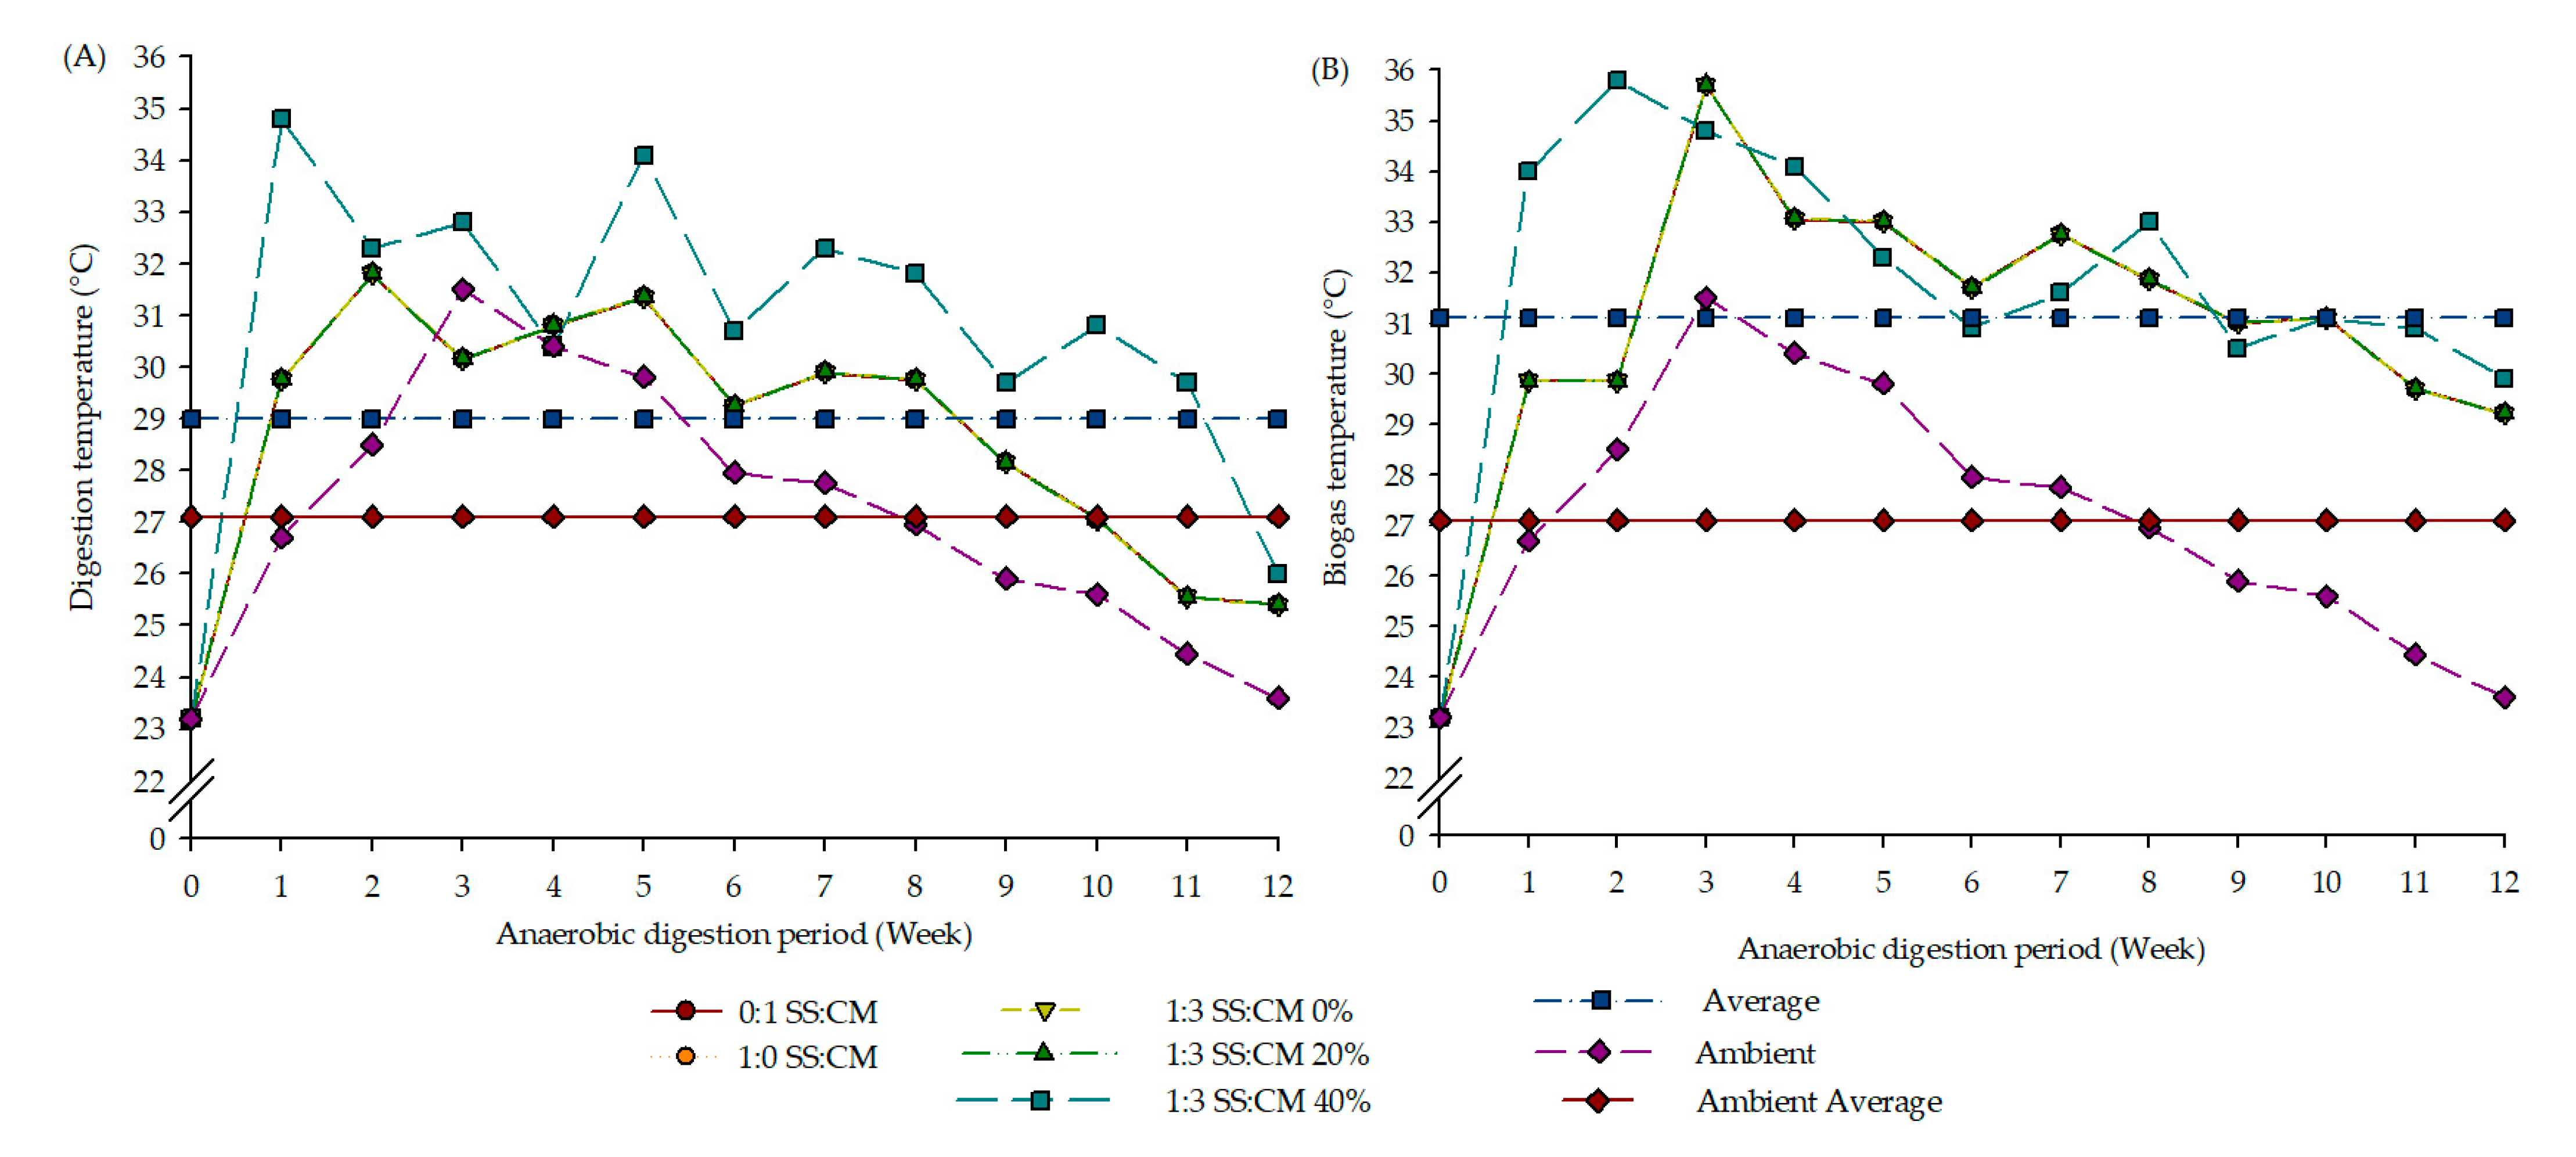
2.4.2. Biogas Temperature

Biogas temperature was measured using a Benetech GM1365 Humidity and Temperature Data Logger (Benetech, Guangzhou, China). For this purpose, a 30 mL biogas sample was collected using a syringe and transferred into an insulated glass chamber containing the data logger.

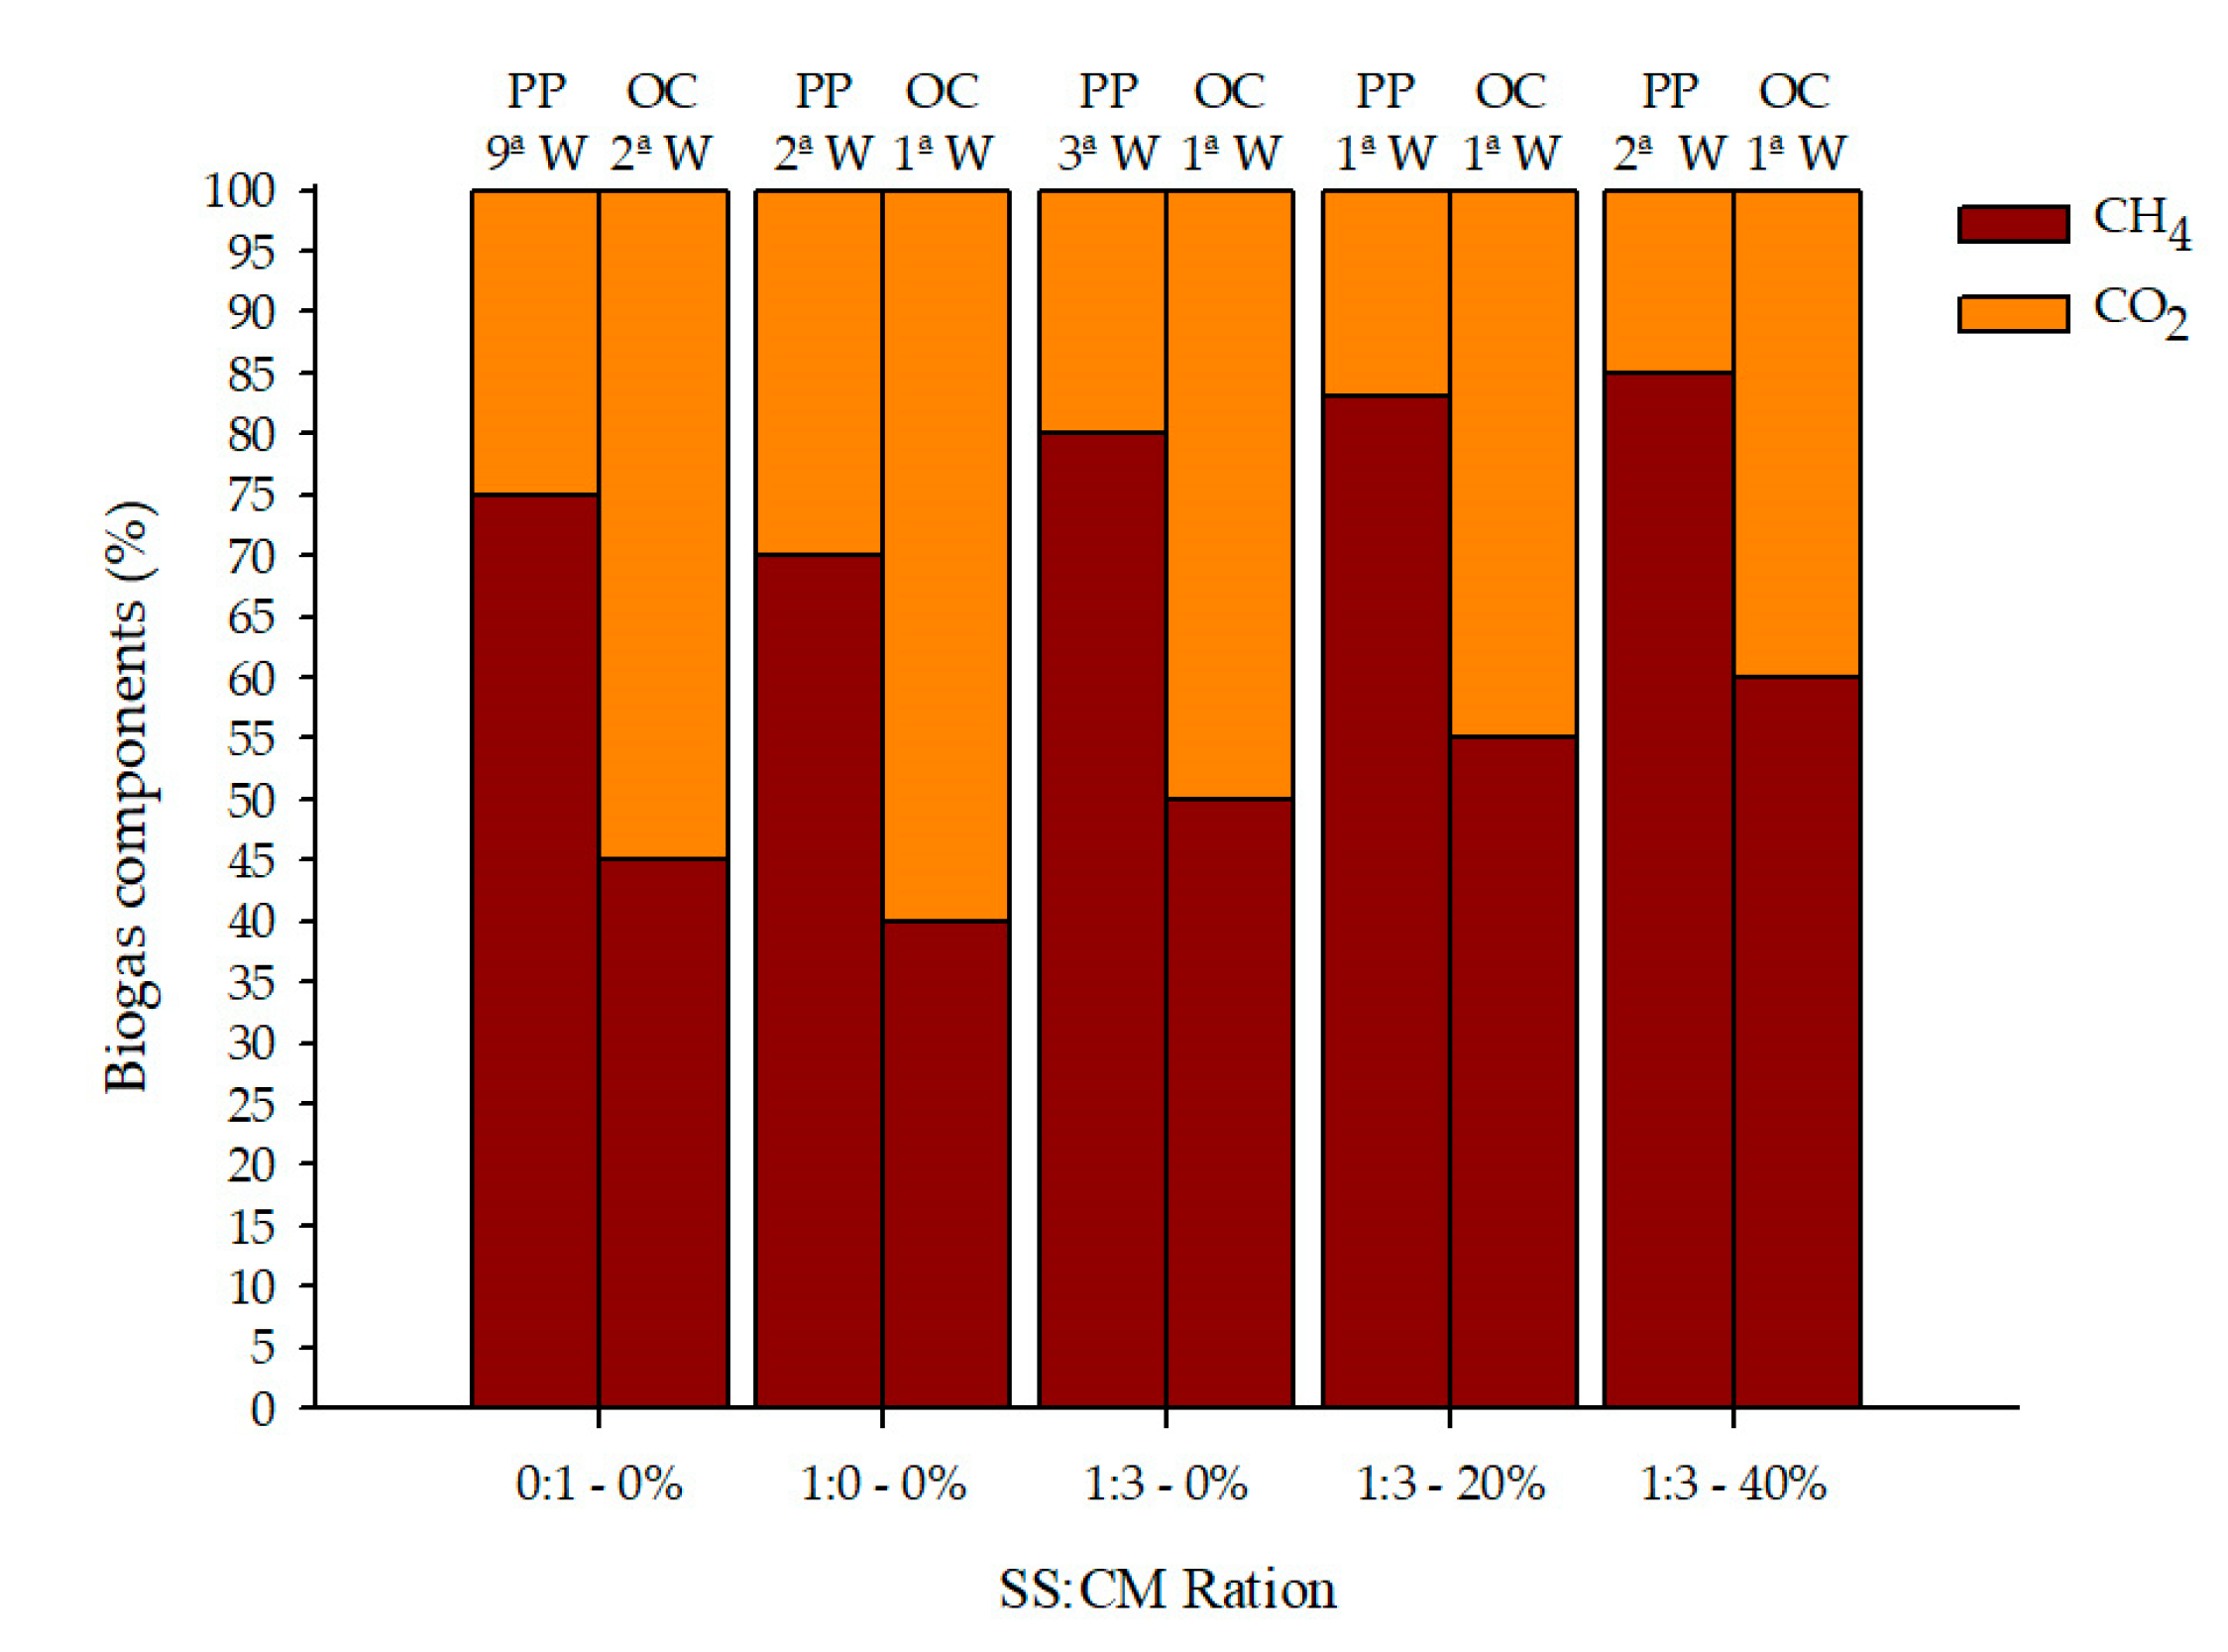
2.4.3. Biogas Composition

Biogas composition was determined using the Alfakit® Biogas Analysis Kit (Alfakit, Santa Catarina, Brazil), measuring CH4 (%) and carbon dioxide (CO2, %) by Orsat’s volumetric method, ammonia (NH3-ppmv) by the indophenol blue colorimetric method, and hydrogen sulfide (H2S-ppmv) by the methylene blue colorimetric method. This method was developed by the Brazilian Agricultural Research Corporation (Embrapa, Brasília, Brazil) Swine and Poultry, in partnership with the company Alfakit® LTDA [20].

2.4.4. Kinetics Modeling

Biogas yield data from MoAD and CoAD were fitted to three nonlinear regression models—Boltzmann Sigmoidal, Gompertz, and Logistic models (Table 1)—using the SigmaPlot v16 Trial Version (Grafiti LLC, Palo Alto, CA, USA).

2.5. Statistical Analysis

A completely randomized design (CRD) was adopted in a 5 × 2 factorial scheme, with five treatment ratios (0:1 and 1:0 SS:BM for MoAD and 1:3 SS:CM with 0, 20, and 40% inoculum for CoAD) and two analysis times (S and D). Each treatment was conducted in triplicate.
The physicochemical data were subjected to analysis of variance (ANOVA), as well as Tukey’s test at a 5% probability level using SISVAR® Statistical Software Version 5.8 Build 92 [21].
Temperature profiles (substrate and biogas) and biogas yield curves were generated using SigmaPlot v16 Trial Version (Grafiti LLC, Palo Alto, CA, USA) [22].
To select the most appropriate model to represent the cumulative biogas production potential as a function of AD period, the following statistical criteria were considered: adjusted coefficient of determination (R2), mean relative error (P), standard error of the estimate (SE), and root mean square deviation (RMSD) [8,9].
SigmaPlot v16 Trial Version was used to compute the adjusted coefficient of determination (R2), while the mean relative error (P), standard error of the estimate (SE), and root mean square deviation (RMSD) were calculated using Equations (4), (5), and (6), respectively.
P = 100 n Y Ŷ Y
S E = Y Ŷ 2 G L R
R M S D = Y Ŷ 2 n
where Y is th observed value, Ŷ is the predicted value, n is the number of observations, and GLR is the degrees of freedom of the residuals (n—number of model parameters).

3. Results and Discussion

3.1. Biomass Characterization

A significant variation was observed in the parameters of TS and VTS between the substrate and the digestate. TS and VTS decreased throughout the AD process (Table 2). The reduction in these parameters is a strong indicator of organic matter conversion into biogas. CoAD showed greater reductions in TS and VTS compared to MoAD, with the highest organic matter removal rates observed at 40% inoculum (Table 2).
When evaluating the effect among the different substrate ratios, CoAD and the inoculum addition did not significantly affect these parameters, regardless of the inoculum percentage. However, a statistically significant difference was found between MoAD and CoAD systems (Table 2). This outcome was anticipated, as SS typically has high moisture content, contributing to lower TS and VTS values, whereas CM exhibits opposite characteristics. Nonetheless, the combination of both substrates results in a more balanced feedstock with ideal characteristics for biogas production [8]. The observed values may be attributed to a higher amount of digestible organic matter, potentially enhancing biogas yield.
The efficiency of the AD process was confirmed by the removal of COD and N-NO3 throughout the digestion period (Table 3). Similar to the trends observed for TS and VTS (Table 2), the use of inoculum promoted the reduction of both COD and N-NO3. The reductions were more pronounced in treatments with higher inoculum percentages, indicating greater substrate biodegradability and availability of organic matter for microbial conversion. Moreover, inoculum addition introduces acclimated microbial communities, enhancing hydrolysis and acidogenesis rates—factors that are positively correlated with increased biogas and CH4 production [8,9].
The substrate without inoculum showed the lowest COD removal, suggesting that native microbial populations alone were insufficient to ensure effective organic matter degradation. However, higher microbial adaptation was observed in the treatments with 20% and 40% inoculum, with 20% resulting in the highest COD reduction. Paes et al. [15] reported similar findings, where COD was reduced by 48% in treatments with 20% inoculum, compared to only 20% in the absence of inoculum during AD of cattle manure.
Nitrogen, an essential nutrient for microbial metabolism, also showed a consistent decline. The highest N-NO3 concentration in the substrate was recorded for the MoAD with SS treatment (30.0 mg L−1), while the lowest was observed in the CoAD treatment with 20% inoculum (5.8 mg L−1). In the digestate, N-NO3 values ranged from 2.7 mg L−1 (MoAD with CM) to 0.9 mg L−1 (CoAD without inoculum). All treatments demonstrated a high nitrate removal efficiency (Table 3).
Previous studies using AD systems treating sewage sludge reported COD and nitrogen reductions ranging from 45% to 80% [23], confirming that the results presented herein are consistent with the current literature on AD performance.
As presented in Table 4, pH b variation exhibited distinct patterns across treatments during the AD process. In MoAD, pH decline was observed in the cattle manure (CM) treatment, whereas an increase was recorded for SS. In CoAD without inoculum, a pH reduction was also observed, likely influenced by the higher proportion of CM in the substrate. In contrast, pH remained stable throughout the digestion process when inoculum was applied. The observed pH reduction may reflect the system’s natural buffering as it attempts to reach neutrality, creating favorable conditions for microbial survival and activity [8,24].
The CoAD with inoculum showed lower pH values compared to MoAD with CM and CoAD without inoculum, achieving values closer to the optimal range for biogas production, which remained near neutrality (Table 4). Despite minor fluctuations, all treatments maintained pH within the optimal range for CH4 production (6.5–8.0) [12].
Overall, TA increased, while VFA decreased throughout AD, with the exception of MoAD with CM (Table 4). This behavior supports the stability of the digestion process [25]. This is further confirmed by the reduction in the VFA/TA ratio. However, the ratio ranged from 0.69 to 4.08, indicating potential instability in certain treatments. Ratios between 0.1 and 0.5 are considered optimal for stable AD; values above this range may suggest system overload or process imbalance [24].
Regarding the inoculum effect, no statistically significant differences were found in the substrate for TA, VFA, or the VFA/TA ratio. The pH and TA values were consistent with those reported in previous studies [26]. However, in the digestate, CoAD without inoculum showed statistically significant differences for all the parameters analyzed (Table 4).

3.2. Digestion, Biogas, and Ambient Environment Temperature Profile
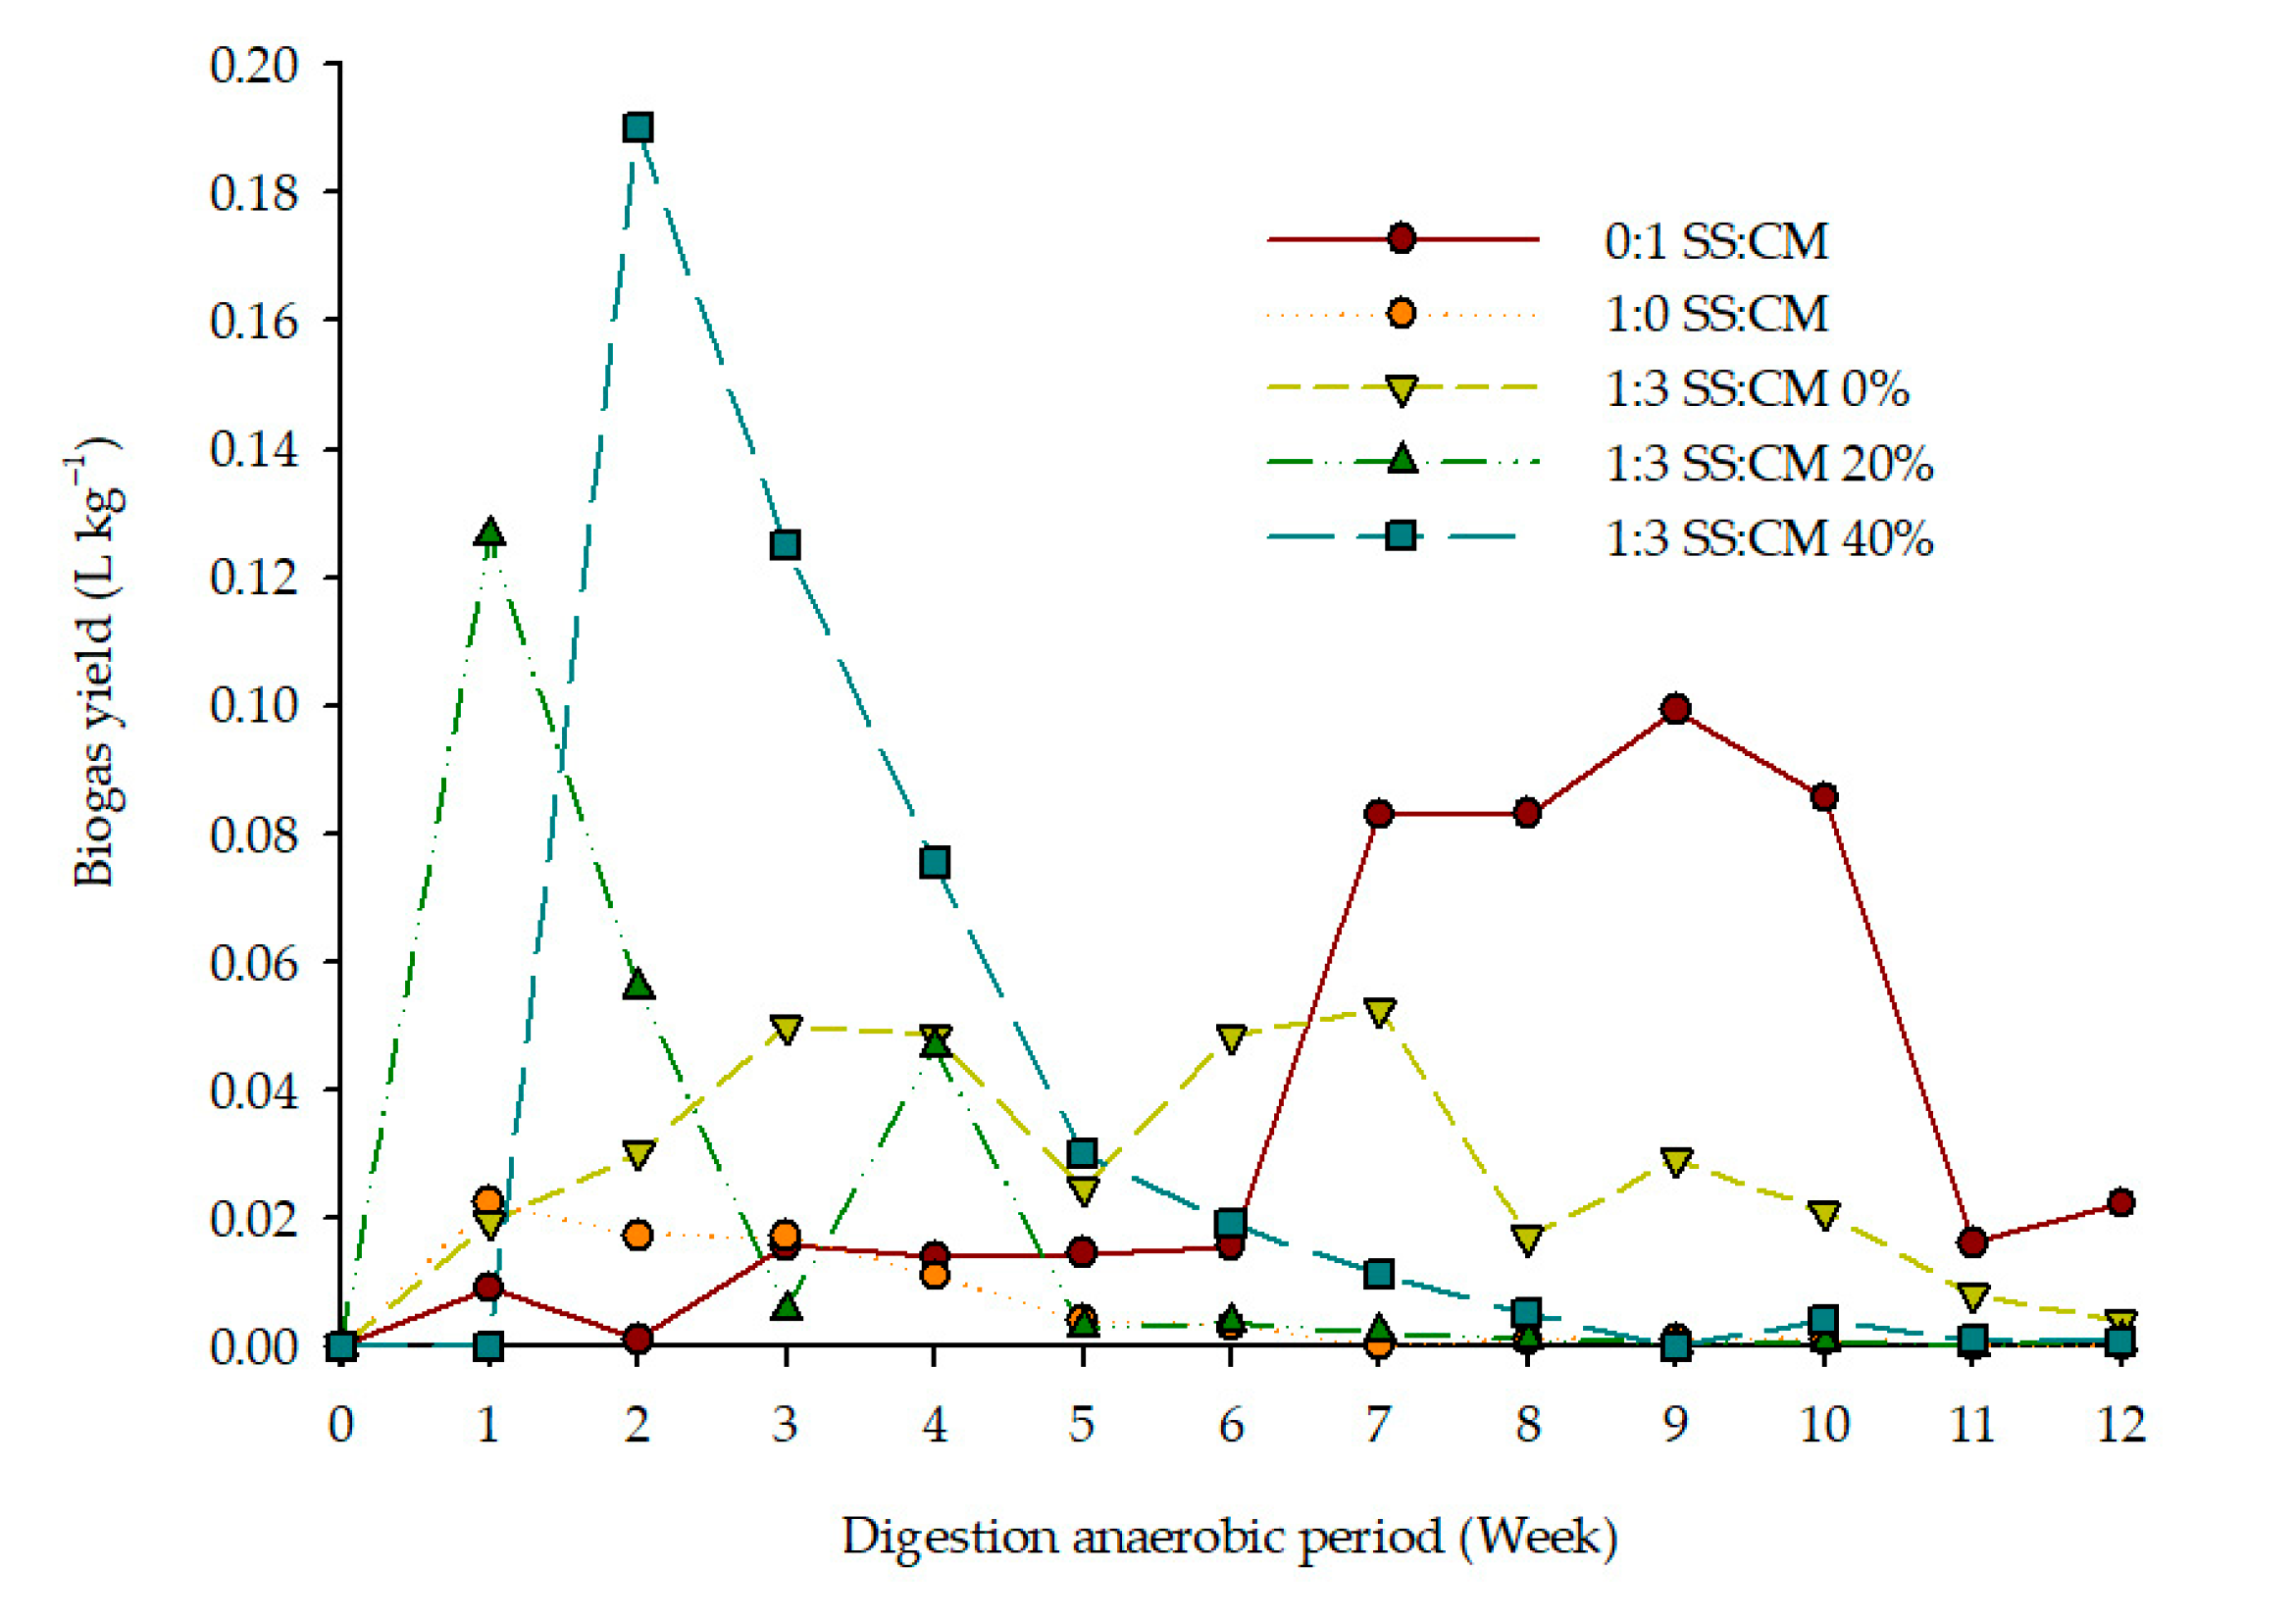
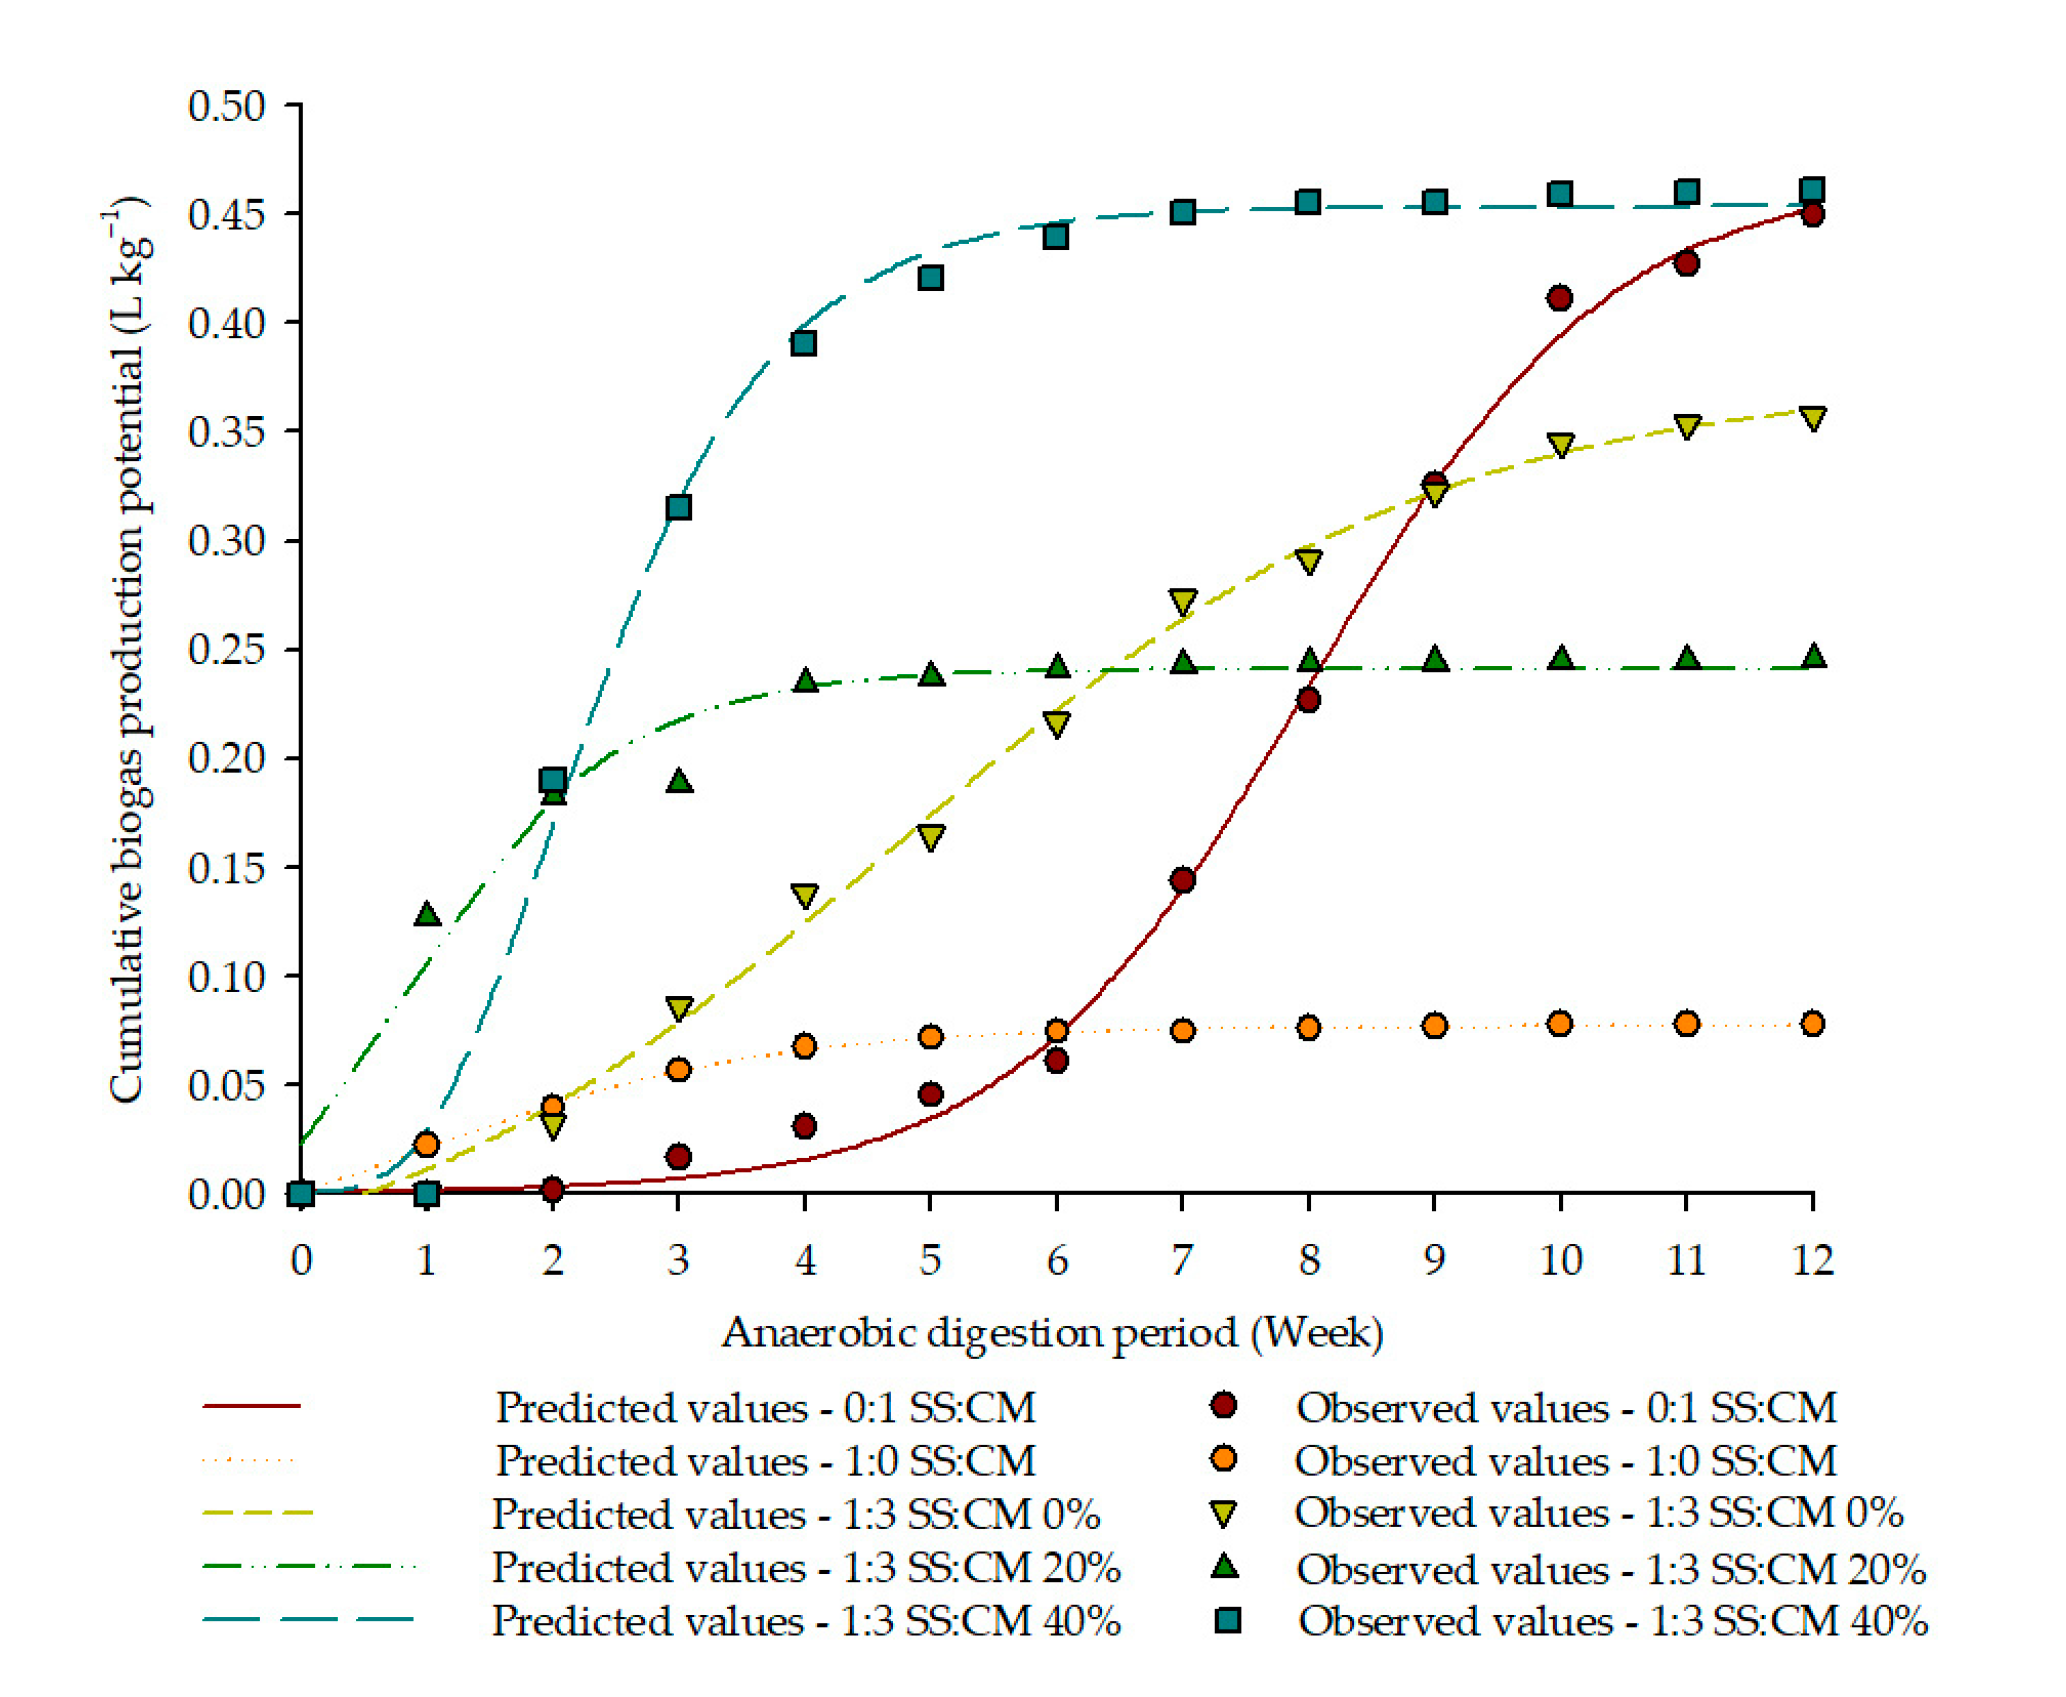
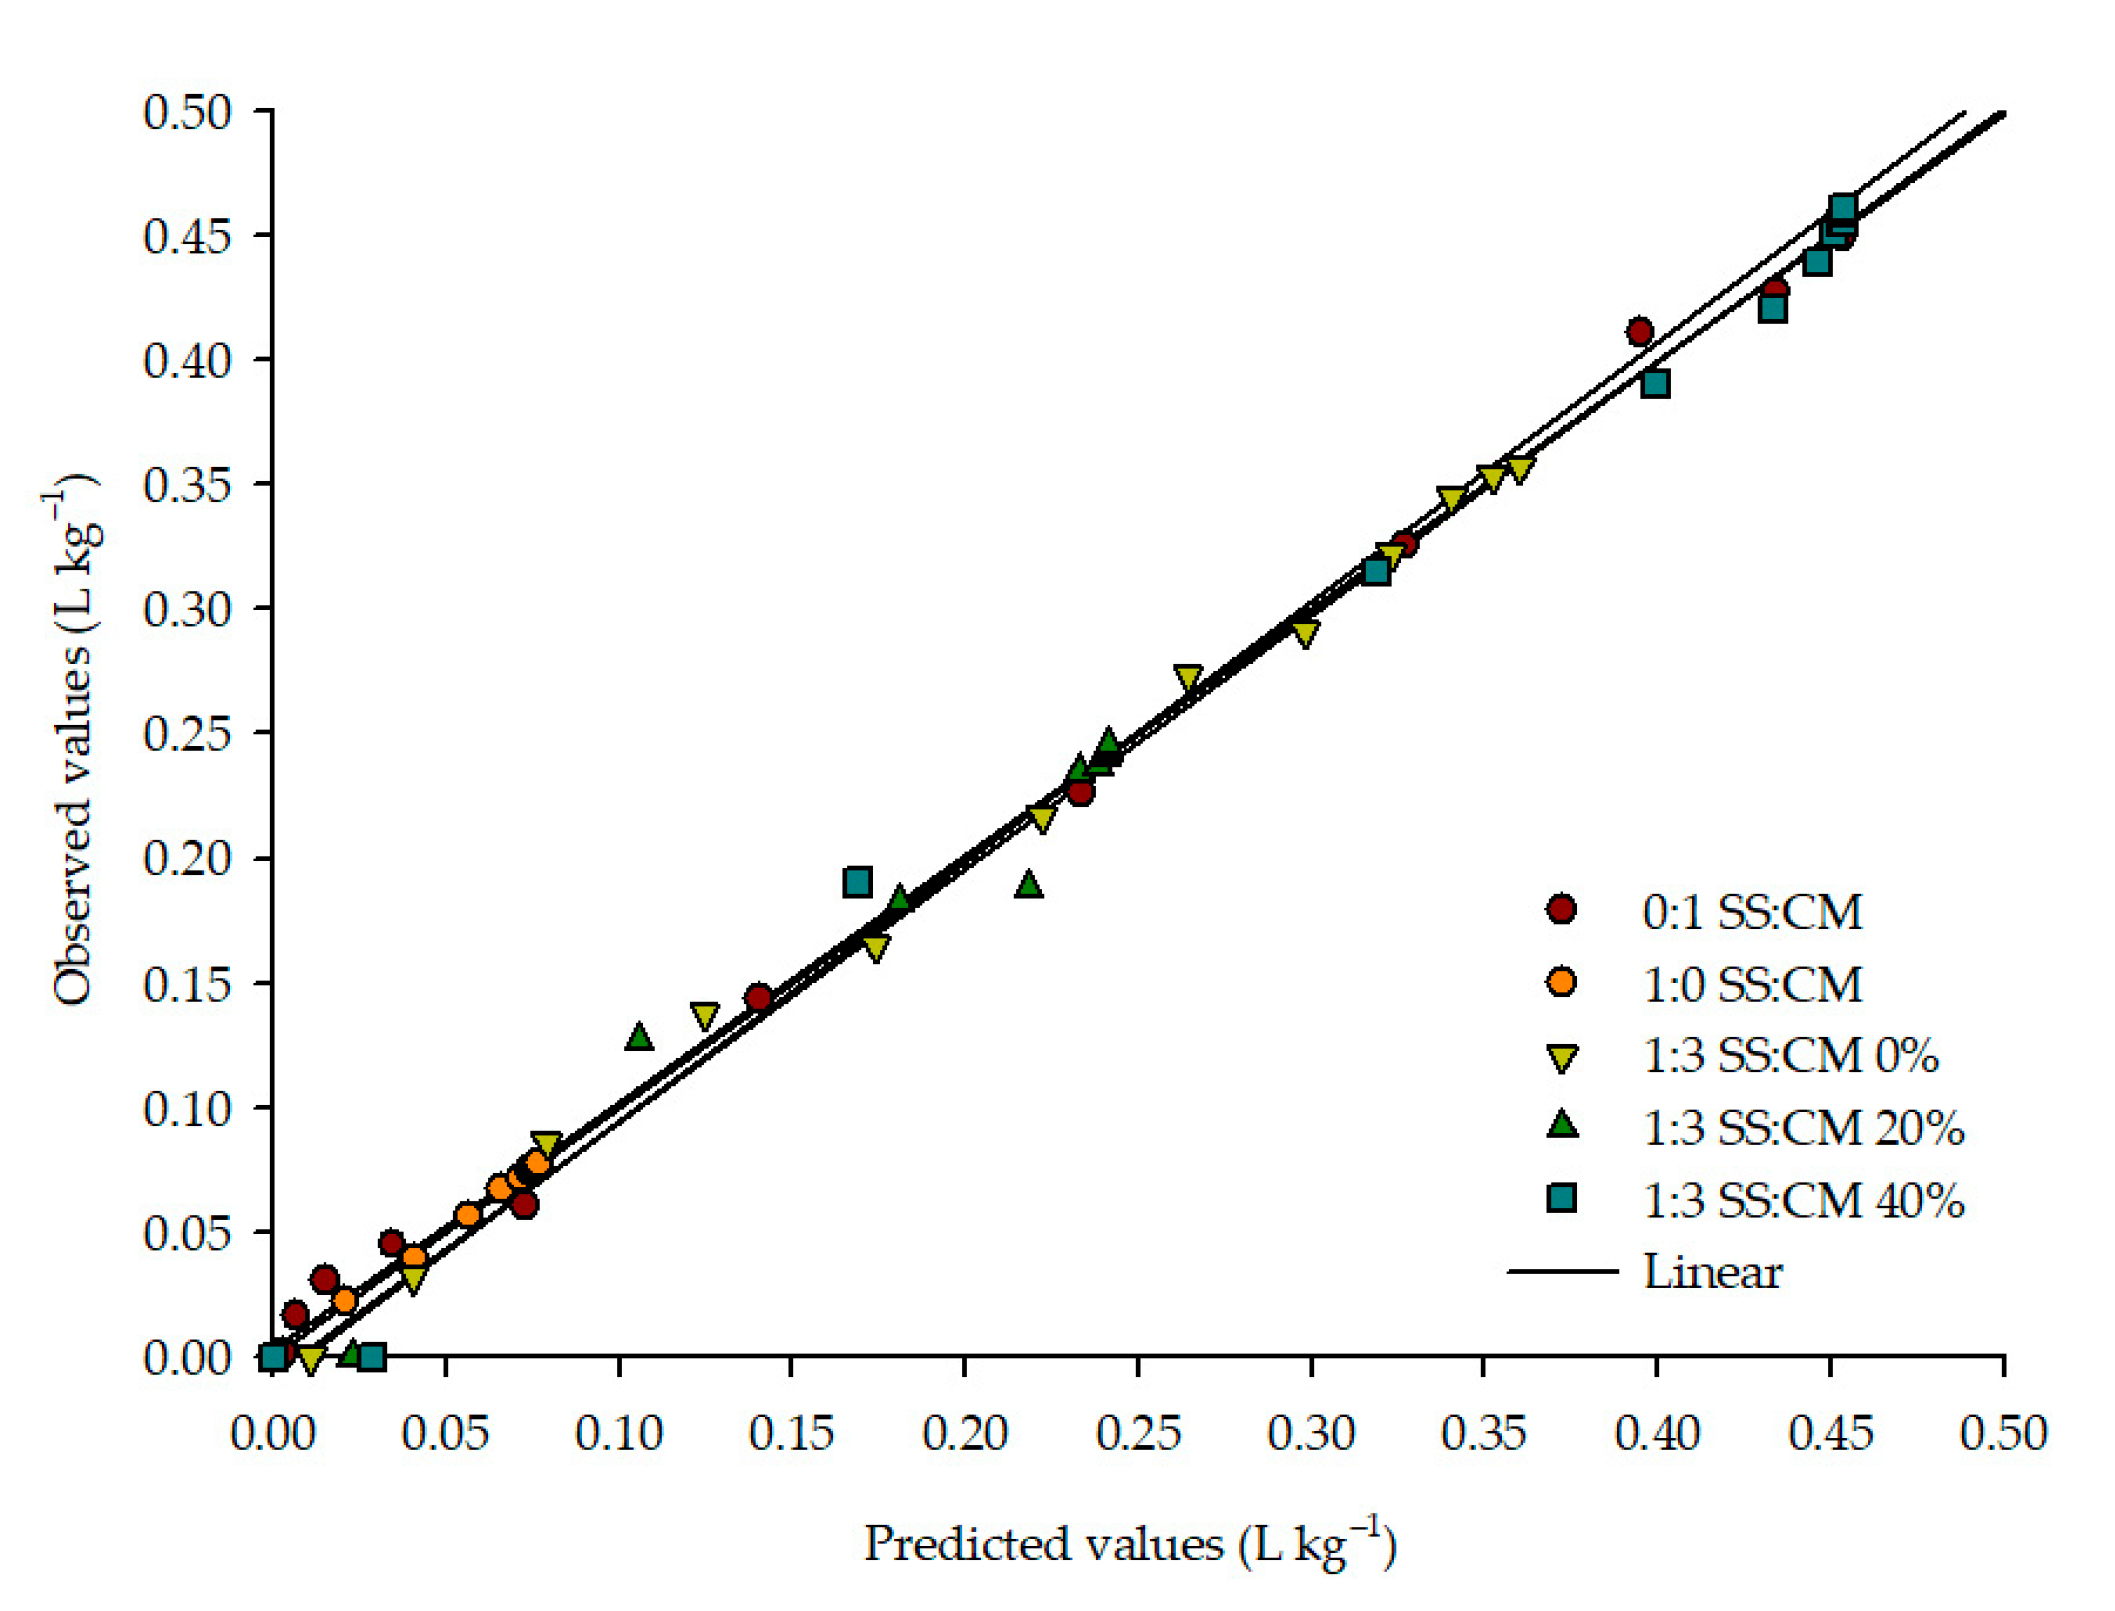
Digestion temperature directly influences the microbial community involved in AD and, consequently, biogas production. Mesophilic bacteria, which dominate the process, are most active within the 30–40 °C temperature range [27]. Therefore, higher substrate temperatures tend to promote microbial activity and enhance biogas yields [3].
The initial stage of AD is characterized by the lag phase, during which the microbial community adapts to anaerobic conditions and the substrate environment. After the first week, temperature fluctuations were minimal (1–3 °C), decreasing only towards the end of the process. These conditions align with practical mesophilic digestion scenarios and do not compromise the relevance of the findings (Figure 2). It is important to emphasize that for the 0:1 and 1:0 SS:CM ratios, as well as for the 1:3 SS:CM ratio with 0% and 20% inoculum, the digestion (Figure 2A) and biogas (Figure 2B) temperatures showed no significant variation among them throughout the anaerobic digestion process.
The digestion temperature in the 1:3 SS:CM ratio with 40% inoculum was higher than that of the other treatments and the ambient temperature. For the remaining treatments, substrate temperature remained relatively stable throughout the process and consistently higher than the ambient level. The average digestion temperature during digestion was 29 °C, while the average ambient temperature was 27 °C (Figure 2A).
Similar trends were observed for biogas temperature, with average values higher than ambient (31 °C vs. 27 °C). Except for the 1:3 SS:CM ratio with 40% inoculum, which exhibited the highest temperatures, there were no significant differences among the other treatments throughout the digestion period (Figure 2B).
This temperature difference between the internal environment of the digester and ambient conditions was also reported by Nindhia et al. [12], who emphasized the positive impact of elevated internal temperatures on biogas production. However, they caution that temperatures exceeding 38 °C can eliminate up to 99.9% of pathogens, which should be considered depending on the intended use of the digestate.
This experiment was conducted under naturally occurring mesophilic conditions, with temperatures maintained between 30 and 35 °C throughout most of the process. These conditions reflect the operational reality of decentralized energy generation systems, in which maintaining a fixed temperature in low-cost contexts may be economically unfeasible. Several studies have confirmed that efficient biogas production can be achieved within this temperature range [28,29].

3.3. Biogas Yield

Biogas production peaks were observed in the third, first, and second weeks for 0, 20, and 40% inoculum additions, respectively, with the highest values recorded for 40%, followed by 20% inoculum. For MoAD, only CM showed a biogas production peak in the ninth week, while SS peaked in the first week, with values 48 and 88% lower, respectively, than CoAD with 40% inoculum (Figure 3).
The OC was observed in the first week for CoAD treatments with 0, 20, and 40% inoculum, with corresponding CH4 concentrations of 50, 55, and 60%, respectively. In contrast, for MoAD treatments, biogas combustion began in the second week, with CH4 contents of 45% CM and 40% for SS, as shown in Figure 4.
At the first production peak, the highest CH4 concentration was obtained for CoAD with 40% inoculum (85%), followed by 20% and 0%. MoAD using sewage sludge and CoAD without inoculum presented CH4 peaks of 75% and 70%, respectively. As expected, CO2 concentrations decreased proportionally with increasing CH4 content, confirming the efficiency of the microbial consortia involved in the methanogenesis phase (Figure 4).
These results demonstrate the synergistic effect of co-digestion and inoculum addition on biogas quality, particularly regarding CH4 enrichment. The CH4 concentration levels achieved in this study are considered suitable for energy recovery and combustion applications, aligning with values reported by Nindhia et al. [12]. However, CH4 concentration alone should not be used as the sole indicator for determining the most efficient treatment conditions.
The average values obtained from the characterization of the substrate and digestate (Table 2, Table 3 and Table 4), combined with weekly biogas potential (Figure 3) and CH4 yield (Figure 4), suggest that co-digestion promoted a synergistic interaction between the substrates and the inoculum, enhancing microbial activity and, consequently, the AD process. In addition, Figure 2 clearly shows that methane production peaked during the periods when the temperature was highest, despite minor fluctuations. These results reinforce the importance of co-digestion and inoculum addition as effective strategies for optimizing AD.
The outcomes of this study regarding TS, VTS, and COD removal, as well as CH4 content in the biogas, were superior to those reported in AD systems using sewage sludge with iron nanoparticles, which aimed to boost biogas production and reduce the lag phase. In that study, the maximum reduction achieved was 37% for TS, 50% for VTS, and 33% for COD, with CH4 concentrations ranging from 50% to 65% over 40 days of digestion [9].
H2S is a corrosive gas capable of damaging metallic components, necessitating mitigation strategies to prevent sensor and equipment degradation. Likewise, NH3, especially in aqueous environments, is corrosive and poses risks to health and the environment [30].
In this study, H2S concentrations remained stable at 20 ppmV throughout the entire digestion process, regardless of treatment condition. This concentration is within acceptable limits for biogas utilization in energy systems, eliminating the need for desulfurization.
NH3 concentrations, however, varied across treatments. The highest NH3 levels (525 ppmV) were recorded in CoAD systems with 0 and 40% inoculum, both peaking in the 12th week. In MoAD with CM, the maximum NH3 concentration was 350 ppmV, also peaking in the 12th week. Conversely, MoAD with SS and CoAD with 20% inoculum showed lower NH3 values (175 ppmV), with peaks occurring in the first week.
These NH3 and H2S concentrations are within acceptable thresholds for biogas utilization as an energy source [31,32], indicating that the biogas produced under the studied conditions is suitable for combustion and other energy applications requiring extensive post-treatment.
The mathematical models applied to the experimental data on cumulative biogas production potential yielded high adjusted coefficients of determination (R2), ranging from 98.77% to 99.83%—with the exception of the 1:3 SS:CM ratio with 20% inoculum, which presented an R2 of 93.69%. Although this value is lower than those observed in the other treatments, it is still considered acceptable due to the low mean relative error (p = 1.04%), standard error of the estimate (SE = 0.02013), and root mean square deviation (RMSD = 0.01643), as previously discussed by [33].
Using the Boltzmann Sigmoidal, Gompertz, and Logistic models, the R2 values obtained were consistent with ranges reported by the literature [34,35], confirming the reliability of the fitted models (Table 5).
Although a high R2 is an important indication of a model’s goodness of fit, it should not be the only parameter considered. Associating R2 with additional statistical metrics such as P, SE, and RMSD increases the robustness and confidence in model selection [8,28]. Most P values obtained were below 10% across all models, indicating strong model performance in explaining data variability and statistical significance, except for the Boltzmann and Gompertz models applied to the MoAD of CM.
Moreover, SE and RMSD values were consistently below 0.03 across all treatments, indicating that the predicted values closely approximated the regression line, thereby enhancing the models’ precision and predictive accuracy.
Therefore, the Boltzmann Sigmoidal model was found to be the most suitable for representing AD under the 1:0 SS:CM and 1:3 SS:CM ratios without inoculum, while the Gompertz model best described the CoAD with inoculum. However, the Boltzmann model was inadequate for the 1:3 SS:CM ratio with 20% inoculum due to convergence issues, likely stemming from its limitations in handling certain data distributions. For the MoAD of CM, only the Logistic model proved adequate, with all parameters falling within the acceptable range, as previously discussed.
Table 6 presents the maximum cumulative biogas production potential (Ymax), the maximum biogas production rate, and the lag phase, as estimated by the selected kinetic models outlined in Table 5.
The results highlight the influence of substrate composition, including the presence of inoculum, on the AD process and subsequent biogas production. CM, due to its high organic matter content, exhibited the highest Ymax among all treatments. In contrast, SS, characterized by a more balanced ratio between organic load and microbial population, led to a higher μmax and shorter λ, as shown in Table 6.
The μmax value—representing the acceleration rate of biogas production kinetics—was highest in the 1:3 SS:CM ratio without inoculum, as estimated by the Boltzmann Sigmoidal model, although this condition also presented the longest lag phase (λ = 4.7371 weeks). When evaluating the effect of inoculum in CoAD systems, it was observed that maintaining 40% inoculum in the 1:3 SS:CM ratio resulted in higher Ymax but lower μmax. Regarding λ, this treatment showed an intermediate adaptation period compared to CoAD systems with and without inoculum. These outcomes may be attributed to the adaptation requirements of methanogenic bacteria and the need to metabolize a greater proportion of available organic matter, as suggested by [8].
In the CoAD treatments, the highest cumulative biogas production potential was observed for the 1:3 SS:CM ratio with 40% inoculum. Under this condition, both biogas and CH4 production began in the first week (Figure 4), with process stabilization reached by the seventh week (Figure 5). When 20% inoculum was applied, biogas production also started in the first week, but stabilization occurred earlier—by the fifth week. Although the onset of biogas production was earlier for the 20% inoculum treatment compared to the 40% (Table 6), it resulted in a lower cumulative production potential and an earlier plateau (Figure 5).
In MoAD scenarios, SS exhibited immediate biogas production; however, it had a lower biogas yield compared to CoAD treatments and CM, reaching stability by the fifth week. For CM, the production dynamics were similar to the 1:3 SS:CM 0% CoAD ratio, with biogas generation starting from the second week and continuing without stabilization throughout the 12-week period. However, CM alone achieved a higher cumulative production potential than the 0% and 20% inoculum CoAD treatments, starting from the eighth and ninth weeks, respectively.
The cumulative biogas production potential results (Figure 4) are consistent with the weekly production trends observed (Figure 5). The varying responses observed under different AD conditions may be attributed to insufficient initial microbial activity and the presence of a microbial adaptation phase. Once this adaptation period was completed, a rapid increase in methanogen populations likely occurred, driving accelerated biogas production in the early stages of the process.
The microbial behavior throughout the anaerobic digestion process was closely associated with temperature trends, as illustrated in Figure 2. Each substrate ratio exhibited distinct dynamics, with the highest biogas production peaks occurring during periods of elevated temperature. The process began with lower initial temperatures and showed a decline toward the end of the 12-week period, which contributed to the overall average reduction. Notably, the substrate combination that yielded the highest cumulative biogas production potential (1:3 SS:CM with 40% inoculum) maintained a temperature range between 30 and 35 °C, which falls within the optimal mesophilic zone. Therefore, the temperature data support the trends observed in weekly and cumulative biogas production potential and CH4 and CO2 (Figure 3, Figure 4 and Figure 5), underscoring the relevance of thermal stability in enhancing AD performance.
A satisfactory fit of the Gompertz model was observed in describing the cumulative biogas production potential as a function of the AD period, as the observed values are close to the predicted ones (Figure 6). The same was reported by Sumardiono et al. [36], who noted that the cumulative experimental and estimated biogas production values were closely aligned, thereby confirming the predictive accuracy of the referred model.

4. Conclusions

In this study, optimization was defined as the enhancement of process performance through improved physicochemical conditions of the substrate and accelerated microbial adaptation, both promoted by the application of inoculum. This was evidenced by increased CH4 yield, reduced lag phases, and enhanced operational stability. These findings offer a valuable contribution to the development and refinement of AD technologies under economically viable and scalable conditions.
The physicochemical characterization of the substrates and digestates revealed consistent improvements across all evaluated ratios, highlighting the significant energy potential of SS and CM for AD. Notably, 20 and 40% inoculum additions led to shorter start-up periods, with the 1:3 SS:CM ratio combined with 40% inoculum yielding the highest cumulative biogas and CH4 production, as well as improved process stability.
The kinetic behavior of biogas production was accurately described using nonlinear regression models, with model suitability varying as a function of substrate composition and inoculum percentage. The logistic model best fitted the mono-digestion of SS (0:1 SS:CM), the Boltzmann Sigmoidal model was most appropriate for the mono-digestion of CM and co-digestion with 0% inoculum, and the Gompertz model demonstrated superior fit for co-digestion with 20% and 40% inoculum—confirming its relevance under enhanced microbial activity conditions.
Although thermal stabilization at 36–37 °C is standard in industrial AD systems, the present study was conducted under naturally mesophilic conditions (30–35 °C), which proved sufficient to maintain microbial performance. Given the economic limitations of thermal control in decentralized or small-scale applications, this approach reflects realistic operational conditions without compromising scientific rigor.
Overall, maintaining 40% inoculum in the digester at the end of each cycle and refeeding with a new 1:3 SS:CM mixture significantly improved process kinetics, reduced the lag phase (1.9866 weeks), and maximized biogas production (µmax = 1.0263 L (kg Week)−1, Ymax = 0.4538 L·kg−1). These results reinforce the critical role of inoculum in optimizing AD by enhancing substrate quality and microbial dynamics, thereby contributing to the development of more efficient, robust, and scalable biogas systems.

Author Contributions

Conceptualization, J.L.P., R.C.V., and D.C.; Data curation, J.L.P., C.C.P., and A.d.S.G.; Formal analysis, J.L.P., C.C.P., A.d.S.G., and I.F.O.; Funding acquisition, J.L.P.; Investigation, J.L.P., C.C.P., A.d.S.G., and R.C.V.; Methodology, J.L.P., I.F.O., and A.d.S.G.; Project administration, J.L.P.; Resources, J.L.P.; Supervision, J.L.P. and D.C.; Writing—original draft, J.L.P., C.C.P., and A.d.S.G.; Writing—review and editing, J.L.P., R.C.V., D.C., and V.R.d.S.S. All authors have read and agreed to the published version of the manuscript.

Funding

This research was funded by the Association for the Management of Water Resources of the Paraíba do Sul River Basin (AGEVAP), grant number 03.033.001.2020, and the Federal Rural University of Rio de Janeiro (UFRRJ) and the National Council for Scientific and Technological Development (CNPq)—grant number 03/2023, providing support through the granting of a scientific initiation scholarship.

Institutional Review Board Statement

Not applicable.

Informed Consent Statement

Not applicable.

Data Availability Statement

The data supporting the findings of this study are contained within the article.

Acknowledgments

To the Palatinato Sewage Treatment Plant, operated by Águas do Imperador (Grupo Águas do Brasil), for providing the sewage sludge.

Conflicts of Interest

The authors declare no conflicts of interest.

Abbreviations

The following abbreviations are used in this manuscript:
ADAnaerobic digestion
ANOVAAnalysis of variance
APHAAmerican Public Health Association
CH4Methane
CMCattle manure
CO2Carbon dioxide
CoADAnaerobic mono-digestion
CODChemical oxygen demand
CONAMANational Environmental Council
DDigestate
GHGGreenhouse gas
H2SHydrogen sulfide
LLiters
L kg−1Liters per kilogram
LabGERARLaboratory of the Renewable and Alternative Rural Energy Group
MoADAnaerobic mono-digestion
NH3Ammonia
N-NO3Total nitrogen–nitrate
OCOnset of combustion
PMean relative error
PPPeak production
R2Adjusted coefficient of determination
RMSDRoot mean square deviation
SSubstrate
SDGsSustainable Development Goals
SEStandard error of the estimate
SSSewage sludge
STPSewage treatment plant
TATotal alkalinity
TSTotal solids
UFRRJFederal Rural University of Rio de Janeiro
VFAVolatile fatty acids
VTSVolatile total solids

References

  1. Silveira, A.R.R.; Nadaleti, W.C.; Przybyla, G.; Filho, P.B. Potential Use of Methane and Syngas from Residues Generated in Rice Industries of Pelotas, Rio Grande Do Sul: Thermal and Electrical Energy. Renew. Energy 2019, 134, 1003–1016. [Google Scholar] [CrossRef]
  2. Caetano, B.C.; Santos, N.D.S.A.; Hanriot, V.M.; Sandoval, O.R.; Huebner, R. Energy Conversion of Biogas from Livestock Manure to Electricity Energy Using a Stirling Engine. Energy Convers. Manag. X 2022, 15, 100224. [Google Scholar] [CrossRef]
  3. Liu, Y.; Fang, J.; Tong, X.; Huan, C.; Ji, G.; Zeng, Y.; Xu, L.; Yan, Z. Change to Biogas Production in Solid-State Anaerobic Digestion Using Rice Straw as Substrates at Different Temperatures. Bioresour. Technol. 2019, 293, 122066. [Google Scholar] [CrossRef]
  4. Wang, T.; Xing, Z.; Zeng, L.; Peng, C.; Shi, H.; Cheng, J.J.; Zhang, Q. Anaerobic Codigestion of Excess Sludge with Chicken Manure with a Focus on Methane Yield and Digestate Dewaterability. Bioresour. Technol. Rep. 2022, 19, 101127. [Google Scholar] [CrossRef]
  5. Luo, L.; Pradhan, N. Anaerobic Mono-Digestion and Co-Digestion of Food Waste and Mixed Sewage Sludge: A Comparative Analysis of Metabolic Patterns and Taxonomic Profiles. Chem. Eng. J. 2024, 489, 151397. [Google Scholar] [CrossRef]
  6. Yu, P.; Wu, M.; Bao, W.; Wang, H. Performance of a Mixed Inoculum of Sludge and Pit Mud for Short and Medium-Chain Fatty Acids Production: Insight into Key Microbiome and Functional Potential in Anaerobic Fermentation Inoculum. Chem. Eng. J. 2023, 466, 143142. [Google Scholar] [CrossRef]
  7. Niya, B.; Yaakoubi, K.; Azaroual, S.; Beraich, F.; Arouch, M.; Meftah Kadmiri, I. Anaerobic Digestion of Agricultural Waste Using Microbial Inocula: Performance and Characterization of Bacterial Communities Using 16S rRNA Sequencing Approach. Energies 2023, 16, 3300. [Google Scholar] [CrossRef]
  8. Quelal, O.M.; Pilamunga Hurtado, D. Anaerobic Fermentation of Slaughterhouse Waste—Codigestion with Wheat Straw to Determine Methane Biochemical Potential and Kinetic Analysis. Fermentation 2023, 9, 726. [Google Scholar] [CrossRef]
  9. Usevičiūtė, L.; Januševičius, T.; Danila, V.; Mažeikienė, A.; Zagorskis, A.; Pranskevičius, M.; Marčiulaitienė, E. Performance and Kinetics of Anaerobic Digestion of Sewage Sludge Amended with Zero-Valent Iron Nanoparticles, Analyzed Using Sigmoidal Models. Energies 2025, 18, 1425. [Google Scholar] [CrossRef]
  10. Silva, A.; Barros, R.; Lora, E.; Santos, I.; Ribeiro, E.; de Freitas, J.V.; Crispim, A. Study on Preliminary Economic Availability of Electric Energy Use from Drying Bed Sludge by Biogas from Anaerobic Digestion and Incineration in Brazil. Clean. Waste Syst. 2023, 6, 100117. [Google Scholar] [CrossRef]
  11. Kumari, M.; Chandel, M.K. Anaerobic Co-Digestion of Sewage Sludge and Organic Fraction of Municipal Solid Waste: Focus on Mix Ratio Optimization and Synergistic Effects. J. Environ. Manag. 2023, 345, 118821. [Google Scholar] [CrossRef]
  12. Nindhia, T.S.; Bidura, I.G.N.G.; Sampurna, I.P.; Nindhia, T.G.T. Utilization of Continuous Anaerobic Digesters for Processing Cattle Dung and Cabbage (Brassica Oleracea) Waste. Fermentation 2025, 11, 50. [Google Scholar] [CrossRef]
  13. Giwa, A.S.; Maurice, N.J.; Zelong, W.; Claire, M.J.; Vakili, M.; Mabi, A.; Liu, B.; Lv, F.; Memon, A.G. Advancing Resource Recovery from Sewage Sludge with IoT-Based Bioleaching and Anaerobic Digestion Techniques. J. Environ. Chem. Eng. 2025, 13, 116293. [Google Scholar] [CrossRef]
  14. Paes, J.L.; Guimarães, C.G.; Gomes, A.D.S.; Valadão, R.C.; Cecchin, D.; Menino, R. Circularity Between Aquaponics and Anaerobic Digestion for Energy Generation. AgriEngineering 2025, 7, 129. [Google Scholar] [CrossRef]
  15. Paes, J.L.; Alves, T.B.S.; Silva, L.D.B.D.; Marques, A.D.S.; Dias, V.R.S. Use of inoculum in biodigesters with cattle manure under conventional and organic production systems. Eng. Agríc. 2020, 40, 146–153. [Google Scholar] [CrossRef]
  16. Vargas, B.C.; Paes, J.L.; Antunes, B.M.S.; Cunha, J.P.B.; Dos Santos, P.T.; Bergossi, A.S. Thermal energy from biogas generated from cattle manure and sewage sludge. Theor. Appl. Eng. 2020, 4, 1–8. [Google Scholar] [CrossRef]
  17. Freepik Company S.L.—Flaticon. Available online: https://www.flaticon.com (accessed on 24 January 2025).
  18. BRASIL. Ministério do Meio Ambiente. Conselho Nacional do Meio Ambiente. Resolução CONAMA nº 375. Define critérios e procedimentos para o uso agrícola de lodos de esgoto gerados em estações de tratamento de esgoto sanitário e seus produtos derivados. Diário Oficial da República Federativa do Brasil: Brasília, DF, ano 2006, n. 167, p. 141–146, 30 ago. 2006. Available online: https://conama.mma.gov.br/index.php?option=com_sisconama&task=documento.download&id=22347 (accessed on 24 January 2025).
  19. American Public Health Association (APHA); American Water Works Association (AWWA); Water Environment Federation (WEF). Standard Methods for the Examination of Water and Wastewater, 24th ed.; APHA Press: Washington, DC, USA, 2023. [Google Scholar]
  20. AlfaKit LTDA. Available online: https://alfakit.com.br/ (accessed on 4 May 2025).
  21. Ferreira, D.F. SISVAR: A computer analysis system to fixed effects split plot type designs. Rev. Bras. Biom. 2019, 37, 529–535. Available online: https://doi.org/10.28951/rbb.v37i4.450 (accessed on 24 January 2025). [CrossRef]
  22. Grafiti LLC. Available online: https://grafiti.com/sigmaplot-v16/ (accessed on 4 May 2025).
  23. Mofatto, P.M.B.; Cosenza, A.; Trapani, D.; Mannina, G. Investigation of intermittent aeration and oxic settling anaerobic process combination for nitrogen removal and sewage sludge reduction. Chemosphere 2024, 363, 142877. [Google Scholar] [CrossRef]
  24. Bacca, L.A.M.; Teleken, J.G.; Oliveira, E.C.L. Co-digestão anaeróbia de substratos suínos e bovinos em diferentes condições operacionais. In Open Science Research VIII; Científica Digital, E., Ed.; Editora Científica Digital, 2022; pp. 1096–1109. Available online: https://www.editoracientifica.com.br/books/chapter/221111099 (accessed on 23 June 2025).
  25. Beschkov, V.N.; Angelov, I.K. Volatile Fatty Acid Production vs. Methane and Hydrogen in Anaerobic Digestion. Fermentation 2025, 11, 172. [Google Scholar] [CrossRef]
  26. Gandhi, B.P.; Lag-Brotons, A.J.; Ezemonye, L.I.; Semple, K.T.; Martin, A.D. Development of Mass-Conserving Atomistic Mathematical Model for Batch Anaerobic Digestion: Framework and Limitations. Fermentation 2024, 10, 299. [Google Scholar] [CrossRef]
  27. Shi, X.; Guo, X.; Zuo, J.; Wang, Y.; Zhang, M. A comparative study of thermophilic and mesophilic anaerobic co-digestion of food waste and wheat straw: Process stability and microbial community structure shifts. Waste Manag. 2018, 75, 261–269. [Google Scholar] [CrossRef] [PubMed]
  28. Sayoud, S.; Derbal, K.; Panico, A.; Pontoni, L.; Fabbricino, M.; Pirozzi, F.; Benalia, A. The Effect of Hydrogen Peroxide on Biogas and Methane Produced from Batch Mesophilic Anaerobic Digestion of Spent Coffee Grounds. Fermentation 2025, 11, 60. [Google Scholar] [CrossRef]
  29. Castillo García, P.; Fernández-Rodríguez, M.J.; Borja, R.; Mancilla-Leytón, J.M.; de la Lama-Calvente, D. Research Trends in the Recovery of By-Products from Organic Waste Treated by Anaerobic Digestion: A 30-Year Bibliometric Analysis. Fermentation 2024, 10, 446. [Google Scholar] [CrossRef]
  30. Yuliarti, R.; Khambali, K.; Rusmiati, R. Risk analysis of exposure to NH3 And H2S gas to workers in the small industrial environment of magetan regency in 2021. Int. J. Adv. Health Sci. Technol. 2022, 2, 169–174. [Google Scholar] [CrossRef]
  31. Pereira, L.C.; Balbino, M.V.; Viana, L.S.; Farias, N.D.S.N.; XAVIER, M.; Ramos, W.Q.; Antonio, J.O.S.É. Estudo comparativo de biógas produzido com dois tipos de resíduos animais. Rev. Bras. De Energ. Renov. 2018, 7, 406–422. [Google Scholar]
  32. Almeida, A.P.M.D.; Guimarães, M.D.O. A utilização de biogás como estratégia sustentável para a produção de energia: Um estudo bibliográfico. Rease 2022, 8, 663–673. [Google Scholar] [CrossRef]
  33. Bonatto, I.D.C.; Moreira, A.J.G.; Restrepo, J.J.B.; Franco, D.; Castilhos Junior, A.B.D. Influência de diferentes tipos de nanopartículas de prata na biodegradação da fração orgânica de resíduos sólidos urbanos. Eng. Sanit. Ambient. 2021, 26, 11–19. [Google Scholar] [CrossRef]
  34. Latinwo, G.K.; Agarry, S.E. Modelling the kinetics of biogas production from mesophilic anaerobic co-digestion of cow dung with plantain peels. Int. J. Renew. Energy Dev. 2015, 4, 55–63. [Google Scholar] [CrossRef]
  35. Franqueto, R.; Silva, J.D.; Starick, E.K.; Jacinto, C.F.S. Anaerobic codigestion of bovine manure and banana tree leaf: The effect of temperature variability on biogas yield in different proportions of waste. Journal of Material Cycles and Waste Management. J. Mater. Cycles Waste Manag. 2020, 22, 1444–1458. [Google Scholar] [CrossRef]
  36. Sumardiono, S.; Jos, B.; Dewanti, A.A.E.; Mahendra, I.; Cahyono, H. Biogas production from coffee pulp and chicken feathers using liquid- and solid-state anaerobic digestions. Energies 2021, 14, 4664. [Google Scholar] [CrossRef]
Figure 1. Schematic representation of the substrate preparation for anaerobic digestion (AD), including mono-digestion (MoAD) and co-digestion (CoAD) with and without inoculum addition. MoAD was carried out using raw materials at proportions of 0:1 and 1:0 (sewage sludge–cattle manure), while CoAD was performed using a fixed 1:3 ratio. The inoculum used in CoAD treatments was previously digested for 17 weeks and added at 0%, 20%, and 40% of the total digester volume, with the remaining volume completed with fresh substrate. Image source: [17].
Fermentation 11 00373 g001
Figure 2. Temperature profiles for (A) digestion and (B) biogas for cattle manure (CM), sewage sludge (SS), and their different ratios (0:1 and 1:0 SS:CM) in anaerobic mono-digestion (MoAD) and (1:3 SS:CM) in anaerobic co-digestion (CoAD) with 0, 20, and 40% inoculum.
Fermentation 11 00373 g002
Figure 3. Biogas yield (L kg−1) as a function of anaerobic digestion period (week).
Fermentation 11 00373 g003
Figure 4. Methane (CH4) and carbon dioxide (CO2) concentrations at peak production (PP) and onset of combustion (OC).
Fermentation 11 00373 g004
Figure 5. Kinetics of the cumulative biogas production potential (L kg−1) as a function of the anaerobic digestion period (week) using the Logistic (0:1 SS:CM), Boltzmann Sigmoidal (1:0 SS:CM and 1:3 SS:CM—0%), and Gompertz models (1:3 SS:CM—20% and 1:3 SS:CM—40%).
Fermentation 11 00373 g005
Figure 6. Observed and predicted values (L kg−1) of the cumulative biogas production potential by Logistic (0:1 SS:CM), Boltzmann Sigmoidal (1:0 SS:CM and 1:3 SS:CM—0%), and Gompertz models (1:3 SS:CM—20% and 1:3 SS:CM—40%).
Fermentation 11 00373 g006
Table 1. Nonlinear regression models used to fit biogas yield.
ModelEquation
Boltzmann Sigmoidal Y i = Y 0 + Y m a x Y 0 1 + e λ x µ m a x + u i (1)
Gompertz Y i = Y max × e e µ max × λ x + u i (2)
Logistic Y i = Y max 1 + e µ max × λ x + u i (3)
where Yi is the biogas yield at week x (L kg−1), i is the 1,…., n, x is the anaerobic digestion period (weeks), n is the number of cumulative biogas measurements, Y0 is the initial biogas production (L kg−1), Ymax is the maximum biogas production (L kg−1), µmax is the maximum specific production rate (L kg−1 week−1), λ is the lag phase duration (weeks), e is the 2.71828, and ui is the residuals.
Table 2. Mean values (n = 3) of total solids (TS) and volatile total solids (VTS) in the substrate (S) and digestate (D) for cattle manure (CM) and sewage sludge (SS), and their different ratios (0:1 and 1:0 SS:CM) in anaerobic mono-digestion (MoAD) and (1:3 SS:CM) in anaerobic co-digestion (CoAD) with 0, 20, and 40% inoculum.
RatioTS (%)Removal
Efficiency (%)
VTS (%)Removal
Efficiency (%)
SDSD
0:1 SS:CM13.0 Aa10.6 Ba18.511.0 Aa7.9 Ba28.2
1:0 SS:CM4.6 Ac3.3 Bc28.32.6 Ac2.4 Bd7.7
1:3 SS:CM—0%9.4 Ab6.0 Bb36.27.9 Ab4.8 Bbc39.2
1:3 SS:CM—20%10.7 Ab7.5 Bb29.98.6 Ab5.7 Bb33.7
1:3 SS:CM—40%10.9 Ab6.5 Bb40.47.7 Ab4.3 Bc44.2
Means followed by different uppercase letters in the same row (substrate and digestate) for each variable differ statistically according to the Tukey test at a 5% probability level. Means followed by different lowercase letters in the same column for each variable indicate significant differences between ratios, according to the Tukey test at a 5% probability level.
Table 3. Mean values (n = 3) of chemical oxygen demand (COD), total nitrogen—nitrate (N-NO3), and their removal efficiency (%) for cattle manure (CM), sewage sludge (SS), and their different ratios (0:1 and 1:0 SS:CM) in anaerobic mono-digestion (MoAD) and (1:3 SS:CM) in anaerobic co-digestion (CoAD) with 0, 20, and 40% inoculum.
RatioCOD (mg L−1)Removal
Efficiency (%)
N-NO3 (mg L−1)Removal
Efficiency (%)
SDSD
0:1 SS:CM14,296 Aa13,200 Ba7.717.4 Ab2.7 Ba84.5
1:0 SS:CM7321 Ac3146 Be57.030.0 Aa2.5 Ba91.7
1:3 SS:CM—0%12,746 Ab11,679 Bb8.42.5 Ae0.9 Bb64.0
1:3 SS:CM—20%13,059 Ab8900 Bd31.85.8 Ad1.1 Bb81.0
1:3 SS:CM—40%11,600 Ab9921 Bc14.510.0 Ac1.5 Bab85.0
Means followed by different uppercase letters in the same row (substrate and digestate) for each variable differ statistically according to the Tukey test at a 5% probability level. Means followed by different lowercase letters in the same column for each variable indicate significant differences between ratios, according to the Tukey test at a 5% probability level.
Table 4. Mean values (n = 3) of pH, total alkalinity (TA), volatile acidity (VFA), and AFV/TA ratio for cattle manure (CM), sewage sludge (SS), and their different ratios (0:1 and 1:0 SS:CM) in anaerobic mono-digestion (MoAD) and (1:3 SS:CM) in anaerobic co-digestion (CoAD) with 0, 20, and 40% inoculum.
RatiopHTA (gCaCO3 L−1)VFA (g eq HAc L−1)VFA/TA
SDSDSDSD
0:1 SS:CM8.0 Ab7.6 Bb5.20Aa4.73 Bb4.56 Bc4.88 Aa0.88 Ac1.03 Ba
1:0 SS:CM6.7 Bd8.2 Aa2.00 Bc3.00 Ac8.16 Aa2.08 Bc4.08 Aa0.69 Bb
1:3 SS:CM—0%8.4 Aa7.7 Bb3.33 Bb7.00 Aa5.76 Ab3.52 Bb1.73 Ab0.50 Bc
1:3 SS:CM—20%7.4 Ac7.6 Ab4.00 Bb5.33 Ab5.28 Ab4.96 Ba1.32 Ab0.93 Ba
1:3 SS:CM—40%7.4 Ac7.6 Ab3.00 Bb5.60 Ab5.56 Ab5.24 Ba1.85 Ab0.94 Ba
Means followed by different uppercase letters in the same row (substrate and digestate) for each variable differ statistically according to the Tukey test at a 5% probability level. Means followed by different lowercase letters in the same column for each variable indicate significant differences between ratios, according to the Tukey test at a 5% probability level.
Table 5. Adjusted coefficient of determination (R2), mean relative error (P), standard error of the estimate (SE), and root mean square deviation (RMSD) for adjusting the kinetic models of the cumulative biogas production potential for cattle manure (CM), sewage sludge (SS), and their different ratios (0:1 and 1:0 SS:CM) in anaerobic mono-digestion (MoAD) and (1:3 SS:CM) in anaerobic co-digestion (CoAD) with 0, 20, and 40% inoculum.
RatioModelR2 (%)P (%)SE (Decimal)RMSD (Decimal)
0:1 SS:CMBoltzmann Sigmoidal0.997110.590.010350.00845
Gompertz0.991323.430.018750.01531
Logistic0.99708.740.011000.00898
1:0 SS:CMBoltzmann Sigmoidal0.99830.640.001110.00090
Gompertz0.99520.710.001940.00158
Logistic0.98671.190.003230.00264
1:3 SS:CM—0%Boltzmann Sigmoidal0.99522.850.010050.00820
Gompertz0.99553.400.010220.00834
Logistic0.98972.640.015530.01268
1:3 SS:CM—20%Boltzmann SigmoidalDid not converge---
Gompertz0.96222.100.015550.01270
Logistic0.93691.040.020130.01643
1:3 SS:CM—40%Boltzmann Sigmoidal0.98771.330.020230.01652
Gompertz0.99411.150.014750.01204
Logistic0.98351.800.024670.02015
Table 6. Maximum cumulative biogas production potential (Ymax), maximum biogas production rate (μmax), and lag phase duration (λ) estimated by the selected kinetic models.
RatioModelYmax (L kg−1)µmax (L (kg Week)−1)Λ (Week)
0:1 SS:CMLogistic0.46910.84188.0114
1:0 SS:CMBoltzmann
Sigmoidal
0.07701.36750.8959
1:3 SS:CM—0%Boltzmann
Sigmoidal
0.37382.13434.7371
1:3 SS:CM—20%Gompertz0.24131.05140.8168
1:3 SS:CM—40%Gompertz0.45381.02631.9866
Disclaimer/Publisher’s Note: The statements, opinions and data contained in all publications are solely those of the individual author(s) and contributor(s) and not of MDPI and/or the editor(s). MDPI and/or the editor(s) disclaim responsibility for any injury to people or property resulting from any ideas, methods, instructions or products referred to in the content.

