Article

Exploiting 1,3-Propanediol Production by a Clostridium beijerinckii Strain: The Role of Glycerol and Ammonium Sulfate Concentrations

by
Pedro Felipe Dassie Leonel de Castro
,
Rafael de Moraes Altafini
,
Jonatã Bortolucci
,
Jaques Florêncio
,
Maria Lucia Arruda Moura Campos
and
Valeria Reginatto
*
Department of Chemistry, Faculty of Philosophy, Sciences and Letters of Ribeirão Preto (FFCLRP), University of São Paulo (USP), Ribeirão Preto 14040-901, SP, Brazil
*
Author to whom correspondence should be addressed.
Fermentation 2025, 11(4), 187; https://doi.org/10.3390/fermentation11040187
Submission received: 5 March 2025 / Revised: 22 March 2025 / Accepted: 26 March 2025 / Published: 2 April 2025
(This article belongs to the Special Issue Biorefining for Biofuel Production)

Abstract

In this study, we optimized the initial concentrations of glycerol and (NH4)2SO4 to enhance 1,3-propanediol (1,3-PDO) production by Clostridium beijerinckii strain Br21. A central composite rotational design (CCRD) was employed, varying glycerol concentrations between 158 and 441 mmol L−1, and (NH4)2SO4 concentrations between 4.4 and 25.8 mmol L−1. The CCRD identified optimal conditions at 441.42 mmol L−1 for glycerol and 25.8 mmol L−1 for (NH4)2SO4. The optimized medium resulted in a 112% increase in 1,3-PDO production compared to the original medium. Analysis of NH4+ and SO42− ions under optimal conditions revealed a higher consumption of NH4+ than SO42−. Furthermore, a quantitative gene expression analysis revealed that while the expression of genes responsible for glycerol uptake and ATP sulfurylase remained unchanged, the expression of the dhaM gene, which encodes the oxidative phosphoenolpyruvate:dihydroxyacetone phosphotransferase, increased approximately 6-fold. In the reductive pathway, the expression of the dhaB1 gene, encoding glycerol dehydratase, and the dhaT gene, encoding 1,3-propanediol dehydrogenase, increased 2.5- and 5-fold, respectively. The upregulation of these genes supports the hypothesis that the optimal concentrations of glycerol and (NH4)2SO4 enhance the 1,3-PDO production by C. beijerinckii Br21.

1. Introduction

The growing interest in sustainable and renewable industrial practices through the valorization of residues has made biotechnological processes essential for a more sustainable economy [1]. In the biodiesel industry, global production reaches 55 billion liters annually, generating 5.5 billion liters of glycerol-rich residue as a by-product of the biodiesel transesterification reaction [2,3]. The large supply of glycerol has led to a price reduction from USD 0.62 to USD 0.18 per liter between 2003 and 2022 [4]. Therefore, valorizing this residue is crucial for the sustainability of biodiesel production [5].
Residual glycerol produced by the biodiesel industry has a high concentration of contaminants, making it unsuitable for the food, pharmaceutical, and cosmetic industries, which are the largest consumers of glycerol but require it to be of high purity [6]. Some microorganisms can utilize glycerol as a carbon source and metabolize it into industrially relevant products, such as hydrogen gas, ethanol, butanol, butyric acid, and 1,3-propanediol (1,3-PDO) [7,8,9,10,11]. Among these, 1,3-PDO is the most valuable due to its widespread use as a monomer in the synthesis of polypropylene terephthalate (PPT), a highly demanded polymer [12]. The 1,3-PDO market is promising and is expected to grow from USD 424.5 million to USD 799.3 million between 2024 and 2031 [13].
Some non-pathogenic Clostridium species, such as Clostridium pasteurianum, Clostridium beijerinckii, and Clostridium butyricum, metabolize glycerol to 1,3-PDO [14,15,16]. The biosynthesis of 1,3-PDO by Clostridium follows two metabolic branches, the oxidative branch, which has two possible pathways, and the reductive branch. In one oxidative pathway, glycerol is converted into dihydroxyacetone in a reaction catalyzed by glycerol dehydrogenase (GDH). In the alternative pathway, glycerol is phosphorylated to glycerol-3-phosphate in a reaction catalyzed by glycerol kinase (GK) and subsequently converted into dihydroxyacetone phosphate by glycerol-3-phosphate dehydrogenase (GPDH). In both cases, dihydroxyacetone-phosphate then enters the glycolytic pathway, generating ATP, reducing equivalents (NADH + H⁺), and other fermentation products, such as butyrate, acetate, and ethanol. In the reductive branch, glycerol is dehydrated to 3-hydroxypropionaldehyde (3-HPA) by glycerol dehydratase (GDHt), encoded by the dhaB1 and dhaB2 genes. This step is followed by the reduction of 3-HPA to 1,3-PDO, consuming NADH + H⁺ in a reaction catalyzed by 1,3-propanediol dehydrogenase (PDDH), encoded by the dhaT gene [7,15,17,18,19].
In other words, while the oxidative branch generates reducing equivalents and ATP, the reductive branch requires them to produce 1,3-PDO. However, one of the drawbacks of glycerol metabolism is that the energy yield from glycerol oxidation is lower (1 ATP/mol) compared to glucose (2 ATP/mol). Glycerol is first converted to dihydroxyacetone phosphate, which then enters glycolysis. However, the reduction of 3-HPA to 1,3-PDO consumes reducing equivalents (NADH + H+), thereby limiting ATP production through substrate-level phosphorylation. As a result, Clostridium species exhibit lower growth rates on glycerol than on glucose, affecting the overall biochemical reaction rates [20].
To address this issue, studies have proposed supplementing glycerol with a carbohydrate to promote microbial growth [21]. However, several Clostridium species exhibit catabolic repression, i.e., the presence of a carbohydrate, such as glucose or xylose, inhibits glycerol consumption by the microorganism.
In this study, we investigated the bioconversion of glycerol to 1,3-PDO by Clostridium beijerinckii Br21, a bacterium isolated by our research group. Previous studies with this strain have shown that, in addition to iron, nitrogen sources are the most influential factors in 1,3-PDO production [22]. Moreover, bacteria from the Clostridium genus, including C. beijerinckii, can reduce sulfate ions (SO42−) [23]. Therefore, we proposed supplementing the culture medium with ammonium sulfate (NH4)2SO4 to enhance microbial growth and 1,3-PDO production. To achieve this, we initially performed a full factorial design to evaluate the influence of (NH4)2SO4 supplementation. Subsequently, we optimized glycerol and (NH4)2SO4 concentrations in the culture medium using a 22 central composite rotational design (22 CCRD). Finally, we quantified the expression levels of genes encoding enzymes involved in glycerol and sulfate metabolism. Thus, this study aimed to expand knowledge on the pathways of glycerol metabolism in C. beijerinckii and the impact of sulfate (SO42−) and ammonium (NH4+) on this process.

2. Material and Methods

2.1. Microorganism and Inoculum

A non-solventogenic Clostridium beijerinckii Br21 strain, previously isolated and sequenced (deposit number: MWMH01000003.1) by our laboratory [24], was used. Cultures were thawed, pre-inoculated into Reinforced Clostridial Medium (RCM), and incubated at 33 °C for 24 h under anaerobic conditions, before use in fermentation assays. After this period, a pre-inoculum step was performed to adapt the microorganism to the assay conditions. For this, 5 mL of the Hungate tube culture was added to the assay culture medium and incubated at 33 °C with agitation at 150 rpm for 24 h. After cultivation, the microorganism was used to inoculate the assays.

2.2. Culture Medium

In this study, the WISMod medium [22] was used as the basis for the optimization steps. The medium was composed of 34.14 g of glycerol, 5.0 g of K2HPO4, 1.0 g of yeast extract, 0.055 g of FeSO4·7H2O, and 0.005 g of sodium acetate per liter. For the preparation of this and the optimized media, the salts were added to the medium, followed by pH adjustment to 7.1. Then, 50 mL of the medium was transferred to 100 mL flasks, sparged with N₂ to remove oxygen, sealed, and autoclaved at 121 °C for 20 min.

2.3. Central Composite Rotational Design (CCRD)

A central composite rotational design (CCRD) was employed to optimize 1,3-PDO production, using initial glycerol and (NH4)2SO4 concentrations as variables and final 1,3-PDO concentration as the response. For the optimization steps, culture media were prepared based on the WISMod medium, with modifications to the glycerol concentration according to the CCRD model and the addition of (NH4)2SO4 at the concentrations as described in Section 2.2. The CCRD fermentation assays were performed in triplicate, with samples collected at the beginning (0 h) and end (96 h) of the experiment. The samples were analyzed for optical density at 600 nm (OD), pH, concentrations of glycerol, 1,3-PDO, and butyric acid.

2.4. Comparison of Culture Media in Kinetic Assays

Kinetic assays were performed using both culture media, the WISMod medium (Section 2.2) and the medium under optimized glycerol and (NH4)2SO4 concentrations, according the results of CCRD. The inoculum was made by introducing a volume of the pre-inoculum to give 0.1 of optical density at 600 nm at the beginning of the assays. After the inoculum, the flasks were maintained at 33 °C with agitation at 150 rpm for 192 h.
Samples were collected between 0 and 192 h and analyzed for OD, pH, glycerol, butyric acid, and 1,3-PDO concentrations. Additionally, in the samples from the optimized medium, ammonium (NH4+) and sulfate (SO42−) concentrations were quantified.

2.5. Absolute Gene Expression Level

The absolute gene expression levels of enzymes related to glycerol metabolism and sulfate reduction were quantified. Cell samples were collected from the kinetic assay for both culture media (Section 2.4). For quantification, cell samples were collected 72 h after the start of the fermentation assay and kept on ice. To separate the cells from the fermentation medium and form pellets, the samples were centrifuged at 12,000× g and 4 °C for 20 min. The liquid phase was removed, and the cell pellet was stored in liquid nitrogen. Total RNA was isolated and purified using the PureLinkTM RNA Mini Kit (Invitrogen, Waltham, MA, USA), and its integrity was verified by agarose gel electrophoresis. cDNA synthesis was performed from the extracted RNA using the High Capacity cDNA Reverse Transcription Kit (Applied Biosystems, Waltham, MA, USA). To analyze the glpF (glycerol uptake), dhaM (phosphoenolpyruvate:dihydroxyacetone phosphotransferase subunit M), dhaT (1,3-PDO dehydrogenase), dhaB1 (glycerol dehydratase subunit 1), and cysN (sulfate adenylyltransferase subunit 1 of ATP sulfurylase) genes, TaqMan® probe sequences (Thermo Fisher Scientific, Waltham, MA, USA) were synthesized based on the genes encoding the enzymes, as present in the microorganism’s genome, with sequences reported in Table 1. The RT-qPCR reaction was performed on an Eppendorf Mastercycler® RealPlex 4S thermocycler using a 96-well plate, TaqManTM Universal PCR Master Mix (Applied Biosystems), and the following program: 50 °C for 2 min, 95 °C for 10 min, followed by 40 cycles of 95 °C for 15 s and 60 °C for 1 min.

2.6. Analytical Determination

Glycerol, 1,3-PDO, and butyric acid concentrations were quantified using a gas chromatograph (GC 2014, Shimadzu, Kyoto, Japan) according to a method described in the literature [25]. Nitrogen was used as the carrier gas, and the injector was maintained at 300 °C. A 2 μL sample was injected using a 30:1 split ratio. A Stabilwax-DA column (RESTEK, Bellefonte, PA, USA) was used with a temperature gradient starting at 185 °C for 3 min, followed by heating at 40 °C min−1 to 220 °C, where it was held for 1 min. A flame ionization detector (FID) maintained at 290 °C was used.
For the determination of optical density at 600 nm (OD600), a UV–VIS M51 spectrophotometer (BEL Engineering, Monza, Italy) was used. pH was measured using a pHmeter Edge HI 2002 (Hanna, Smithfield, RI, USA).
Inorganic ions (NH4+ and SO42−) were analyzed using suppressed ion chromatography with conductivity detection (Model 881 Compact IC Pro; Metrohm, São Paulo, Brazil). The anion (SO42−) analysis employed a Metrosep A Supp 5 column (Metrohm) and an eluent composed of sodium carbonate (3.2 mmol L−1) and sodium bicarbonate (1.1 mmol L−1). A solution of sulfuric acid (100 mmol L−1) was used as the regenerant for chemical suppression. The cation (NH4+) analysis was performed using a Metrosep C4 column (150 × 4.0 mm, Metrohm) and an eluent composed of nitric acid (1.7 mmol L−1) and dipicolinic acid (0.7 mmol L−1). Ion chromatography standard solutions were used to construct the analytical curves. The limits of detection (LODs) were estimated visually by decreasing the concentration of each standard until the signal reached a value approximately three times higher than the noise.

2.7. Statistical Validation

For data analysis, an analysis of variance (ANOVA) table was used with a significance level of p < 0.05. The significant and predictive model was then used to determine the optimal conditions that maximize glycerol consumption. To validate the optimal point indicated by the model, an experiment was conducted under the optimal condition, and the result was compared with the predicted result, using a significance level of 95%. To evaluate statistically significant differences between the results, Tukey’s test was applied with a significance level of p < 0.05.

3. Results and Discussions

3.1. Optimization of Glycerol and (NH4)2SO4 Concentrations

The non-solventogenic bacterium Clostridium beijerinckii Br21 has been studied as a producer of 1,3-PDO using glycerol as a substrate [11,22]. However, glycerol metabolism in this microorganism is limited, in part due to the low net yield of ATP during the glycerol metabolic pathways [15,18,19], which restricts cell growth. Therefore, favoring oxidative metabolism could enhance glycerol consumption and 1,3-PDO production.
A central composite rotational design (CCRD) was used to investigate the effects of initial (NH4)2SO4 and glycerol concentrations on the final concentration of 1,3-PDO. The experimental design and results are summarized in Table 2.
The optimization of glycerol and (NH4)2SO4 concentration has several objectives. The first is to favor the dissimilatory metabolism of the sulfate ion (SO42−) by Clostridium, which can lead to ATP synthesis [26]. Additionally, its assimilatory metabolism can lead to the synthesis of essential amino acids, primarily cysteine [27,28], which can also support metabolism. The second objective is to provide an additional nitrogen source through the ammonium ion (NH4+), since the culture medium contains only 1 g L−1 of yeast extract as a nitrogen source, which may limit growth. Finally, the optimization of glycerol concentration aims to achieve an improved glycerol/(NH4)2SO4 ratio, so that their concentrations can maximize product formation.
The results for the CCRD (Table 2) represent the difference between the initial and final fermentation samples (96 h). The final pH in the assays ranged from 5.06 ± 0.10 to 6.03 ± 0.01, largely due to the presence of butyric acid. Butyric acid is the main product formed by the microorganism’s oxidative pathway, and, at the end of the assay, it was present in concentrations ranging from 6.03 ± 0.01 to 20.34 ± 2.56 mmol L−1. The OD600 after 96 h varied between 1.74 ± 0.01 and 2.53 ± 0.11, indicating high cell growth under all conditions. Under the same conditions in the base culture medium, the microorganism grew at 1.61 ± 0.06 [22]. This result demonstrates that the simple addition of (NH4)2SO4 aided the oxidative metabolism of the microorganism.
The consumed glycerol varied significantly, ranging from 51.36 ± 1.87 to 185.62 ± 5.62 mmol L−1 across all assays. It is worth noting the dependence on the initial glycerol concentration. Condition 4 exhibited the highest glycerol consumption, 185.62 ± 5.62 mmol L−1, with a high initial substrate concentration of 400 mmol L−1. In condition 5, with the lowest initial glycerol concentration of 158 mmol L−1, glycerol consumption was 51.36 ± 1.87 mmol L−1. In both conditions (4 and 5), glycerol consumption represented 46 and 32% of the available glycerol, respectively. However, increasing the initial glycerol concentration favors greater absolute consumption. This effect has already been observed in our previous work, where glycerol at 390 mmol L−1 resulted in only 23% of the total available glycerol being consumed [11], confirming the dependence. Thus, increasing glycerol consumption, 1,3-PDO concentration was also increased.
Assays 9 and 10 exhibited equivalent glycerol concentrations to assays 7 and 8, but a reduced ammonium sulfate concentration compared to assay 8. Consequently, assays 9 and 10 demonstrated a lower glycerol consumption rate than assay 8. Conversely, assay 7, which had the same glycerol concentration and a lower ammonium sulfate concentration, resulted in a higher glycerol consumption rate than assays 9 and 10. This trend is corroborated by the response surface depicted in Figure 1, suggesting a potential antagonistic interaction between the variables, wherein a median ammonium sulfate concentration appears to be suboptimal. Such non-linear behavior is frequently observed in biological assays, justifying the selection of a Central Composite Rotatable Design (CCRD) optimization methodology. The CCRD approach minimizes experimental errors and facilitates the determination of an optimal concentration range.
The incomplete glycerol consumption in all conditions can be attributed to two potential factors: the efficiency of glycerol transport into the cell, and the decreasing pH. Glycerol uptake in Clostridium is facilitated by a specific transport protein that requires Mg2+ for optimal activity [29,30]. A previous study has shown that Mg2+ has a positive correlation with the glycerol consumption rate [22]. Another reason for restricting substrate consumption is that butyric acid production lowers the pH, shortening the microorganism’s fermentation time [11].
Furthermore, it is evident that increasing (NH4)2SO4 concentrations led to higher glycerol consumption, as demonstrated by the comparison between conditions 1 and 2. This condition exhibited similar initial glycerol levels but differed in their (NH4)2SO4 concentrations.
Finally, the concentration of 1,3-PDO varied significantly among the different CCRD conditions, ranging from 3.44 to 76.27 mmol L−1. This result highlights the positive impact of (NH4)2SO4 supplementation compared to the 52.7 mmol L−1 of 1,3-PDO achieved in a previous study [22], using the same basal medium.
The ANOVA analysis (Table 3) revealed that the linear and quadratic terms for glycerol, as well as the quadratic terms for (NH4)2SO4, were significant predictors of 1,3-PDO production. The lack-of-fit test indicated that the model adequately fit the data. The resulting predictive model (Equation (1) was used to generate a response surface plot (Figure 1) and determine the optimal conditions for 1,3-PDO production.
Equation (1)—Model obtained from the CCRD for the final 1,3-PDO concentration,
1,3-PDO (mmol L−1) = 39.72 + 15.47 s – 7.20 s2 + 11.12 n2
where s is the glycerol (substrate) concentration (mmol L−1) and n represents the (NH4)2SO4 concentration (mmol L−1).
The optimal conditions for 1,3-PDO production were an initial glycerol concentration of 441.42 mmol L−1 and 25.8 mmol L−1 of (NH4)2SO4. The model predicted a 1,3-PDO concentration of 67.93 mmol L−1 after 96 h, with a 95% confidence interval. Experimental validation under these optimal conditions resulted in 65.97 ± 2.10 mmol L−1 of 1,3-PDO, which falls within the predicted range, confirming the model’s accuracy.

3.2. Comparative Assay to Assess the Impact of Media Optimization on Product Formation, Substrate Consumption, and the Expression of Key Metabolic Enzymes

Kinetic assays were performed using both the original and optimized media to evaluate the effects of (NH4)2SO4 supplementation. Fermentation was monitored over a period of 192 h to examine the long-term impacts. As shown in Figure 2A, the optimized medium initially exhibited a lower cell density compared to the original medium. While the original medium reached an OD600 of 1.8 after 24 h, the optimized medium required 54 h to reach the same OD600. However, after 54 h, the growth rates of both media converged, with the optimized medium surpassing the original and reaching a maximum OD600 of 2.97 at 168 h.
Both assays started at pH 7.2 (Figure 2B). After 24 h, the pH of the original medium dropped to 5.94 due to the accumulation of 1.80 mmol L−1 butyric acid (Figure 2E), while the optimized medium maintained a pH of 7.15. This difference was attributed to the absence of butyric acid in the optimized medium. pH values converged after 96 h. The addition of (NH4)2SO4 likely prevented excessive pH drop. At 48 h, both media had similar butyric acid concentrations (~3.5 mmol L−1), but the optimized medium exhibited a higher pH (6.49 compared to 5.87 for the original medium).
Regarding glycerol consumption (Figure 2C), during the first 24 h of the assay, 42.56 mmol L−1 of glycerol was consumed in the original medium, while no variation in substrate concentration was observed in the optimized medium. The optimized medium resulted in a longer lag phase, lasting at least 24 h, whereas in the original medium, the lag phase was shorter, approximately 8 h as reported previously [22]. However, after 24 h of fermentation, this behavior changed. In the original medium, no significant variation in glycerol concentration was observed, while in the optimized medium, a marked reduction in glycerol concentration occurred, reaching approximately 118.97 mmol L−1 of glycerol—about 2.8 times higher—before stabilizing.
Both media displayed a second glycerol consumption phase, indicative of a second log phase. In the original medium, this phase occurred between 120 and 168 h, consuming an additional 86.64 mmol L−1 (total: 130.29 mmol L−1). The optimized medium exhibited a similar phase between 168 and 192 h, consuming 38.84 mmol L−1 (total: 167.54 mmol L−1), representing a 28% increase in glycerol consumption compared to the original medium.
Regarding 1,3-PDO production (Figure 2D), the original medium produced 23.8 mmol L−1 after 24 h, while the optimized medium showed no concentration, confirming its longer lag phase. However, after 48 h, both media reached similar 1,3-PDO levels (~27 mmol L−1). Subsequently, the optimized medium produced significantly more 1,3-PDO (65.97 mmol L−1) compared to the original medium (34.97 mmol L−1), demonstrating the positive impact of (NH4)2SO4.
Another interesting factor is the increase in 1,3-PDO concentration during prolonged fermentation times in the optimized medium, which reached a concentration of 74.67 mmol L−1 of 1,3-PDO, while the original medium did not show a statistically significant variation in its concentration. This result indicates that the effects of (NH4)2SO4 are prolonged, allowing the microorganism to sustain fermentation for a longer time, leading to a final concentration that is up to 112% higher.
The addition of ammonium sulfate to the optimized medium leads to improved bacterial growth (Figure 2A) and prolongs pH stability (Figure 2B). As a consequence, in the WISmod optimized medium, both 1,3-PDO and butyric acid concentrations are elevated (Figure 2E). It is likely that the elevated glycerol concentration in the WISmod optimized medium delays the onset of 1,3-PDO production (Figure 2D). However, at the optimal concentration, ammonium sulfate supplementation facilitates higher glycerol consumption relative to WISmod (Figure 2C), ultimately resulting in a higher 1,3-PDO concentration.
Notably, butyric acid concentration declined at the end of the kinetic assays (Figure 2E). This suggests its potential utilization by C. beijerinckii as an electron acceptor for sulfate reduction, given the continued decrease in sulfate concentration observed at the assay’s endpoint.

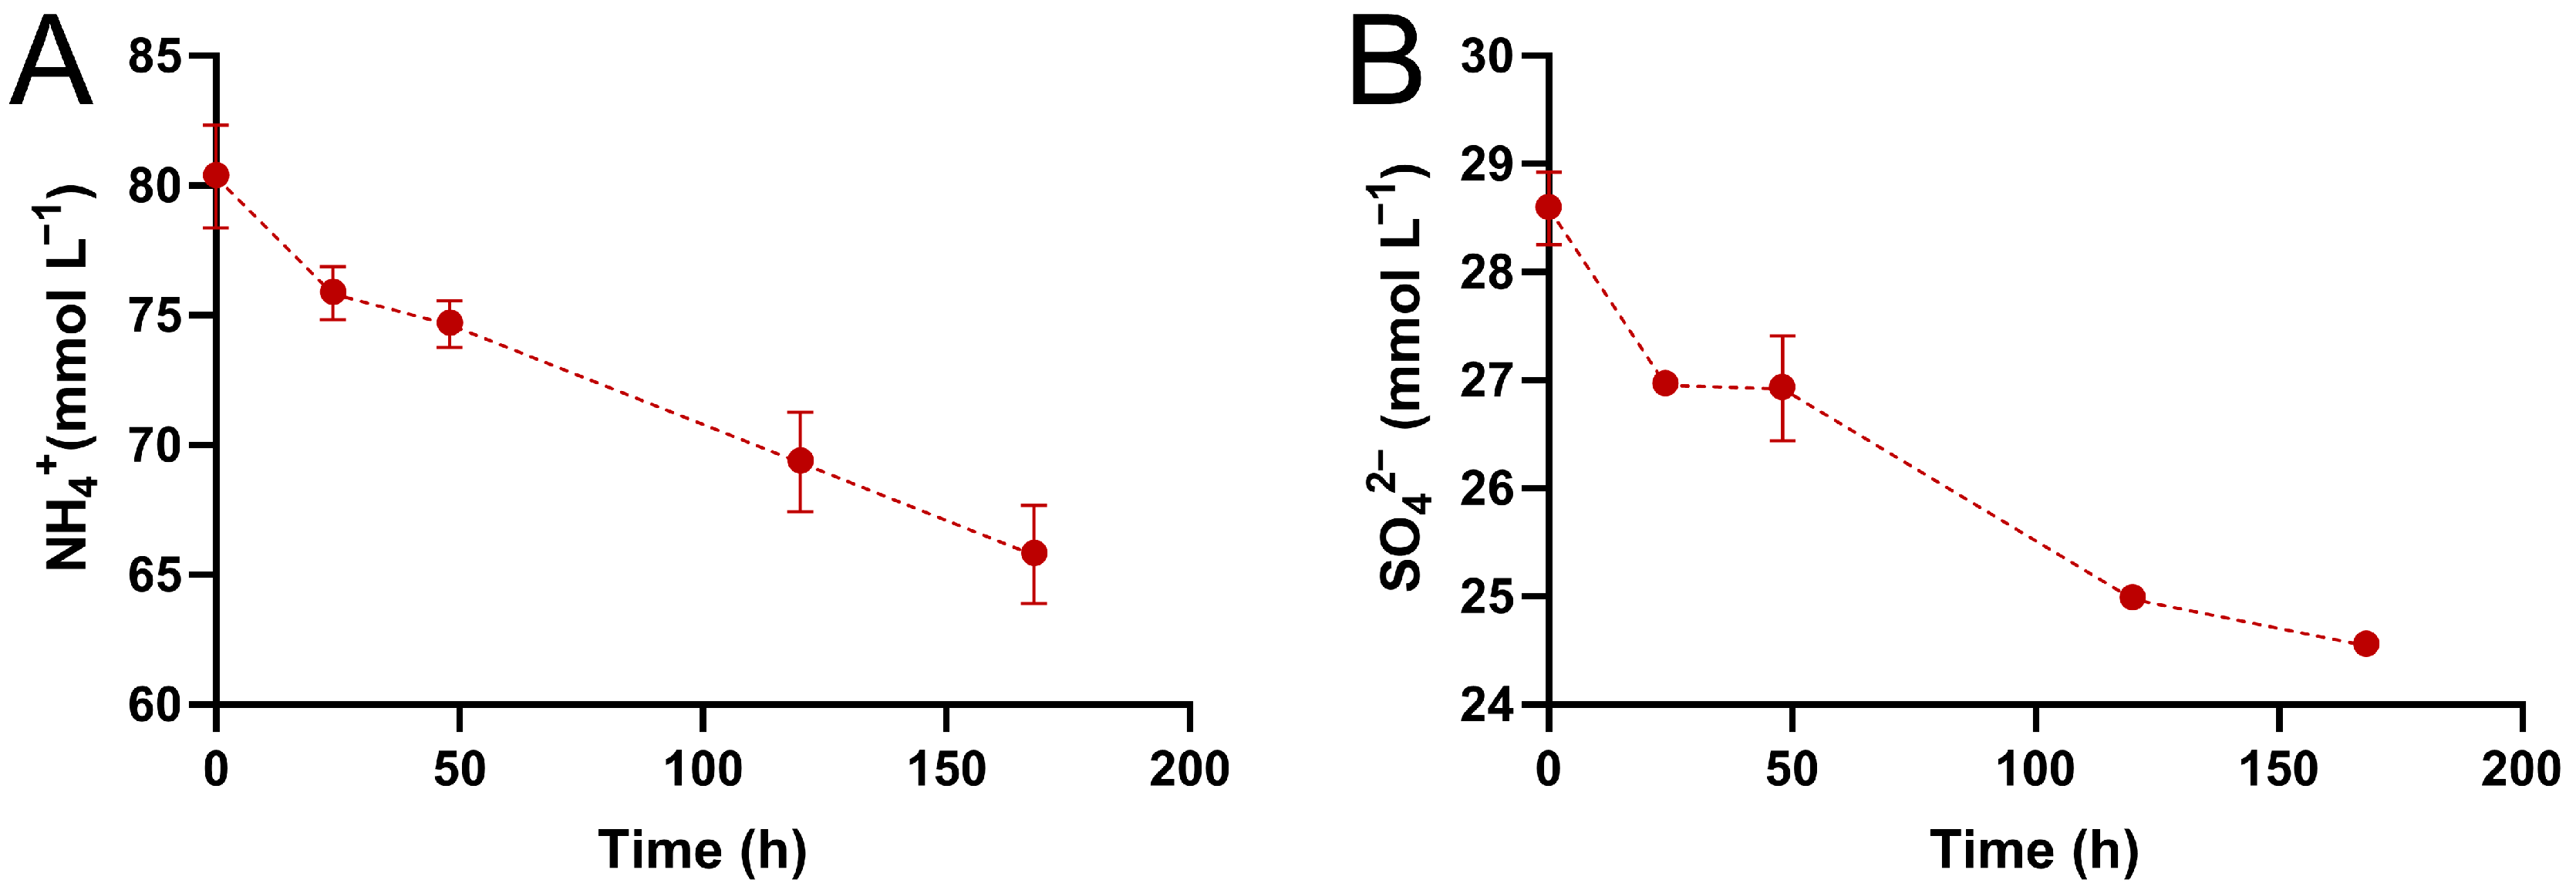
3.3. Sulfate and Ammonium Consumption

The sulfate and ammonium ions were quantified during the fermentation. Initially, both ions were consumed during the fermentation process (Figure 3), with NH4+ being consumed in a larger quantity, 14.55 ± 3.89 mmol L−1, which is expected, given its important role as a nitrogen source. The SO42− ion, on the other hand, was consumed at 4.04 ± 0.35 mmol L−1. The consumption of the SO42− ion could be explained by the assimilative or dissimilative metabolism, which would lead to the production of amino acids or ATP, respectively.
Interestingly, between 24 and 48 h, the sulfate concentration remained constant, which may indicate that amino acid synthesis was no longer necessary and that glycerol consumption was sufficient to provide the required amount of reducing equivalents, making dissimilative sulfate reduction unnecessary (Figure 3B). After 48 h, however, the sulfate concentration decreased again. During this period, the glycerol consumption was also reduced, but 1,3-PDO and butyric acid were still generated, indicating a dissimilative sulfate reduction (Figure 2C–E). The increase in the substrate-to-product conversion factor (YP/S) after 48 h corroborates this supposition. Between 24 and 48 h, the YP/S was 0.48 molgly mol−11,3PDO; it increased to 0.62 molgly mol−11,3PDO between 48 and 120 h, and to 0.76 molgly mol−11,3PDO between 120 and 168 h. These increases occurred during periods in which sulfate was consumed. Supposedly, dissimilative sulfate consumption occurred for ATP production, and this allowed the substrate to be directed towards product formation, as indicated by the increase in YP/S.
Comparing the ions, a greater preference was observed for the NH4+ ion due to its biochemical role. The SO42− ion also plays an important role in the synthesis of amino acids and ATP; however, it is required at lower concentrations.
From the perspective of 1,3-PDO production, the addition of the SO42− ion was significant, given its effects on the YP/S, which resulted in a more favorable energetic metabolism provided by the dissimilatory reduction of this ion.

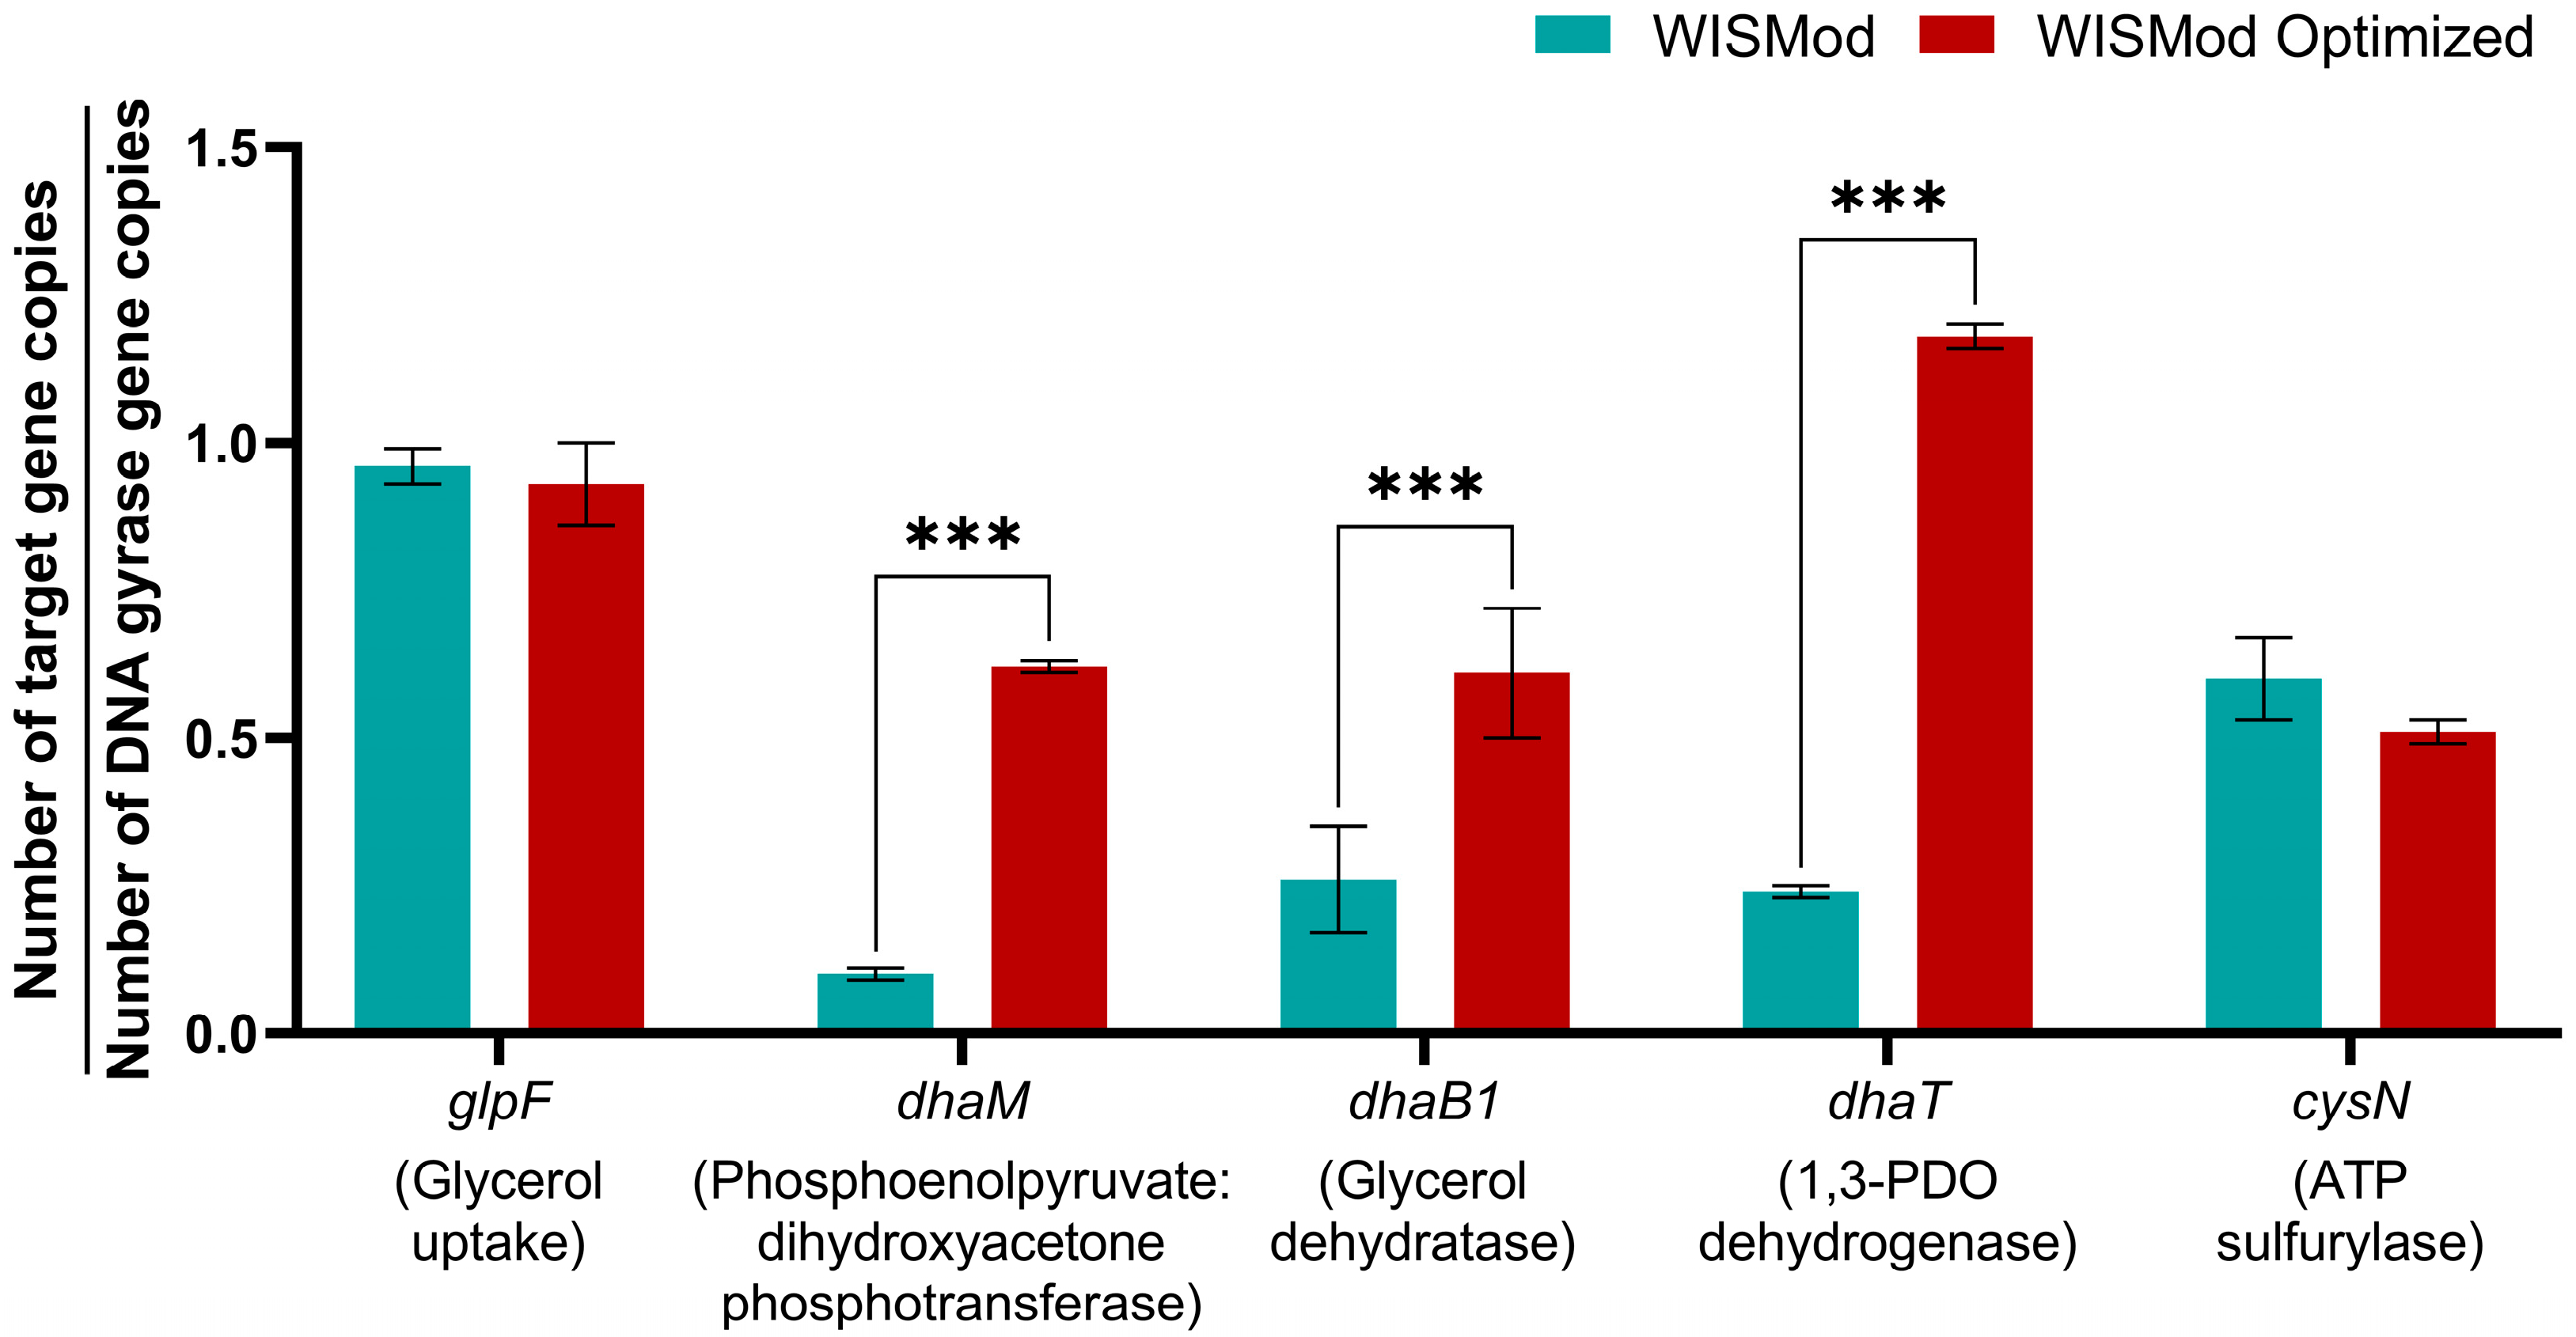
3.4. Gene Expression

The genes analyzed encode enzymes involved in glycerol and sulfate metabolism. These genes can be grouped into three categories: (1) Glycerol oxidative metabolism (glycerol uptake, phosphoenolpyruvate:dihydroxyacetone phosphotransferase); (2) Glycerol reductive metabolism (glycerol uptake, glycerol dehydratase, 1,3-PDO dehydrogenase); (3) Sulfate reductive metabolism (ATP sulfurylase). Each group of genes encodes enzymes responsible for specific steps in the corresponding metabolic pathways. For instance, glycerol uptake and conversion to dihydroxyacetone phosphate are part of the oxidative pathway, while glycerol dehydration and subsequent reduction to 1,3-PDO represent the reductive pathway. ATP sulfurylase initiates sulfate reduction, leading to the formation of adenosine 5′-phosphosulfate (APS), which will further be transformed into amino acids.
The addition of (NH4)2SO4 did not significantly affect the expression of the glycerol uptake gene (Figure 4). However, in the optimized medium, the expression of the phosphoenolpyruvate:dihydroxyacetone phosphotransferase gene increased approximately 6-fold compared to the control, suggesting that the enhanced glycerol consumption in the optimized medium is related to the oxidative pathway, possibly facilitated by a more abundant substrate supply.
Regarding the second group of genes (Figure 4), which corresponds to the enzymes associated with glycerol reductive metabolism, the gene encoding the glycerol dehydratase enzyme exhibited an approximately 2.5-fold increase in its expression due to the supplementation of (NH4)2SO4. In addition, the gene encoding the 1,3-PDO dehydrogenase showed an approximately 5-fold increase. The increase in the expression of these genes confirms the effect of adding (NH4)2SO4 on the enhanced production of 1,3-PDO by C. beijerinckii Br21.
Finally, the last group corresponds to the gene that encodes the ATP sulfurylase enzyme, responsible for sulfate reduction. The expression of this gene did not show a statistically significant difference (Figure 4). This result suggests that the increase in SO42− concentration does not favor the expression of this gene. However, this does not directly imply that SO42− reduction is not occurring, as the enzyme gene’s expression still takes place, and it is only one of several steps in the process. It is likely that the amount of sulfate in the original medium was already sufficient for the glycerol concentration.
Thus, the increased 1,3-PDO production can be explained at a molecular level by the upregulation of these genes, which leads to a corresponding increase in the expression of the involved genes and probably in the activities of the enzymes.

4. Conclusions

The factorial design highlighted the importance of optimizing glycerol and (NH4)2SO4 concentrations for 1,3-PDO production by C. beijerinckii. Optimization of the WISMod medium led to a 112% increase in 1,3-PDO production and a 37.5% increase in cell growth. Gene expression analysis revealed that both oxidative and reductive pathways were enhanced in the optimized medium. While ATP sulfurylase encoding gene expression remained unchanged, the increased expression of key enzymes in both pathways confirmed the positive impact of the optimization. This study provides insights into sustainable 1,3-PDO production from glycerol by C. beijerinckii, presenting a promising approach for biorefineries in the biodiesel industry.

Author Contributions

Conceptualization, P.F.D.L.d.C. and V.R.; Methodology, R.d.M.A., J.B., M.L.A.M.C. and J.F.; Formal analysis, P.F.D.L.d.C., R.d.M.A., J.B. and J.F.; Investigation, P.F.D.L.d.C.; Writing—original draft, V.R.; Writing—review & editing, R.d.M.A., J.B. and V.R.; Supervision, V.R.; Funding acquisition, V.R. All authors have read and agreed to the published version of the manuscript.

Funding

This research was funded by the financial support received from the São Paulo State Research Foundation (FAPESP, grant number 2022/04024-0 and 2023/00590-4) and Coordenação de Aperfeiçoamento de Pessoal de Nível Superior—Brazil (CAPES) (Finance code 88887.701729/2022-00 and 88887.714584/2022-00).

Institutional Review Board Statement

Not applicable.

Informed Consent Statement

Not applicable.

Data Availability Statement

The data presented in this study are openly available in https://drive.google.com/drive/folders/1UMBdBd_xEYg98HEqkSm_6EDNVkdSK762?usp=drive_link, accessed on 25 March 2025.

Conflicts of Interest

The authors declare no conflict of interest.

References

  1. Shahzad, S.J.H.; Bouri, E.; Kayani, G.M.; Nasir, R.M.; Kristoufek, L. Are clean energy stocks efficient? Asymmetric multifractal scaling behaviour. Phys. A Stat. Mech. Appl. 2020, 550, 124519. [Google Scholar] [CrossRef]
  2. Quah, R.V.; Tan, Y.H.; Mubarak, N.M.; Khalid, M.; Abdullah, E.C.; Nolasco-Hipolito, C. An overview of biodiesel production using recyclable biomass and non-biomass derived magnetic catalysts. J. Environ. Chem. Eng. 2019, 7, 103219. [Google Scholar]
  3. OECD-FAO Agricultural Outlook 2022–2031. Available online: https://www.oecd.org/en/publications/oecd-fao-agricultural-outlook-2022-2031_f1b0b29c-en.html (accessed on 27 February 2025).
  4. Analysis of Biofuels’ Current Outlook 2023. Available online: https://www.epe.gov.br/en/publications/publications/analysis-of-biofuels-current-outlook-2023 (accessed on 27 February 2025).
  5. Nomanbhay, S.; Hussein, R.; Ong, M.Y. Sustainability of biodiesel production in Malaysia by production of bio-oil from crude glycerol using microwave pyrolysis: A review. Green Chem. Lett. Rev. 2018, 11, 135–157. [Google Scholar]
  6. Wang, H.; Li, H.; Lee, C.K.; Mat Nanyan, N.S.; Tay, G.S. A systematic review on utilization of biodiesel-derived crude glycerol in sustainable polymers preparation. Int. J. Biol. Macromol. 2024, 216, 129536. [Google Scholar]
  7. Chilakamarry, C.R.; Sakinah, A.M.M.; Zularisam, A.W.; Pandey, A. Glycerol waste to value added products and its potential applications. Syst. Microbiol. Biomanuf. 2021, 1, 378–396. [Google Scholar] [CrossRef]
  8. Maru, B.T.; Bielen, A.A.M.; Constantí, M.; Medina, F.; Kengen, S.W.M. Glycerol fermentation to hydrogen by Thermotoga maritima: Proposed pathway and bioenergetic considerations. Int. J. Hydrogen Energy 2013, 38, 5563–5572. [Google Scholar]
  9. Seta, K.; Suzuki, T.; Kiyoshi, K.; Shigeno, T.; Nakajima-Kambe, T. Potential use of methane fermentation digested slurry as a low-cost, environmentally-friendly nutrient for bioethanol production from crude glycerol by Klebsiella variicola TB-83D. New Biotechnol. 2018, 44, 1–5. [Google Scholar]
  10. Sarchami, T.; Johnson, E.; Rehmann, L. Optimization of fermentation condition favoring butanol production from glycerol by Clostridium pasteurianum DSM 525. Bioresour. Technol. 2016, 208, 73–80. [Google Scholar] [PubMed]
  11. Mermejo, B.d.C.; Bortolucci, J.; de Andrade, A.R.; Reginatto, V. The Non-solventogenic Clostridium beijerinckii Br21 Produces 1,3-Propanediol From Glycerol With Butyrate as the Main By-Product. Front. Sustain. Food Syst. 2022, 6, 848022. [Google Scholar]
  12. Marr, A.C. 1,3-Propanediol, an Exemplary Bio-Renewable Organic Platform Chemical. Adv. Synth. Catal. 2024, 366, 4835–4845. [Google Scholar]
  13. Global 1,3 Propanediol Market Report, Trends, Size and Share Analysis-Growth Trends and Forecasts (2024–2031). Available online: https://www.coherentmarketinsights.com/industry-reports/global-1-3-propanediol-market (accessed on 27 February 2025).
  14. Johnson, E.E.; Rehmann, L. The role of 1,3-propanediol production in fermentation of glycerol by Clostridium pasteurianum. Bioresour. Technol. 2016, 209, 1–7. [Google Scholar] [CrossRef] [PubMed]
  15. Wischral, D.; Zhang, J.; Cheng, C.; Lin, M.; De Souza, L.M.G.; Pessoa, F.L.P.; Pereira, N.; Yang, S.T. Production of 1,3-propanediol by Clostridium beijerinckii DSM 791 from crude glycerol and corn steep liquor: Process optimization and metabolic engineering. Bioresour. Technol. 2016, 212, 100–110. [Google Scholar] [CrossRef] [PubMed]
  16. Apiwatanapiwat, W.; Vaithanomsat, P.; Thanapase, W.; Ratanakhanokchai, K.; Kosugi, A. Xylan supplement improves 1,3-propanediol fermentation by Clostridium butyricum. J. Biosci. Bioeng. 2018, 125, 662–668. [Google Scholar] [CrossRef]
  17. Silva, G.P.D.; Contiero, J.; Neto, P.M.Á.; De Lima, C.J.B. 1,3-propanediol: Production, applications and biotechnological potential. Quím. Nova 2014, 37, 527–534. [Google Scholar] [CrossRef]
  18. Gallardo, R.; Alves, M.; Rodrigues, L.R. Modulation of crude glycerol fermentation by Clostridium pasteurianum DSM 525 towards the production of butanol. Biomass Bioenerg. 2014, 71, 134–143. [Google Scholar] [CrossRef]
  19. Leng, L.; Nobu, M.K.; Narihiro, T.; Yang, P.; Amy Tan, G.Y.; Lee, P.H. Shaping microbial consortia in coupling glycerol fermentation and carboxylate chain elongation for Co-production of 1,3-propanediol and caproate: Pathways and mechanisms. Water Res. 2019, 148, 281–291. [Google Scholar] [CrossRef]
  20. Chen, Z.; Liu, D. Toward glycerol biorefinery: Metabolic engineering for the production of biofuels and chemicals from glycerol. Biotechnol. Biofuels Bioprod. 2016, 9, 205. [Google Scholar] [CrossRef] [PubMed]
  21. Fokum, E.; Zabed, H.M.; Ravikumar, Y.; Elshobary, M.E.; Chandankere, R.; Zhang, Y.; Yun, J.; Qi, X. Co-fermentation of glycerol and sugars by Clostridium beijerinckii: Enhancing the biosynthesis of 1,3-propanediol. Food Biosci. 2021, 2021, 101028. [Google Scholar] [CrossRef]
  22. Altafini, R.d.M.; Martins, T.M.T.; Bruni, A.T.; Reginatto, V. Upgraded medium composition highlights the relevance of iron sulfate for 1,3-propanediol production by a Clostridium beijerinckii strain. Biocatal. Agric. Biotechnol. 2022, 43, 102388. [Google Scholar] [CrossRef]
  23. Lee, S.; Lee, J.H.; Mitchell, R.J. Analysis of Clostridium beijerinckii NCIMB 8052’s transcriptional response to ferulic acid and its application to enhance the strain tolerance. Biotechnol. Biofuels Bioprod. 2015, 8, 68. [Google Scholar] [CrossRef]
  24. Fonseca, B.C.; Guazzaroni, M.E.; Reginatto, V. Fermentative production of H2 from different concentrations of galactose by the new isolate Clostridium beijerinckii Br21. Int. J. Hydrogen Energy 2016, 41, 21109–21120. [Google Scholar] [CrossRef]
  25. Egoburo, D.E.; Diaz Peña, R.; Kolender, A.; Pettinari, M.J. Optimization and Validation of a GC–FID Method for Quantitative Determination of 1,3-Propanediol in Bacterial Culture Aqueous Supernatants Containing Glycerol. Chromatographia 2017, 80, 1121–1127. [Google Scholar]
  26. Akagi, J.M.; Campbell, L.L. Studies on Thermophilic Sulfate-Reducing Bacteria III: Adenosine Triphosphate-sulfurylase of Clostridium nigrificans and Desulfovibrio desulfuricans. J. Bacteriol. 1962, 84, 1194–1201. [Google Scholar] [PubMed]
  27. Kováč, J.; Vítězová, M.; Kushkevych, I. Metabolic activity of sulfate-reducing bacteria from rodents with colitis. Open Med. 2018, 13, 344. [Google Scholar] [CrossRef] [PubMed]
  28. Kushkevych, I.; Vítězová, M.; Vítěz, T.; Kováč, J.; Kaucká, P.; Jesionek, W.; Bartoš, M.; Barton, L. A new combination of substrates: Biogas production and diversity of the methanogenic microorganisms. Open Life Sci. 2018, 13, 119–128. [Google Scholar]
  29. Borgnia, M.J.; Agre, P. Reconstitution and functional comparison of purified GlpF and AqpZ, the glycerol and water channels from Escherichia coli. Proc. Natl. Acad. Sci. USA 2001, 98, 2888–2893. [Google Scholar]
  30. Stroud, R.M.; Nollert, P.; Miercke, L. The glycerol facilitator GlpF its aquaporin family of channels, and their selectivity. Adv. Protein Chem. 2003, 63, 291–316. [Google Scholar]
Figure 1. Response surface obtained from the model for the final 1,3-PDO concentration. The blue circles represent the experimental data points, while the dashed lines indicate the confidence intervals associated with each point.
Fermentation 11 00187 g001
Figure 2. Kinetic growth assay of C. beijerinckii Br21 in the original and optimized culture media. (A) OD600, (B) pH, (C) glycerol concentrations, (D) 1,3-PDO concentrations, (E) butyric acid concentrations. Values are represented as the average obtained from biological triplicate fermentations, with errors calculated from the standard deviation.
Fermentation 11 00187 g002
Figure 3. Concentrations of NH4⁺ (A) and SO42⁻ (B) over time in an assay using the optimized medium. Values are represented as the average obtained from biological triplicate fermentations, with errors calculated from the standard deviation.
Fermentation 11 00187 g003
Figure 4. Absolute expression of glycerol and sulfate metabolism genes in C. beijerinckii Br21 in the original and optimized culture media. Values are represented as the average obtained from biological triplicate fermentations, with errors calculated from the standard deviation. Tukey’s post hoc test was also performed, in which significant differences are represented by three asterisks (p < 0.001).
Fermentation 11 00187 g004
Table 1. Sequences of primers and reporters used to amplify and detect gene expression in RT-qPCR.
EnzymePrimers (5′ 3′)Reporter 1 (5′ 3′)
DNA gyrase
(normalizer)
FW: AGATGTTGTGATAACATTAACACATTCAGGAT
R: GCTTGAATTCCTTTTCCACCTCTTC
TCTGCCGAAATTCTT
Glycerol UptakeFW: CCAGCATTAACAATTGCGTTAGCA
R: TGCACCAATACATTGTCCAGCTAAA
CCCATGCCACTTTACC
Glycerol dehydrataseFW: TGGATTAAATTAAATGATATTAATAAAGTAAGAGATGAGATTTCAACT
R: TCTGAATTTTGCCCTCCAACGATTA
ATAGCCGCCAAAATG
Phosphoenolpyruvate:
Dihydroxyacetone phosphotransferase
FW: CAGAGTAAACATCTTCTATTGCAGCTGAT
R: GGCTGGAGGAACGTCAGAT
CAGTGCCAACTCTTCC
1,3-Propanediol dehydrogenaseFW: GGACGCTTTAACTCATGCAATTGAA
R: CTTGTATTGCTGAAGCATCTGTCA
CCGGATTTGCATCTTT
ATP sulfurylase
(Adenosine Triphosphate sulfurylase)
FW: GACCAAATCATACTTTCAGAGGATTCCA
R: GGAAGTGTCGTAATTTCATCTCCTACA
TTCCAGCTTCAATTTC
Table 2. Conditions used in the experiments indicated by the CCRD and results of final pH and OD600, final concentrations of butyric acid, 1,3-PDO, and consumed glycerol. Values are represented as the average obtained from biological triplicate fermentations, with errors calculated from the standard deviation. The values in parentheses, present in the conditions, represent the coded levels of the variables, which were used to obtain the model.
ConditionsResults
ConditionsGlycerol
(mmol L−1)
(NH4)2SO4
(mmol L−1)
Final pHOD600Consumed Glycerol
(mmol L−1)
Butyric Acid
(mmol L−1)
1,3-PDO
(mmol L−1)
1200 (−1)7.6 (−1)5.06 ± 0.102.09 ± 0.18109.5 ± 6.3818.29 ± 1.1337.41 ± 3.73
2200 (−1)22.7 (+1)5.46 ± 0.052.01 ± 0.30152.80 ± 8.9710.22 ± 0.0121.30 ± 1.12
3400 (+1)7.6 (−1)5.29 ± 0.062.06 ± 0.16181.51 ± 14.5819.57 ± 1.8476.27 ± 7.34
4400 (+1)22.7 (+1)5.16 ± 0.042.36 ± 0.11185.62 ± 5.6218.96 ± 1.2653.88 ± 5.85
5158 (−1.41)15.1 (0)6.03 ± 0.011.74 ± 0.0051.36 ± 1.876.03 ± 0.013.44 ± 2.31
6441 (+1.41)15.1 (0)5.49 ± 0.082.11 ± 0.08157.42 ± 12.6215.51 ± 0.6641.89 ± 1.28
7300 (0)4.4 (−1.41)5.15 ± 0.022.20 ± 0.23164.54 ± 1.8317.27 ± 0.2950.98 ± 0.67
8300 (0)25.8 (+1.41)5.16 ± 0.132.53 ± 0.11183.32 ± 10.2620.34 ± 2.5669.18 ± 2.91
9300 (0)15.1 (0)5.26 ± 0.022.04 ± 0.04135.51 ± 13.7615.84 ± 0.8938.33 ± 0.66
10300 (0)15.1 (0)5.39 ± 0.302.10 ± 0.25123.72 ± 19.9712.68 ± 0.6635.70 ± 6.79
Table 3. ANOVA table with significant variables for model validation obtained by the CCRD for the final concentration of 1,3-PDO.
FactorsSignificanceSum of SquaresDegrees of FreedomMean SquareFp
Linear glycerolSignificant1909.7611909.761699.830.015
Quadratic glycerolSignificant235.041235.04209.200.044
Quadratic (NH4)2SO4Significant561.291561.29499.590.028
Lack of fitNot significant372.37574.4766.290.093
Pure error 1.1211.12
Total 3634.439
Disclaimer/Publisher’s Note: The statements, opinions and data contained in all publications are solely those of the individual author(s) and contributor(s) and not of MDPI and/or the editor(s). MDPI and/or the editor(s) disclaim responsibility for any injury to people or property resulting from any ideas, methods, instructions or products referred to in the content.

