Article

Multi-Biofuel Production Under Controlled and Noncontrolled pH Conditions by a Glucose-Adapted Enterobacter cloacae

by
Francisco Flores-Montiel
1,
Victor E. Balderas-Hernández
1,
Karla L. Márquez-Rivera
2 and
Antonio De Leon-Rodriguez
1,*
1
División de Biología Molecular, Instituto Potosino de Investigación Científica y Tecnológica A.C., Camino a la Presa San José 2055, Lomas 4ª Sección, San Luis Potosí 78216, SLP, Mexico
2
Facultad de Ingeniería, Universidad Autónoma de San Luis Potosí, Av. Dr. Manuel Nava 304, Zona Universitaria, San Luis Potosí 78210, SLP, Mexico
*
Author to whom correspondence should be addressed.
Fermentation 2025, 11(6), 357; https://doi.org/10.3390/fermentation11060357
Submission received: 28 April 2025 / Revised: 13 June 2025 / Accepted: 16 June 2025 / Published: 19 June 2025
(This article belongs to the Special Issue Biofuels Production and Processing Technology, 3rd Edition)

Abstract

This study reports the effects of pH culture on multi-biofuel production (hydrogen, ethanol, and 2,3-butanediol) by Enterobacter cloacae K1ga, isolated from koala and adapted to grow in 100 g dm−3 glucose. Batch cultures were performed in 1 dm3 bioreactors, controlling the pH at 5.5, 6.5, 7.5, and 9.2. Furthermore, cultures without pH control (with an initial pH of 9.2) were used as reference cultures. Controlling pH at 9.2 was detrimental to E. cloacae K1ga as no growth or biofuel production was observed. In contrast, reference cultures reached a maximum 2,3-butanediol (BDO) production (BDOP) of 22.9 ± 2.1 g dm−3 and ethanol production (EP) of 9.9 ± 0.7 g dm−3 and the highest hydrogen production (HP) of 2013.1 ± 275.7 cm3 dm−3. Meanwhile, a pH of 7.5 increased the accumulation of ethanol, obtaining the highest EP (14.0 ± 0.05 g dm−3). On the contrary, a pH of 5.5 was unfavourable for the fermentative metabolism of E. cloacae K1ga, showing the lowest production rates for the three biofuels and also the lowest EP (8.05 ± 0.35 g dm−3). The results demonstrate that the natural progression of pH during the growth of E. cloacae K1ga is an advantageous strategy for multi-biofuel production, since no tight pH control system is required.

1. Introduction

The world’s energy demand for fossil fuels has generated unprecedented levels of the emissions of millions of tons of greenhouse gases and contributed to climate change [1,2,3]. Intense research has been conducted to mitigate these consequences by replacing fossil fuels with cleaner renewable energy sources (organic biomass, geothermal, wind, solar, and tidal). The biological production of second-generation biofuels by dark fermentation processes using facultative or strict anaerobic bacteria is a promising option to meet global energy demand [4,5].
Hydrogen is one of the most promising energy sources and an alternative fossil fuel source due to its outstanding properties as a clean, renewable energy source with a high energy content (142 MJ kg−1) compared to other fossil fuel sources. The main bio-products obtained by dark fermentation are hydrogen, ethanol, alkanes, volatile fatty acids (VFAs) [3,6,7,8,9], and high-added value metabolites such as 1,4-butanediol and 2,3 butanediol (BDO), which are mainly used for the synthesis of polymers [10], cosmetics, and antiseptic, antifreeze, pharmaceutical, and anti-inflammatory agents. Furthermore, in the agrochemical industry, growth promoter, antifungal, and virus resistance effects have been reported [11,12].
Specialised bacteria for the production of biofuels are ubiquitous in the environment and are attractive to researchers because their diverse genetic and metabolic potential has been developed to generate attractive fermentative end by-products, e.g., the potential hydrogen production using buffalo sludge and rumen as inocula has been explored for the conversion of lignocellulosic biomass. Researchers have shown that the rumen inoculum was more efficient compared to the sludge during fermentation, 120.8 vs. 65.4 cm3 H2 g per volatile solid, respectively. Rumen is a well-adapted microbial community on which ruminants rely to convert feed into energy-rich products, such as the VFAs used by the host as an energy source [13].
Koalas’ intestinal microbiota is another microbial community that offers a biotechnological potential due to its enzymatic activities such as those of cellulases, hemicellulases, ligninases, tannases, and amylases [14], which are acquired by a coprophagic activity event [15]. The koala (Phascolarctos cinereus) is an arboreal marsupial native to Australia that feeds exclusively on the foliage of Eucalyptus sp., which represents a highly recalcitrant diet, poor in proteins and simple carbohydrates and highly toxic due to high concentrations of phenolic compounds and tannins [16]. The continuous coevolutionary race between Eucalyptus and koala is an intriguing event that has been resolved by key players in the koala microbiota. Members of the genus Desulfovibrio and the Synergistaceae, Rhodocyclaceae, and Lachnospiraceae families have been found to be involved in the metabolism of Eucalyptus compounds [17]. However, the effects of controlled and noncontrolled pH on multi-biofuel production have not been explored.
On the other hand, the dark fermentation process is governed by variations in temperature, substrate concentration, and pH [18]. This last variable has a considerable effect on the decrease in bacterial growth and enzymatic activities, which consequently can affect the production of alcohols or direct carbon flow to produce preferential metabolites. In light of optimisation, microorganisms subjected to adaptive laboratory evolution (ALE) have gained special attention for their ability to improve the production of biofuels and their productivity. ALE involves the selection of mutations advantageous for survival in a particular new niche and represents a permanent alteration in response to the changed environment [19]. The main ALE methodologies for improving microbial phenotypes and investigating their evolutionary phenomena are categorised into three types of long-term culture methods: serial transfer, colony transfer, and continuous culture experiments. The serial transfer method involves screening for high concentrations of stress-causing chemicals or drugs against their effects on the biomass production of bacteria. Next, the colony transfer method is used to analyse the mutation rate and molecular spectrum of spontaneous mutations generated by drug gradients. ALE-generated microorganisms used in continuous culture experiments represent an invaluable tool since a non-disturbance methodology in operating conditions is followed. However, drug gradients could be added along the fermentation process to determine their effect on kinetic parameters [20].
The ALE process is an effective way to improve the use of carbon sources and its modulation because it is closely related to cell growth [21]. Research has been conducted to increase the co-utilisation of xylose with glucose from lignocellulosic biomass hydrolysates using several ALE microorganisms. Kim et al. generated an adapted E. coli JK32 strain to improve the co-utilisation of both glucose and xylose, where the parental strain E. coli MG1655 was used with the deletion of the ptsH and ldhA genes and the replacement of pflB with Z. mobilis pdc and adhB, and they achieved alcohol yields ranging from 0.39 to 0.56 depending on the strain used [22].
To our knowledge, there are no reports on the production of multi-biofuel (ethanol, hydrogen, and BDO) by controlling the pH during fermentation using E. cloacae. In this study, we evaluated the effects of pH (controlled and uncontrolled) in 1 dm3 batch bioreactors on the production, production rates, and yields of biofuels by E. cloacae K1 isolated from koala faeces and subjected to adaptation through gradual increases in glucose until reaching a concentration of 100 g dm−3. The goal of this research was to evaluate the effects of pH during the multi-biofuel production using glucose as a carbon source by a glucose-adapted E. cloacae K1ga strain.

2. Materials and Methods

2.1. Microorganisms and Culture Media

The parental microorganism used in this study was E. cloacae K1, previously isolated from the Bert Saunders Koala Sanctuary, Doonside, Australia (−33.764, 150.882) [23]. The parental microorganism was grown routinely in LB Miller’s Broth medium 20 g dm−3 [Sigma-Aldrich, St. Louis, MO, USA] and maintained at 37 °C. Pre-inocula were harvested after at least 12 h of inoculation. The cell pellet was recovered at 3500 rpm for 7 min in a centrifuge [Biofuge Fresco, Heraeus, Germany] and washed with a 0.1 mM sterile PBS solution. For biofuel production experiments, 200 cm3 Erlenmeyer flasks were used to perform the evolutive adaptation of the isolate E. cloacae K1. This process was carried out through gradual increases of 20 g dm−3 of glucose [Materiales y Abastos Especializados S.A. de C.V., reagent grade, Mexico City, Mexico] at 28.5 °C every 72 h until reaching a concentration of 100 g dm−3. This solution also contained tryptone [Difco, Franklin Lakes, NJ, USA] 2.75 g dm−3 and yeast extract (Difco) 0.25 g dm−3. This last glucose (100 g dm−3)-adapted isolate was designated as E. cloacae K1ga and used for further fermentations. A set of cultures using 100 g dm−3 of glucose was individually inoculated with parental E. cloacae K1 or adapted E. cloacae K1ga, and each started at 0.1 OD (optical density) at 600 nm and was incubated at 28.5 °C.

2.2. Batch Fermentations

To determine the effects of pH control, batch fermentations were performed in 1 dm3 bioreactors [Applikon, Delft, The Netherlands] connected to the ez-Control Bioconsole (Applikon) using sterilisable pH and dissolved oxygen electrodes (Applikon) to monitor these parameters in real time. BioXpert 1.3 software [Applikon, version 1.12.012b02] was used for data acquisition. Batch cultures were carried out at 28.5 °C and 180 rpm. Medium B was used for the production of biofuels and supplemented with glucose 79 g dm−3, tryptone 2.75 g dm−3, yeast extract 0.25 g dm−3, and trace elements 1 cm3 dm−3 [24]. Bioreactors were inoculated with E. cloacae K1ga at an initial optical density at 600 nm (O.D.600 nm) of 0.2. Fermentations were carried out at controlled pH values of 5.5, 6.5, 7.5, and 9.2 and were compared with uncontrolled pH cultures (initial pH 9.2), designated as reference cultures. The aforementioned pH value of 9.2 was used because our laboratory has previously demonstrated that this represents the optimal pH for the production of multi-biofuel by Enterobacter cloacae isolated from koala microbiota [23]. Fermentations at a fixed pH were automatically controlled by adding 10 N NaOH [Fermont, Monterrey, Nuevo Leon, Mexico] and 2 N HCl (Fermont) solutions. Fermentations were carried out in triplicate at least.

2.3. Analytical Methods

The determination of hydrogen was carried out by injecting 0.4 cm3 of biogas into a 6890 N Gas Chromatograph [Agilent Technologies, Wilmington, DE, USA] coupled to a thermal conductivity detector (Agilent Technologies). Gas production was measured by the acidified water (pH ≤ 2.0) displacement method, which consisted of the use of a 2 dm3 inverted burette connected to a bioreactor port with rubber tubing and a needle. An HP-Molesieve capillary column (Agilent Technologies) with the following dimensions was used: 30 m × 300 µm × 12 µm. The operating conditions were an oven temperature of 70 °C and an injector at 200 °C, with a split rate of 112:1. Nitrogen [Criogas, ultrapure grade, Orizaba, Veracruz, Mexico] was used as carrier gas with a flow of 1.7 cm3 min−1, in an analysis window of 4 min. The production of VFAs and alcohols was analysed by HPLC Infinity LC 1220 (Agilent Technologies) with a refractive index detector and a Rezex ROA column (150 × 7.8 mm, Phenomenex, Torrance, CA, USA) at 60 °C, with a mobile phase of 2.5 mM H2SO4 [JT Baker, HPLC grade, Phillipsburg, NJ, USA] at a flow of 0.50 cm3 min−1. Biomass production was measured at 600 nm using a Varian Cary® 50 Bio UV-VIS spectrophotometer [Varian, Palo Alto CA, USA] and converted to dry cell weight using a standard calibration curve.

2.4. Statistical Analysis

The specific glucose uptake rate of (qs) and the specific growth rate (µ) from controlled and reference cultures were calculated and plotted. For comparison between samples, data were analysed by an analysis of variance (ANOVA test). Kinetic parameters were analysed with Dunnett’s multiple comparison. The production, production rates, and yields of biofuels were organised into a matrix (5 × 9), in which rows indicate the response variables studied, while columns indicate the pH values evaluated in this study.

3. Results and Discussion

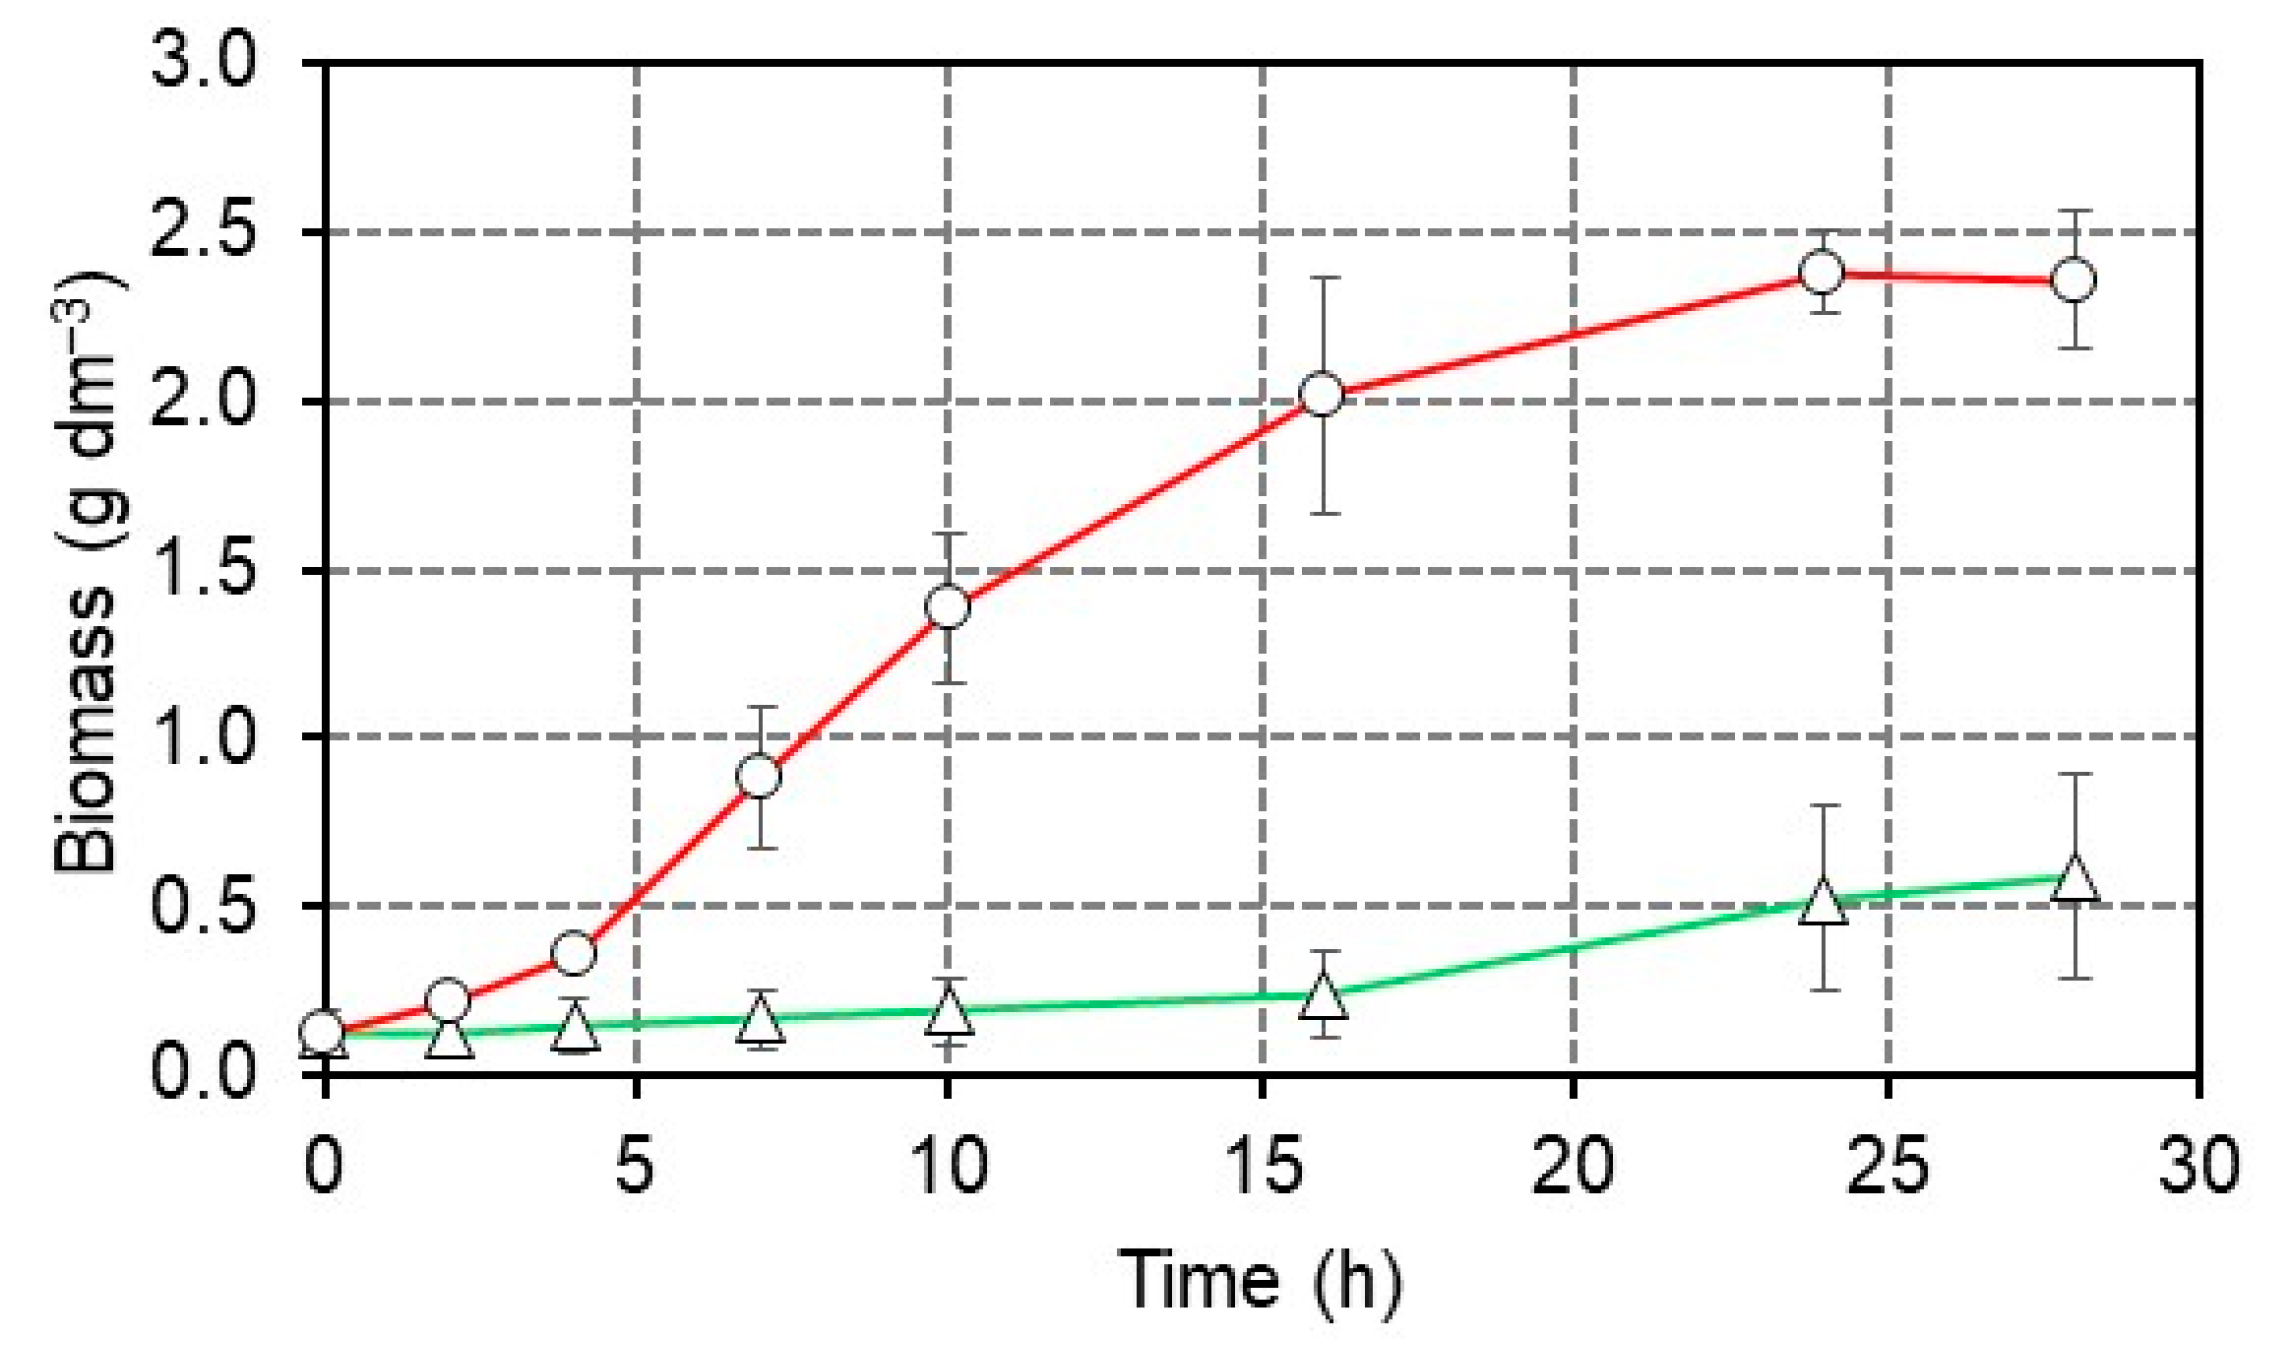
3.1. High-Glucose Concentration Adaptation of E. cloacae K1

Although E. cloacae is recognised as a good hydrogen and alcohol producer using food waste or single carbohydrates [23,25,26], more research is needed on E. cloacae under selective pressure with high glucose concentrations to increase biofuel production and productivity. In this study, we used E. cloacae K1, which was adapted to grow at high glucose concentrations, up to 100 g dm−3, using an ALE strategy to generate E. cloacae K1ga. As observed in Figure 1, when parental E. cloacae K1 was cultured in 100 g dm−3 of glucose, it showed diminished growth, with a specific growth rate (µ) of 0.06 ± 0.02 h−1, during the first 30 h of cultivation. In contrast, E. cloacae K1ga showed a µ of 0.18 ± 0.01 h−1, reaching the maximum biomass of 2.4 ± 0.13 g dm−3 after 25 h of cultivation in mineral medium supplemented with 100 g dm−3 of glucose.
In a previous study, K. Kim et al. reported on E. coli K-12 MG1655 subjected to a long-term ALE process. They evaluated two independent lineages of this strain using a two-phase adaptation regime. Each lineage first evolved from lactate to glycerol or vice versa for over 1400 to 1600 generations. They found that the specific growth rate of the lactate-evolved strain reached a value of 0.6 h−1, which was a two-fold increase compared to the parental strain [27].
ALE is founded on the principles of natural evolution, allowing for the selection of offspring with desired traits through sustained propagation under specific selection pressures [27]. The adaptation of microorganisms to selective pressures is not new to experimentalists, and the main idea is to introduce factors such as UV light or chemical mutagens to increase mutation rates. However, these mutagenic sources are often toxic to the cell, meaning that tolerance-conferring mutations can arise and provide mutants with a selective advantage [28]. An ALE event occurs through genetic changes, either via de novo mutations or by horizontal gene transfer, where genetic information is transferred through conjugation, plasmids, and phages between different organisms and often between distinct species. ALE studies provide invaluable information about the medical, agricultural, and biotechnological fields. Under the medical approach, the rapid emergence of antimicrobial resistance and multidrug-resistant bacterial “superbugs” is seen worldwide [20]. On the other hand, there are limited investigation insights into the biotechnological use of E. cloacae for the production of biofuels without exploiting the metabolite capabilities that ALE could generate.

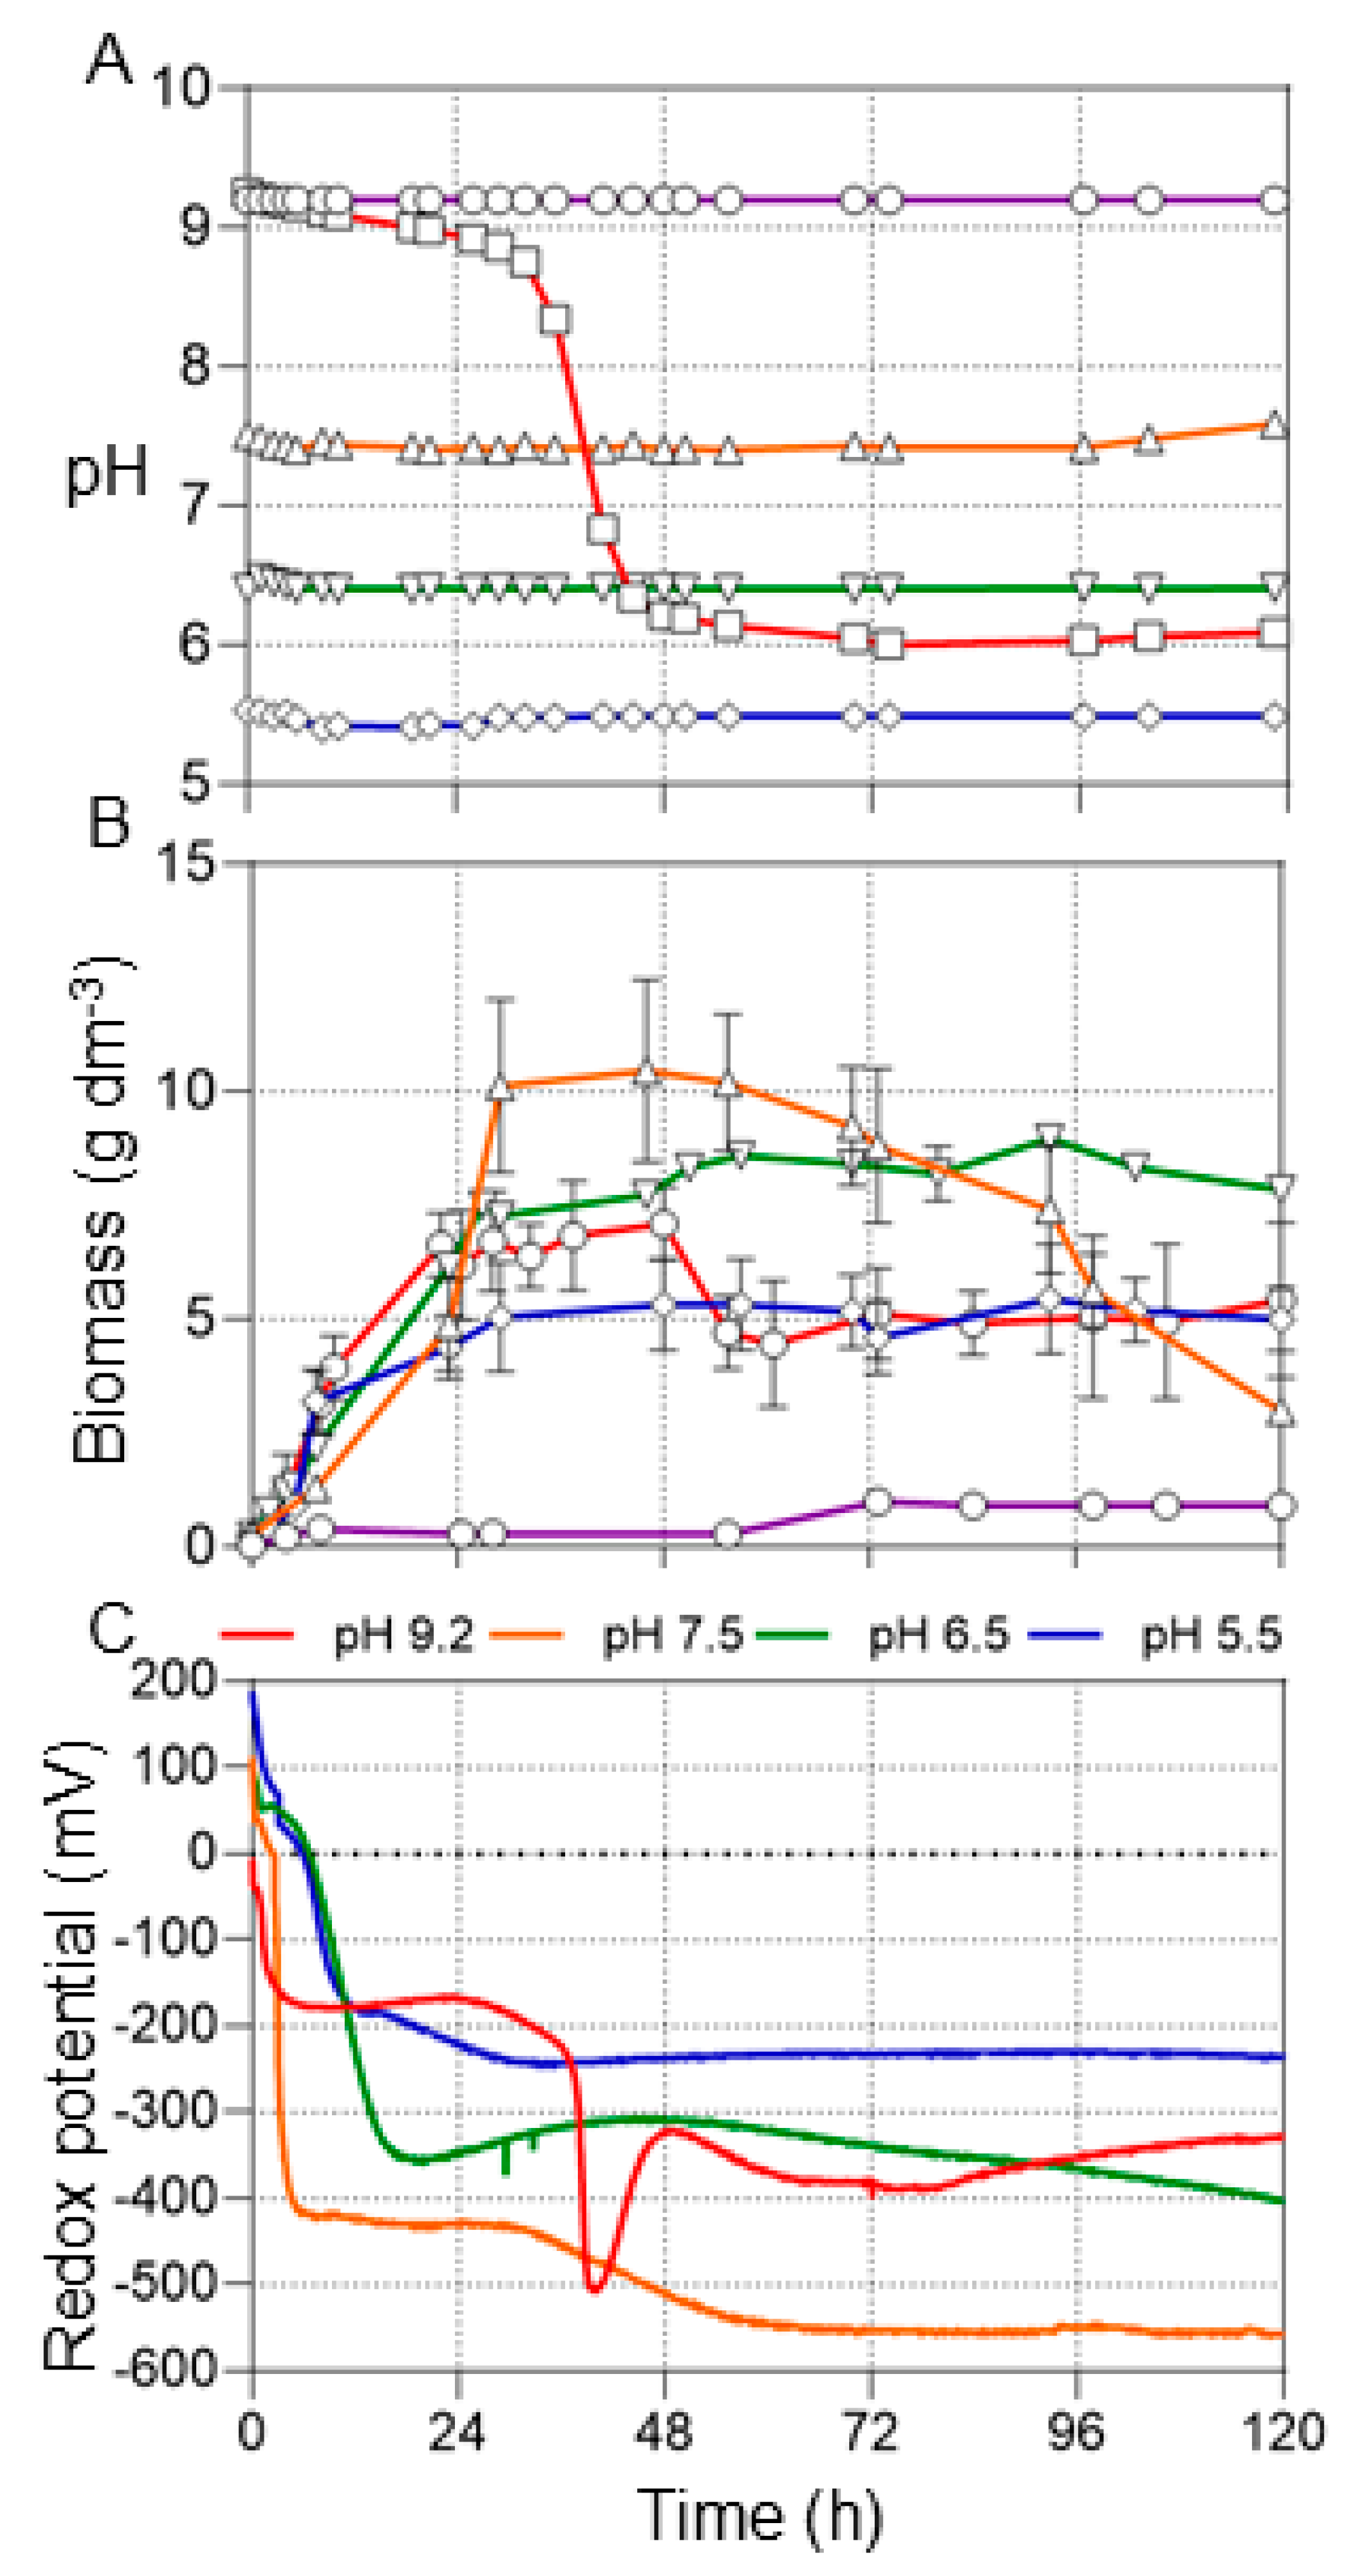
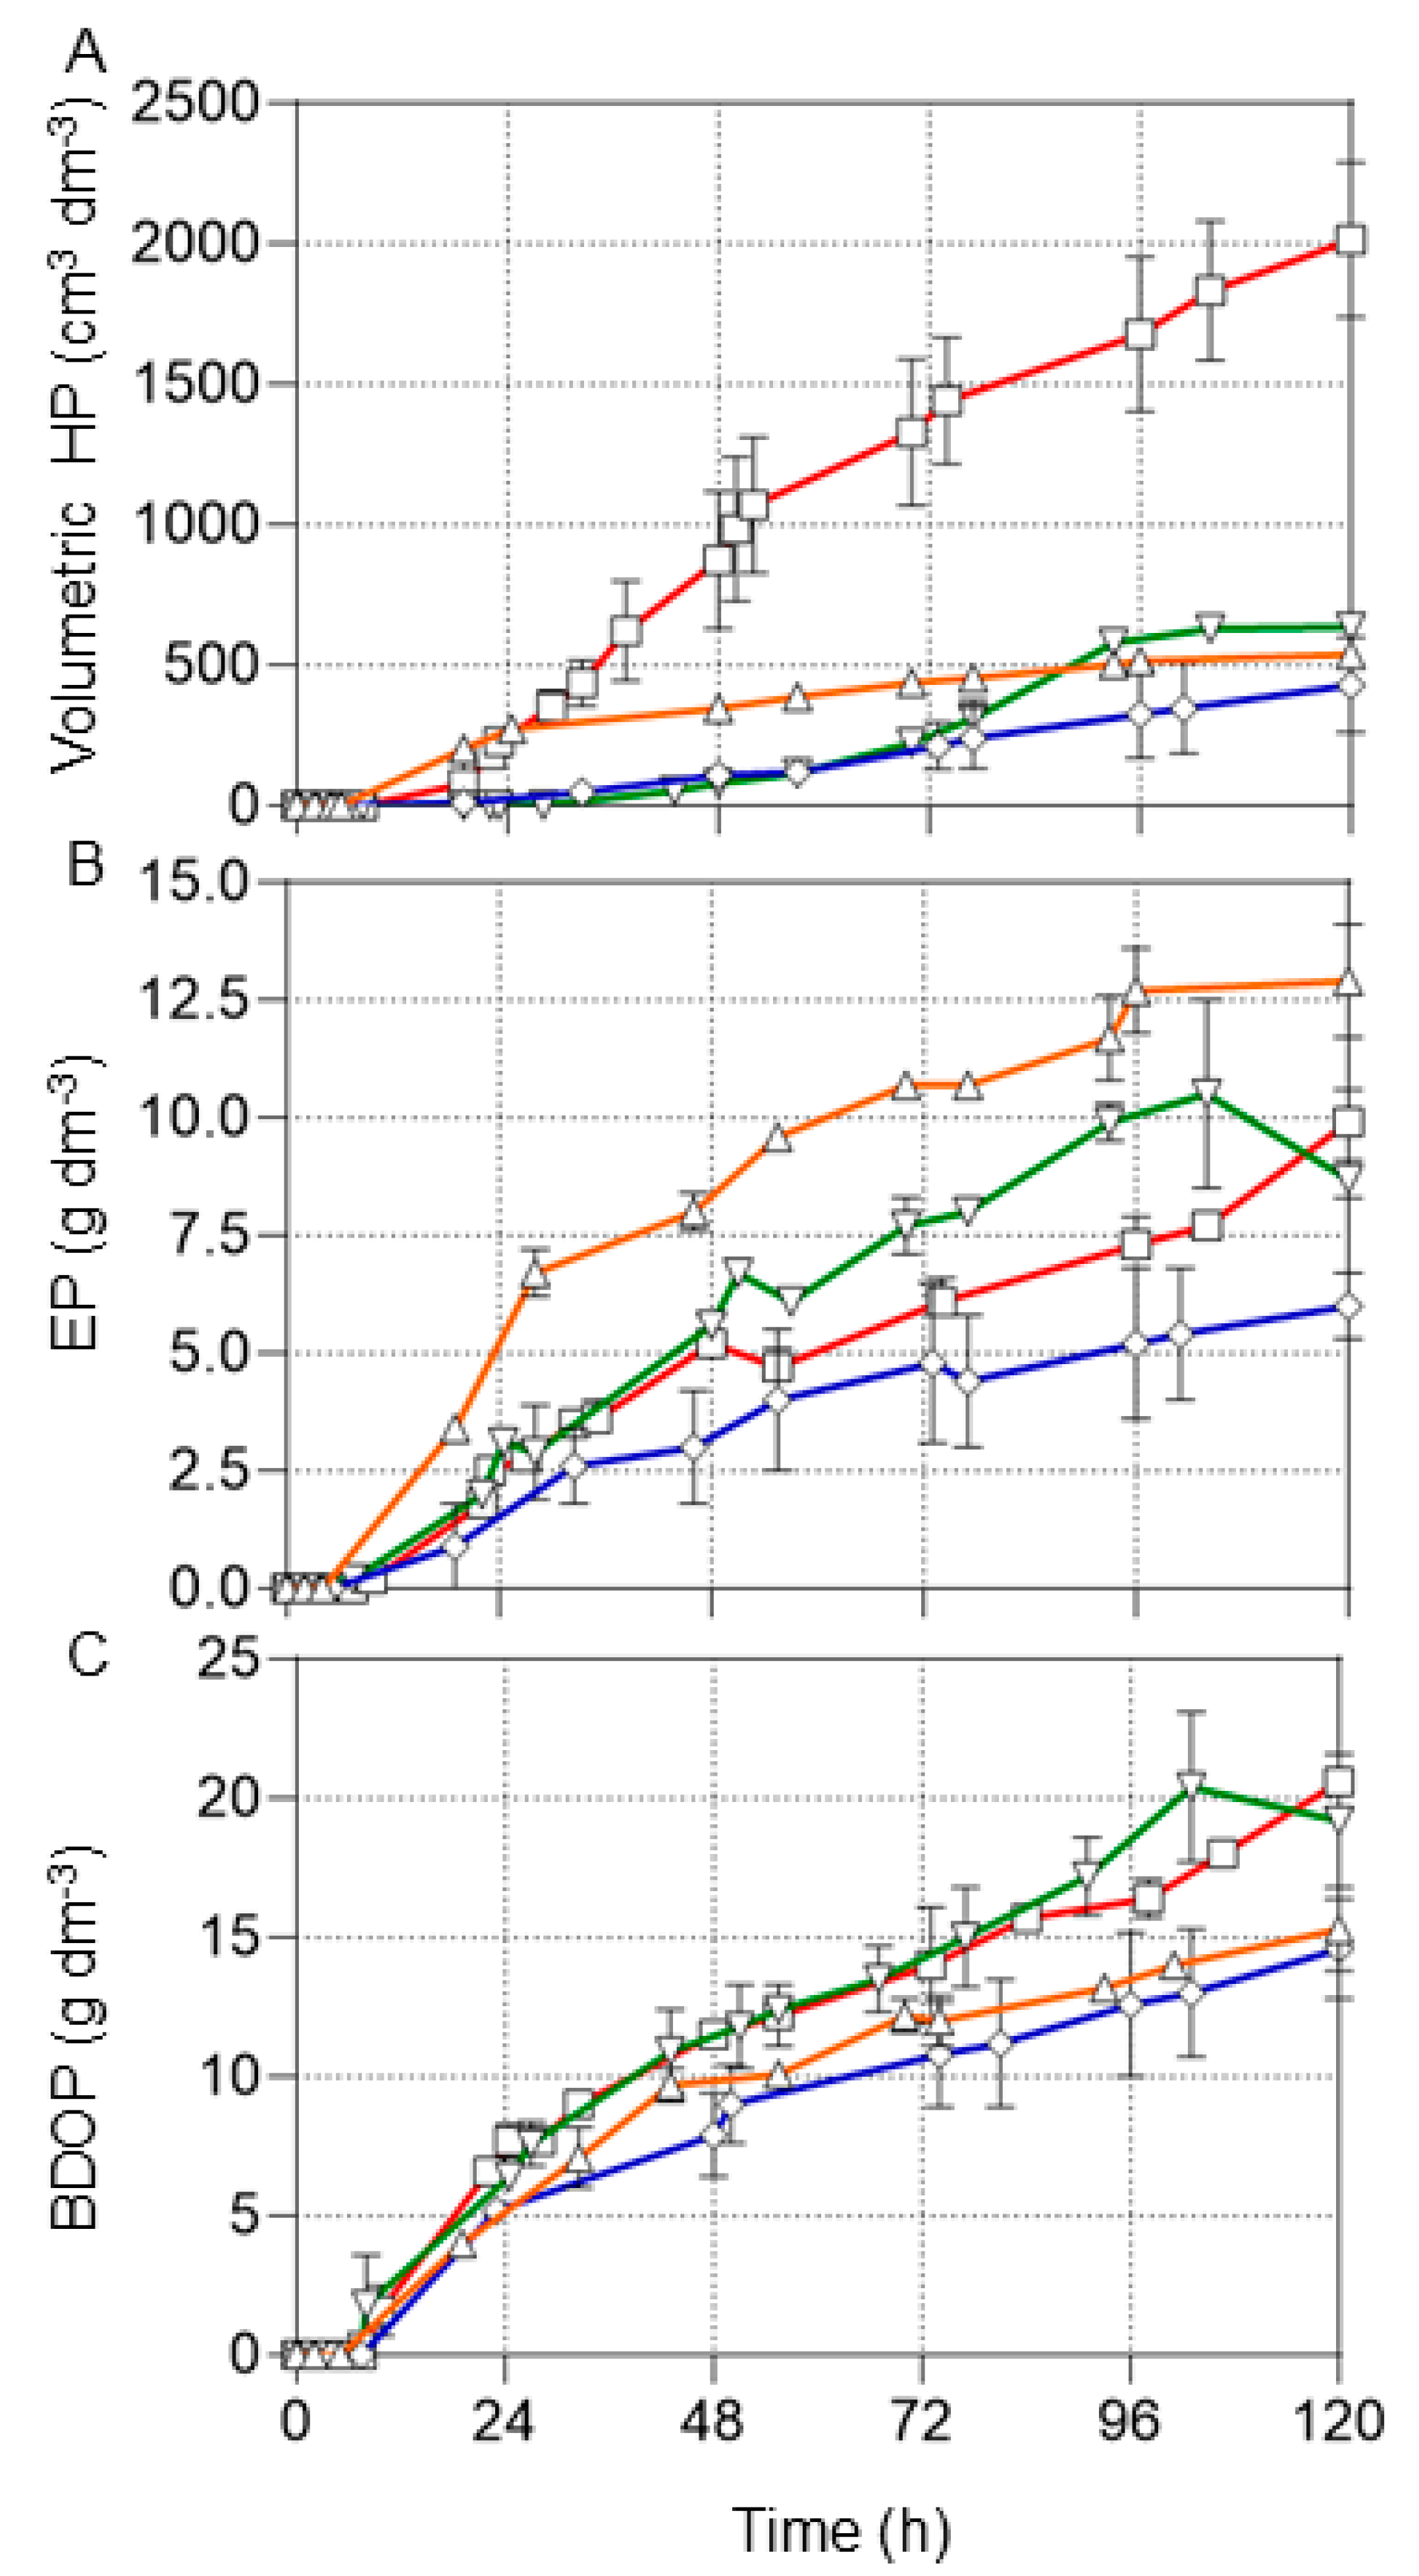
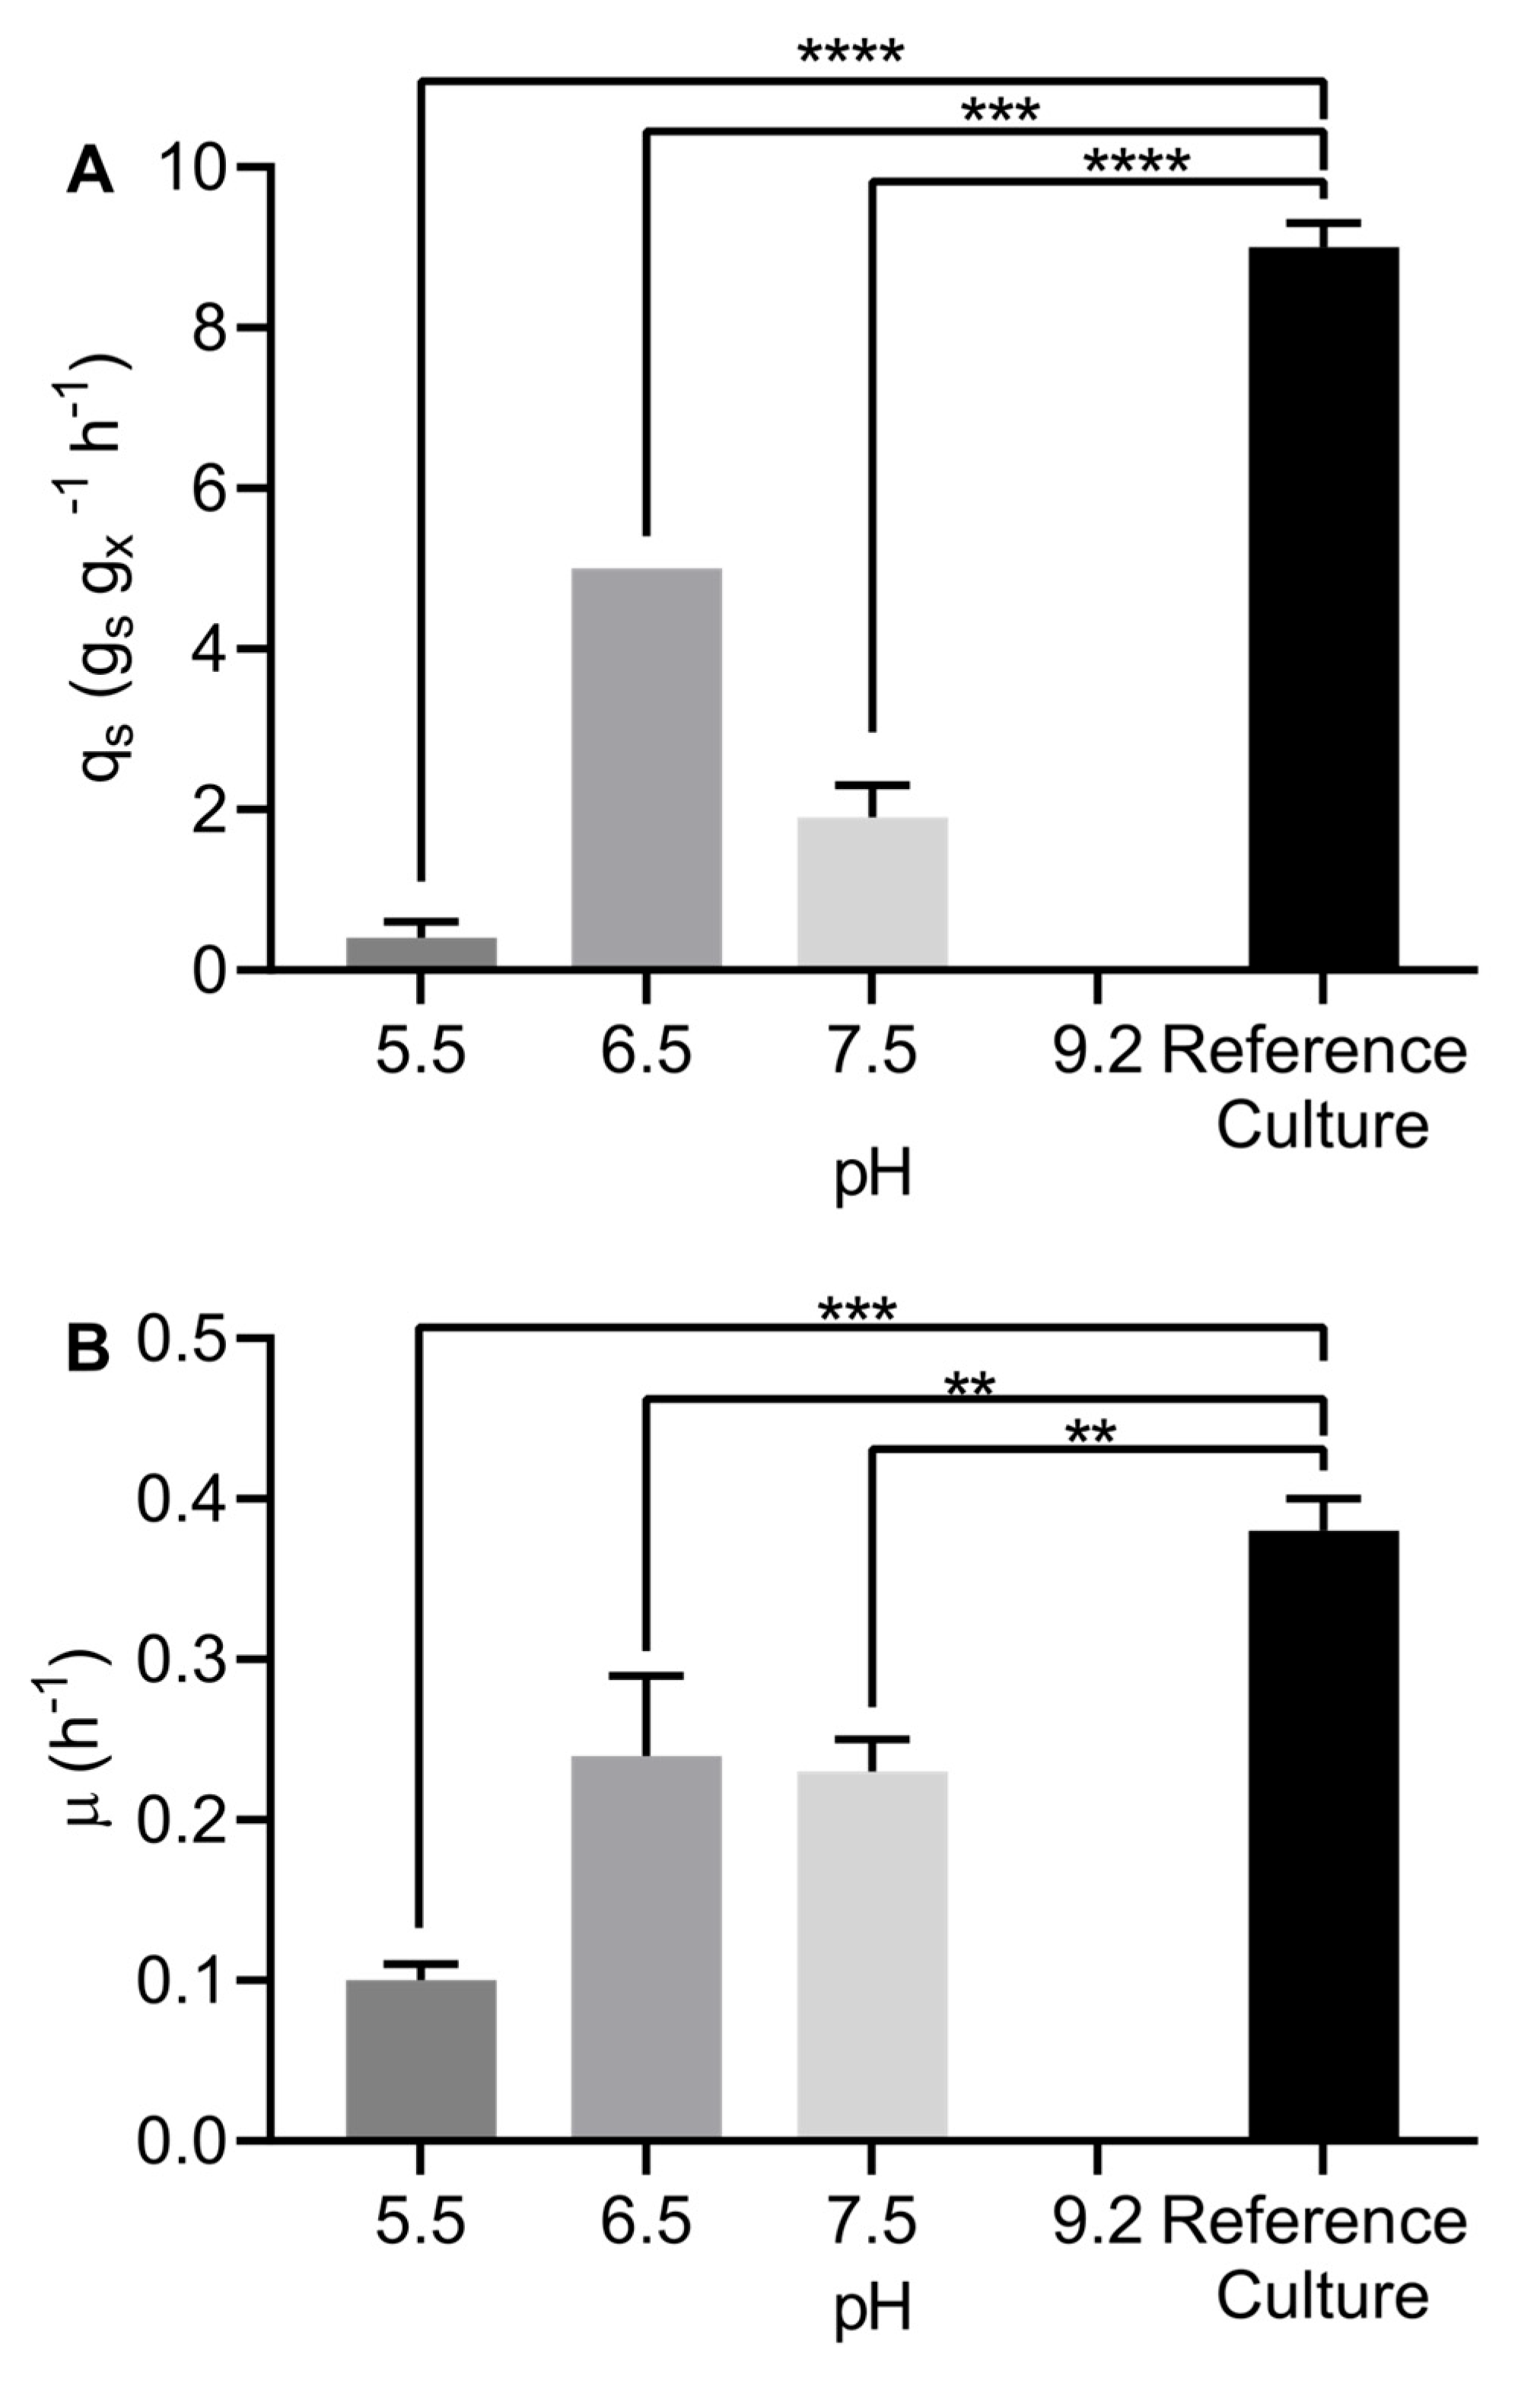
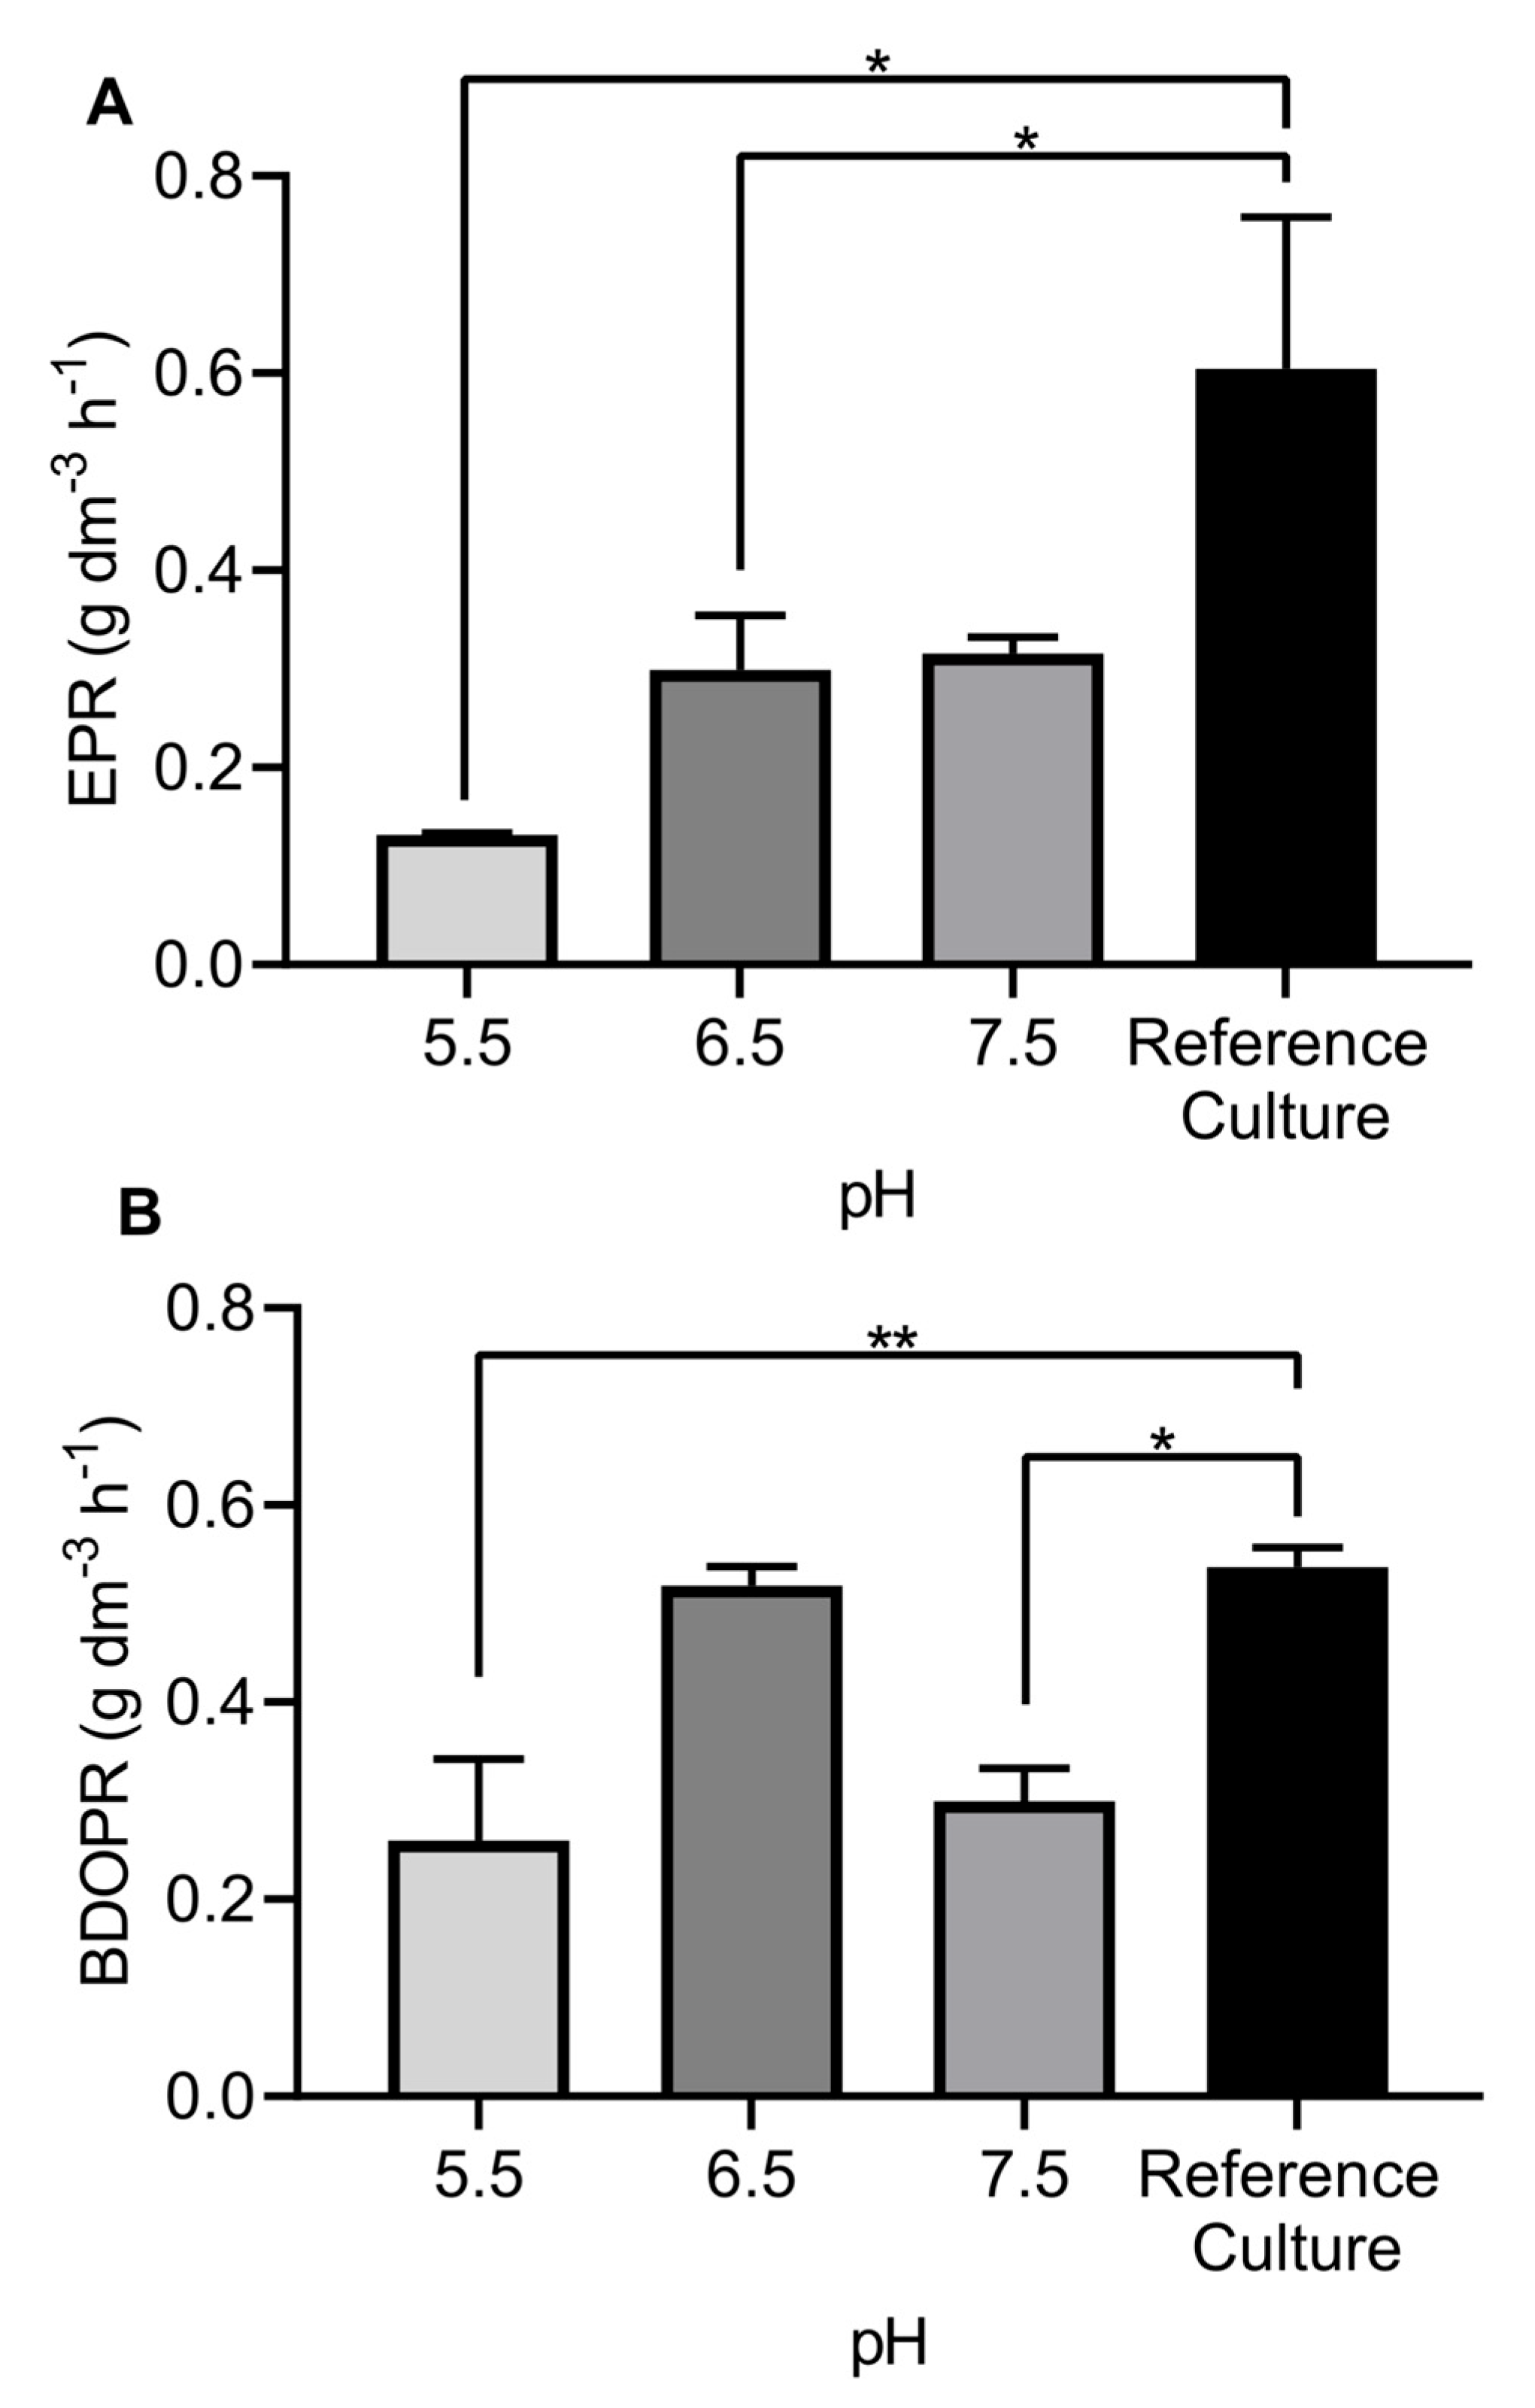
3.2. Effects of pH Control on Production of Biofuels

Figure 2 shows the kinetic fermentations of E. cloacae K1ga under controlled pH at 5.5, 6.5, 7.5, and 9.2 and the reference culture. Regarding the reference culture, which started at pH 9.2, the pH progression was associated with bacterial growth, as observed in Figure 2A,B. The pH decreased to 6.0 in the first 48 h of cultivation and remained at this level until the end of the fermentation (Figure 2A). Figure 2B shows the growth kinetics of E. cloacae K1ga throughout fermentation. The maximum biomass production was 10.1 ± 1.9 g dm−3, achieved by fermentation at pH 7.5 at 96 h. However, fermentations at pH 7.5 showed a drastic fall in biomass production at 48 h from 10.5 ± 2.0 to 3.0 ± 0.3 g dm−3. The reference culture of E. cloacae K1ga reached a maximum biomass production of 6.6 ± 0.7 g dm−3 at 24 h, after which point it continued to slowly increase. A notoriously detrimental effect on biomass was observed to be caused by lower pH values (5.5) and higher pH values (9.2) during the initial hours of fermentation (Figure 2B).
The oxidation–reduction potential (ORP) is shown in Figure 2C, which for all fermentations decreased drastically in the first 24 h within the range of −200 mV to −400 mV. This behaviour is related to cell growth and the accumulation of reduced by-products during the acidogenic phase. At pH 9.2, a subsequent decrease in the ORP to −510 mV at 40 h was observed. After 48 h, the ORP remained relatively stable for all batch cultures, ranging between −300 mV and −400 mV for pH 9.2 and 6.5; ranging from −500 mV to −550 mV for pH 7.5; and being at −230 mV for pH 5.5. The activity of hydrogenases and enzymes involved in hydrogen production, such as ferrodoxins, has been reported to be affected by the ORP. These enzymes catalyse the oxidation of NADH and subsequently the reduction of the 2H+/H2 redox couple with a theoretical electrochemical potential close to −552 mV. Furthermore, it has been demonstrated that an initial ORP reduction close to −322 ± 8 mV globally improves the yield and productivity of H2, reaching 98 ± 5 cm3 H2 g −1 COD initially and 85 ± 3 cm3 dm−3 h−1 of H2 [29].
Figure 3 shows the effects of pH on hydrogen, ethanol, and butanediol production by E. cloacae K1ga during 120 h of fermentation. In general, hydrogen production (HP) began within the first 24 h for batch cultures, just at the moment when the first ORP drop occurred. Fermentations at pH 5.5 attained a maximum HP of 462.4 ± 200 cm3 dm−3, while at pH 7.5 and 6.5, the HP was 543.4 ± 1.45 and 637.2 ± 6.9 cm3 dm−3, respectively. HP and the other biofuel variables were not observed in the bioreactor controlled at pH 9.2, since the high basic pH was detrimental to the enzymatic activities related to the production of biofuels. Figure 3A shows that in the first 60 h, the hydrogen production of the reference culture increased exponentially to 1371 ± 261.6 cm3 dm−3; then the hydrogen production increased linearly until the highest value of 2013.1 ± 275.7 cm3 dm−3 was obtained. We believe that the exponential production of hydrogen behaviour was initiated by an increase in biomass before 24 h (Figure 2B); then after this point the biomass production remained constant until 96 h.
As observed in the reference culture, the natural progression of pH associated with bacterial growth (Figure 2A) was the most promising strategy to improve HP in E. cloacae K1ga. This strategy eliminates the need for strict pH control during hydrogen production. Hydrogen, as previously mentioned, is a promising gas fuel due to all its properties and is expected to contribute 8%–10% of total energy generation worldwide [29].
Regarding ethanol production (EP), a pH of 7.5 increased ethanol production, as the maximum EP of 14.0 ± 0.05 g dm−3 was obtained at pH 7.5. Values close to the maximum EP were obtained by the cultures at pH 6.5 and uncontrolled pH, while at pH 5.5 it was 8.05 ± 0.35 g dm−3, 54% lower than that obtained at pH 7.5 (Figure 3B). Ethanol is a clean and renewable biofuel that can be produced from low-cost and renewable feedstock by dark fermentation [30].
The maximum BDO production (BDOP) of 21.7 ± 1.3 g dm−3 was obtained in reference cultures and a lower production of 18.9 ± 0.55 g dm−3 at pH 5.5 (Figure 3C), confirming that a pH of 5.5 had a negative effect on the fermentative metabolism of E. cloacae K1ga. The production of C2-C4 diols is being sought as an alternative to petroleum-based BDO production. BDO is a promising chemical with direct applications as a liquid fuel and an “octane booster”, enhancing gasoline performance, and also as an antifreeze, antiseptic, and anti-inflammatory agent [12], as well as for chemical products such as plasticisers, cosmetics, pharmaceuticals, and derivatives of the agrochemical industry [11]. BDO is being seen as a bulk chemical, with a process commercialising biobased BDO produced by the fermentation of two substrates, cassava and sugarcane-derived sugars, with an annual production capacity of 300 tons, focused on cosmetics and agrochemical applications [31].
Redirecting carbon flow to desired by-products by eliminating competing metabolic pathways is a key tool. For example, in the biosynthesis of 2,3-BDO, three essential enzymes are involved: acetolactate synthase (budB), acetolactate decarboxylase (budA), and acetoin reductase (budC). In the first pathway, the enzyme α-acetolactate decarboxylase catalyses the transformation of α-acetolactate into acetoin, which subsequently undergoes conversion to BDO mediated by an NADH-dependent acetoin reductase. In the second pathway, α-acetolactate undergoes spontaneous decarboxylation in the presence of oxygen, resulting in the formation of diacetyl, which is subsequently transformed into BDO through an NADH-dependent acetoin reductase [32].
The overproduction of BDO provides metabolic functions at the cellular level, such as (1) preventing intracellular acidification through a metabolic change from the production of organic acids to the production of neutral compounds [33], (2) participation in the regeneration of the NADH/NAD+ pool in the cell, and (3) enabling it to be reused during the stationary phase when other carbon sources or energy sources have been depleted [25].
In this work, we focused on the evaluation of pH control effects on the fermentative metabolism of E. cloacae K1ga, using the optimal pH 9.2, temperature, and glucose concentration of a previously isolated Enterobacter cloacae [23]. As the results indicate, we observed a different fermentative metabolite production profile depending on the fermentation pH. For reference cultures (Figure 4A), we observed constant increases ranging from 2.5 to 4.2 g dm−3 of succinic acid until 48 h and then a gradually increase to 5.8 ± 0.2 g dm−3. We noticed that the formate concentration decreased from 1.5 ± 0.2 g dm−3 to 1.1 ± 0.1 g dm−3; this effect can be explained by the fact that formate is required for hydrogen production through the PFL pathway. Controlled pH 7.5 fermentations showed an unusual maximum production of succinic acid (9.9 ± 0.8 g dm−3) and acetic acid (8.4 ± 0.3 g dm−3). At 36 h, the production of lactic acid and formic acid remained constant at 5.0 g dm−3 during fermentation (Figure 4B). For controlled fermentations at pH 6.5, succinic acid concentration attained a maximum production of 7.0 ± 0.3 g dm−3, while other VFAs remained constant around 2 g dm−3 (Figure 4C). Figure 4D shows that acidic conditions (pH 5.5) almost block the production of VFAs, accumulating only 2.8 ± 0.8 g dm−3 of succinic acid.
Additionally, pH had an impact on substrate consumption; the specific glucose uptake rates (qs) are shown in Figure 5A. This kinetic parameter decreased by 95.5% at pH 5.5 compared to reference cultures and completely blocked glucose consumption in controlled fermentations at pH 9.2. Kim et al. found that E. coli JK32, an ALE-generated strain, had two mutations that were potentially responsible for the novel glucose utilisation phenotype. The first was a nonsense mutation (E126*) in nagC encoding a transcriptional regulator that represses the galP transporter gene and several PTS operons. The second mutation involved a frame-shift mutation that caused an early termination at residue 197 (V196A*) in the gene encoding dihydroxyacetone kinase subunit M (DhaM) [22].
As illustrated in Figure 5B, the specific growth rate (µ) of cultures at pH 5.5 showed a µ of 0.10 ± 0.01 h−1, which means a 4-fold decrease in µ compared to reference cultures (0.38 ± 0.02 h−1). Experiments at pH 7.5 and 6.5 showed a 50% decrease in μ (0.23 ± 0.02 h−1 and 0.24 ± 0.05 h−1, respectively) compared to reference cultures. We believe that reference cultures increased their specific glucose uptake rate through an adaptive evolution process, since the pH value naturally dropped to 6.5 in the reference cultures; thus the µ values should be similar. However, significant differences were observed in both the consumption and growth rates.
Figure 6A shows that the ethanol production rate (EPR) at pH 6.5 was 0.29 ± 0.05 g dm−3 h−1, and at pH 5.5 it was 0.13 ± 0.002 g dm−3 h−1, which were lower than those attained in the reference cultures (0.6 ± 0.15 g dm−3 h−1) (Table 1). On the other hand, the BDO production rate (BDOPR) in fermentations in reference cultures and at pH 6.5 were very similar (Table 1), which were also the highest values observed (0.53 ± 0.02 g dm−3 h−1). At pH 7.5, BDOPR was 0.29 ± 0.03 g dm−3 h−1, whereas at pH 5.5 it was the lowest value obtained with 0.26 ± 0.08 g dm−3 h−1 (Figure 6B).
As observed in Table 1, the production of multiple alcohols had a negative impact on production, productivity, and hydrogen yield because carbon flux and the NADH pool were redirected toward alcohol production. The maximum HP of 2013.1 ± 275.7 cm3 dm−3 was achieved in the reference cultures. The maximum EP value of 14.0 ± 0.05 g dm−3 was achieved at pH 7.5, while BDOP at pH 6.5 and in the reference cultures were 21.7 ± 1.3 and 22.9 ± 2.1 g dm−3, respectively, which are very similar, and these values were the highest. The pH 7.5-controlled cultures showed the highest value of ethanol yield (YH2) of 0.18 ± 0.001 mol mol−1 from all cultivations at the evaluated pH values (Table 1). This slight increase could be explained because nearly optimal pH conditions were used. We noticed that reference cultures reached 8.5% and 60% of the theoretical maximum hydrogen yield (2.0 mol H2 per mol of glucose) and BDO yield value (0.5 g per g of glucose), respectively.

4. Conclusions

To our knowledge, this is the first study to demonstrate the improved production and productivity of biofuels by a glucose-adapted E. cloacae strain generated through gradual increases in glucose, which increases the simultaneous production of hydrogen (2013 ± 275.9 cm3 dm−3), ethanol (9.9 ± 0.7 g dm−3), and BDO (22.9 ± 2.1 g dm−3) and improves the HPR, EPR, and BDOPR compared to controlled pH cultures. Controlled pH 5.5 cultures decreased qs and µ by 95.5% and 75% compared to reference cultures, respectively. The results suggest that the best strategy for multi-biofuel production by E. cloacae K1ga is to start the culture at pH 9.2 and allow it to decline naturally. Therefore, it is not necessary to implement pH control strategies, which could be an operative advantage for large-scale processes.

Author Contributions

Conceptualisation, A.D.L.-R.; methodology, F.F.-M. and K.L.M.-R.; formal analysis, F.F.-M. and K.L.M.-R.; investigation, F.F.-M.; resources, A.D.L.-R.; data curation, F.F.-M. and K.L.M.-R.; writing—original draft preparation, F.F.-M.; writing—review and editing, A.D.L.-R. and V.E.B.-H.; supervision, A.D.L.-R. and V.E.B.-H.; project administration, A.D.L.-R. and V.E.B.-H. All authors have read and agreed to the published version of the manuscript.

Funding

This research was partially funded by CONACyT-Básicas, Grant number 281700.

Institutional Review Board Statement

Not applicable.

Informed Consent Statement

Not applicable.

Data Availability Statement

The original contributions presented in this study are included in the article. Further inquiries can be directed to the corresponding author.

Acknowledgments

Flores-Montiel Francisco thanks CONAHCyT for his fellowship 932036 and Lucy R. McKenna for help with English revision.

Conflicts of Interest

The authors declare no conflicts of interest.

References

  1. Muhammed, N.S.; Gbadamosi, A.O.; Epelle, E.I.; Abdulrasheed, A.A.; Haq, B.; Patil, S.; Al-Shehri, D.; Kamal, M.S. Hydrogen production, transportation, utilization, and storage: Recent advances towards sustainable energy. J. Energy Storage 2023, 73, 109207. [Google Scholar] [CrossRef]
  2. Phillips, S.D. Technoeconomic Analysis of a Lignocellulosic Biomass Indirect Gasification Process to Make Ethanol via Mixed Alcohols Synthesis. Ind. Eng. Chem. Res. 2007, 46, 8887–8897. [Google Scholar] [CrossRef]
  3. Toledo-Alarcón, J.; Capson-Tojo, G.; Marone, A.; Paillet, F.; Ferraz Júnior, A.D.N.; Chatellard, L.; Bernet, N.; Trably, E. Basics of bio-hydrogen production by dark fermentation. Green Energy Technol. 2018, 199–220. [Google Scholar] [CrossRef]
  4. Sánchez-Pascuala, A.; De Lorenzo, V.; Nikel, P.I. Refactoring the Embden—Meyerhof-Parnas Pathway as a Whole of Portable GlucoBricks for Implantation of Glycolytic Modules in Gram-Negative Bacteria. ACS Synth. Biol. 2017, 6, 793–805. [Google Scholar] [CrossRef]
  5. Kumar, G.; Shobana, S.; Nagarajan, D.; Lee, D.J.; Lee, K.S.; Lin, C.Y.; Chen, C.Y.; Chang, J.S. Biomass Based Hydrogen Production by Dark Fermentation—Recent Trends and Opportunities for Greener Processes. Curr. Opin. Biotechnol. 2018, 50, 136–145. [Google Scholar] [CrossRef]
  6. Ju, J.H.; Jo, M.H.; Heo, S.Y.; Kim, M.S.; Kim, C.H.; Paul, N.C.; Sang, H.; Oh, B.R. Production of Highly Pure R,R-2,3-Butanediol for Biological Plant Growth Promoting Agent Using Carbon Feeding Control of Paenibacillus Polymyxa MDBDO. Microb. Cell Factories 2023, 22, 121. [Google Scholar] [CrossRef]
  7. Łukajtis, R.; Hołowacz, I.; Kucharska, K.; Glinka, M.; Rybarczyk, P.; Przyjazny, A.; Kamiński, M. Hydrogen Production from Biomass Using Dark Fermentation. Renew. Sustain. Energy Rev. 2018, 91, 665–694. [Google Scholar] [CrossRef]
  8. Liao, J.C.; Mi, L.; Pontrelli, S.; Luo, S. Fuelling the Future: Microbial Engineering for the Production of Sustainable Biofuels. Nat. Rev. Microbiol. 2016, 14, 288–304. [Google Scholar] [CrossRef]
  9. Ghimire, A.; Frunzo, L.; Pirozzi, F.; Trably, E.; Escudie, R.; Lens, P.N.L.; Esposito, G. A Review on Dark Fermentative Biohydrogen Production from Organic Biomass: Process Parameters and Use of by-Products. Appl. Energy 2015, 144, 73–95. [Google Scholar] [CrossRef]
  10. Isikgor, F.H.; Becer, C.R. Lignocellulosic biomass: A sustainable platform for production of bio-based chemicals and polymers. Polym. Chem. 2015, 6, 4497–4559. [Google Scholar] [CrossRef]
  11. Jang, Y.S.; Kim, B.; Shin, J.H.; Choi, Y.J.; Choi, S.; Song, C.W.; Lee, J.; Park, H.G.; Lee, S.Y. Bio-Based Production of C2-C6 Platform Chemicals. Biotechnol. Bioeng. 2012, 109, 2437–2459. [Google Scholar] [CrossRef]
  12. Song, C.W.; Park, J.M.; Chung, S.C.; Lee, S.Y.; Song, H. Microbial Production of 2,3-Butanediol for Industrial Applications. J. Ind. Microbiol. Biotechnol. 2019, 46, 1583–1601. [Google Scholar] [CrossRef]
  13. Chiariotti, A.; Crisà, A. Bio-hydrogen production from buffalo waste with rumen inoculum and metagenomic characterization of bacterial and archaeal community. Front. Sustain. Food Syst. 2018, 2, 354674. [Google Scholar] [CrossRef]
  14. Singh, S.; Thavamani, P.; Megharaj, M.; Naidu, R. Multifarious Activities of Cellulose Degrading Bacteria from Koala (Phascolarctos cinereus) Faeces. J. Anim. Sci. Technol. 2015, 57, 23. [Google Scholar] [CrossRef]
  15. Osawa, R.; Blanshard, W.H.; O’callaghan, P.G. Microbiological Studies of the Intestinal Microflora of the Koala, Phascolarctos Cinereus. II. Pap, a Special Maternal Faeces Consumed by Juvenile Koalas. Aust. J. Zool. 1993, 41, 527–536. [Google Scholar] [CrossRef]
  16. Cork, S.J.; Hume, I.D.; Dawson, T.J. Digestion and Metabolism of a Natural Foliar Diet (Eucalyptus punctata) by an Arboreal Marsupial, the Koala (Phascolarctos cinereus). J. Comp. Physiol. B 1983, 153, 181–190. [Google Scholar] [CrossRef]
  17. Shiffman, M.E.; Soo, R.M.; Dennis, P.G.; Morrison, M.; Tyson, G.W.; Hugenholtz, P. Gene and genome-centric analyses of koala and wombat fecal microbiomes point to metabolic specialization for eucalyptus digestion. PeerJ 2017, 5, e4075. [Google Scholar] [CrossRef]
  18. Palaiogeorgou, A.M.; Papanikolaou, S.; De Castro, A.M.H.; Freire, D.M.G.; Kookos, I.K.; Koutinas, A.A. A newly isolated Enterobacter sp. strain produces 2,3-butanediol during its cultivation on low-cost carbohydrate-based substrates. FEMS Microbiol. Lett. 2019, 366, fny280. [Google Scholar] [CrossRef]
  19. Shi, A.; Fan, F.; Broach, J.R. Microbial adaptive evolution. J. Ind. Microbiol. Biotechnol. 2022, 49, kuab076. [Google Scholar] [CrossRef]
  20. Maeda, T.; Furusawa, C. Laboratory evolution of antimicrobial resistance in bacteria to develop rational treatment strategies. Antibiotics 2024, 13, 94. [Google Scholar] [CrossRef]
  21. Hirasawa, T.; Maeda, T. Adaptive laboratory evolution of microorganisms: Methodology and application for bioproduction. Microorganisms 2023, 11, 92. [Google Scholar] [CrossRef] [PubMed]
  22. Kim, J.; Tremaine, M.; Grass, J.A.; Purdy, H.M.; Landick, R.; Kiley, P.J.; Reed, J.L. Systems metabolic engineering of Escherichia coli improves coconversion of lignocellulose-derived Sugars. Biotechnol. J. 2019, 14, e1800441. [Google Scholar] [CrossRef]
  23. Flores-Montiel, F.; Balderas-Hernández, V.E.; Rosales-Colunga, L.M.; De León-Rodríguez, A. Simultaneous production of biohydrogen, bioethanol, and bio-2,3-butanediol by enterobacter cloacae K1 isolated from koala using glucose as substrate. Int. J. Hydrogen Energy 2025, 101, 826–836. [Google Scholar] [CrossRef]
  24. Davila-Vazquez, G.; de León-Rodríguez, A.; Alatriste-Mondragón, F.; Razo-Flores, E. The buffer composition impacts the hydrogen production and the microbial community composition in non-axenic cultures. Biomass Bioenergy 2011, 35, 3174–3181. [Google Scholar] [CrossRef]
  25. Lu, P.; Bai, R.; Gao, T.; Chen, J.; Jiang, K.; Zhu, Y.; Lu, Y.; Zhang, S.; Xu, F.; Zhao, H. Systemic metabolic engineering of Enterobacter aerogenes for efficient 2,3-butanediol production. Appl. Microbiol. Biotechnol. 2024, 108, 146. [Google Scholar] [CrossRef]
  26. Julkipli, J.; Babel, S.; Bilyaminu, A.M.; Rene, E.R. Hydrogen and biodiesel production from food waste: A review. Environ. Chem. Lett. 2024, 22, 585–607. [Google Scholar] [CrossRef]
  27. Kim, K.; Choe, D.; Kang, M.; Cho, S.H.; Cho, S.; Jeong, K.J.; Palsson, B.; Cho, B.K. Serial adaptive laboratory evolution enhances mixed carbon metabolic capacity of Escherichia coli. Metab. Eng. 2024, 83, 160–171. [Google Scholar] [CrossRef]
  28. Corrao, M.; Abrahams, G.; Steel, H. Optimised control of adaptive evolution with competing selective pressures. bioRxiv, 2024; preprint. [Google Scholar] [CrossRef]
  29. Dongare, P.P.; Pawar, H.S. Biohydrogen Production from Dark Fermentation of Lignocellulosic Biomass; Elsevier Inc.: Amsterdam, The Netherlands, 2023; ISBN 9780128243183. [Google Scholar]
  30. Sawasdee, V.; Vikromvarasiri, N.; Pisutpaisal, N. Optimization of ethanol production from co-substrate of waste glycerol and acetic acid by enterobacter aerogenes. Biomass Convers. Biorefin. 2023, 13, 10505–10512. [Google Scholar] [CrossRef]
  31. Ewing, T.A.; Nouse, N.; van Lint, M.; van Haveren, J.; Hugenholtz, J.; van Es, D.S. Fermentation for the production of biobased chemicals in a Circular Economy: A Perspective for the Period 2022–2050. Green Chem. 2022, 24, 6373–6405. [Google Scholar] [CrossRef]
  32. Lu, P.; Gao, T.; Bai, R.; Yang, J.; Xu, Y.; Chu, W.; Jiang, K.; Zhang, J.; Xu, F.; Zhao, H. Regulation of carbon flux and NADH/NAD+ supply to enhance 2,3-butanediol production in enterobacter aerogenes. J. Biotechnol. 2022, 358, 67–75. [Google Scholar] [CrossRef] [PubMed]
  33. Celińska, E.; Grajek, W. Biotechnological production of 2,3-butanediol-current state and prospects. Biotechnol. Adv. 2009, 27, 715–725. [Google Scholar] [CrossRef] [PubMed]
Figure 1. Growth profile of parental E. cloacae K1 (triangles) and glucose-adapted E. cloacae K1ga (circles) cultured in mineral medium supplemented with 100 g dm−3 of glucose. Bars indicate standard deviation (n = 3).
Fermentation 11 00357 g001
Figure 2. Effects of pH on growth of E. cloacae K1ga using 79 g dm−3 of glucose and 28.5 °C in batch cultures. (A) Real-time monitoring of pH control in bioreactors during fermentation process. (B) Growth kinetics plotted in g dm−3 of E. cloacae K1ga. Symbols: reference cultures (square); controlled pH 9.2 (circle), pH 7.5 (triangle), pH 6.5 (inverted triangle), and pH 5.5 (diamond). (C) Redox potential kinetics plotted in mV for fermentations at pH 9.2 (red line), pH 7.5 (orange line), pH 6.5 (green line), and pH 5.5 (blue line). Bars indicate standard deviation (n = 3).
Fermentation 11 00357 g002
Figure 3. Effects of pH on production of hydrogen, ethanol, and butanediol by E. cloacae K1ga during 120 h of fermentation. (A) Volumetric hydrogen production (HP), (B) ethanol production (EP), and (C) butanediol production (BDOP). Symbols: fermentations at pH 7.5 (triangle); pH 6.5 (inverted triangle); pH 5.5 (diamond); and reference culture (square). Bars indicate standard deviation (n = 3).
Fermentation 11 00357 g003
Figure 4. Effects of pH on fermentative metabolite production kinetics by E. cloacae K1ga. (A) Reference culture (9.2); (B) controlled pH 7.5, (C) pH 6.5, and (D) pH 5.5. Symbols: succinic acid (triangle), lactic acid (square), acetic acid (inverted triangle), and formic acid (circle). Bars indicate standard deviation (n = 3).
Fermentation 11 00357 g004
Figure 5. Comparison of kinetic parameters for E. cloacae K1ga fermentations at controlled pH (5.5, 6.5, 7.5, and 9.2) and reference culture. (A) Specific glucose uptake rate (qs). (B) Specific growth rate (µ). ANOVA test was performed using Dunnett’s multiple comparison test, ** p < 0.025, *** p < 0.001, **** p < 0.0001. Bars indicate standard deviation (n = 3).
Fermentation 11 00357 g005
Figure 6. Comparison of ethanol production rate (EPR) and butanediol production rate (BDOPR). (A) shows that controlled pH (6.5) and 7.5 bioreactors showed 50% decrease in EPR compared to reference cultures (pH 9.2). (B) BDOPR at controlled pH (5.5, 6.5, 7.5, and 9.2) and reference cultures. BDOPR at 6.5 and reference cultures was similar (0.5 g dm−3 h−1), while 50% decrease was observed in fermentations at pH 5.5 and 7.5 compared to reference cultures. ANOVA test was performed using Dunnett’s multiple comparison test, * p < 0.05, ** p < 0.025. Bars indicate standard deviation (n = 3).
Fermentation 11 00357 g006
Table 1. Comparison of production, production rate, and yield for hydrogen, ethanol, and BDO in controlled pH bioreactors (5.5, 6.5, and 7.5) and reference cultures by E. cloacae K1ga using glucose 79 g dm−3 at 28.5 °C.
ParameterpH 5.5pH 6.5pH 7.5Reference Culture
HP (cm3 dm−3) a462.4 ± 200637.2 ± 6.9543.4 ± 1.452013.1 ± 275.7
EP (g dm−3) b8.05 ± 0.3511.4 ± 1.114.0 ± 0.059.9 ± 0.7
BDOP (g dm−3) c18.9 ± 0.5521.7 ± 1.317.1 ± 0.3522.9 ± 2.1
HPR (cm3 dm−3 h−1) d4.0 ± 1.26.3 ± 0.0510.5 ± 2.521.1 ± 6.3
EPR (g dm−3 h−1) e0.13 ± 0.0020.29 ± 0.050.31 ± 0.010.6 ± 0.15
BDOPR (g dm−3 h−1) f0.26 ± 0.080.51 ± 0.020.29 ± 0.030.53 ± 0.02
YH2 (mol mol−1) g0.06 ± 0.0050.05 ± 0.0020.04 ± 0.000.17 ± 0.02
YEtOH (g g−1) h0.12 ± 0.0050.14 ± 0.0140.18 ± 0.0010.13 ± 0.009
YBDO (g g−1) i0.28 ± 0.0080.27 ± 0.0160.22 ± 0.0040.3 ± 0.03
a Hydrogen production (HP), b ethanol production (EP), c butanediol production (BDOP), d hydrogen production rate (HPR), e ethanol production rate (EPR), f butanediol production rate (BDOPR), g hydrogen yield (YH2), h ethanol yield (YEtOH), i butanediol yield (YBDO). In the bioreactor controlled at pH 9.2, biofuel parameters were not observed, since a high basic pH was detrimental to the production of biofuels.
Disclaimer/Publisher’s Note: The statements, opinions and data contained in all publications are solely those of the individual author(s) and contributor(s) and not of MDPI and/or the editor(s). MDPI and/or the editor(s) disclaim responsibility for any injury to people or property resulting from any ideas, methods, instructions or products referred to in the content.

