Article

Microbiota Diversity During Grape Drying and Spontaneous Fermentations of Vin Santo

1
FoodMicroTeam s.r.l., Academic Spin-Off of the University of Florence, Via Santo Spirito, 14-50125 Florence, Italy
2
Department of Agriculture, Food, Environment and Forestry (DAGRI), Via San Bonaventura, 13-50145 Florence, Italy
*
Author to whom correspondence should be addressed.
Fermentation 2025, 11(6), 310; https://doi.org/10.3390/fermentation11060310
Submission received: 9 May 2025 / Revised: 22 May 2025 / Accepted: 27 May 2025 / Published: 29 May 2025

Abstract

Vin Santo is a passito wine produced mainly in Tuscany. In the traditional production of Vin Santo, fermentation occurs naturally. Only a few reports have explored the microbial ecology of Vin Santo. Therefore, the present study aimed to investigate the microbial ecology and its impact on the fermentative kinetics in traditional processes of Vin Santo carried out in two different Tuscan wineries. Despite the different systems used for drying the grapes, both wineries showed similar microbial ecology. Non-Saccharomyces yeasts were the dominant microbial population during grape drying in different succession, even though in the end, the dominant species (at different percentages) in both were Metschnikowia pulcherrima, Kloeckera apiculata, and Starmerella bacillaris. The spontaneous fermentations were instead both dominated by Saccharomyces cerevisiae, however in different concentration throughout the process, leading to a different ethanol content—12% (v/v) and 10.8% (v/v) in winery A and B, respectively. In both wineries, acetic bacteria and moulds did not grow. Considering the intraspecific biodiversity of S. cerevisiae populations, the vinifications of both wineries displayed very similar biodiversity indices. No single strain of S. cerevisiae dominated the entire fermentation process. The analysis identified 30 distinct genetic patterns in the fermentations of winery A and 23 in the fermentations of winery B. The work provided an insight into the microbial communities and their metabolomic interactions during Vin Santo production which could improve the management and control of the process.

1. Introduction

Wines made from dried grapes, known as passito wines, have been a century-long tradition in many countries [1]. One example is Vin Santo, a typical passito wine produced not only in Tuscany but also in central and northern Italy, as well as on the Greek island of Santorini [2]. The production of Vin Santo involves several phases: harvesting and selecting the grapes, drying them (appassimento) in shaded, ventilated rooms or under fully controlled environmental conditions, pressing the healthy grapes, and filling barrels to carry out alcoholic fermentation and ageing for 2–4, or even more, years. The barrels, known as “caratelli”, are traditional wooden vessels, typically made from chestnut, oak, or cherry, with a capacity ranging from 50 to 200 L, which are kept in the cellar or “vinsantaia”, a traditional ventilated room. As a result, they are exposed to seasonal temperature variations [2,3]. Although Vin Santo is a niche and traditional product, its production has increased over the years, which is in line with the general increase in demand for passito wines [2]. The EU regulates Italian Vin Santo as a Quality Wine Produced in Specific Regions under the specific Protected Designation of Origin (PDO) [4,5]. Due to its lack of standardization, Vin Santo’s characteristics can vary significantly depending on the winemaking process. A crucial aspect in the Vin Santo production is the high probability of having stuck or slow fermentations because of the high sugar content (over 300 g/L) associated with high concentrations of organic acids, polyphenols, metal ions such as copper, and by-products from the Maillard reaction [6,7]. In this context, few scientific studies have explored the microbiota of Vin Santo production and its effects on its chemical properties [2,8]. Unlike other passito wines [1], the traditional production of Vin Santo usually does not involve starter yeasts; instead, fermentation occurs naturally with the yeasts present on the grapes and in the cellar. The dried grape juice can be enriched with 5–10% of the sediment, known as the “madre”, collected from the barrels at the end of the ageing of the previous Vin Santo vintage. This sediment appeared to have no direct role as a microbial starter in Vin Santo production, not providing metabolically active Saccharomyces cerevisiae populations, but only yeasts belonging to the genus Zygosaccharomyces after 3 years of ageing. However, the presence of lipids and other nutritional factors in the sediment seems to have an indirect role in promoting yeast growth and persistence [3]. Grapes are a primary source of microorganisms, and many studies have shown that spontaneous wine fermentation starts with the dominant yeast species occurring on grapes at harvest time and/or during the drying [9,10,11,12]. Despite this, little information is available on the microbiota during spontaneous Vin Santo fermentations, even if some recent studies have been conducted on other passito wines. The most abundant species found on dried Nebbiolo grapes for ‘Sforzato di Valtellina’ production were Hanseniaspora uvarum, followed by Metschnikowia spp. and Starmerella bacillaris [13]. As reported by de Filippis et al. [1], the microbial community of Falanghina sweet passito wine at the beginning of the fermentation was mainly represented by Aureobasidium, Cladosporium, Sclerotinia, while Candida, Debaryomyces, Hanseniaspora, Metschnikowia, Pichia, Saccharomyces and Zygosaccharomyces showed a very low incidence. Hanseniaspora vineae and/or Hanseniaspora uvarum grew after almost 30 days of fermentation, while S. cerevisiae occurred in all the phases but became dominant only in the last stages of alcoholic fermentation. A wide diversity of autochthonous yeasts of oenological relevance was also found during spontaneous fermentations in Tostado sweet wine from Galicia, such as Lachancea thermotolerans, Starmerella bacillaris, Hanseniaspora uvarum, Debaryomyces hansenii, Torulaspora delbrueckii, Pichia spp., and Saccharomyces cerevisiae, the latter characterized by 19 different dominant strains [14]. Although the above-reported investigations provided insight into the primary yeast indigenous species involved in the production of passito wines, there is little information available regarding the microbial dynamics and their subsequent influence on the chemical characteristics during the fermentation and ageing of this kind of wine except for some studies conducted on the aromatic profiles [1,5,8,15]. As reported in the literature, these indigenous yeasts are often inadequate or too stressed by the high osmotic conditions of the grape must to effectively carry out the fermentation process, resulting in low-quality sweet wines with high residual sugar content, low alcohol content, and pronounced “solvent/chemical” notes [1,13,16]. For these reasons, some authors suggest the selection of indigenous yeasts, preferring mixed cultures consisting of S. cerevisiae and non-Saccharomyces yeasts to improve passito wine quality by modulating specific wine attributes and completing the fermentation process without the risk of stuck fermentation [13]. However, to effectively manage Vin Santo production with or without the employment of yeast starters, it is essential to have a deep understanding of the microbial ecology of the process, from grape drying to barrel ageing. To our knowledge, only a few reports on this topic have been published. Therefore, the present study aimed to investigate the microbiota and, in particular, the yeasts and their impact on the fermentative kinetics in traditional processes of Vin Santo carried out in two different Tuscan wineries.

2. Materials and Methods

2.1. Winemaking

The winemaking process is reported in Figure S1. From each vineyard of two wineries in the Chianti Classico region (A and B), 500 kg of grapes from both the Trebbiano and Malvasia del Chianti varieties were handpicked. The grapes were dried after harvesting in a well-ventilated room (known as fruttaio). The clarified must from winery A was immediately transferred to oak wooden barrels of two different capacities (50 and 100 L), filled to 80% of their volume, sealed tightly, and left to ferment spontaneously. On the contrary, in winery B, the clarified must was transferred to the oak wooden barrels of two different capacities (50 and 100 L), after ten days of fermentation in demijohns.

2.2. Microbial Analysis

Wine microorganisms were quantified as reported by Guerrini et al. [17]. Yeasts were quantified on WL Nutrient Agar medium (Thermo Fisher Scientific, Waltham, MA, USA) and Lysine Agar (Oxoid Ltd., Basingstoke, Hampshire, UK), both integrated with sodium propionate (VWR International S.r.l., Milan, Italy) (2 g/L) and streptomycin (VWR International S.r.l., Milan, Italy) (30 mg/L) to inhibit mould and bacteria growth, respectively. The plates were incubated for 48–72 h at 28 °C in aerobic conditions. Lactic acid bacteria were quantified on MRS Agar medium (Thermo Fisher Scientific, Waltham, MA, USA), supplemented with 50 mg/L of pimaricin as a yeast inhibitor, and incubated for 5 days at 30 °C under anaerobic conditions. Acetic acid bacteria were quantified on a Lafon-Lafourcade medium supplemented with pimaricin (50 mg/L) as a yeast inhibitor and incubated for three days at 30 °C in aerobic conditions. Brettanomyces bruxellensis was quantified on DBDM medium (Dekkera/Brettanomyces Differential Medium) containing 6.7 g/L 80 YNB (Yeast Nitrogen Base, Difco), ethanol (6% v/v), 10 mg/L cycloheximide, 100 mg/L p-coumaric acid, 22 mg/L bromocresol green and 20 g/L agar at 28 °C for 5 days in aerobiosis. Finally, moulds were counted on MYPG agar (malt extract 5 g/L, yeast extract 3 g/L, meat extract 5 g/L, glucose 10 g/L and 20 g/L agar) after incubation at 30 °C for 24–48 h. Two samples from each sampling point were subjected to microbial analyses.

2.3. Microbial Identification and Typing of Yeast Strains

After purification by successive streaking on Petri plates, yeast isolates were identified by PCR–RFLP as described by Granchi et al. [18]. The 5.8S rRNA gene and the two ribosomal internal transcribed spacers (ITS) were amplified using the primer pair ITS1/ITS4 and the amplicons were digested with the restriction enzyme HaeIII (Life Technologies Italia, Monza, Italy). To confirm the identification obtained by PCR–RFLP, the D1-D2 rDNA region products were purified using Nucleo Spin Extract II (Macherey-Nagel GmbH & Co. KG, Düren, Germany) and sent to BMR Genomics (Padua, Italy) for sequencing.
Bacteria were identified by Amplified Ribosomal DNA Restriction Analysis (ARDRA). DNA was extracted, and the 16S rDNA gene was amplified using the primers FD1 (5′ CAACAGAGTTTGATCCTGGCTCAG 3′) and RD1 (5′ GCTTAAGGAGGTGATCCAGCC 3′). The amplicons were purified using Nucleo Spin Extract II (Macherey-Nagel GmbH & Co. KG, Düren, Germany) and sent to BMR Genomics (Padua, Italy) for sequencing.
All the sequences in FASTA format obtained for yeasts and bacteria were compared with those contained in the GenBank DNA database (http://www.ncbi.nlm.nih.gov/ (accessed on 14 March 2024 and 28 February 2025)) using the basic BLAST search tools (version 2.8.1).
Saccharomyces cerevisiae isolates were also characterized at strain level by inter-δ PCR typing with δ12/δ21 primer pair (Thermo Fisher Diagnostics S.p.A., Rodano, Milan, Italy) as reported by Legras and Karst [19]. The genomic patterns were submitted for pairwise comparison using the Dice coefficient and cluster analysis with the unweighted pair group method (UPGMA) by Gel Compare 4.0 software (Applied Math, Kortrijk, Belgium). S. cerevisiae diversity was quantified by using the two indices “H” and “e”, as proposed by Shannon and Weaver [20].
Non-Saccharomyces isolates were characterized at strain level by Randomly Amplified Polymorphic DNA (RAPD) analysis by using the primer M13 (50-GAGGGTGGCGGTTCT-30), while the species was determined by D1/D2 26S rRNA gene sequencing analysis as reported by Mari et al. [21]. All PCR reactions included both negative (DNA-free) and positive controls. Relative frequencies of isolation used to represent yeast species density according to the isolation source were calculated as the number of isolates belonging to each species divided by the total number of isolates and expressed in percentage.

2.4. Chemical Analysis

Glucose, fructose, ethanol, glycerol, 2,3-butanediol, acetic, lactic and succinic acid contents in must and wine were determined by High Performance Liquid Chromatography (HPLC), according to Guerrini et al. [17] utilizing a Rezex ROA-Organic Acid H+ (8%) column (8-μm particle, 300 × 7.8 mm; Phenomenex, Torrance, CA, USA) and a ProStar 210 chromatograph equipped with a DAD at 210 nm and a Refractive Index Detector, in series (Varian Inc., Palo Alto, CA, USA). Malic acid, free amino nitrogen (FAN), NH3, and Cu2+ concentrations were determined enzymatically through Hyperlab (Steroglass, San Martino in Campo, Perugia, Italy), an automatic multi-parametric analyser.

2.5. Phenolic Compounds and Ochratoxin Content Determination

Phenolic compound determination was carried out according to Guerrini et al. [17]. Samples were filtered (0.45 μm) and injected into the HPLC-UV/FLD Jasco series 4000 (Jasco, Japan Spectroscopic co, Hachioji City, Japan) equipped with a pump PU-4180, an autosampler AS-4050, a photodiode array detector MD-4010, and a column oven CO4060 and a reversed-phase column NovaPak C18 (4-μm particle, 300 × 3.9 mm; Waters, Milford, MA, USA), thermostated at 25 °C. The eluent and gradient conditions were those reported by Guerrini et al. [17]. Phenolic compounds were detected by scanning from 210 to 600. nm Hydroxybenzoic and hydroxycinnamic acids, flavonols, flavan-3-ols, stilbenes. Hydroxybenzoic acids and hydroxycinnamic acids were quantified at 280 nm; stilbenes were quantified at 280 nm; flavonols and flavan-3-ols were quantified at 360 nm.
Ochratoxin content of grapes was determined according to Sultan et al. [22]. Grapes were diluted 5 times and homogenized with methanol and water (30:70 v/v) and filtered using Whatman filter paper. The filtrate was diluted with phosphate-buffered saline (PBS) containing 0.01% Tween, loaded and passed through an Ochratoxin Immunoaffinity Columns Milford (VICAM, Waters Corporation, MA, USA) following the manufacturer’s instructions. The HPLC system used for OTA analysis was Agilent InfinityLab Poroshell 120 EC-C18 (3.0 × 150 mm 2.7 micron) (Agilent, Berks, UK). The mobile phase was AcN:water:acetic acid (57:41:2, v/v/v) using a flow rate of 1 mL min−1. Detection was performed with a fluorescence detector using λex 333 nm and λem 460 nm (excitation and emission wavelengths, respectively). For all experiments, the injection volume was set at 20 μL.

2.6. Statistical Analysis

Data of analytical determinations, performed in duplicate, were analyzed according to ANOVA followed by Tukey’s Test. Differences were reported at a significance level of p < 0.05 or p < 0.01. The statistical analyses were performed by Statistica 7.0 software package (Statsoft GmbH, Hamburg, Germany) or by Graph Pad Prism 8.

3. Results

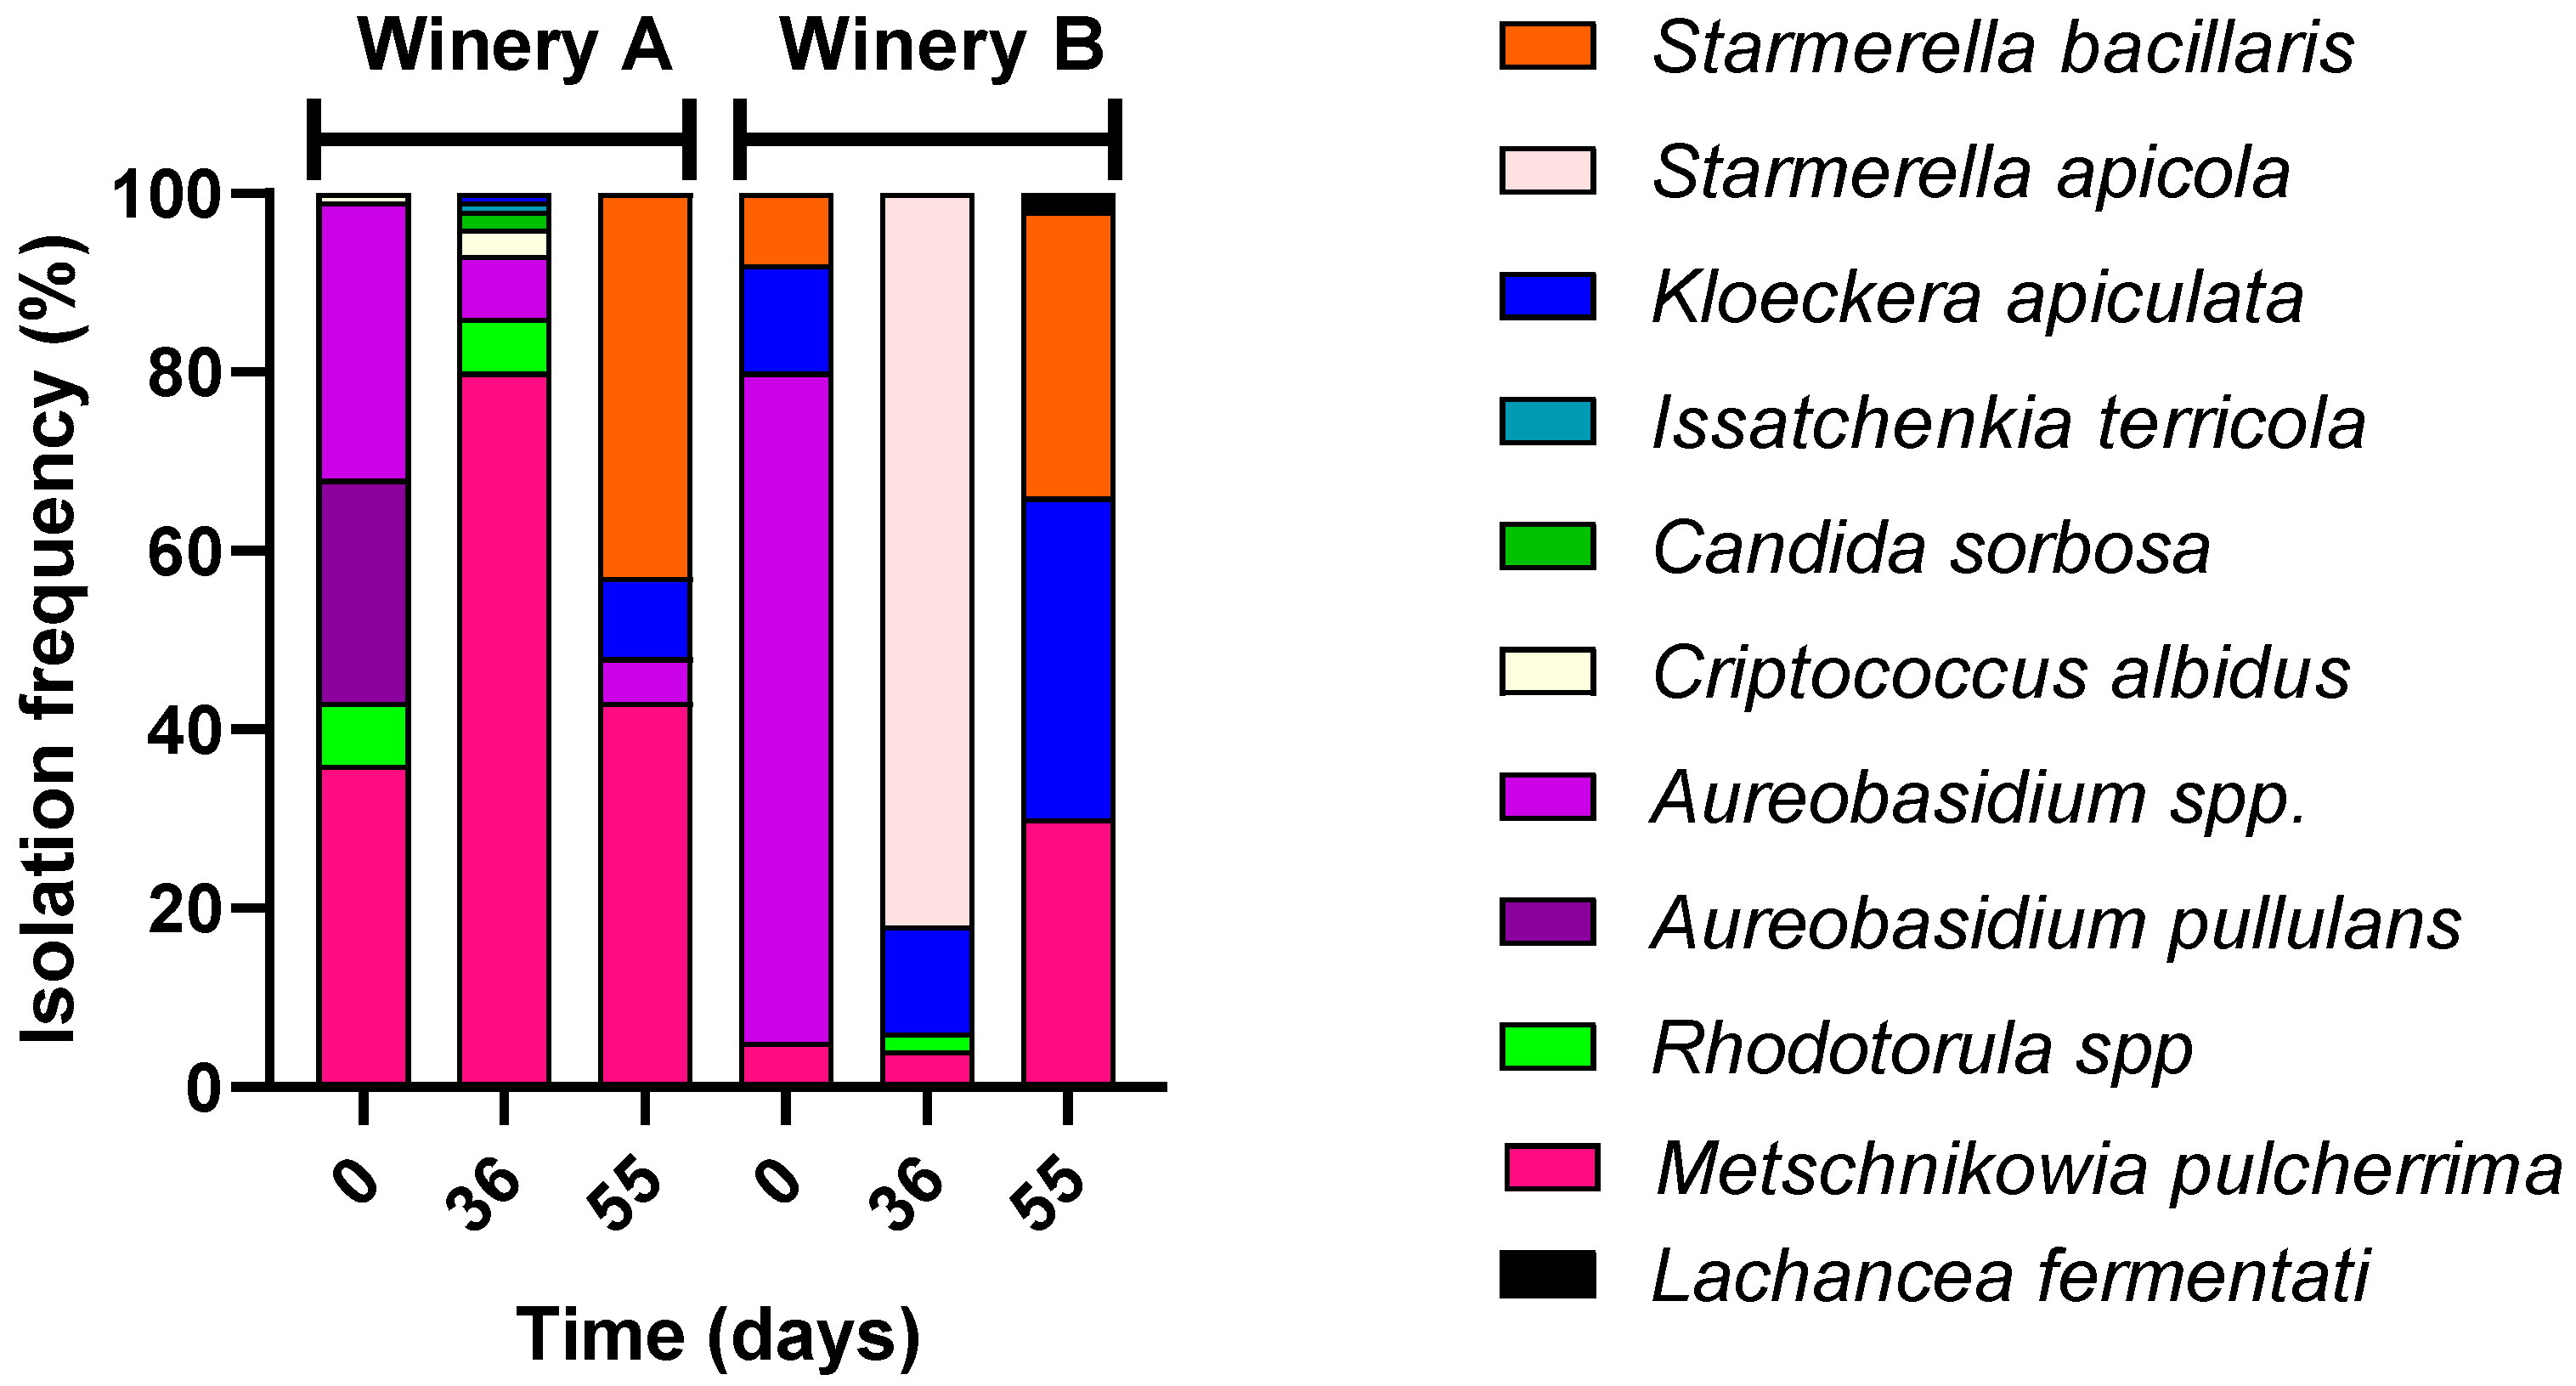
3.1. Microbiota of Grapes During Drying

The microbiota of grapes during the drying is reported in Figure 1, showing the main microbial groups of oenological interest. In winery A, the grapes were dried by hanging, while in winery B, they were placed on racks. Regardless of the winery and sampling time, non-Saccharomyces yeasts were the predominant microbial population. Saccharomyces cerevisiae was present in all grape samples at cell concentrations ranging from 102 to 104 CFU/g. At the end of the drying process, significant levels of moulds, primarily belonging to the Aspergillus niger species, were observed in the grape samples from both wineries; nevertheless, the ochratoxin content was less than 0.11 μg/Kg. Acetic acid bacteria were found at higher levels than lactic acid bacteria but at below 105 CFU/g. Identification of non-Saccharomyces yeast species was conducted at all sampling points, and the results were reported as isolation frequency in Figure 2. At harvest, the yeast-like fungus Aureobasidium occurred at a frequency of 56% and 75% on the grapes of winery A and winery B, respectively. During the drying process, yeasts belonging to the Metschnikowia pulcherrima and Starmerella bacillaris species exhibited a frequency of 80% on grapes from winery A, while on grapes from winery B, Starmerella apicola, Starmerella bacillaris, and Kloeckera apiculata became the dominant yeast species.

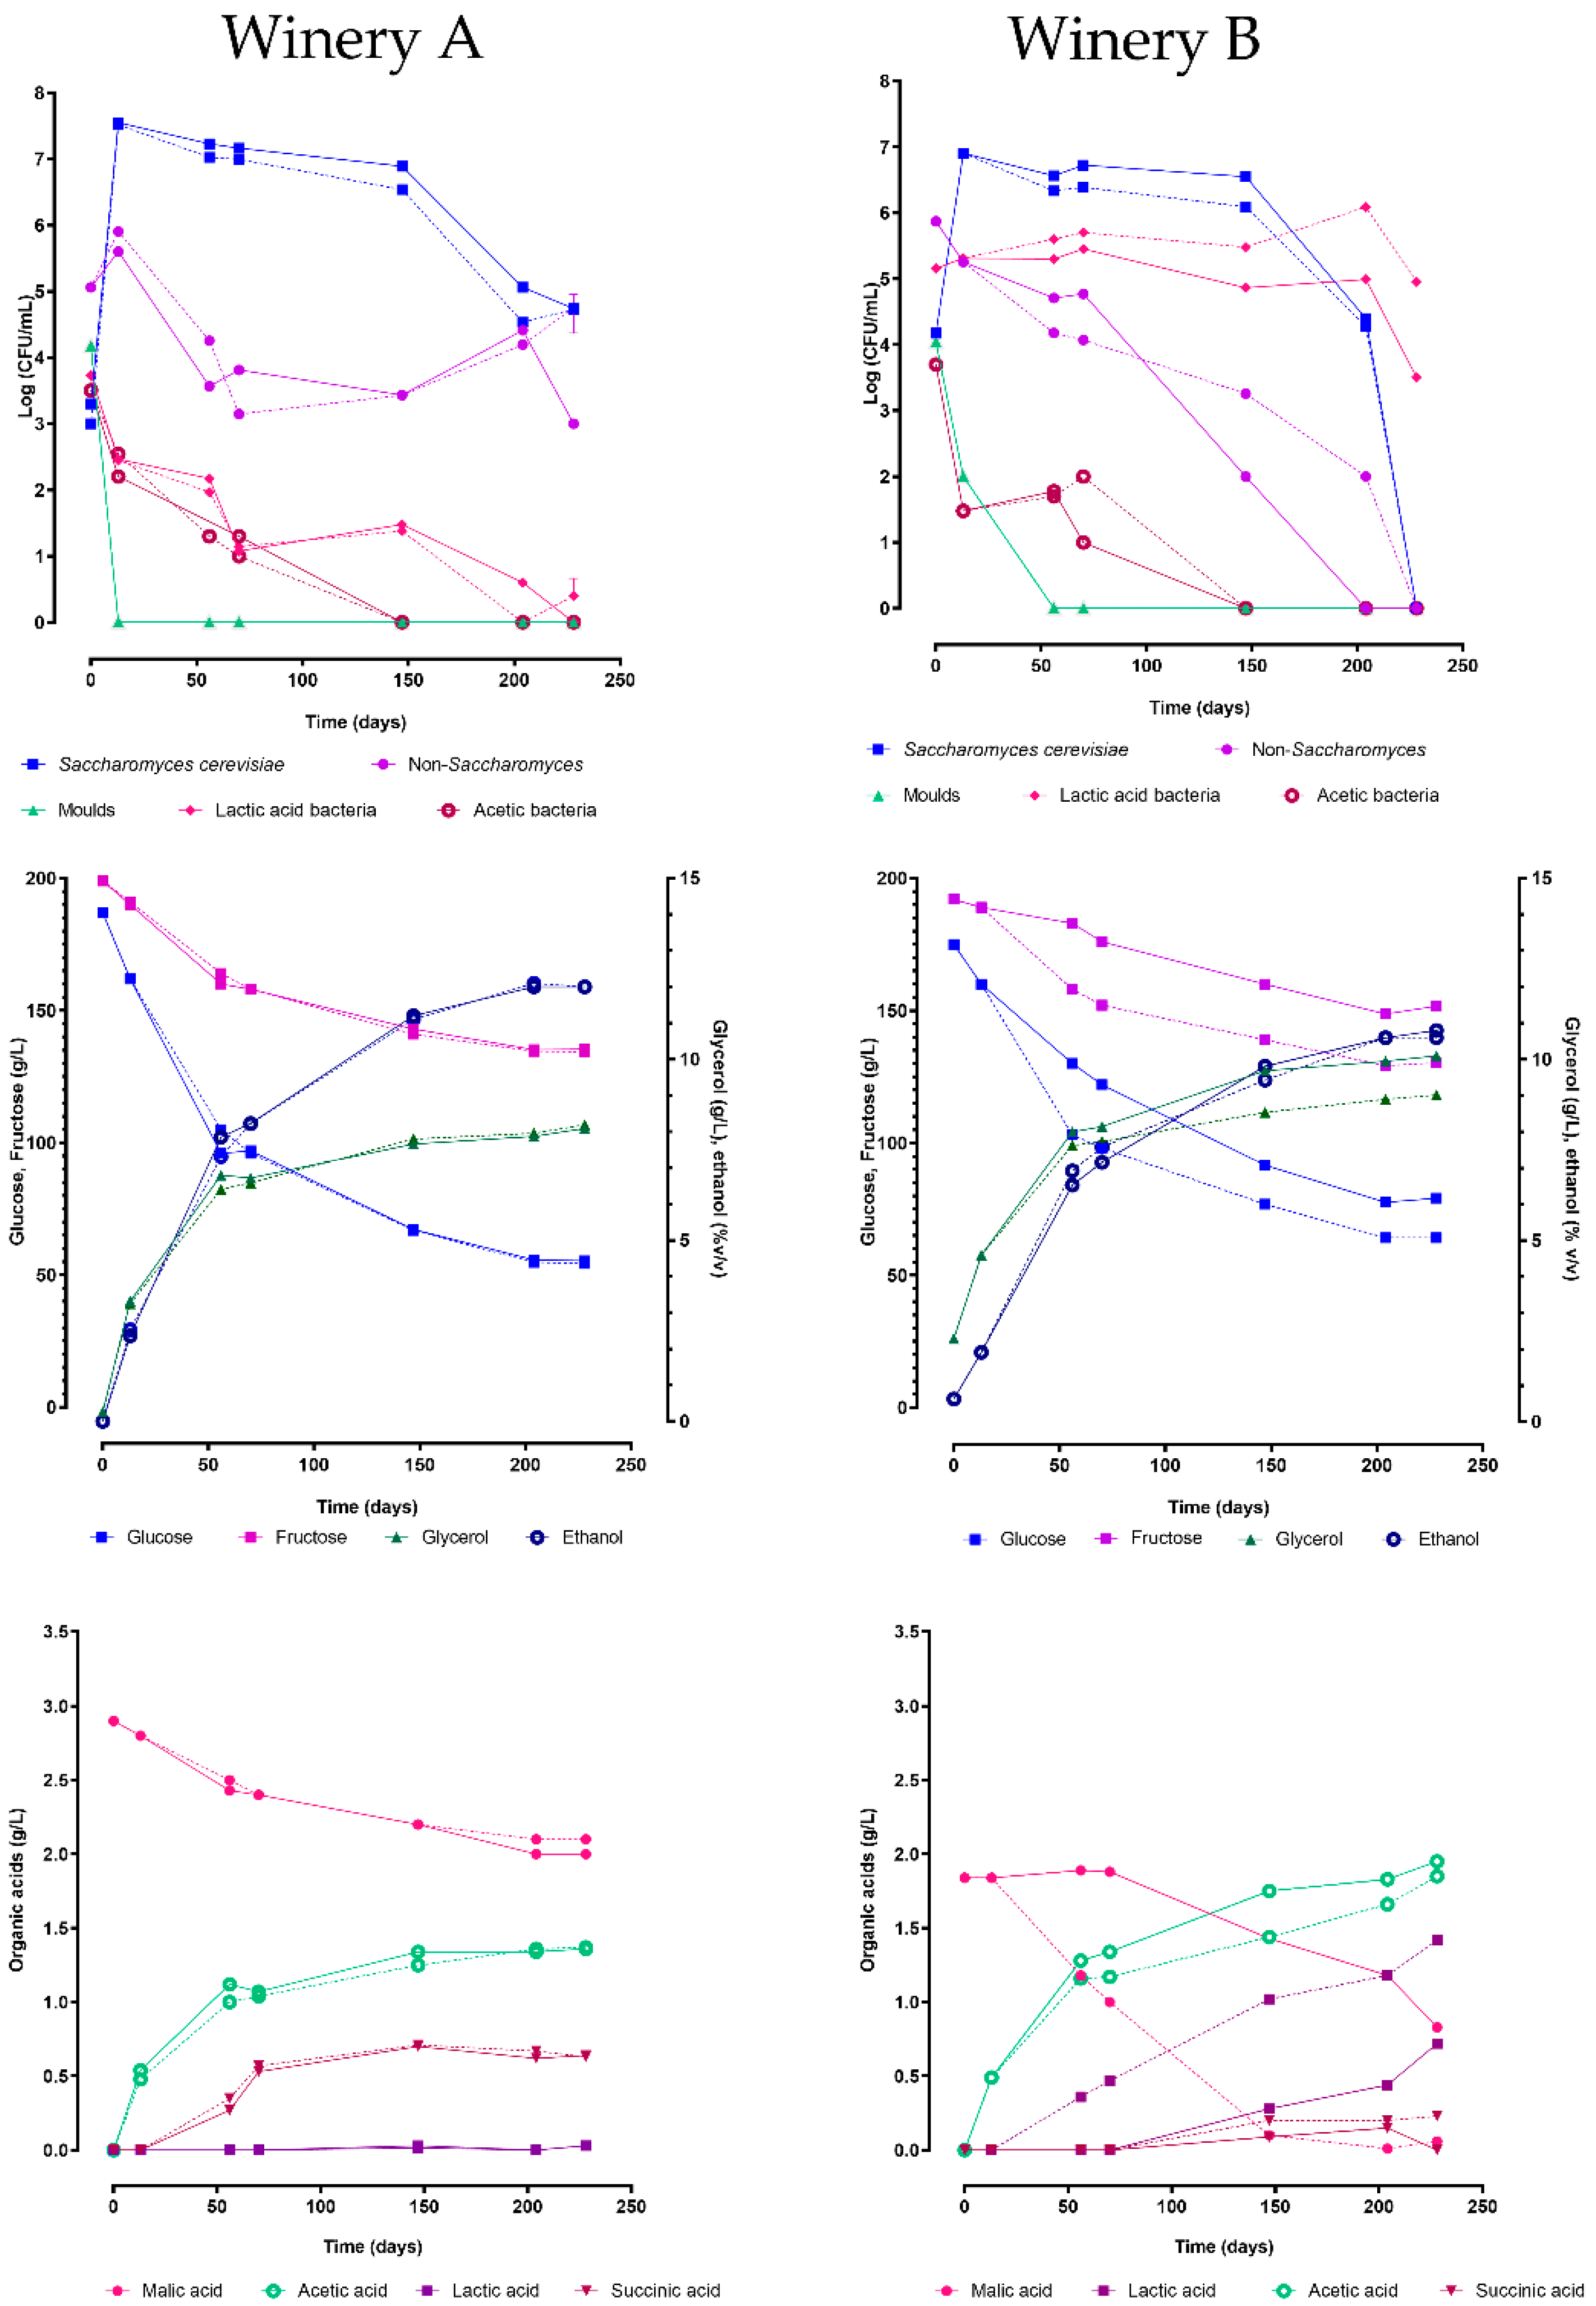
3.2. Microbiota and Chemicals Kinetics During Spontaneous Fermentations

By the end of the drying process, the sugar content of the grapes was concentrated at 70% and 60% in wineries A and B, respectively. The chemical composition of the grape must from winery A was: glucose 187 g/L, fructose 199 g/L, malic acid 2.90 g/L, tartaric acid 4.42 g/L, lactic acid < 0.1 g/L, glycerol 0.26 g/L, free amino nitrogen (FAN) 48 mg/L, NH3 12 mg/L, K+ 2074 mg/L, Cu2+ 3.8 mg/L, pH 3.84. The chemical composition of the grape must from winery B was: glucose 175 g/L, fructose 192 g/L, malic acid 1.84 g/L, tartaric acid 4.49 g/L, lactic acid < 0.1 g/L, glycerol 2.3 g/L, free amino nitrogen (FAN) 86 mg/L, NH3 27 mg/L, K+ 1904 mg/L, Cu2+ 3.6 mg/L, pH 3.67.
The grape must from winery A was promptly divided between two barrels of different capacities (50 and 100 L) and left to ferment naturally. Meanwhile, the grape must from winery B was initially fermented spontaneously in demijohns for two weeks until the ethanol concentration reached approximately 2.0% (w/v) and then transferred to two oak wooden barrels of the same capacity as those in winery A. The fermentation process in all four barrels was regularly monitored using microbiological and chemical analyses. The fermentation time course is reported in Figure 3. Both vinifications dominated by Saccharomyces cerevisiae, however with different kinetics.
In winery A, in both barrels, S. cerevisiae takes over during the first 15 days of fermentation, maintaining concentrations of 107 CFU/mL during the first 100 days of fermentation and then decreasing to 105 CFU/mL after 200 days. The population of non-Saccharomyces increased to approximately 106 CFU/mL in the first 15 days of fermentation, decreased below 104 CFU/mL in the following 35 days, and remained at this concentration for about three months. Finally, this population grew again up to without reaching 105 CFU/mL. Lactic acid bacteria, acetic bacteria, and moulds did not show growth, while Brettanomyces bruxellensis was always below the detection limit. After 228 days, the ethanol content was 12% (v/v) and fructose and glucose concentrations were 134 and 54 g/L, respectively; the acetic acid reached a concentration of 1.4 g/L, lower than the maximum acceptable limit by the Vin Santo production rules (1.8 g/L). Finally, the glycerol content was around 8 g/L, while succinic acid production stopped at 0.7 g/L after 150 days of fermentation.
Regarding winery B, the kinetics of S. cerevisiae were quite similar in the two barrels. In both barrels, S. cerevisiae never reached 107 CFU/mL, and after 150 days, this yeast population entered the death phase, dropping below the detection limit after 228 days. Unlike winery A, the non-Saccharomyces yeasts exhibited a progressive loss of cell viability, with a higher rate in the 100 L barrel compared to the 50 L barrel. After 228 days of fermentation, the ethanol content was 10.8% (v/v) in both barrels, while the residual sugars were 169 g/L in the 100 L barrel and 195 g/L in the 50 L barrel, respectively. Conversely, the 100 L barrel had higher glycerol concentrations than the 50 L barrel (10 g/L versus 9 g/L), but both had identical and elevated levels of acetic acid (2 g/L). Both vinifications recorded low concentrations of succinic acid (less than 0.2 g/L). Lactic acid bacteria were present at 105 CFU/mL in both barrels, and the dominant species across all samples was O. oeni. In the 50 L barrel, O. oeni demonstrated significantly higher concentrations, resulting in complete malic acid degradation within 150 days. In contrast, the vinification in the 100 L barrel did not complete malolactic fermentation, with malic acid remaining at 0.83 g/L after 228 days. Finally, as seen in winery A, acetic bacteria and moulds did not grow, while Brettanomyces bruxellensis was below 10 CFU/mL.

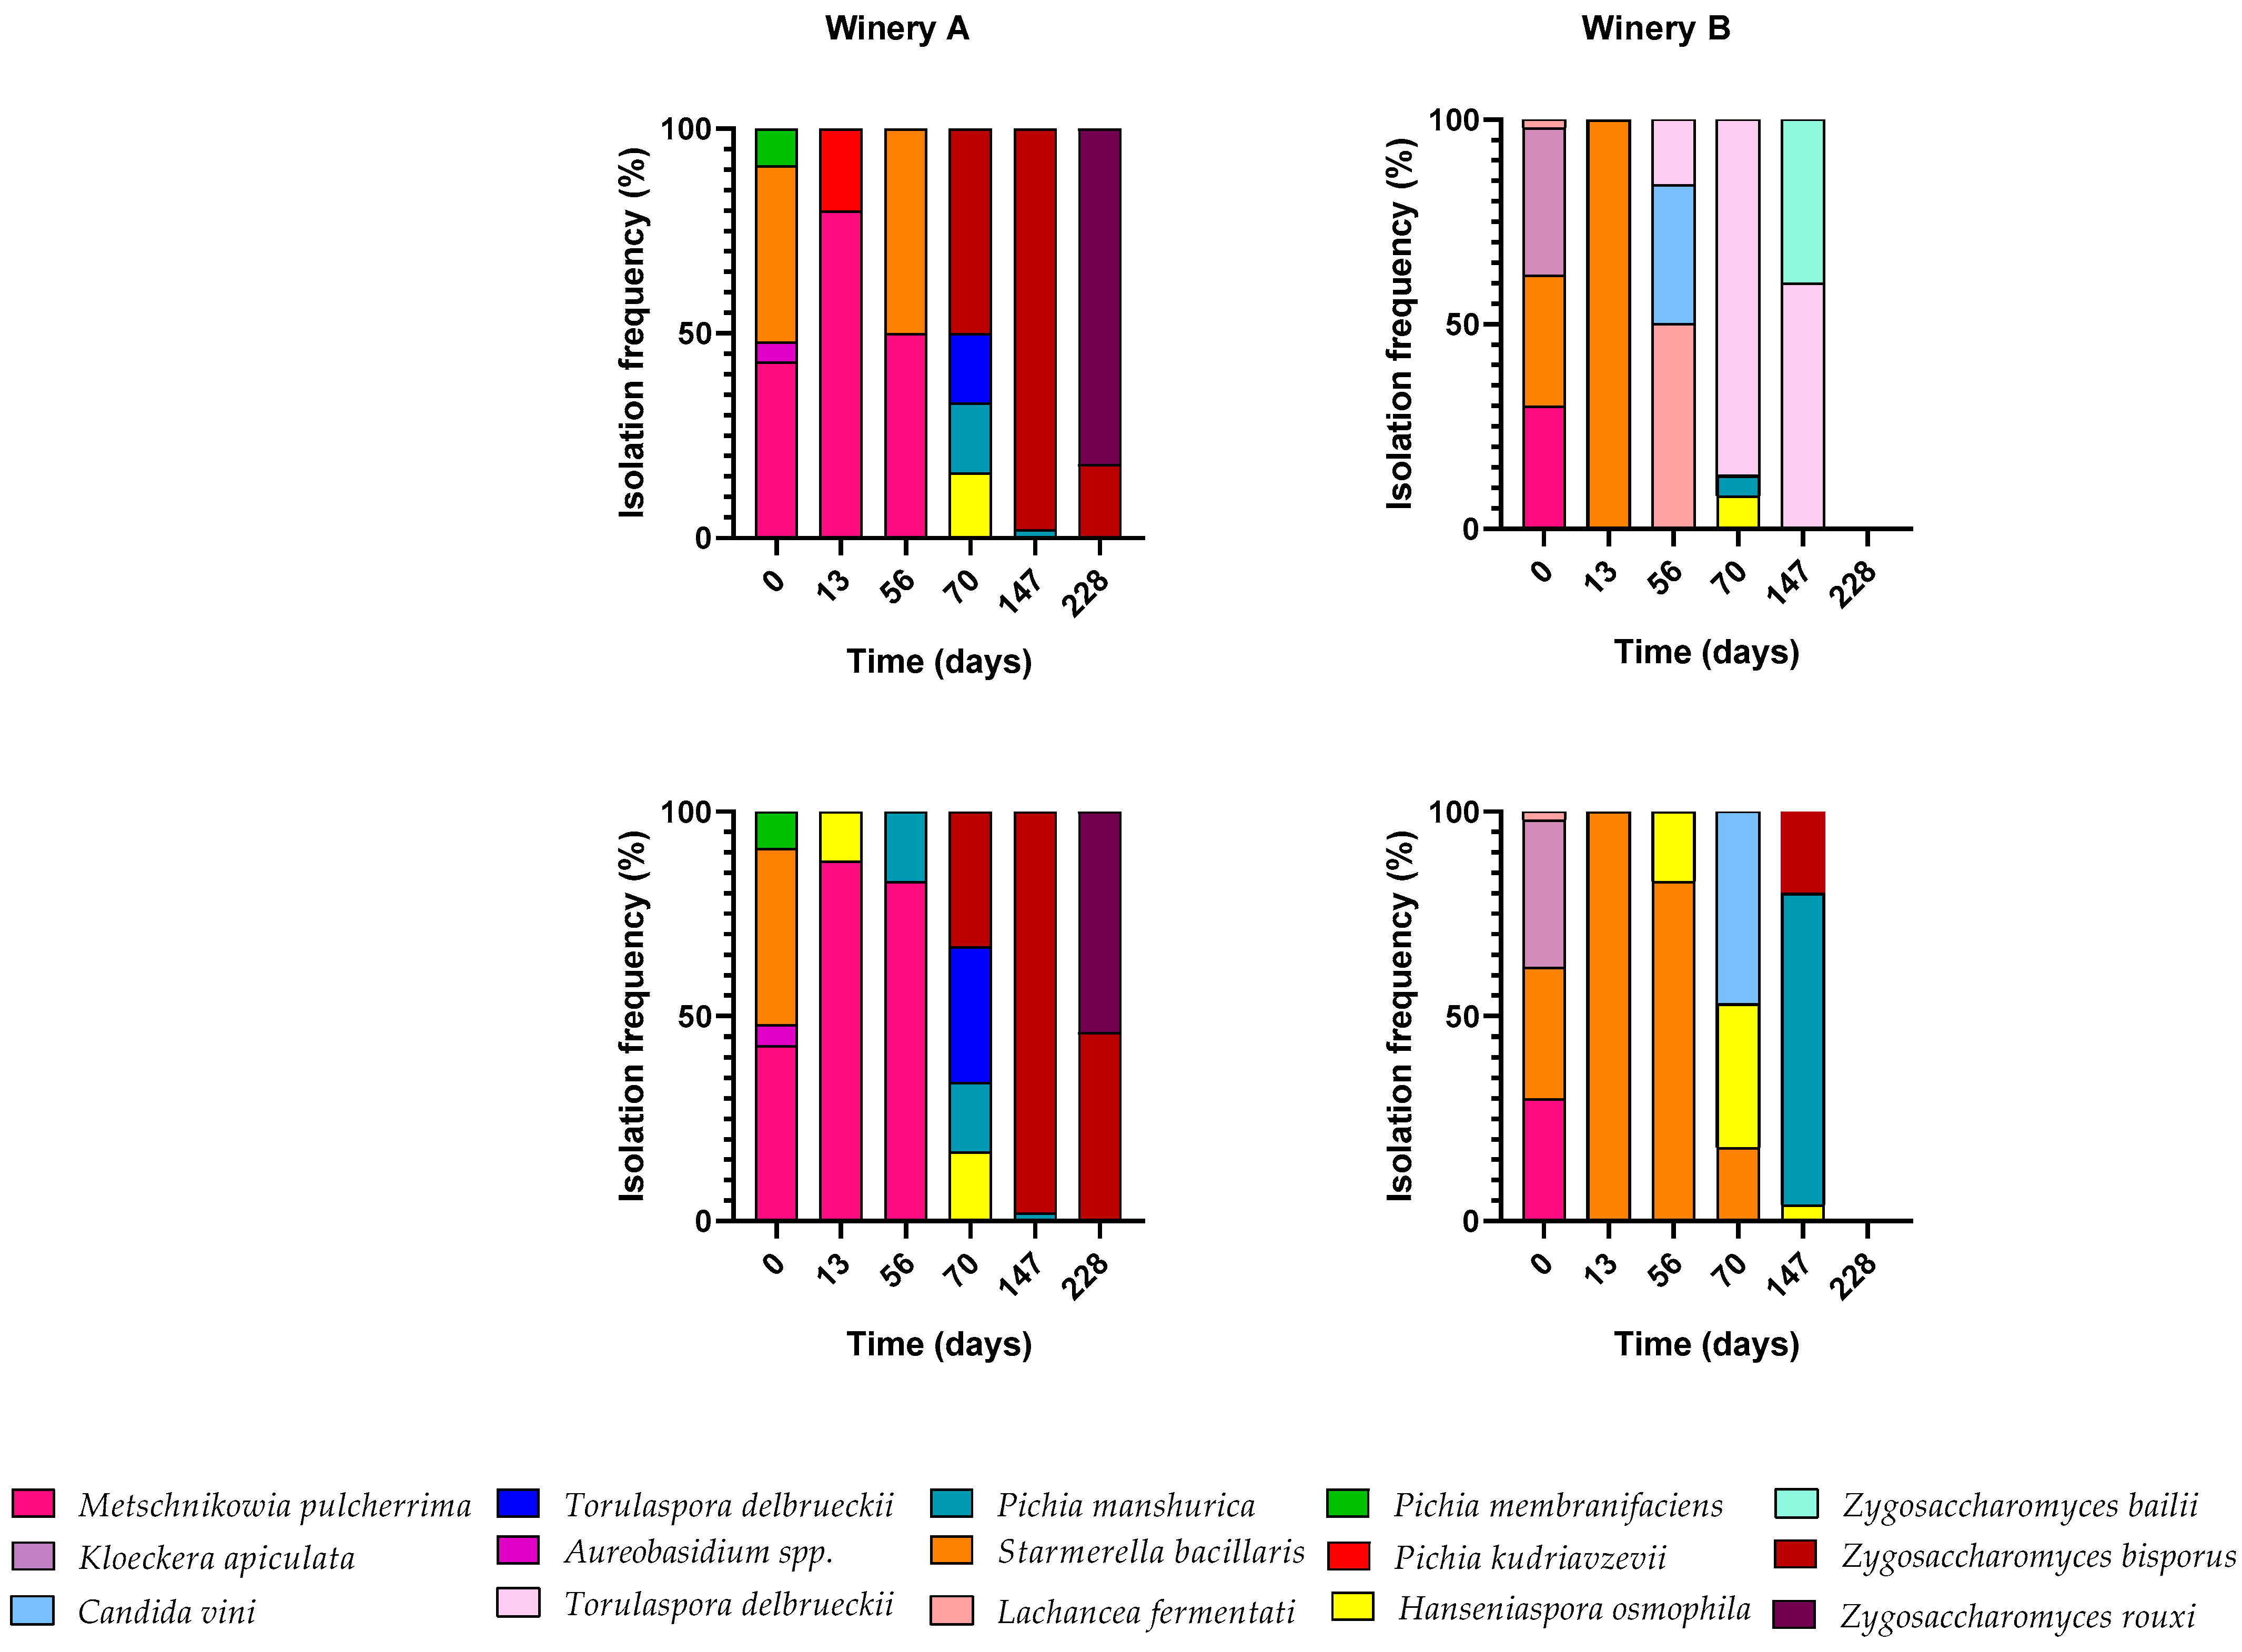
3.3. Biodiversity of Non-Saccharomyces Yeasts During Fermentation

Identification of non-Saccharomyces populations was conducted at all sampling points, and the results of non-Saccharomyces yeast species were reported as isolation frequency in Figure 4. The non-Saccharomyces yeast species in the two wine fermentations conducted in winery A were similar. M. pulcherrima was the dominant yeast in the first three sampling points. On the 70th day, the dominant yeast species became Zygosaccharomyces bisporus, Torulaspora delbrueckii, Hanseniaspora osmophila, and Pichia manshurica in both fermentations. Finally, Zygosaccharomyces spp. dominated the remaining two sampling points. In contrast, different non-Saccharomyces species were found after the first two sample points in barrels in winery B. Indeed, between 56 and 147 days of fermentation, Lachancea fermentati, Candida vini, Zygosaccharomyces bailii, and Torulaspora delbrueckii were the dominant species in the 100 L barrel while in the 50 L barrel, Starmerella bacillaris, Hanseniaspora osmophila, Pichia manshurica, and Zygosaccharomyces bisporus dominated. Ultimately, the non-Saccharomyces yeasts present in the fermentations of the two cellars were characterized by different dominant species. However, this difference does not explain the higher mortality that occurred in both fermentations of cellar B.
Therefore, to understand the possible reasons for the non-Saccharomyces mortality, some compounds considered responsible for stuck or slow fermentations in passito wines, such as polyphenols and copper, were quantified after 230 days of fermentation (Table 1). Gallic acid, protocatechuic acid, caftaric acid and caffeic acid were at higher concentrations in the wines produced by winery B than those of winery A. As for the copper concentration, after 230 days of fermentation, the wines from Winery A had a significantly higher content than those from Winery B, while the initial Cu2+ content of the musts was the same (3.8 and 3.6 mg/L). This could be due to an over-intake of Cu2+ by the yeast populations of the wines obtained in winery B, contributing to cell death.
The Maillard reaction could also be responsible for the higher mortality of yeasts in the wines of Winery B. Effectively, the degree of browning, which is an indirect measure of the Maillard reaction, showed absorbance values approximately double in winery B than in winery A (Table 1).

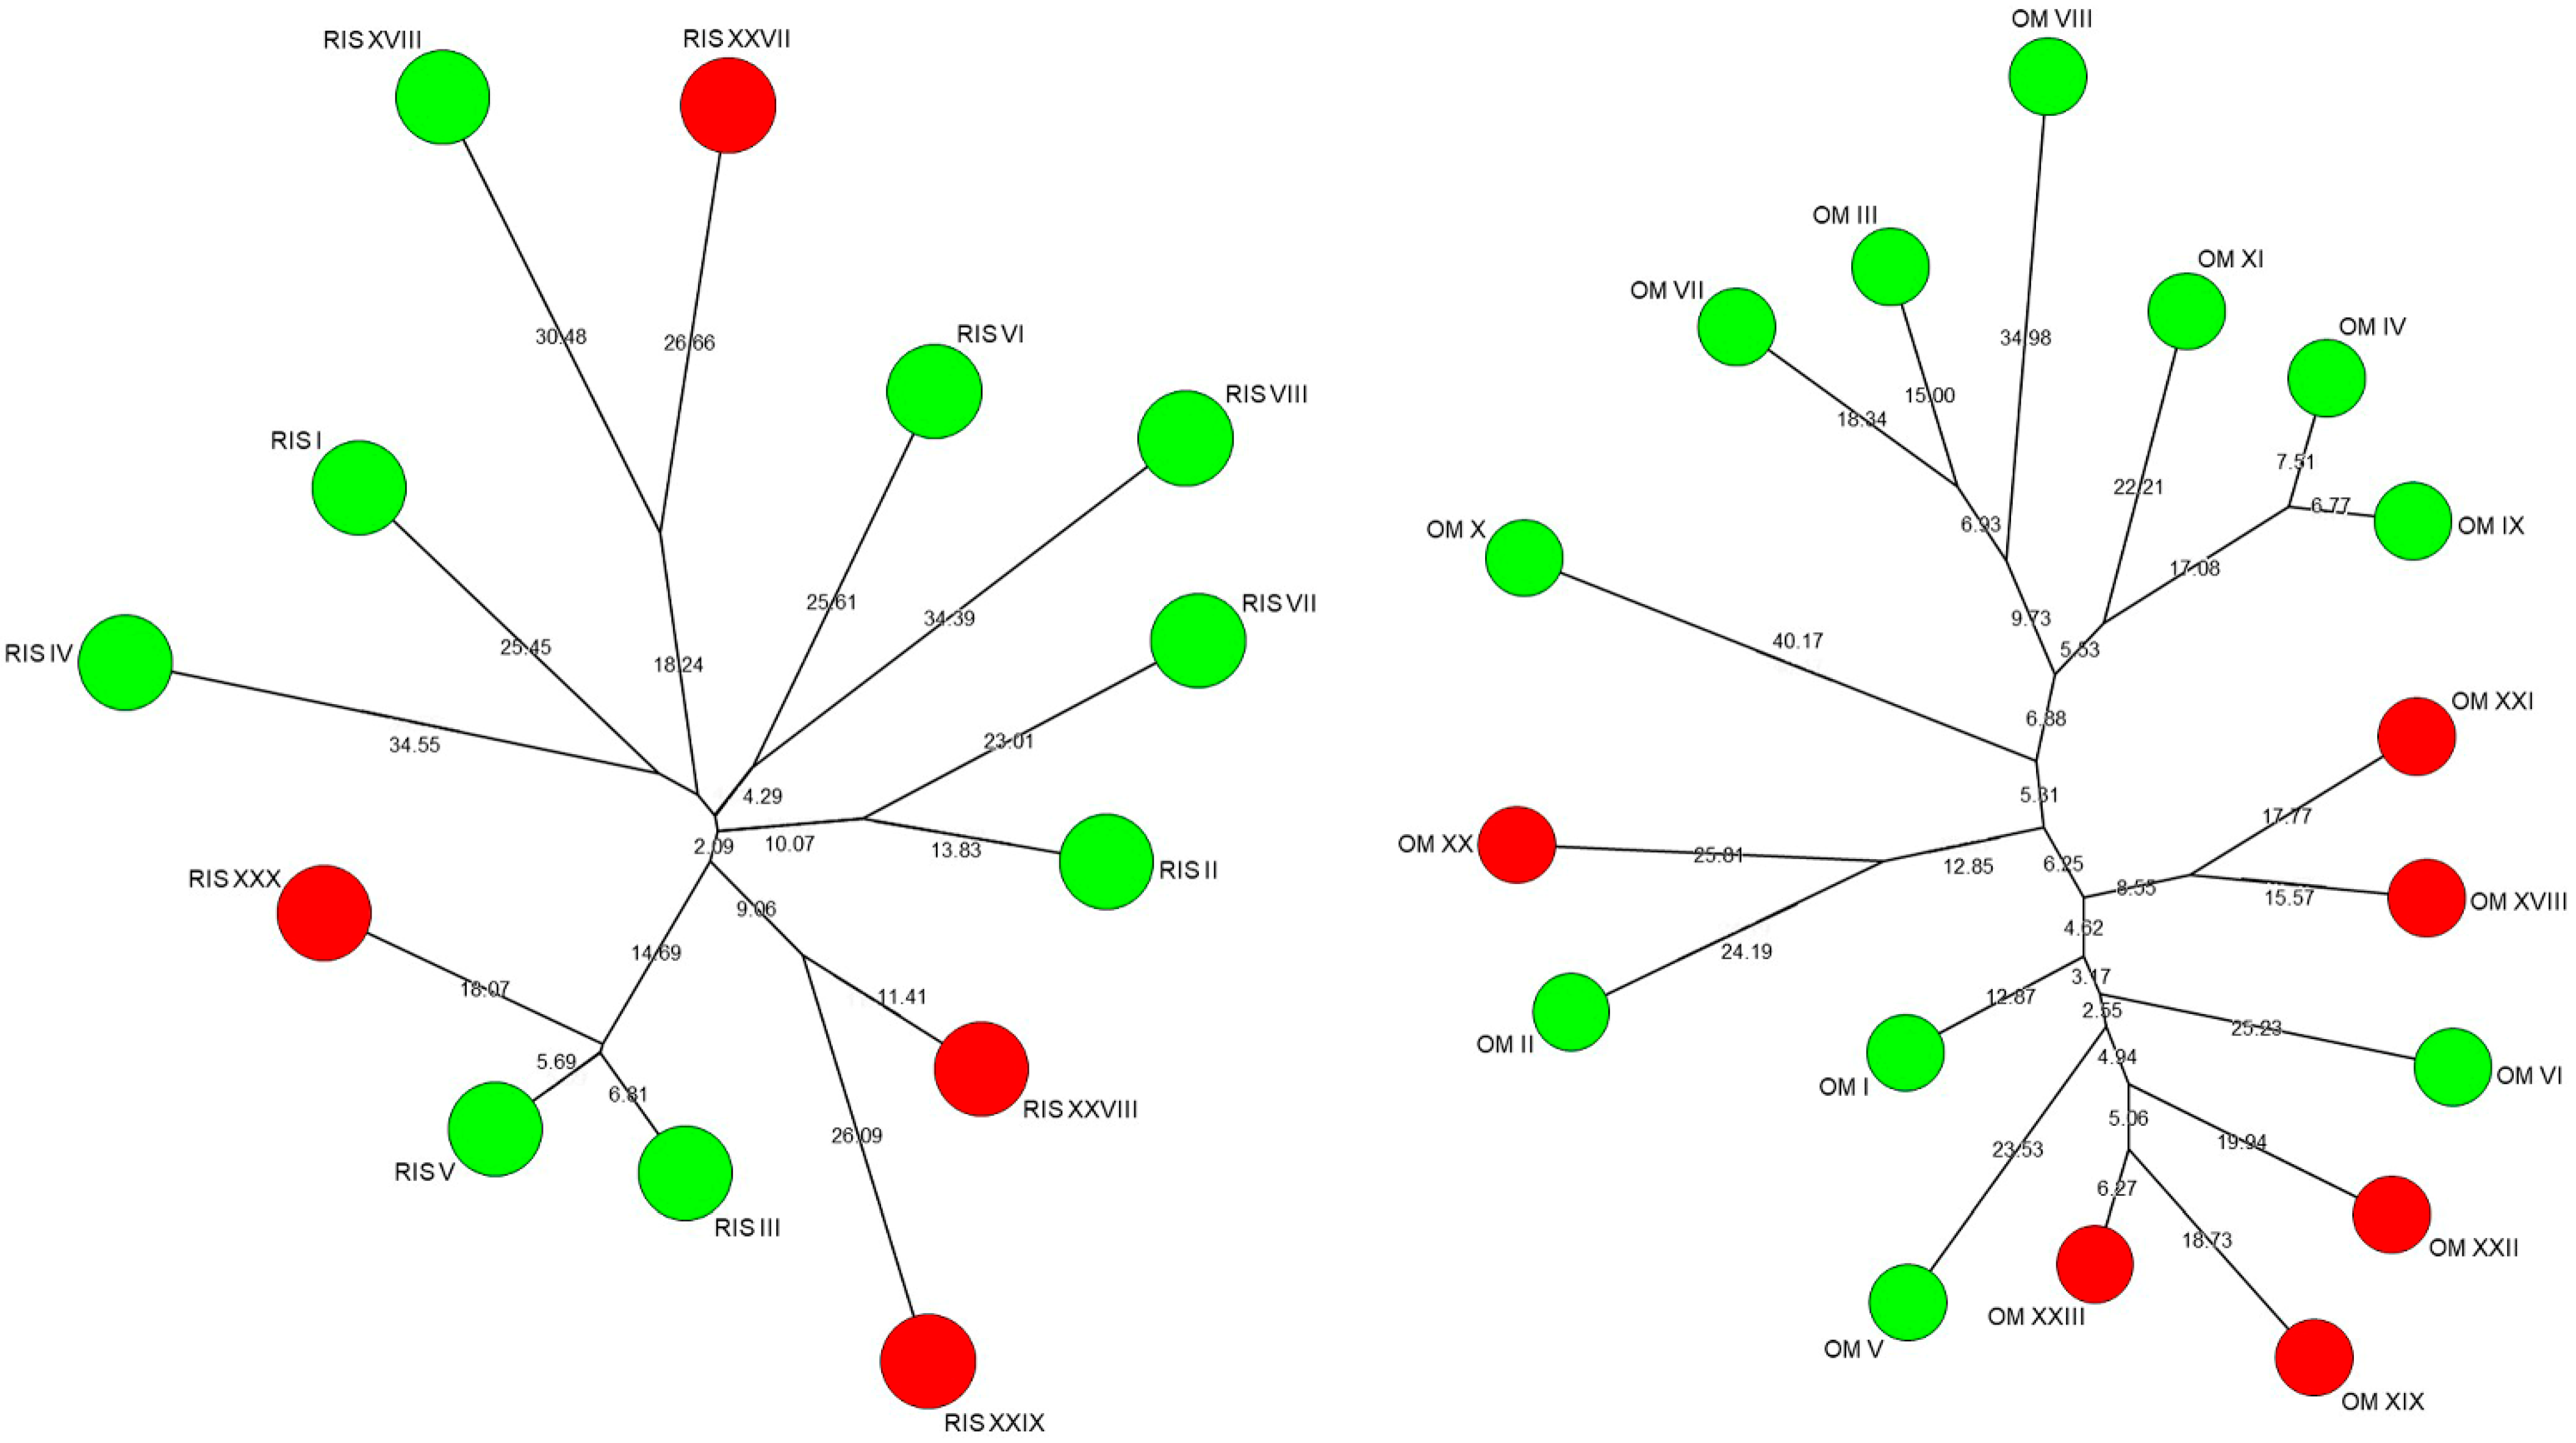
3.4. Intraspecific Biodiversity of Saccharomyces cerevisiae

The intraspecific biodiversity of S. cerevisiae was evaluated throughout the fermentation process to point out the number of strains present and their distribution over time. This is particularly interesting from an ecological perspective, given the extended duration of the fermentation process and the highly selective environment of Vin Santo. Therefore, 200 S. cerevisiae isolates from each vinification were analyzed to detect genetically different strains using the PCR amplification of the inter-δ regions. The analysis identified 30 distinct genetic patterns in the fermentations of winery A and 23 in the fermentations of winery B. The isolation frequencies of the indigenous S. cerevisiae strains, calculated for each winemaking and each sampling point, are reported in Figure 5. None of the strain showed significant dominance during the 200 days of fermentation. The profiles shared by the two vinifications of winery A and present in at least one sampling point at concentrations greater than 30% were three (RisI, III, and VIII), while in winery B, they were two (OmII and OmV). As the S. cerevisiae population declined in both wineries, previously undetected strains were discovered, reaching isolation frequencies of around 10%. This phenomenon was most evident in the 100 L barrel fermentation of winery A and the 50 L barrel of winery B.
To compare the genetic diversity levels of the S. cerevisiae populations isolated from the four vinifications, the values of “H” and “e” indices were calculated (Table 2). According to Shannon’s index “H”, estimating the richness of S. cerevisiae strains found in the four barrels, a similar level was observed for all the vinifications oscillating between 2.2 and 2.6; indeed, no strain emerged as predominant over 200 days of fermentation in the four vinifications. Accordingly, the evenness index “e”, which ranges between 0 and 1 and increases as the number of isolates exhibiting the same inter-δ patterns decreases, assumed values between 0.5 and 0.6 in all the vinifications. Finally, all the inter-δ patterns corresponding to the different S. cerevisiae strains were analyzed using UPGMA clustering analysis, and the resulting dendrogram is reported in Figure 6. The S. cerevisiae strains, at 30% similarity, were grouped into four clusters in both wineries. The clustering of the strains in both cellars were not related to the time of isolation. In particular, the strains isolated at the first sampling point were distributed in different clusters.
To further investigate the clonal relationship between genotypes found at the beginning and end of the fermentation process, the inter-δ patterns of the strains present on the thirteenth day and after over 200 days of fermentation were compared using the neighbour-joining method Saitou [23]. The results are reported in Figure 7, where the strains collected at the beginning of fermentation are in green, while the strains collected after more than 200 days of fermentation are in red. The strains present at the end of the fermentation did not show significant similarities with those present at the beginning, except the Ris XXX strain which showed substantial similarities with the Ris III and Ris V strains.

4. Discussion

The microbial ecology of the traditional process of Vin Santo production was investigated in two wineries in Tuscany. Despite the different systems used for drying the grapes (grapes hung or placed on racks), both wineries showed similar microbial ecology. Non-Saccharomyces yeasts were the dominant microbial population, even though the moulds reached comparable concentrations at the end of the drying process. The succession of non-Saccharomyces species throughout grape drying differentiated between the two wineries, even though in the end, the dominant species in both were M. pulcherrima, K. apiculata, and S. bacillaris, but at different percentages. Other authors found these yeast species on dried grapes used in Vin Santo and other passito wine production [2,24]. Unlike what is generally found in grapes at harvest [12], significant concentrations (103–104 CFU/g) of S. cerevisiae were present from the beginning of the drying phase, this might be due to a S. cerevisiae contamination of the drying rooms (fruttaio). Regarding the bacterial population, acetic bacteria were most present at the end of the grape-drying process.
Despite the similar microbiological characteristics of the grapes at the end of drying, the fermentation trends in the two wineries were very different. Unlike the winery A vinifications, the winery B vinifications showed low ethanol content and excessive acetic acid content (>1.8 g/L). The low ethanol content in winery B could be due to the non-Saccharomyces population in the first two weeks, mainly composed of S. bacillaris. This species produces high glycerol and low ethanol concentrations [25]. Being able to tolerate high ethanol concentrations, S. bacillaris can compete with S. cerevisiae, compromising its fermentation performance. Thanks to these characteristics, some authors have proposed S. bacillaris as a starter in co-inoculation with S. cerevisiae to reduce the ethanol content of the wines [26]. The high persistence of non-Saccharomyces observed in the fermentations of Vin Santo has also been found in other passito wines, demonstrating a significant impact of this yeast population on the volatile component and aromatic profile of this type of wine [1]. Excessive acetic acid content could be due to a non-optimal physiological state of S. cerevisiae [27] and/or to the growth of a bacterial population mainly composed of O. oeni, an heterolactic lactic acid bacteria, in the presence of high concentrations of hexose sugars. Finally, the yeast population mortality highlighted in the fermentations of winery B starting from the 200th day could be due to the more significant presence in these wines of some polyphenols that have demonstrated certain toxicity for wine microorganisms, although the minimum inhibition concentrations reported in vitro for these compounds were always much higher than those found in the wines analyzed [27,28,29,30]. Further studies would be necessary to understand the possible synergistic roles between these compounds and other parameters of passito wines compromising the yeast’s physiological state, such as ethanol, high sugar concentration, or copper. As reported in scientific literature, concentrations of copper lower than 20 mg/L, as in the case of the winery A and B starting musts, did not affect the cell growth of S. cerevisiae, but its fermentation performance can be inhibited to a certain extent [31]. In the wines of winery B, yeast populations could have absorbed copper, compromising the fermentation performance of S. cerevisiae yeasts or, otherwise, determining the mortality of non-Saccharomyces yeasts.
Considering the intraspecific biodiversity of S. cerevisiae populations, the vinifications of both wineries displayed very similar biodiversity indices. No single strain of S. cerevisiae dominated the entire fermentation process, which is often observed in spontaneous wine fermentations using non-dried grapes [32]. This lack of dominance could be a typical characteristic of passito wines, attributed to the lengthy duration of alcoholic fermentation. Additionally, the clonal relationship between the genotypes present at the beginning and end of the fermentation process was not evident. This suggests that the number of indigenous strains does not increase over time through recombination among the strains present in the initial stages. Instead, different strains seem to attain dominance at various points during fermentation, likely based on their fitness advantages in a culture medium that changes gradually over time. This phenomenon complicates the task of determining the best moment to isolate yeasts for selection as starter strains. It appears that in the case of passito wines, a more effective strategy might be to use different yeasts in co-inoculation, as proposed by de Philippis et al. [1]. In this article, the authors proposed the co-inoculation of S. cerevisiae with osmotolerant non-Saccharomyces yeasts such as Candida zemplinina or Z. bailii. Recent studies have shown that non-Saccharomyces yeasts can modulate and enrich the sensory properties of wines by playing a role in releasing volatile compounds from non-volatile precursors [33,34]. Therefore, a non-Saccharomyces starter could contribute favourably to the aromatic bouquet. However, it is important to investigate the metabolic compatibility between strains to avoid competition that can lead to incomplete fermentations. One metabolic capacity of yeasts that could be important for selecting a starter for passito wines is the ability to produce succinic acid. Succinic acid production by non-Saccharomyces yeast in co-inoculated fermentations with S. cerevisiae strains could inhibit O. oeni growth [35]. Inhibiting the development of this microbial population could help reduce the concentration of acetic acid, which is often too high in passito wines.

5. Conclusions

This study explored the microbial ecology and its impact on the fermentative kinetics in traditional processes of Vin Santo of two wineries. The microbial ecology were similar; during the grape drying non-Saccharomyces yeasts were the dominant microbial population, while during the spontaneous fermentation Saccharomyces cerevisiae became dominant the fermentation trends in the two wineries were very different. Considering the intraspecific biodiversity of S. cerevisiae populations, the vinifications of both wineries displayed very similar biodiversity indices. No single strain of S. cerevisiae dominated the entire fermentation process. The study highlighted the importance of understanding and characterizing microbial communities and their metabolomic interactions, in order to improve the management and control of the process.

Supplementary Materials

The following supporting information can be downloaded at: https://www.mdpi.com/article/10.3390/fermentation11060310/s1. Figure S1: Winemaking process of Vin Santo.

Author Contributions

Conceptualization. D.B., S.G. and G.B.; formal analysis. S.M., D.B., E.M. and G.B.; investigation. D.B., S.G. and S.M.; writing—original draft preparation. S.G. and L.G.; writing—review and editing. L.G. and V.G.; supervision. S.G. and L.G.; project administration. S.G. and L.G.; funding acquisition. S.G. All authors have read and agreed to the published version of the manuscript.

Funding

This research was funded by the PSR 2014–2022 (PROGETTO SOTTOMISURA 16.2) contribution of Regione Toscana. Project title “Selezione di lieviti autoctoni per la produzione di vini passiti”. This research was also funded by bando FABER 4 di Fondazione CR Firenze, Confindustria Firenze e Fondazione per la Ricerca e l’Innovazione, promossa dall’Università degli Studi di Firenze e dalla Città Metropolitana di Firenze.

Institutional Review Board Statement

Not applicable.

Informed Consent Statement

Not applicable.

Data Availability Statement

Data are contained within the article or Supplementary Material.

Acknowledgments

The authors would like to thank Ottomani Società Semplice Agricola and Tenuta Riseccoli for their technical support during the trials.

Conflicts of Interest

The authors Damiano Barbato, Viola Galli, Silvia Mangani and Giacomo Buscioni were employed by the company FoodMicroTeam s.r.l. The remaining authors declare that the research was conducted in the absence of any commercial or financial relationships that could be construed as a potential conflict of interest.

References

  1. De Filippis, F.; Aponte, M.; Piombino, P.; Lisanti, M.T.; Moio, L.; Ercolini, D.; Blaiotta, G. Influence of microbial communities on the chemical and sensory features of Falanghina sweet passito wines. Food Res. Int. 2019, 120, 740–747. [Google Scholar] [CrossRef] [PubMed]
  2. Domizio, P.; Lencioni, L. Vin santo. In Advances in Food and Nutrition Research; Jackson, R.S., Ed.; Academic Press: Waltham, MA, USA, 2011; Volume 63, pp. 41–100. [Google Scholar]
  3. Domizio, P.; Manazzu, I.; Ciani, M. Impact of mother sediment on yeast growth, biodiversity, and ethanol production during fermentation of Vinsanto wine. Int. J. Food Microbiol. 2009, 129, 83–87. [Google Scholar] [CrossRef] [PubMed]
  4. European Commission. Commission Regulation (EU) No 401/2010 of 7 May 2010 amending and correcting Regulation (EC) No 607/2009 laying down certain detailed rules for the implementation of Council Regulation (EC) No 479/2008 as regards protected designations of origin and geographical indications. traditional terms. labelling and presentation of certain wine sector products. Off. J. Eur. Union 2010, 53, 13–59. [Google Scholar]
  5. Laureati, M.; Cattaneo, C.; Tateo, F.; Bononi, M. Identification of the Volatile Compounds and Sensory Attributes of Long-Term Aging Vin Santo Wine from Malvasia di Candia Aromatic Grapes. Foods 2020, 9, 1736. [Google Scholar] [CrossRef]
  6. Tofalo, R.; Chaves-López, C.; Di Fabio, F.; Schirone, M.; Felis, G.E.; Torriani, S.; Paparella, A.; Suzzi, G. Molecular identification and osmotolerant profile of wine yeasts that ferment a high sugar grape must. Int. J. Food Microbiol. 2009, 130, 179–187. [Google Scholar] [CrossRef]
  7. Kertsch, A.L.; Wagner, J.; Henle, T. Selected Maillard Reaction Products and Their Yeast Metabolites in Commercial Wines. J. Agric. Food Chem. 2023, 71, 12300. [Google Scholar] [CrossRef]
  8. Romani, C.; Lencioni, L.; Domizio, P. Chemical composition and organoleptic characteristics of Vinsanto wine obtained by using different Saccharomyces strains. Ann. Microbiol. 2009, 59, 76. [Google Scholar]
  9. Aponte, M.; Blaiotta, G. Selection of an autochthonous Saccharomyces cerevisiae strain for the vinification of “Moscato di Saracena”, a southern Italy (Calabria Region) passito wine. Food Microbiol. 2016, 54, 30–39. [Google Scholar] [CrossRef]
  10. De Filippis, F.; La Storia, A.; Blaiotta, G. Monitoring the mycobiota during Greco di Tufo and Anglianico wine fermentation by 18S rRNA gene sequencing. Food Microbiol. 2017, 63, 117–122. [Google Scholar] [CrossRef]
  11. Englezos, V.; Giacosa, S.; Rantsiou, K.; Rolle, L.; Cocolin, L. Starmerella bacillaris in winemaking: Opportunities and risks. Curr. Opin. Food Sci. 2017, 17, 30–35. [Google Scholar] [CrossRef]
  12. Fleet, G.H. Yeast interactions and wine flavour. Int. J. Food Microbiol. 2003, 86, 11–22. [Google Scholar] [CrossRef] [PubMed]
  13. Serafino, G.; Di Gianvito, P.; Giacosa, S.; Škrab, D.; Cocolin, L.; Englezos, V.; Rantsiou, K. Survey of the yeast ecology of dehydrated grapes and strain selection for wine fermentation. Food Res. Int. 2023, 170, 113005. [Google Scholar] [CrossRef] [PubMed]
  14. Castrillo, D.; Blanco, P. Preliminary Study on Yeasts Associated with the Production of “Tostado”—A Traditional Sweet Wine from Galicia (NW Spain). Front. Biosci. (Elite Ed.) 2024, 16, 10. [Google Scholar] [CrossRef]
  15. Loizzo, M.R.; Bonesi, M.; Di Lecce, G.; Boselli, E.; Tundis, R.; Pugliese, A.; Menichini, F.; Frega, N.G. Phenolics, Aroma Profile, and In Vitro Antioxidant Activity of Italian Dessert Passito Wine from Saracena (Italy). Food Sci. 2013, 78, C703–C708. [Google Scholar] [CrossRef] [PubMed]
  16. Kelly, J.M.; Inglis, D.L.; Pickering, G.J. Sensorial and volatile analysis of wines made from partially dehydrated grapes: An Ontario case study. J. Food Qual. 2020, 2020, 8861185. [Google Scholar] [CrossRef]
  17. Guerrini, S.; Barbato, D.; Mangani, S.; Ganucci, D.; Buscioni, G.; Galli, V.; Triossi, A.; Granchi, L. Management of in-Amphora “Trebbiano Toscano” Wine Production: Selection of Indigenous Saccharomyces cerevisiae Strains and Influence on the Phenolic and Sensory Profile. Foods 2023, 12, 2372. [Google Scholar] [CrossRef]
  18. Granchi, L.; Bosco, M.; Messini, A.; Vincenzini, M. Rapid detection and quantification of yeast species during spontaneous wine fermentation by PCR–RFLP analysis of the rDNA ITS region. J. Appl. Microbiol. 1999, 87, 949–956. [Google Scholar] [CrossRef]
  19. Legras, J.L.; Karst, F. Optimisation of interdelta analysis for Saccharomyces cerevisiae strain characterisation. FEMS Microbiol. Lett. 2003, 221, 249–255. [Google Scholar] [CrossRef]
  20. Shannon, S.E.; Weaver, W. The Mathematical Theory of Communication; University of Illinois Press: Champaign, IL, USA, 1963. [Google Scholar]
  21. Mari, E.; Guerrini, S.; Granchi, L.; Vincenzini, M. Yeast microbiota in the olive oil extractive process: A three-year study at an industrial scale. World J. Microbiol. Biotechnol. 2016, 32, 93–103. [Google Scholar] [CrossRef]
  22. Sultan, Y.; Magan, N.; Medina, A. Comparison of five different C18 HPLC analytical columns for the analysis of ochratoxin A in different matrices. J. Chromatogr. B 2014, 971, 89–93. [Google Scholar] [CrossRef]
  23. Saitou, N.; Masatoshi, N. The Neighbor-joining method: A new method for reconstructing phylogenetic trees. Mol. Biol. Evol. 1987, 4, 406–425. [Google Scholar]
  24. Rantsiou, K.; Campolongo, S.; Alessandria, V.; Rolle, L.; Torchio, F.; Cocolin, L. Yeast populations associated with grapes during withering and their fate during alcoholic fermentation of high-sugar must. Aust. J. Grape Wine Res. 2013, 19, 40–46. [Google Scholar] [CrossRef]
  25. Nadai, C.; Fernandes Lemos, W.J.; Favaron, F.; Giacomini, A.; Corich, V. Biocontrol activity of Starmerella bacillaris yeast against blue mold disease on apple fruit and its effect on cider fermentation. PLoS ONE 2018, 13, e0204350. [Google Scholar] [CrossRef]
  26. Englezos, V.; Jolly, N.; Di Gianvito, P.; Rantsiou, K.; Cocolin, L. Microbial interactions in winemaking: Ecological aspects and effect on wine quality. Trends Food Sci. Technol. 2022, 126, 99–113. [Google Scholar] [CrossRef]
  27. Erasmus, D.J.; van der Merwe, G.K.; van Vuuren, H.J. Genome-wide expression analyses: Metabolic adaptation of Saccharomyces cerevisiae to high sugar stress. FEMS Yeast Res. 2003, 3, 375–399. [Google Scholar] [CrossRef]
  28. Kimani, B.G.; Kerekes, E.B.; Szebenyi, C.; Krisch, J.; Vágvölgyi, C.; Papp, T.; Takó, M. In Vitro Activity of Selected Phenolic Compounds against Planktonic and Biofilm Cells of Food-Contaminating Yeasts. Foods 2021, 10, 1652. [Google Scholar] [CrossRef]
  29. Pastorkova, E.; Zakova, T.; Landa, P.; Novakova, J.; Vadlejch, J.; Kokoska, L. Growth inhibitory effect of grape phenolics against wine spoilage yeasts and acetic acid bacteria. Int. J. Food Microbiol. 2013, 161, 209–213. [Google Scholar] [CrossRef]
  30. Sabel, A.; Bredefeld, S.; Schlander, M.; Claus, H. Wine Phenolic Compounds: Antimicrobial Properties against Yeasts, Lactic Acid and Acetic Acid Bacteria. Beverages 2017, 3, 29. [Google Scholar] [CrossRef]
  31. Sun, X.; Liu, L.; Zhao, Y.; Ma, T.; Zhao, F.; Huang, W.; Zhan, J. Effect of copper stress on growth characteristics and fermentation properties of Saccharomyces cerevisiae and the pathway of copper adsorption during wine fermentation. Food Chem. 2016, 192, 43–52. [Google Scholar] [CrossRef]
  32. Granchi, L.; Ganucci, D.; Buscioni, G.; Mangani, S.; Guerrini, S. The biodiversity of Saccharomyces cerevisiae in spontaneous wine fermentation: The occurrence and persistence of winery-strains. Fermentation 2019, 5, 86. [Google Scholar] [CrossRef]
  33. Berbegal, C.; Spano, G.; Tristezza, M.; Grieco, F.; Capozzi, V. Microbial Resources and Innovation in the Wine Production Sector. S. Afr. J. Enol. Vitic. 2017, 38, 156–166. [Google Scholar] [CrossRef]
  34. Tufariello, M.; Fragasso, M.; Pico, J.; Panighel, A.; Castellarin, S.D.; Flamini, R.; Grieco, F. Influence of Non-Saccharomyces on Wine Chemistry: A Focus on Aroma-Related Compounds. Molecules 2021, 26, 644. [Google Scholar] [CrossRef] [PubMed]
  35. Torres-Guardado, R.; Rozès, N.; Esteve-Zarzoso, B.; Reguant, C.; Bordons, A. Succinic acid production by wine yeasts and the influence of GABA and glutamic acid. Int. Microbiol. 2024, 27, 505–512. [Google Scholar] [CrossRef] [PubMed]
Figure 1. Yeasts, moulds, and bacteria concentrations during grape drying in winery A (hung grapes) and winery B (grapes placed on racks). Different letters indicate statistically significant differences (ANOVA and Tukey’s test, p < 0.05).
Fermentation 11 00310 g001
Figure 2. Isolation frequencies expressed as percentages of the non-Saccharomyces yeasts found on the grapes during the drying process in the two wineries.
Fermentation 11 00310 g002
Figure 3. Microbial populations and chemical evolution during alcoholic fermentations carried out in wineries A and B using oak wooden barrels of different capacities (100 L continuous line, 50 L dashed line).
Fermentation 11 00310 g003
Figure 4. Isolation frequency expressed as a percentage of the non-Saccharomyces yeasts found during fermentations in the two wineries (in 100 L barrel at the top and 50 L barrel at the bottom).
Fermentation 11 00310 g004
Figure 5. Heat map of the isolation frequencies of the S. cerevisiae inter-δ patterns found during fermentations carried out in the two wineries.
Fermentation 11 00310 g005
Figure 6. UPGMA dendrogram based on the Dice coefficient of the inter δ-patterns of the indigenous S. cerevisiae strains isolated from fermentations carried out in the two wineries.
Fermentation 11 00310 g006
Figure 7. Neighbour-joining consensus tree based on the Dice coefficient of the inter δ-patterns of the S. cerevisiae strains present on the thirteenth day (green) and after over 200 days of fermentation (red) in the vinifications carried out in the two wineries (at left winery A and right winery B).
Fermentation 11 00310 g007
Table 1. Polyphenols and copper concentrations quantified after 230 days of fermentation (mean ± SEM) and absorbance at 420 nm; different letters mean significant differences between column (ANOVA and Tukey test, p < 0.05).
Winery A-100 LWinery A-50 LWinery B-100 LWinery B-50 L
Polyphenols (mg/L)
gallic acid15.3 ± 0.8 a20.4 ± 1.0 a36.3 ± 1.8 b35.1 ± 0.2 b
protocatechuic acid13.4 ± 0.7 a15.2 ± 0.8 a25.1 ± 0.3 b21.7 ± 1 b
caftaric acid7.9 ± 0.4 a8.2 ± 0.4 a17.1 ± 0.9 b18.3 ± 0.9 b
catechin12.7 ± 0.6 a12.8 ± 0.6 a14.2 ± 0.7 a8.7 ± 0.4 c
vanillic acid16.8 ± 0.8 a19.0 ± 0.9 a25.2 ± 1.26 b17.0 ± 0.8 a
caffeic acid4.6 ± 02 a4.5 ± 02 a17.2 ± 09 b18.4 ± 09 b
Total polyphenols index (TPI)31.19 ± 0.20 ab32.48 ± 0.10 a37.62 ± 0.35 c29.73 ± 0.44 b
Cu2+ (mg/L)2.13 ± 0.10 a1.35 ± 0.07 b0.53 ± 0.03 c0.37 ± 0.02 c
Degree of browning (Abs 420)0.1032 ± 0.0030 a0.1072 ± 0.0040 a0.2370 ± 0.0035 b0.1804 ± 0.0025 c
Table 2. Biodiversity indices calculated according to Shannon–Weaver for the S. cerevisiae population obtained from the four vinifications.
H IndexE Index
Winery A 100 L2.280.55
Winery A 50 L2.260.55
Winery B 100 L2.170.53
Winery B 50 L2.650.65
Disclaimer/Publisher’s Note: The statements, opinions and data contained in all publications are solely those of the individual author(s) and contributor(s) and not of MDPI and/or the editor(s). MDPI and/or the editor(s) disclaim responsibility for any injury to people or property resulting from any ideas, methods, instructions or products referred to in the content.

