Article

Optimized Spirulina Fermentation with Lacticaseibacillus rhamnosus: Bioactive Properties and Pilot-Scale Validation

1
Department of Bioengineering, Faculty of Chemical and Metallurgical Engineering, Yıldız Technical University, Istanbul 34349, Turkey
2
Nuvita Biosearch R&D Center, Istanbul 34522, Turkey
3
Department of Food Engineering, Faculty of Chemical and Metallurgical Engineering, Yıldız Technical University, Istanbul 34349, Turkey
4
Department of Industrial Engineering, Faculty of Engineering, Ondokuz Mayıs University, Samsun 55139, Turkey
5
Department of Food Engineering, Faculty of Chemical and Metallurgical Engineering, Istanbul Technical University, Istanbul 34467, Turkey
*
Author to whom correspondence should be addressed.
Fermentation 2025, 11(5), 248; https://doi.org/10.3390/fermentation11050248
Submission received: 3 March 2025 / Revised: 17 April 2025 / Accepted: 25 April 2025 / Published: 1 May 2025

Abstract

:
Sustainable bio-based products derived from fermentation are gaining increasing interest. The present study was designed to determine the interaction of Lacticaseibacillus rhamnosus 23.2 bacteria with spirulina in a 3 L glass bioreactor and the effect of aeration and agitation speed on the final product biomass and antioxidant capacity. The fermentation medium contained only glucose, an inorganic salt mixture, and spirulina powder. The estimated biomass and antioxidant activity were found to be 3.74 g/L and 84.72%, respectively, from the results of the optimization model. Scale-up was performed with the obtained optimization data, and three pilot-scale fermentations were carried out in a 30 L stainless steel bioreactor. As a result of pilot production, the obtained bioactive products were freeze-dried, and their antibacterial, antioxidant, total phenolic properties, and cytotoxic activity were investigated. The pilot production results showed that the increase in bacterial cell number was around 3–4 log after 24 h of fermentation. An inhibitory effect against pathogenic bacteria was observed. A strong radical scavenging effect was found in antioxidant analyses. Total phenolic substance content was 26.5 mg gallic acid equivalent (GAE) g−1, which was the highest level in this study. Cytotoxic activity showed that bioactive products had a cytotoxic effect against Caco-2 adenocarcinoma cells. This study emphasizes the potential of Arthrospira platensis biomass as a substrate for the production of lactic acid bacteria (LAB)-based bioproducts. It is thought that the results obtained from this study may position potential innovative strategies in the food, pharmaceutical, agriculture, and cosmetic industries.

1. Introduction

The global food system places a heavy burden on the environment: greenhouse gas emissions, loss of biodiversity, destruction of terrestrial ecosystems, and is far from sustainable. Nowadays, it has been accepted that developing healthy, functional, and alternative bio-based products would be much better for a sustainable future, and fulfilling the goal is being carried out on bio-based products [1,2]. For that purpose, fermentation is one of the most extensively used technologies in the industry. Although fermentation dates back to ancient times, it is a technology that is still widely used in the present day. In fermentation, microorganisms assimilate the carbon and nitrogen sources and produce enzymes that catalyze the hydrolysis of sugars and proteins. These biochemical changes carried out by microorganisms during fermentation improve the functional value and nutritional properties of the products and directly contribute to the release of or change in bioactive compounds [3,4].
With approximately 260 species identified so far, lactic acid bacteria (LAB) are microorganisms widely distributed in milk, plants, meats, grains, and the gastrointestinal systems of vertebrates. LAB is one of the primary bacterial groups of industrial importance and is used in food production, health regulation, and the production of macromolecules, enzymes, and metabolites [5,6]. LAB species are cocci or rod-shaped, gram-positive, non-spore-forming, catalase-negative, non-cytochrome, non-aerobic but aerotolerant, acid-tolerant, and strongly fermentative bacteria that produce lactic acid as the primary end product during sugar fermentation. Examples of these bacteria include Lactobacillus, Leuconostoc, Pediococcus, Streptococcus, and Lactococcus species [7]. LAB species have the capacity to produce large quantities of bioactive compounds. Since their growth environments include food, dairy products, and plant-based foods, bioactive molecules such as bioactive peptides, polysaccharides, and bacteriocins are frequently found in fermented products [8,9,10].
Microalgae have become one of the most studied groups of organisms in recent years due to their rich content of proteins, fatty acids, vitamins, minerals, pigments, and many other valuable cellular metabolites [11]. Arthrospira platensis, a cyanobacterium (blue-green algae), is a phytoplanktonic organism suitable for intensive production. It is used as an alternative food source in human nutrition because it contains proteins, carotenoids, phycocyanin, chlorophyll pigments, vitamins, and oils. Spirulina contains high protein content, with 45% dry weight in samples and 62% in A. platensis cultured in the laboratory. More recent analyses have confirmed that the protein represents more than 60% and, in some cases, up to 70% of the dry weight. The protein content of spirulina is observed to be higher compared to other single-cell algae and cyanobacteria [12,13,14].
The beneficial effects of traditional fermented foods containing LAB on human health have been determined. Some of these benefits are related to protein-derived bioactive products. Protein-derived products produced by LAB include ribosomally produced and protein hydrolysate by-products used as natural preservatives and nutraceuticals. These protein-derived products with various application areas have attracted industrial attention [15,16]. LAB produces enzymes that catalyze the hydrolysis of proteins, thereby enabling the production of the amino acids they need. This ability they possess produces not only the free amino acids required by the bacteria but also a wide variety of peptides, some of which are equipped with biological activities. Each bacterial species has a different proteinase content that leads to a wide range of proteolytic activities, and the proteolytic activity occurs in a way that depends on the species and strain. Therefore, using lactic acid bacteria is an effective strategy for producing and evaluating bioactive peptides [17,18]. Obtaining valuable compounds as a result of the proteolytic activity of lactic acid bacteria is important for scientific studies to be carried out in this field. The LAB strains like Lactiplantibacillus plantarum, Levilactobacillus brevis, Lacticaseibacillus casei, Lactobacillus helveticus, Lacticaseibacillus rhamnosus, and Bacillus species have been the most commonly used starter cultures to obtain LAB fermented spirulina products with their probiotic properties and contributing to its chemical and functional properties [19,20,21]. Previous studies have shown that the products obtained as a result of the use of spirulina in LAB culture media have positive effects in terms of properties such as antioxidant, antimicrobial, taste, flavor, and number of viable cells [22,23,24]. In a study conducted by Niccolai et al. [25], Arthrospira platensis was fermented with Lactobacillus plantarum ATCC 8014. Not only the in vitro digestibility of fermented spirulina, but also the antioxidant and phenolic substance content were increased. As a result, it was reported that Arthrospira platensis biomass supports the growth and activity of probiotic bacteria during lactic acid fermentation and will be a potential substrate in the production of probiotic-based products. Similarly, Arthrospira platensis was fermented with Lactobacillus plantarum to improve its bioactive properties by De Marco Castro et al. [26]. Accordingly, at the end of the fermentation process, the total phenolic content was found to be 112%, and the DPPH radical scavenging capacity was found to be 60%. It was determined that the effects of fermented spirulina bioactive products increased compared to unfermented spirulina. In another study, Liu et al. [27] reported an increase in DPPH radical scavenging capacity after fermentation of A. platensis biomass in milk.
The present study aims to describe the addition of spirulina to the fermentation medium of L. rhamnosus, the optimization of bioprocess conditions, and to determine the effects of bioactive products. Optimization studies were carried out in a 3 L bioreactor with the help of a D-optimal experimental design. D-optimal design is generated by an iterative search algorithm and seeks to minimize the covariance of the parameter estimates for a specified model. In the fermentation optimization study, the effects on some operational parameters, including spirulina powder (g/L), aeration (vvm), and mixing speed (rpm), on the biomass and antioxidant capacity of the final product were examined. After finding the optimum medium composition, a scale-up was performed, and the study was carried out in a 30 L volume stainless steel bioreactor. Furthermore, as a consequence of pilot-scale studies of the bioactive product obtained, some properties were evaluated. This study is thought to be a guide for scale-up studies in new functional compounds development and fermentation.

2. Materials and Methods

2.1. Isolation and Identification of Bacterial Strain

The homemade ripened cheese samples were collected from Elazığ Province, Turkey. Each sample was stored in a sterilized centrifuge tube at 4 °C and transported to the laboratory once collected. For the isolation and identification of lactic acid bacteria, 10 g of sample was taken from the isolation source, transferred to 90 mL of 0.9% NaCl solution, and homogenized for 2 min. After a series of dilutions with 0.85% (w/v) saline, these samples were spread on de Man, Rogosa, and Sharpe (MRS) agar [28] plates and incubated in an aerobic incubator (BD-S 56, Binder, Tuttlingen, Germany) at 37 °C for 48 h. Next, single colonies were picked from plates and cultivated in an MRS broth medium under 37 °C for overnight incubation. The morphology of strains was initially observed using a microscope to identify the strains that were obtained (CX23, Olympus, Tokyo, Japan). Details of the analyses performed for the identification of the strains are given in the Supplementary Materials. The strains were then further identified using 16S rRNA sequencing. Identified strains are listed in Supplementary Materials in Table S1. During the isolation LAB, 25 strains were identified as L. rhamnosus strains, and among them, L. rhamnosus 23.2 strain was selected to be used as a result of preliminary culture studies. The 16 S rRNA sequences of L. rhamnosus 23.2 strain identified in this study have been recorded in NCBI GenBank under the number PP843593.

2.2. Cultivation of Arthrospira platensis and Biochemical Composition

Arthrospira platensis (SP, 001) microorganism was obtained from the Nuvita Biosearch Center, Istanbul, Turkey. The components listed in the tables follow SAG Medium, which has been used for many years to grow spirulina. SAG Medium consists of Solution A, Solution B, P-IV Metal solution, and Chu micronutrient solution [29]. The contents of these components were given in Table 1, Table 2 and Table 3. After both Solution A and Solution B in Table 1 were sterilized in an autoclave (CL-40L, ALP, Tokyo, Japan), the contents of Solution B were transferred to the bottle containing Solution A and shaken until well mixed. The P-IV metal solution recipe was added to the nutrients in the listed order with constant stirring until approximately 950 mL of dH2O. The Na2EDTA was completely dissolved before adding the other components. Total volume was brought to 1 liter with dH2O. Chu micronutrient solution recipe, to approximately 900 mL of dH2O, was added each component in the order specified while stirring constantly. Total volume was brought to 1 liter with dH2O. [30]. All chemicals used in SAG Medium were of analytical grade and purchased from Sigma-Aldrich (St. Louis, MO, USA), Merck (Darmstadt, Germany), and Isolab Chemicals (Istanbul, Turkey).
Spirulina was grown in 10 L glass bottles with 5% inoculum culture at 28 °C for 14 days. The strain culture was grown with continuous illumination at 200 µmol · m−2 · s−1 provided by warm white (3000 K) LED tube lamp (MAS LEDtube HF 600 mm HE 7W 840 T5, Philips) [31]. Concerning photoperiod, cycles of light:dark (h:h) (16:08) were followed. Culture, after reaching the 1 g/L dry weight, was harvested and dried in a freeze dryer to obtain powder form. Equation (5) was used to calculate the dry matter content.
Lyophilized A. platensis powder was analyzed for total carbohydrate, protein, lipid, moisture, and ash content. Total protein was analyzed following Lowry et al. [32]. Carbohydrates were quantified according to Dubois et al. [33], and lipids were determined according to Marsh and Weinstein [34]. Moisture and ash were determined by the method used by Inegbedion [35]. The biochemical composition of the biomass is given in Table 4. The plan of the study is shown in Figure 1.

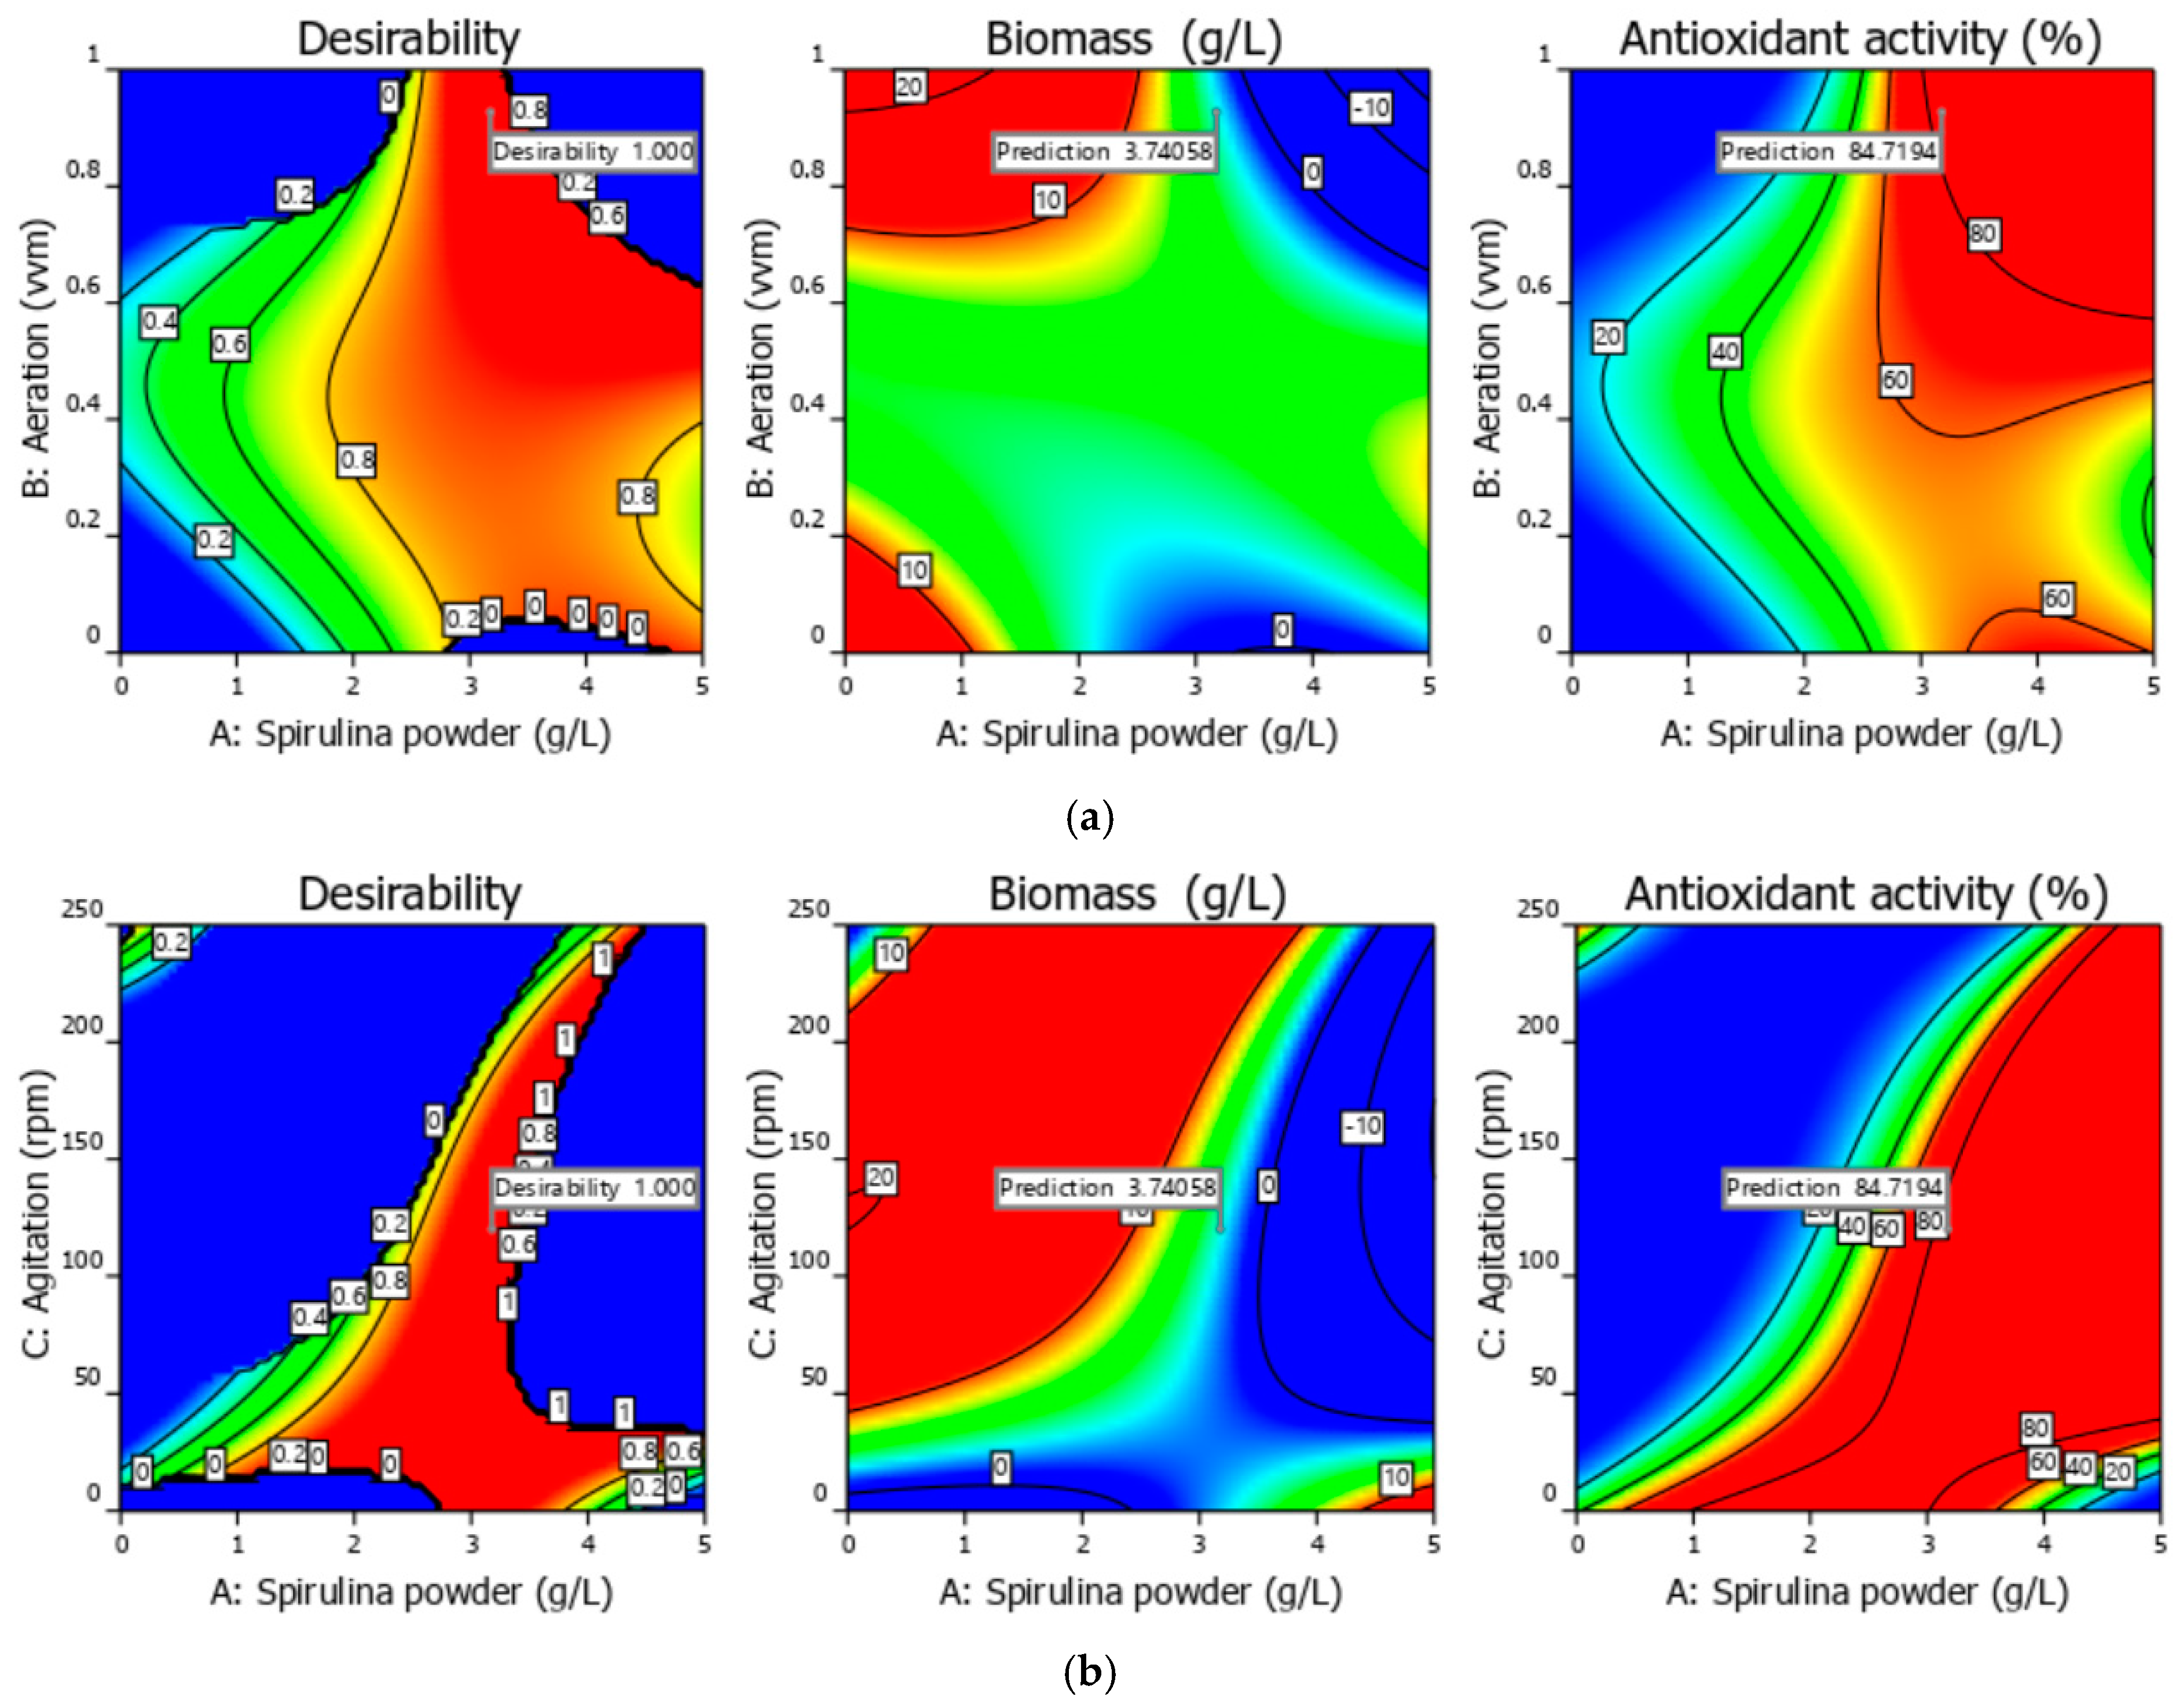
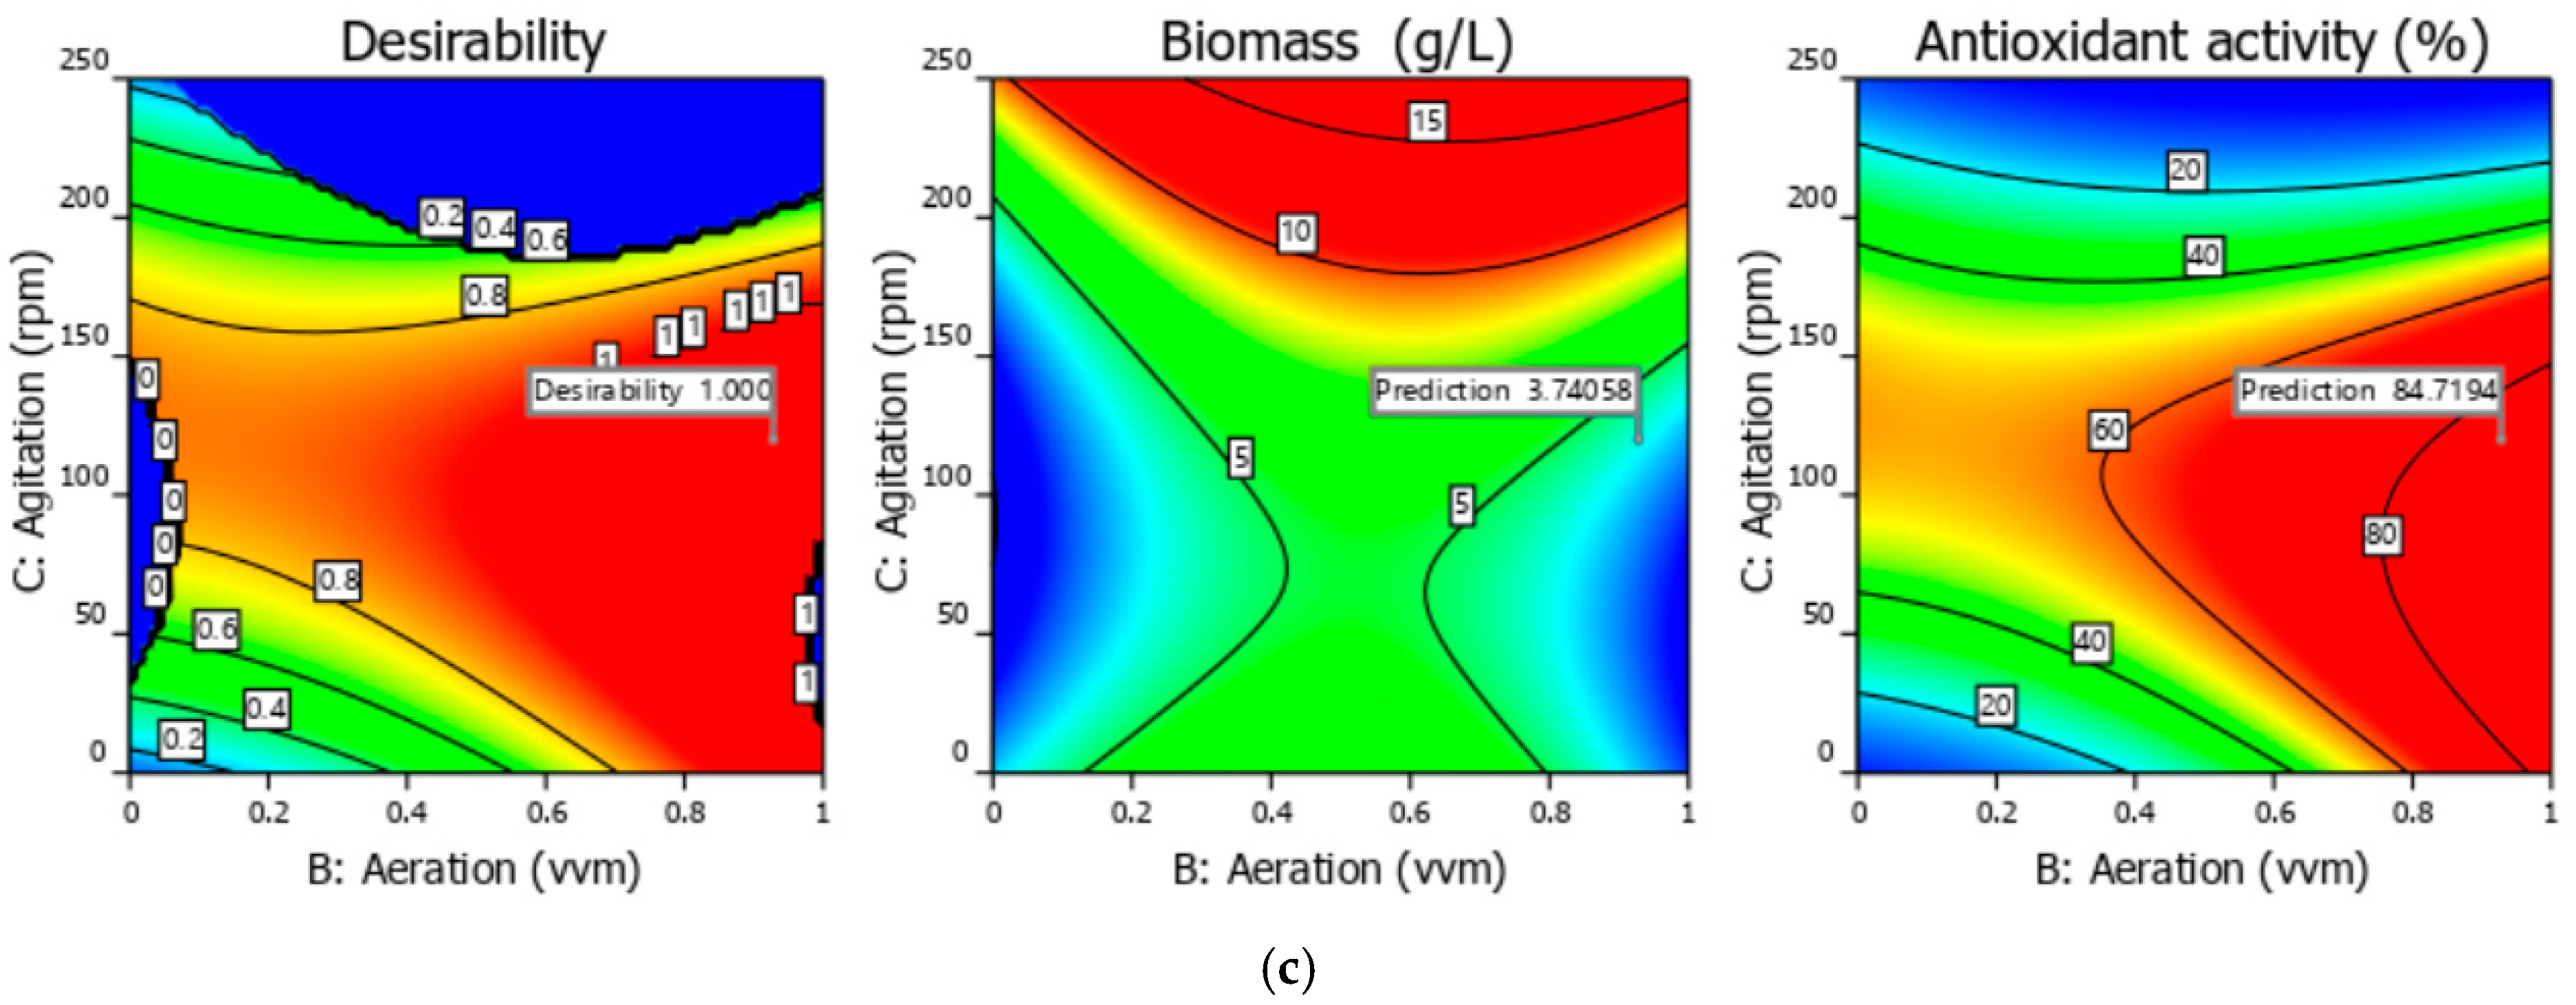
2.3. Optimization of Bioprocess Conditions 3 L Bioreactor

As a result of preliminary studies carried out on the Erlenmeyer scale, high-efficiency results in terms of outputs, such as the viable cell count and both wet and dry biomass in the fermentation process, were obtained in L. rhamnosus 23.2. Therefore, it was decided to use it in the current study. Effects of the parameters such as spirulina powder, aeration, and agitation were investigated on a 3 L bioreactor (Minifors 2, Infors HT, Bottmingen, Switzerland) with a working volume of 1.5 L at batch mode. For all the experiments, the pH was adjusted to 5.8, and the temperature was set to 37 °C. In all bioreactor experiments, 5 g/L of dextrose monohydrate and 2 g/L of inorganic salts were used in the culture medium as carbon source. Spirulina powder was pasteurized at 80 °C for 15 min and then added to the autoclaved bioreactor media. The composition of inorganic salt mix added to the fermentation medium at 2 g/L is as follows: CH3COONa 40%; K2HPO4 20%; C6H8O7·2NH3 15%; MgSO4·7H2O 15%; and MnSO4 10%. Oxygen tension was measured by determining the percentage of dissolved oxygen (DO%) relative to air saturation using an oxygen electrode (InPro 6830; Mettler Toledo, Switzerland). Fermentation time was set at 24 h and inoculation rate at 5%. Aeration rate (0–1 vvm), agitation speed (0–250 rpm), and spirulina powder (0–5 g/L) were used as optimization parameters. Agitation is crucial in overcoming mass transfer resistances in fermentation systems, and this is directly related to agitation speed. Aeration rate is an important process parameter for the growth of aerobic and anaerobic microorganisms [36,37]. For these reasons, they were selected to optimize fermentation in the study.

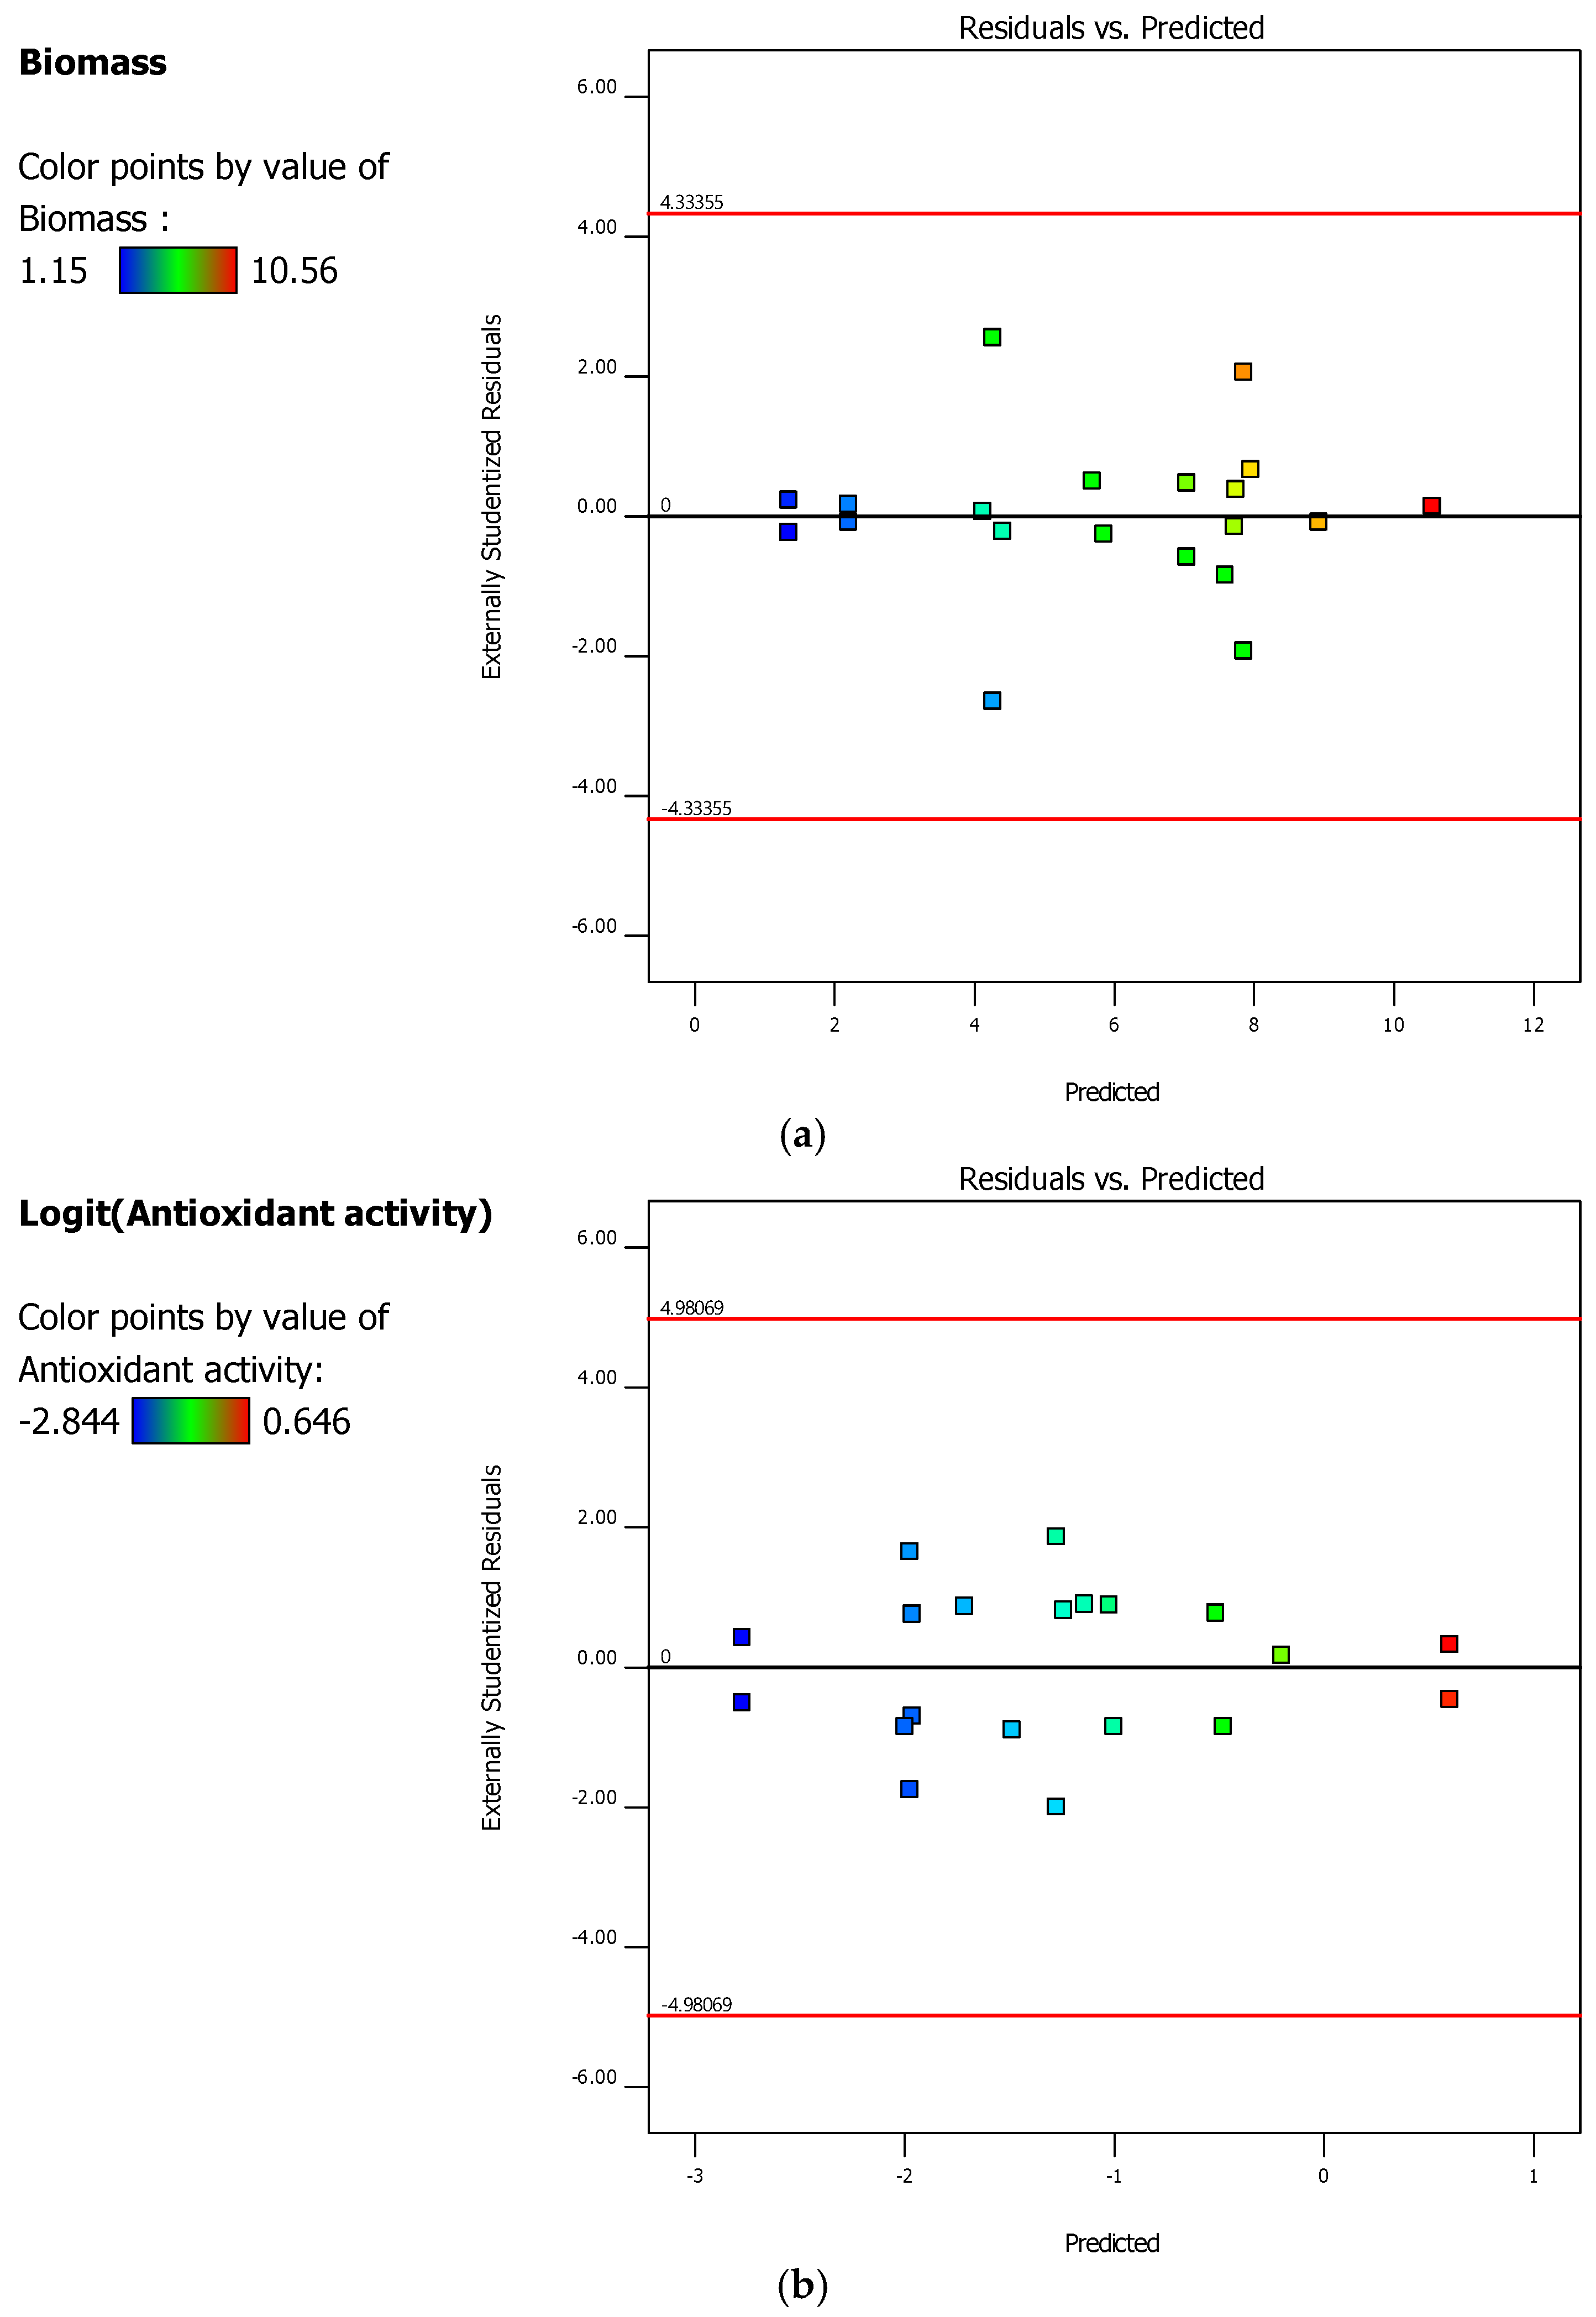
2.4. D-Optimal Experimental Design and the Optimization Phase

Design selection is a crucial concept in reaching the desired goals for an experimental study. A number of experimental designs are available in the current literature. This paper employs a D-optimal experimental design to construct a design matrix (DM) for the experimental study. The D-optimal design aims to maximize the determinant of the information matrix, and the exchange algorithm can be used to construct the DM [38].
We aim to optimize the lactic acid bacteria culture medium and find the highest antioxidant activity of the product to be obtained. Next, the design factors and collected experimental data are presented in Table 5. As shown in Table 5, the three design factors are specified as follows: A = spirulina powder (g/L), B = aeration (vvm), and C = agitation (rpm). Also, the two response variables are denoted as follows: y1 = biomass (g/L) and y2 = antioxidant activity (%). In Table 5, the DM of a D-optimal design consists of ten required design points, five lack-of-fit design points, and five replicate design points to carry out the experimental study for the responses, y1 and y2. The DM was constructed with the exchange procedure, and the computational time was 1266.57 s. Moreover, the experimental runs were randomly constructed without experimental bias.
The estimated biomass (g/L) response, μ ^ 1 ( x ) , is given as follows:
μ ^ 1 ( x ) = ϕ ^ 0 + x d + x D x   where   x = A B C ,   d = ϕ ^ 1 ϕ ^ 2 ϕ ^ 3 ,   and   D = ϕ ^ 11 ϕ ^ 12 / 2 ϕ ^ 13 / 2 ϕ ^ 21 / 2 ϕ ^ 22 ϕ ^ 23 / 2 ϕ ^ 31 / 2 ϕ ^ 32 / 2 ϕ ^ 33
where ϕ ^ i is the ith coefficient of the biomass regression function. Moreover, d and D represent the vector and matrix of the estimated regression coefficients for the biomass (g/L) response, respectively. Similarly, the estimated antioxidant activity (%) response, μ ^ 2 ( x ) , is acquired in the following way.
μ ^ 2 ( x ) = φ ^ 0 + x e + x E x   where   x = A B C ,   e = φ ^ 1 φ ^ 2 φ ^ 3 ,   and   E = φ ^ 11 φ ^ 12 / 2 φ ^ 13 / 2 φ ^ 21 / 2 φ ^ 22 φ ^ 23 / 2 φ ^ 31 / 2 φ ^ 32 / 2 φ ^ 33
where φ ^ i denotes the ith coefficient of the antioxidant activity regression function. Then, e and E are the vector and matrix of the estimated regression coefficients for the antioxidant activity (%) response, respectively.
A ratio of max to min greater than ten indicates a transformation. In Table 1, a ratio of max to min is 11.927 for the antioxidant activity (%) response, so a transformation is useful. The logit transformation technique was selected because the data were collected between 0% and 100% for the antioxidant activity (%) response. The transformation is obtained for the antioxidant activity (%) response as follows.
logit   y 2 , i = ln y 2 , i l l u l y 2 , i   and   i = 1 ,   2 ,   ,   20
where lower limit (ll) and upper limit (ul) denote 0% and 100%, respectively.
The offered bi-objective optimization model aims to maximize the overall desirability function for the biomass (g/L) and the antioxidant activity (%) responses when dealing with boundary constraints. The overall desirability function is calculated using the geometric mean desirability functions of the biomass and the antioxidant activity. The bi-objective model is presented in the following way.
maximize   d 1 ϕ ^ 0 + x d + x D x d 2 Logit φ ^ 0 + x e + x E x 1 / 2 subject   to   1 A , B , C + 1 where   d 1 ϕ ^ 0 + x d + x D x = 0 ,   ϕ ^ 0 + x d + x D x < L 1 ϕ ^ 0 + x d + x D x L 1 T 1 L 1 ,   L 1 ϕ ^ 0 + x d + x D x T 1 1 ,   ϕ ^ 0 + x d + x D x > L 1 , d c r Logit φ ^ 0 + x e + x E x = 0 ,   Logit φ ^ 0 + x e + x E x < L 2 Logit φ ^ 0 + x e + x E x L 2 T 2 L 2 ,   L 2 Logit φ ^ 0 + x e + x E x T 2 1 ,   Logit φ ^ 0 + x e + x E x > L 2 ,
In Equation (4), d 1 ϕ ^ 0 + x d + x D x and d 2 Logit φ ^ 0 + x e + x E x represent the desirability functions of the biomass and the antioxidant activity, respectively. Moreover, L1 and L2 are the lower values for the two responses. Further, T1 and T2 denote the specified target values for the two responses. In addition, the Design-Expert software (Ver. 12.0.3.0) was utilized for the experimental data analysis and plotting graphs. The MATLAB optimization toolbox (Ver. R2014a) was employed to acquire the optimum factor settings in (4).

2.5. Determination of Biomass

Dry cell weight is the weight of biomass calculated from the wet matter value in 1 g of sample in the moisture analyzer (Ohaus MB120, Parsippany, NJ, USA). The equation used is given below [39].
D r y   c e l l   w e i g h t   g L = W e t   w e i g h t   g L · D r y   w e i g h t   ( % )

2.6. Analyses of Antioxidant Activity

The DPPH (2,2-diphenyl-1-picrylhydrazyl) test is widely used to evaluate the capacity of antioxidants to neutralize free radicals. The basic principle of the test is that the purple color of DPPH turns yellow due to the antioxidant properties of the sample. In this test, 0.2 mM DPPH solution is mixed with the sample in a 9:1 ratio, and the analysis is performed. After incubation at dark for 30 min, absorbances were measured at 517 nm [40].
% D P P H = A b s D P P H A b s S a m p l e A b s D P P H × 100

2.7. Pilot-Scale Production Experiments

After fermentation optimization, a scale-up study was carried out in a stainless steel stirred tank bioreactor with a working volume of 30 L (SKN-30, Kocaeli, Turkey). Since a scale-up factor of 1:10 was used, the study was switched from 3 L to 30 L. The bioreactor is made up of a glass vessel with four equally spaced vertical baffles and 12 cm diameter of stainless steel dual Rushon-style impellers that perform the agitation. The fermentation medium and the vessel were sterilized for 30 min at 121 °C, the pH of the medium was adjusted to 5.8, and the fermentation temperature was maintained at 37 °C. The working volume was determined to be 20 L, and pilot production runs were conducted three times for validation purposes. The culture media, 5 g/L dextrose monohydrate and 2 g/L inorganic salts, were used in pilot production. Additionally, optimum design factors were used with spirulina powder, and aeration and agitation were obtained as a result of the experiments carried out in a 3 L glass bioreactor. Additionally, a pilot production was conducted as the 4th study (without spirulina), where all conditions remained the same, and without spirulina powder in the medium. As a result of pilot production, the obtained products were lyophilized in a freeze dryer. Freeze-drying was performed for sublimation at −55 °C and a chamber pressure of 160 mTorr for 24 h and desorption for two h using the Epsilon 2–4 LSCplus freeze dryer (Martin Christ, Osterode, Germany). The freeze-dried bioactive product powders were packed using moisture barrier packages and stored at 4 °C until further analysis.

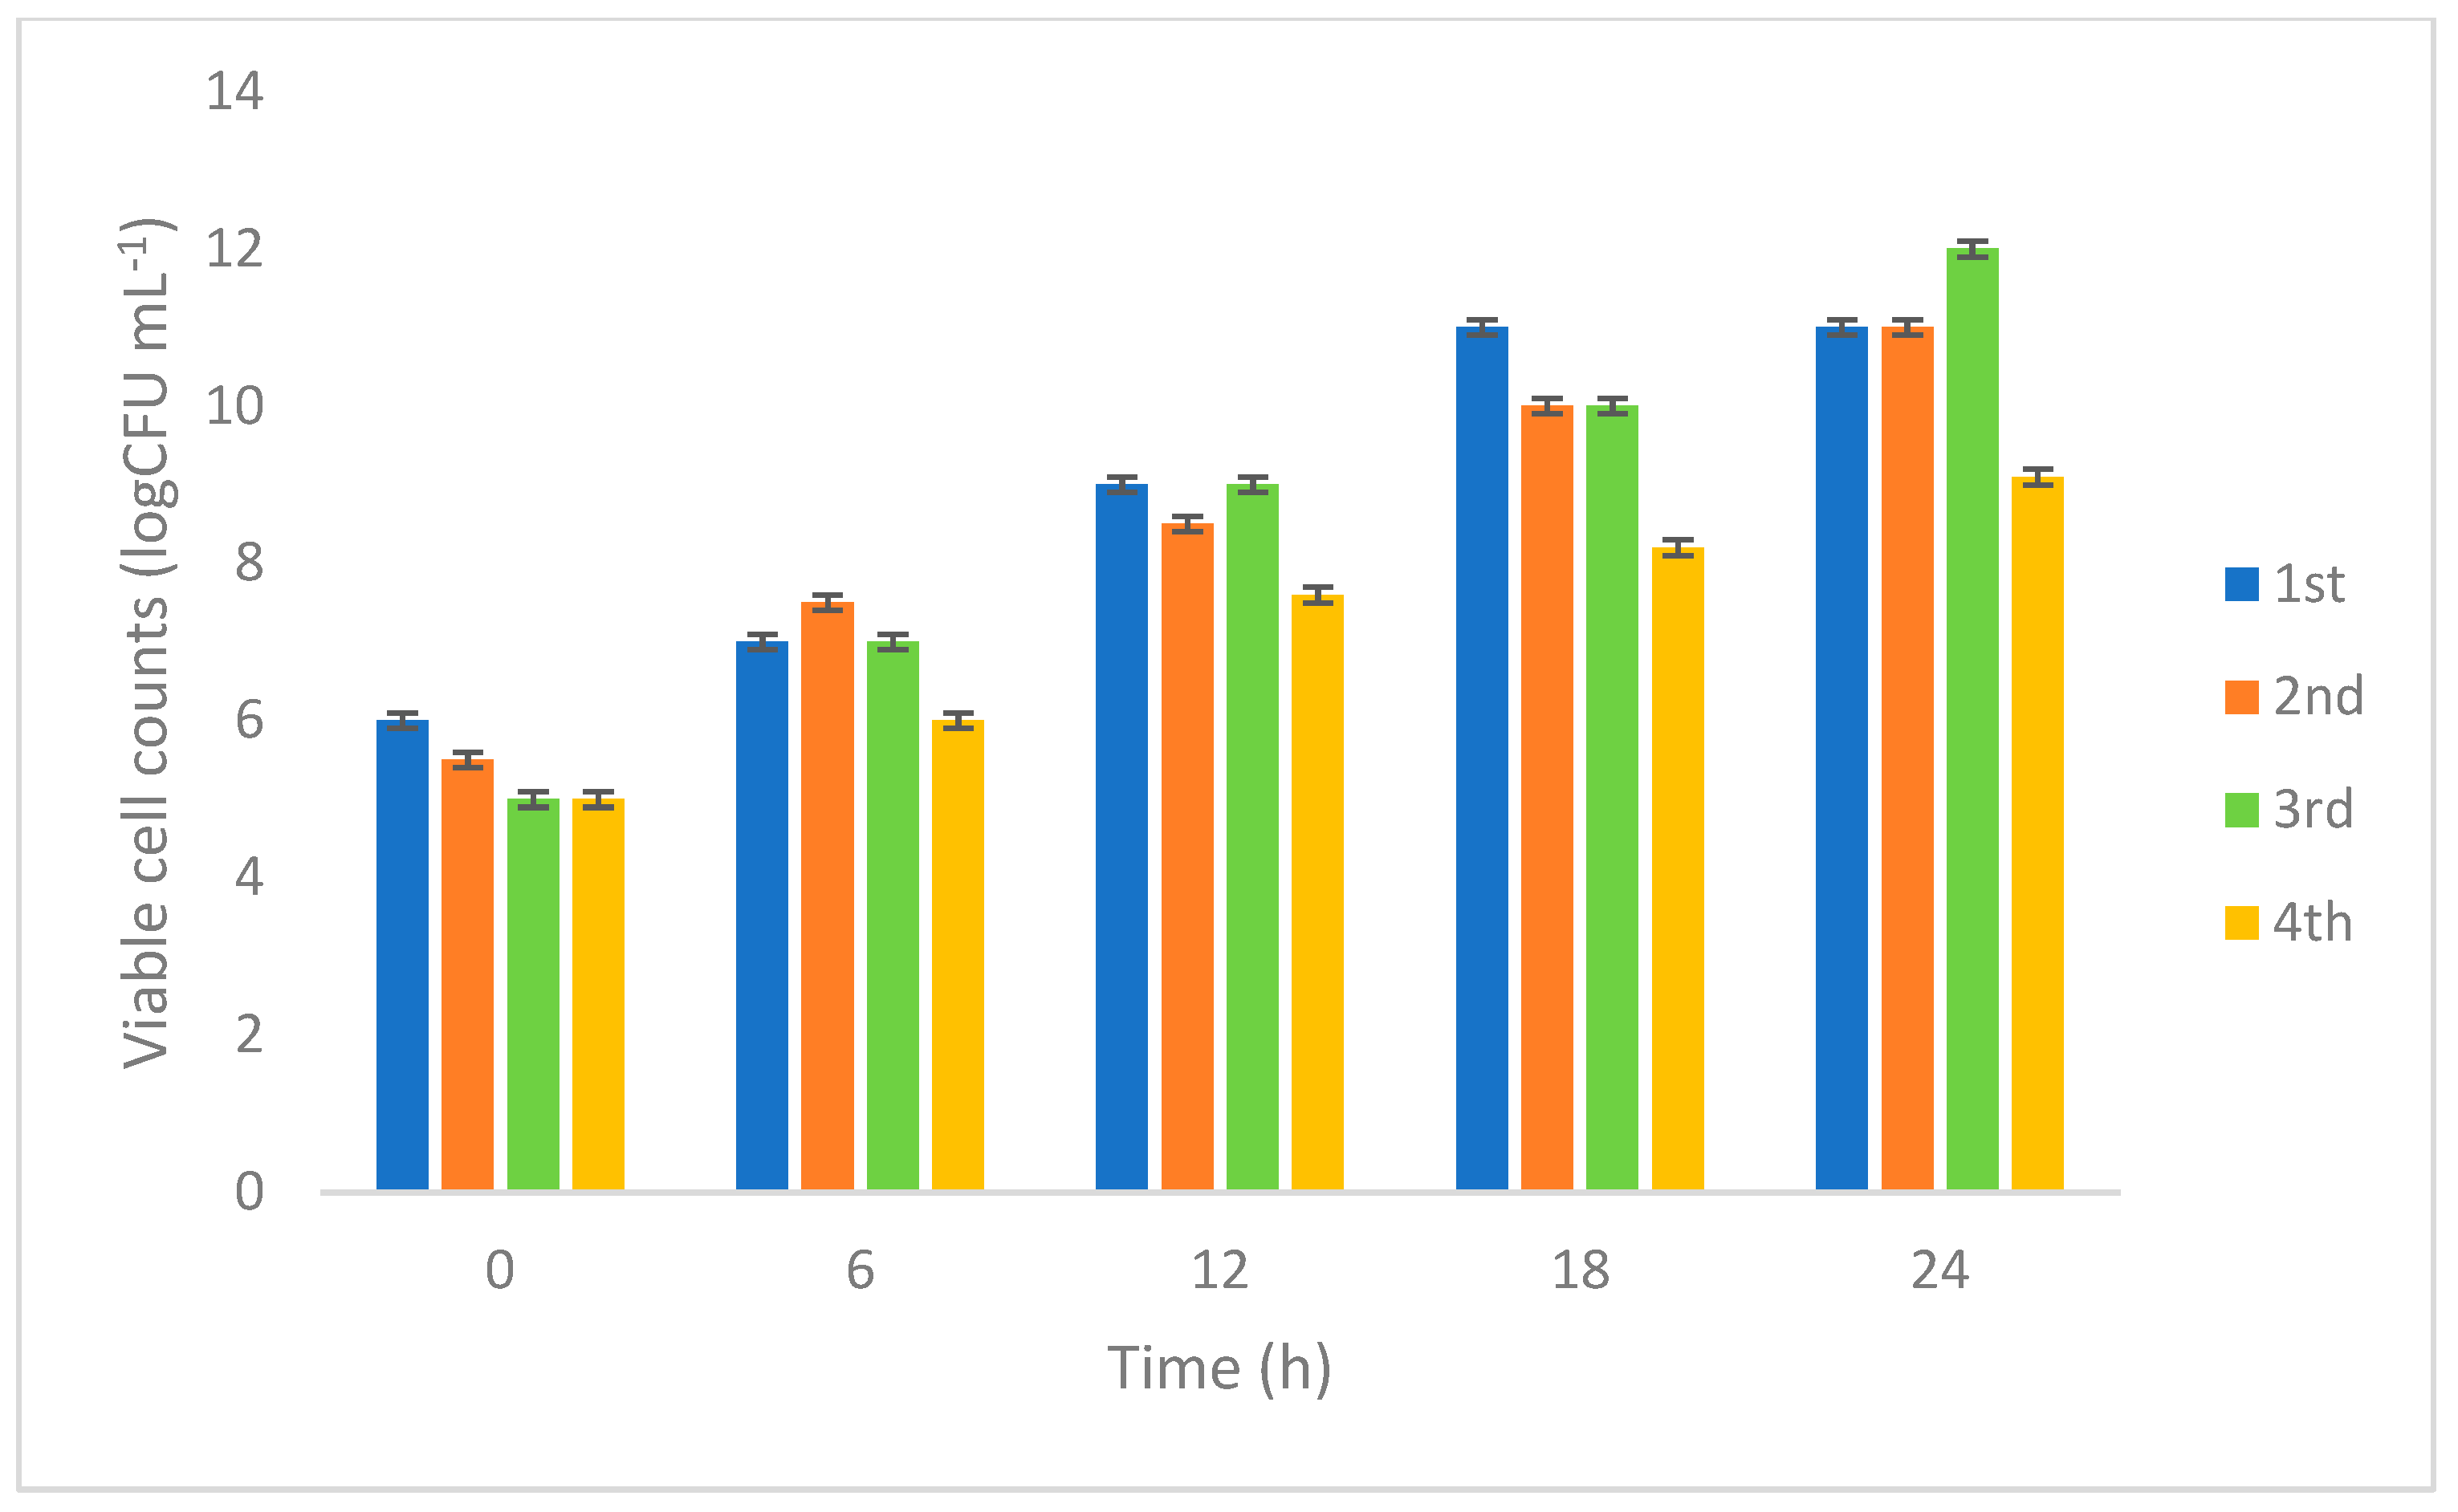
2.7.1. Monitoring Viable Cell Count

Fermentation was monitored by withdrawing samples from bioreactor productions at different time intervals, and the pour plate method [41] was used to enumerate viable cells. L. rhamnosus 23.2 colonies were counted in the MRS agar medium under aerobic conditions. Changes in the viable cell counts were determined as the log CFU/mL.

2.7.2. Antibacterial Activity

The antibacterial activity of the bioactive product was determined using the agar well diffusion method. Escherichia coli, Staphylococcus aureus, Salmonella enterica, Listeria monocytogenese pathogenic bacteria were inoculated in Brain Heart Infusion broth (Neogen, Lansing, MI, USA). The density of lyophilized bioactive product and pathogenic bacteria was adjusted according to the McFarland (0.5%) standard. A 100 µL amount of each pathogen to be tested was spread on the BHI agar surface [42]. The wells (6 mm diameter) were prepared using a sterile well borer, and 100 μL of collected bioactive product was poured into the wells. The plates were then kept undisturbed for diffusion and incubated at 37 °C for 16–18 h. A clear zone of inhibition of 1mm or greater diameter (excluding 6 mm of well diameter) was considered positive inhibition, and actual values were given [43].

2.7.3. Antioxidant and Total Phenolic Content Determination

The total phenolic content assay was carried out according to Singleton et al. [44] using the Folin–Ciocalteu assay samples of 0.1 g of lyophilized bioactive product at 0 and 24 h dissolved in 10 mL of deionized water. To 100 μL aliquots of each sample, 2 mL of 2% sodium carbonate (Merck, Darmstadt, Germany) in water was added. After 2 min, 100 μL of 50% Folin–Ciocalteu reagent (Sigma-Aldrich, USA) was added. The reaction mixture was incubated in darkness at 25 °C for 30 min. The absorbance of each sample was measured at 760 nm using a UV–Vis spectrophotometric microplate reader (AMR 100, Allshengen, Hangzhou, China). Results were expressed in gallic acid equivalents (mg GAE g−1) through a calibration curve of gallic acid (0 to 500 μgmL−1) (Sigma-Aldrich, USA). Gallic acid calibration solutions of 0, 25, 50, 75, 100, 125, and 150 µg/mL concentrations were prepared in duplicates. Antioxidant activity was followed as described in Section 2.6.

2.7.4. Cytotoxic Activity

Cytotoxic activity was determined for bioactive compounds in each sample, and the modified method described by Cakir-Koc et al. [45] was used. Cytotoxicity was determined using Caco-2 adenocarcinoma cells. The Caco-2 cell line was obtained through the American Type Culture Collection (ATCC). Caco-2 cells were fed with 10% (v/v) fetal bovine serum (FBS) (PAN-Biotech, Aidenbach, Germany), 1% (v/v) non-essential amino acids (PAN-Biotech, Germany), and 1% (v/v) penicillin–streptomycin (PAN-Biotech, Germany) inactivated for one h at 56 °C in Dulbecco’s modified Eagle’s minimal essential medium (DMEM) (PAN-Biotech, Germany) containing 4.5 g/L glucose. Experiments were performed at 37 °C and in a 5% CO2:95% air atmosphere. MTT (3-[4,5-dimethylthiazol-2-yl]-2,5 diphenyl tetrazolium bromide) (AFG Bioscience, Northbrook, IL, USA) solution was then added to the wells after the medium parts of the wells were removed. The microplates were incubated at 37 °C for 4 h. After the incubation period, the optical density (OD) at 450 nm was determined using a microplate reader (AMR100 Microplate Reader, Hangzhou, China). The following formula (Equation (7)) was used to determine the number of viable cells.
C e l l   v i a b i l i t y % = A s A c × 100
where As is the absorbance of the peptide solution and Ac is the absorbance of the control sample.

2.8. Statistical Analysis for Pilot Production

The data were analyzed statistically using the SPSS Statistics software package (version 29.0, IBM Corp., Armonk, NY, USA). The quantitative data were analyzed using one-way analysis of variance (ANOVA) with the Duncan multiple range tests (p < 0.05). The total bacterial cell counts (CFU/mL) were converted to a logarithmic value before statistical analysis.

3. Results and Discussion

The study was initiated by identifying the bacterial strain and cultivating A. platensis. Co-cultivation of LAB and spirulina and optimization studies were carried out in a 3 L glass bioreactor with 20 different experiments. In consideration of the obtained optimization results, three different productions were carried out under the same conditions in a stainless steel bioreactor with a total volume of 30 L. Some tests were conducted to determine the properties of the bioactive products obtained as a result of pilot production.
The biochemical composition of powder form spirulina was analyzed and shown in Table 4. The protein content of spirulina used in the study was found to be approximately 60%.
Table 4. Biochemical composition of A. platensis biomass used in the study.
CarbohydrateProteinLipidAshMoisture
Arthrospira platensis21.1 ± 0.759.6 ± 0.39.7 ± 0.65.8 ± 0.13.8 ± 0.2
Data are expressed as % of algal powder. Values are expressed as mean ± s.d.

3.1. Experimental and Optimization Results of Bioprocess Conditions 3 L Bioreactor

Experimental design factors and responses for cultivation of L. rhamnosus in the 3 L bioreactor are given in Table 5. Pilot-scale validation studies were carried out with the optimum parameters obtained at the 3 L bioreactor scale.
Table 5. The three design factors and collected data for the experiment.
Design Factors
FactorNameUnitsCoded/Uncoded LowCoded/Uncoded High
ASpirulina powderg/L−1/0.00+1/5.00
BAerationvvm−1/0.00+1/1.00
CAgitationrpm−1/0.00+1/250.00
DM of a D-optimal design and collected data for the two responses
Factor AFactor BFactor CResponse y1Response y2
Spirulina powderAerationAgitationBiomassAntioxidant activity
Run(g/L)(vvm)(rpm)(g/L)(%)
15.001.000.006.5210.21
20.000.000.001.155.50
30.001.00250.002.6325.60
45.000.0088.627.6516.20
51.620.00108.756.1211.50
61.620.57250.008.5436.70
70.001.000.002.3413.45
82.981.00149.137.4563.10
95.000.00250.007.9517.40
105.000.65250.008.8923.51
110.000.000.001.546.21
123.440.31171.836.7845.67
130.001.000.002.1311.34
142.980.400.004.1637.89
152.981.00149.136.5465.60
160.001.00250.005.8718.36
175.001.000.009.2514.40
181.770.00250.005.6927.88
195.000.5781.1110.5625.61
200.000.40149.014.2024.72
Table 6 shows the summaries of fits and ANOVA results of biomass (y1) and antioxidant activity (y2) responses. Also, the model reductions improve the models of y1 and y2 responses; therefore, the reduced cubic models (RCMs) are used in Table 6. Insignificant model terms were omitted for y1 and y2 responses, excluding the necessary ones to provide a hierarchy.
The values of the maximum coefficient of determination (R2), the adjusted R2( R a d j 2 ), and the absolute predicted coefficient of determination ( R p r e 2 ) are denoted in Table 6 for y1 and y2 responses. These values are good enough for y1 and y2 responses. Also, the differences were found to be less than 0.2 between R a d j 2 and R p r e 2 for each response. So, R p r e 2 values are in agreement with R a d j 2 values in Table 6. Next, adequate precision values measure the signal-to-noise ratios, and ratios of y1 and y2 responses are desirable when ratios are greater than or equal to four. For both responses, adequate signals were obtained. Then, Table 6 shows the F-values and p-values. Based on these values, the models of y1 and y2 responses were found to be significant. Further, the significant model terms are presented in Table 6 for y1 and y2 responses when using the RCMs. Moreover, the lack of fits was found to be non-significant for both responses, and indeed, the non-significant lack of fits was desirable. High R2 and R a d j 2 values are an indication of a close interaction between the experimental results and the values obtained from the model [46]. In the present study, from the high R2 and R a d j 2 values obtained, it can be said that the experimental and predicted values are very close to each other, indicating the success of the established model.
Based on Figure 2, the points were relatively close to the origin and distributed roughly symmetrically about the origin. Also, no patterns were observed in Figure 2. Thus, the RCMs are good fits for the experimental data.
The RCMs of biomass (y1) and antioxidant activity (y2) responses were acquired in terms of coded equations in the following way.
μ ^ 1 x = 6.40 + 4.16 B + 8.00 C 7.92 A B 6.24 A C + 2.01 B C 1.10 A 2                9.64 A 2 B 15.22 A 2 C 17.33 A B 2 + 21.83 A C 2
μ ^ 2 L o g i t x = 0.26 + 1.28 A 1.88 C + 2.56 A B + 1.49 A C 1.23 B C 0.66 A 2                           0.79 B 2 0.68 C 2 + 1.74 A 2 B + 4.94 A 2 C + 4.87 A B 2 7.22 A C 2
The introduced bi-objective optimization model in Equation (4) was modeled with Equations (8) and (9). The aim of the bi-objective optimization model was to obtain the highest desirability function while acquiring the highest biomass and antioxidant activity. The optimum design factors are found as follows: A = 3.18 g/L, B = 0.93 vvm, and C = 119.97 rpm. The estimated biomass (g/L) and antioxidant activity (%) were found to be 3.74 and 84.72, respectively, from the results of the bi-objective optimization model. Also, the overall desirability value was acquired to be one. This desirability value indicates that the responses are highly desirable. Further, the validation run was carried out to verify the optimization results. As shown in Table 7, the actual biomass (g/L) and antioxidant activity (%) were acquired to be 4.23 and 81.59, respectively, from the validation study. Hence, it is reported that the bi-objective optimization and validation experimental results are in agreement to achieve the highest biomass and antioxidant activity.
Figure 3 illustrates how the desirability and the estimated responses’ values change for the design factors using contour plots. As illustrated in Figure 3, the highest desirability, which was 1.000, was achieved as A = 3.18 g/L, B = 0.93 vvm, and C = 119.97 rpm. Also, the estimated biomass (g/L) and antioxidant activity (%) values may be observed in Figure 3, and the highest conditions are acquired as 3.74 g/L and 84.72%, respectively.

3.2. Pilot-Scale Production

Bioactive product production was carried out in a 30 L stainless steel bioreactor under optimized fermentation conditions in a 3 L glass bioreactor. Moreover, pilot-scale production was carried out. This production was repeated 3 times to include validation. The reason for replicating the 30 L pilot production studies three times was to validate pilot-scale production and demonstrate its feasibility. This is important because a major problem of pilot production in scaling-up studies is reproducibility. The products of pilot production studies were in powder form, obtained with a lyophilizer, and various analyses were performed. In the fourth study in pilot production, all parameters were kept constant, and without spirulina powder was not added.

3.2.1. Monitoring Viable Cell Count L. rhamnosus 23.2

The growth of L. rhamnosus 23.2 was monitored by taking samples at certain time points belonging to different bioreactor conditions during 24 h of fermentation. Figure 4 shows the viable cell counts of L. rhamnosus for pilot production. The results indicate that the presence of spirulina and fermentation conditions affect the growth of L. rhamnosus. In all four studies, cell counts were measured at close intervals initially. At the end of 24 h, the cell count of the fourth study was lower than the other three studies.
At the initial stage of the pilot productions, the number of viable L. rhamnosus cells started with 4.5–6.5 log CFU mL−1 and increased to over 12 log CFU mL−1 as a result of 24 h of fermentation for three pilot productions. The highest number of viable cells was reached in the third study and at 24 h. The results of the three studies were close to each other. On the other hand, the number of viable cells without spirulina was lower than in fermented spirulina samples. Also, initially, without spirulina, the number of viable L. rhamnosus cells started with 5 log CFU mL−1 and increased to over 8 log CFU mL−1 as a result of 24 h of fermentation. The fourth study, without spirulina, was the production with the lowest number of viable cells. Previous studies have shown that the presence of spirulina in the fermentation medium increases the viable cell count of LAB. It was determined that the increase in the number of viable cells was directly proportional to the increase in biomass [47,48,49]. Spirulina powder is also important in increasing biomass. Spirulina protein content has been found to be between 55% and 70% in different studies. In the current study, spirulina powder with approximately 60% protein content was used [50,51]. Based on previous studies, higher viable cell counts were achieved in pilot-scale production than in bottle-scale production. Therefore, implementing processes at the pilot bioreactor scale, where aeration and mechanical agitation took place, potentially enhances the growth rate of the L. rhamnosus when compared to their flask-scale production.

3.2.2. Antibacterial Activity

The ability to inhibit the growth of pathogenic microorganisms is one of the mechanisms LAB performs to protect the host. Lactic acid bacteria’s proteolytic activity gives rise to small peptide compounds displaying antibacterial activity. These compounds are appreciated in industry productions as natural preservatives counteracting undesired contamination [52,53]. The results of the analysis of the antibacterial effects of bioactive products against the pathogens E. coli, S. aureus, S. enterica, and L. monocytogenes are given in Table 8. The third study showed inhibitory effects on all four different pathogens studied. In general, bioactive products showed inhibition against the L. monocytogenes and S. aureus pathogens. Inhibition against E. coli was observed in three pilot productions, especially the third study, which showed high efficacy. Similar results were obtained for S. enterica in three studies. When the results of the fourth study with and without spirulina were examined, it was found that there was no significant difference between fermented spirulina. Similar results were obtained when without spirulina was compared to fermented spirulina in Gram-negative bacteria. Numerous studies have demonstrated the antimicrobial activity and efficacy of lactic acid bacteria against foodborne pathogens [54,55]. Yang et al. [56] stated that when investigating the bacteriostatic mechanisms of the L. plantarum strain, which has significant antibacterial activity against L. monocytogenes, they found the highest antibacterial effect against L. monocytogenes among 12 different pathogenic bacteria. Tolpeznikaite et al. [57] stated that the antibacterial effect of fermented spirulina (FS) products was much better expressed against Gram-positive bacteria than against Gram-negative bacteria. They also reported the strong antimicrobial activity of FS against S. aureus. Lactic acid bacteria can inhibit the growth of pathogens in various ways, increasing the permeability of the thin outer membrane, altering the intracellular osmotic pressure, and inhibiting the synthesis of macromolecules. We suppose that the bioactive product may inhibit the expression of L. monocytogenes membrane transport-related genes by producing bacteriocin production mechanisms, hence disrupting the cell membrane structure and inhibiting metabolic viability, biofilm, and growth.

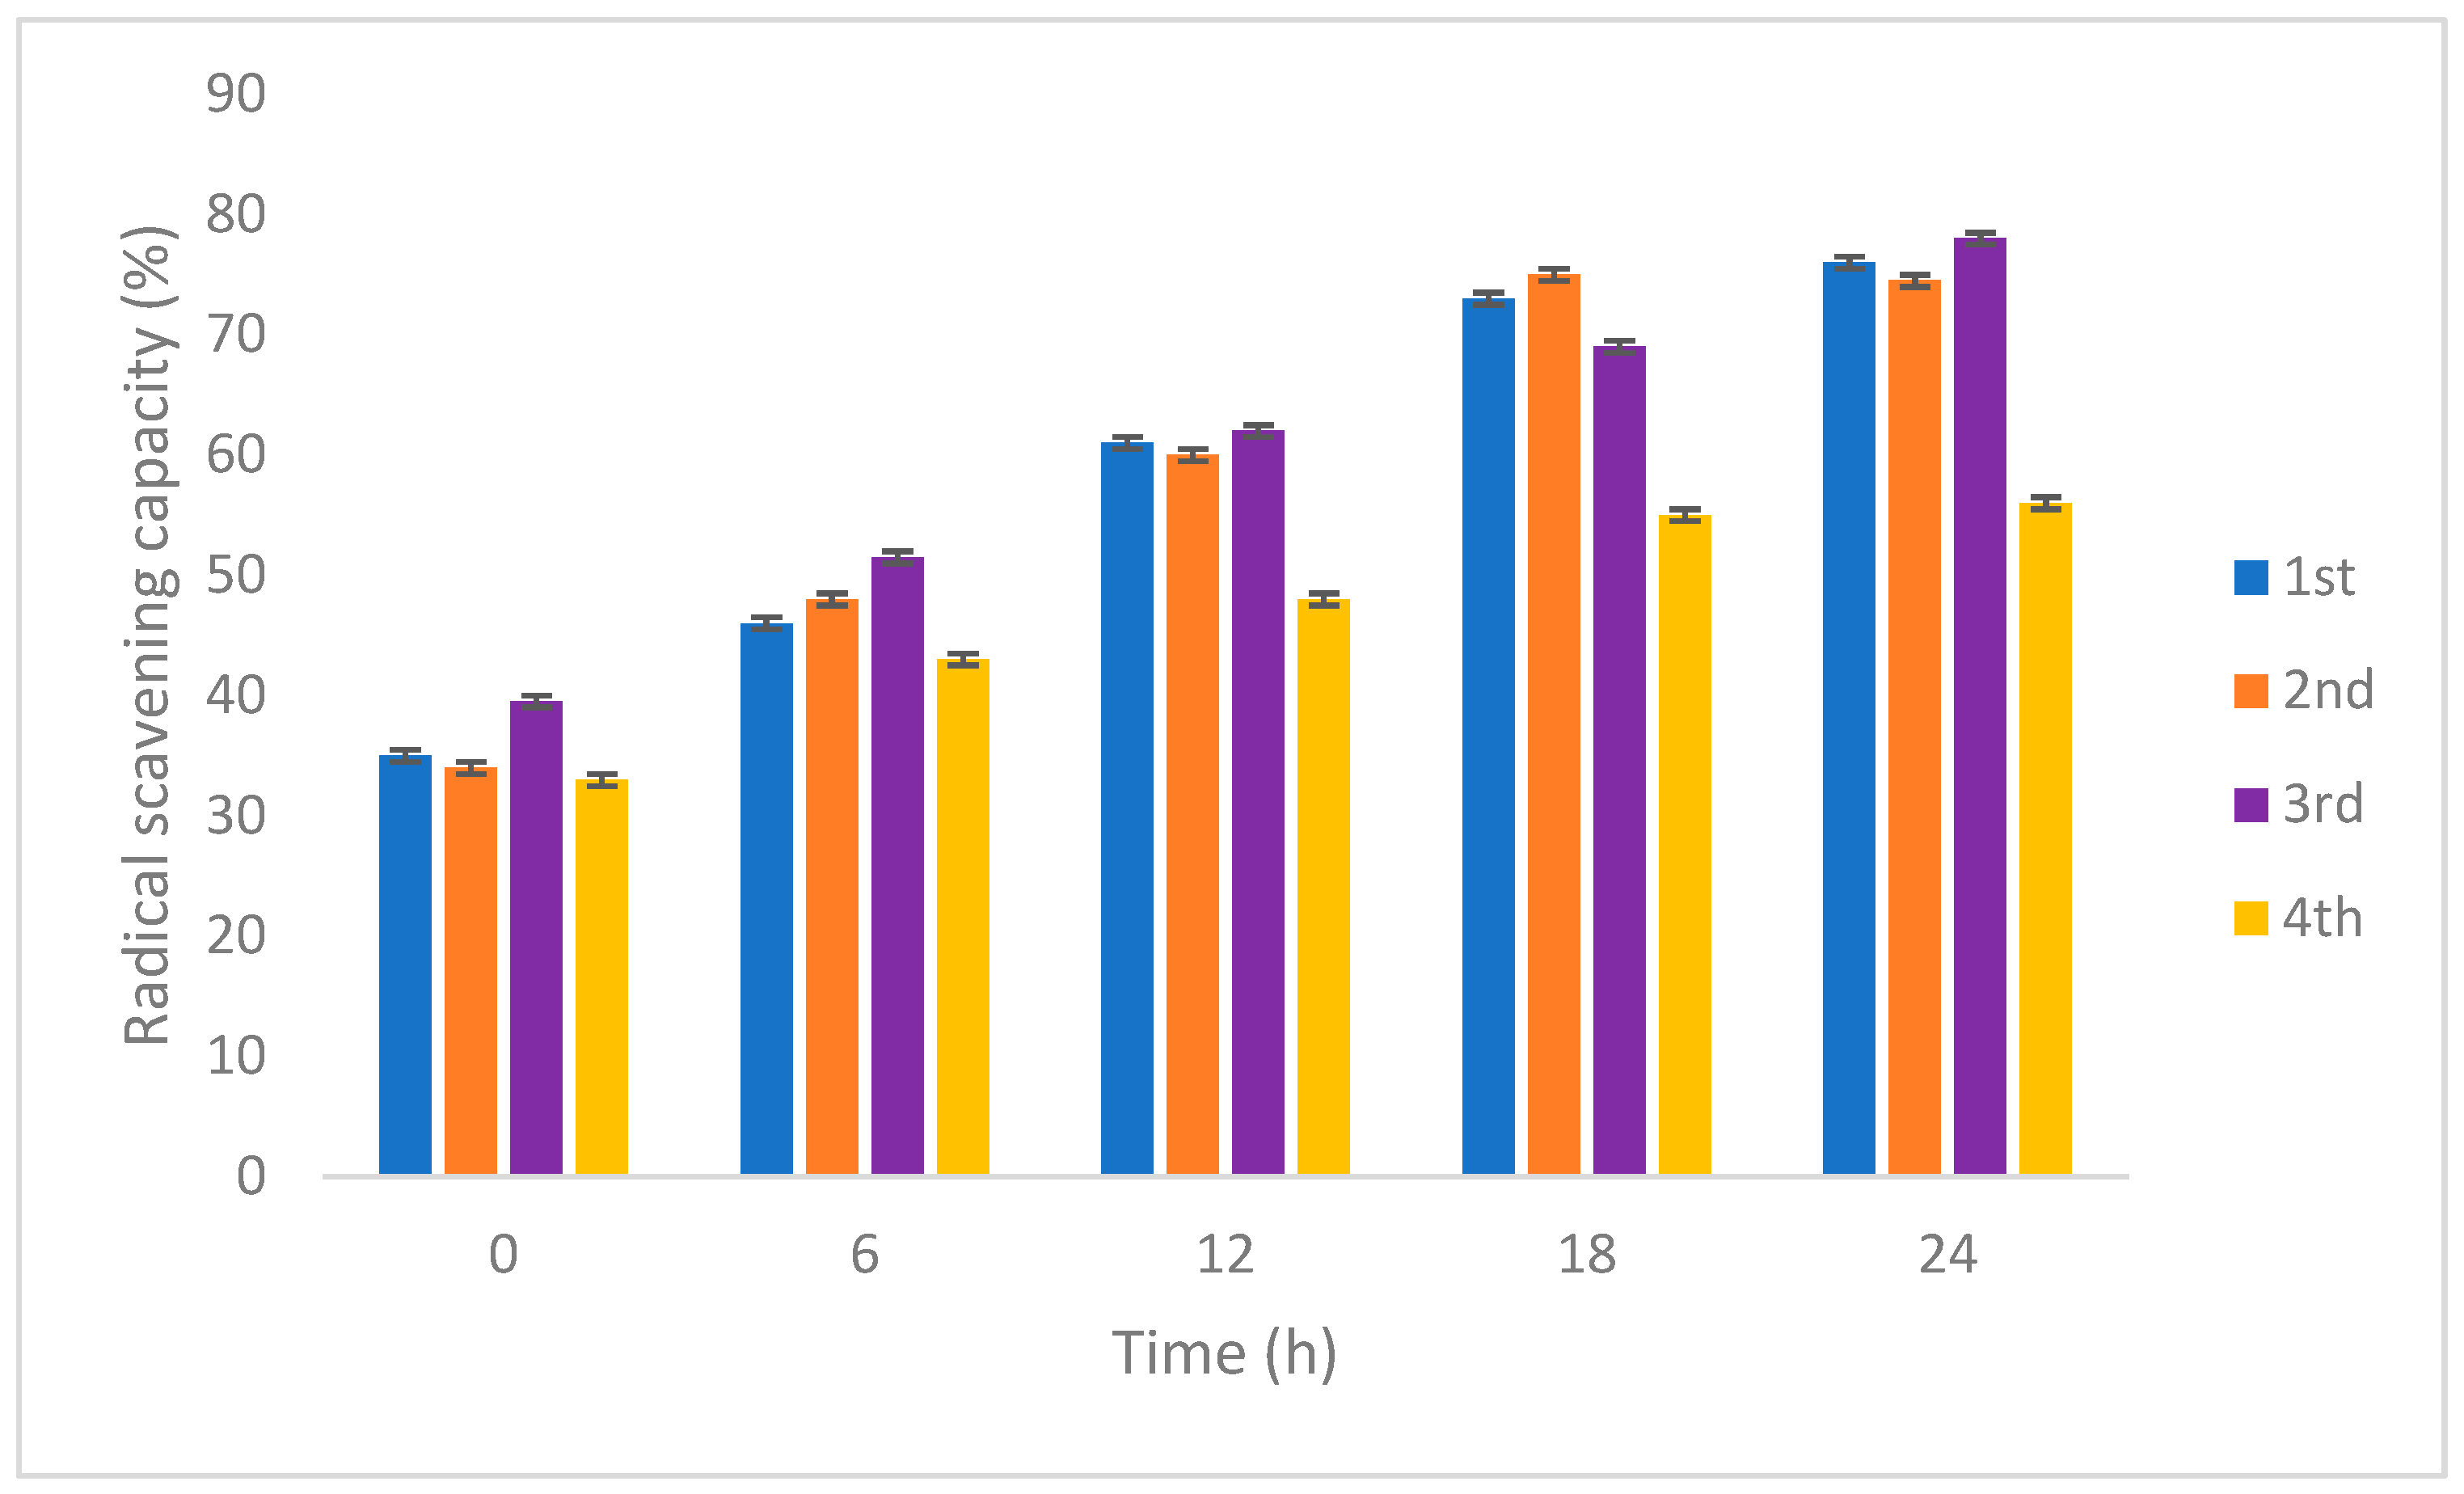
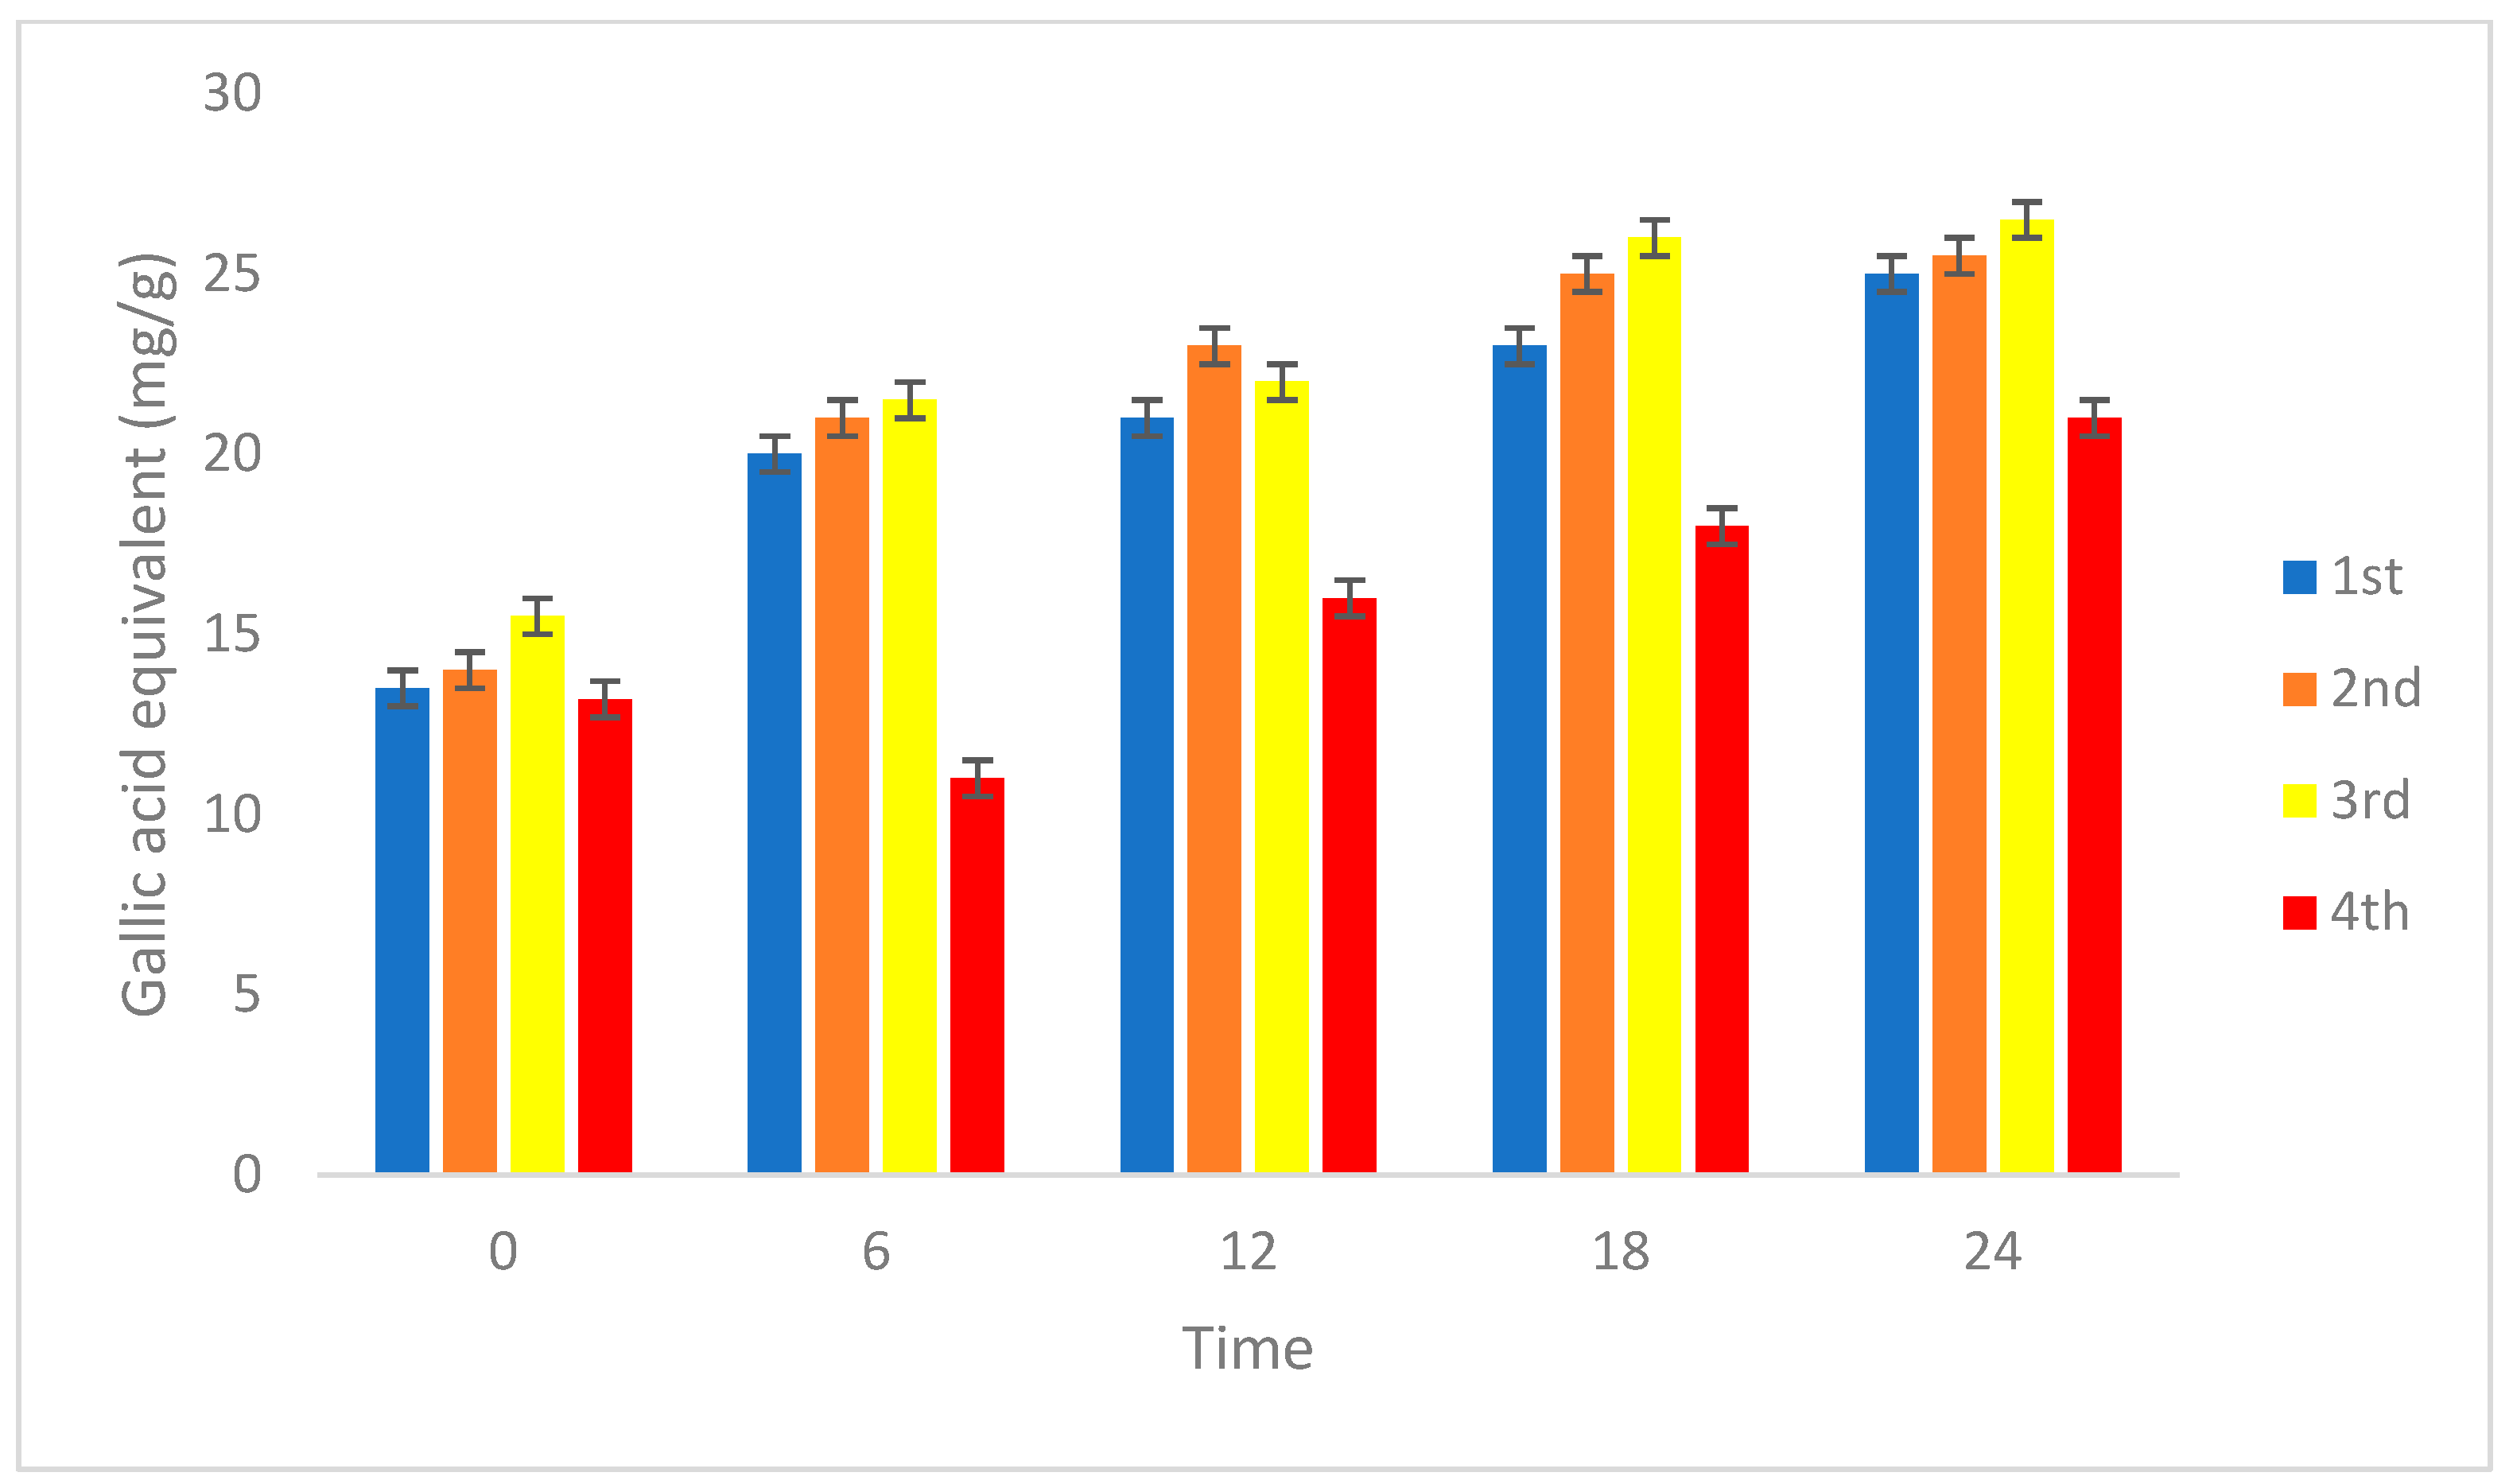
3.2.3. Antioxidant and Total Phenolic Content

Arthrospira platensis has attracted considerable attention due to its importance in terms of food and antioxidant properties. Fermentation may lead to spirulina products with better functional properties [58,59]. In the present study, the DPPH radical scavenging capacity of bioactive products at different fermentation times and different pilot production is shown in Figure 5. Radical scavenging capacity increased from the start (0 h) to 6 h of fermentation. From 12 h to 18 h, a general increase in radical scavenging capacity in three bioactive products was observed. It is worth pointing out that after 24 h of fermentation, three bioactive products still contain high DPPH radical scavenging capacity (>70%). When Figure 5 is examined, it was determined that fermented spirulina studies showed higher antioxidant scavenging activity compared to without spirulina (fourth). It is thought that the secondary metabolites contained in spirulina have a positive effect on antioxidant activity during the fermentation process. The findings also support the results in the literature. At the end of fermentation, the highest antioxidant capacity was obtained in the third study. Even though the specific antioxidant mechanism of LAB remains unclear, we have found that LAB can produce antioxidant metabolites and scavenge reactive oxygen species (ROS) enzymes. LAB strains upregulate the activity of host antioxidant enzymes, downregulate the activity of enzymes related to ROS production, and regulate the antioxidant signaling pathway in hosts and intestinal flora. Fermentation with selected strains of different LAB strains was attempted by Yay et al. [24], Jamnik et al. [23], de Marco Castro et al. [26], Niccolai et al. [25], and Liu et al. [27] to increase their antioxidant properties and determine positive results. Different studies show that the presence of spirulina in an LAB medium contributes positively to its bioactive properties. Furthermore, the functionality of protein hydrolyzates may be diverse between strains due to the presence of different proteolytic systems in different microorganisms [60,61,62]. The strong antioxidant effect of lactic acid bacteria was proven by DPPH analysis in the study of Das et al. [63].
In the present study, DPPH radical scavenging capacity and total phenolic content results were determined similarly in pilot productions. The total phenolic content results are given in Figure 6. The total amount of phenolic compounds in all samples was expressed as mg/L−1 of gallic acid equivalent. The highest total phenolic content of 26.5 mg GAE g−1 was obtained in the third pilot production at 24 h. They were found, 24.5 and 25 mg GAE g−1, first and second studies, respectively. In pilot validation studies, total phenolic content was found to be higher at 18 and 24 h. The total phenolic content without spirulina was found to be lower than that of fermented spirulina studies. Phenolic compounds are considered major contributors to antioxidant capacity [64]. The total phenolic content of spirulina varies from 5 to about 50 mg GAE g−1, depending on strain, culture, and fermentation conditions [22,65,66]. According to Filannino et al. [67], the strain-specific metabolism of phenolic acid derivatives by lactic acid bacteria is strongly dependent on the intrinsic factors of the substrate. Phenolic compounds are one of the main factors responsible for the biological activity, with phycocyanin released from A. platensis biomass and compounds with antioxidant potential. In addition, the total phenolic compound of spirulina may be affected by cultivation conditions such as pH, light, temperature, and the downstream process. Moreover, the fermentation process could have released polyphenols such as gallic acid, converted phycocyanins to phycocyanobilin, or produced other metabolites, enhancing the antioxidant, and this shows the positive effect of using spirulina in an LAB culture medium [68,69]. Spirulina activates cellular antioxidant enzymes, prevents lipid peroxidation and DNA damage, scavenges free radicals, and increases catalase activity. Thus, it contributes positively to antioxidant and total phenolic substance content [70].

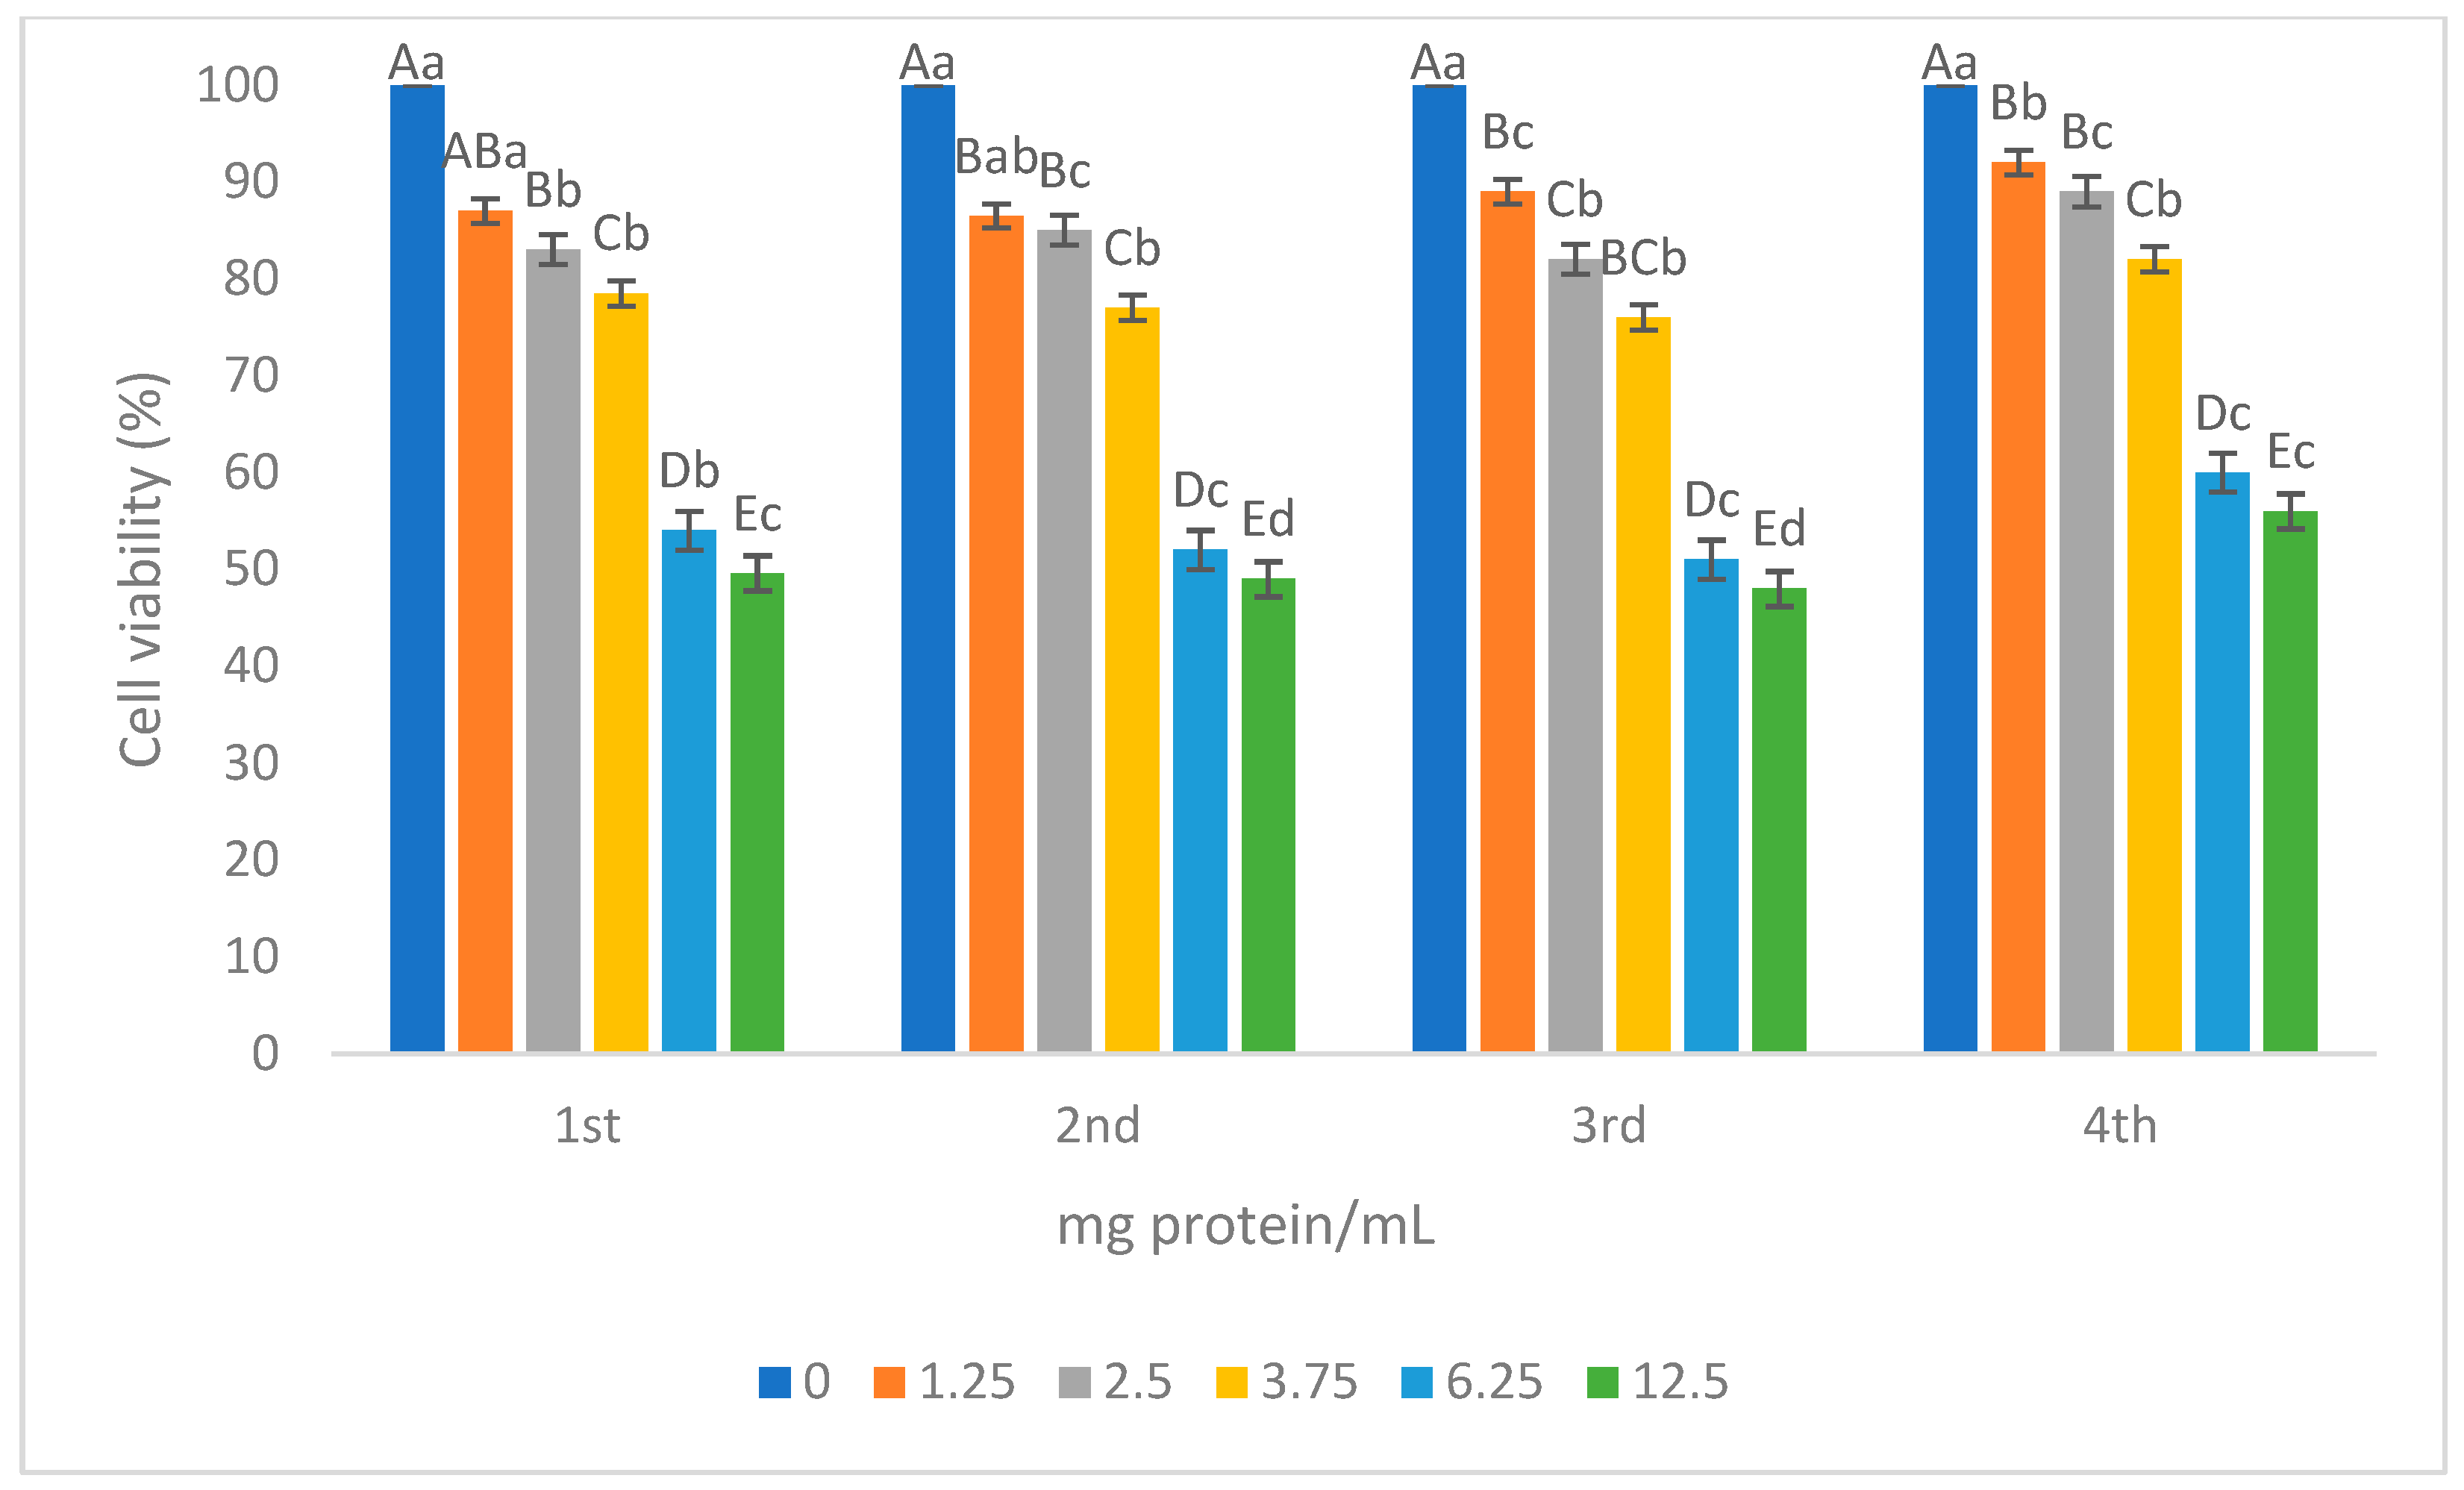
3.2.4. Cytotoxic Activity

Cytotoxic effects were detected in bioactive products for the analysis of bioactivity in pilot production. The results are given in Figure 7. No statistical difference was found between the concentration of the control sample and the lowest concentration of the first study (1.25 mg protein/mL) (p > 0.05). Cell viabilities ranged between 86.94 and 88.65%, 82.13 and 85.14%, and 76.11 and 78.46% for 1.25, 2.5, and 3.75 mg protein/mL, respectively. The highest inhibition was detected for all studies at the highest sample concentration (12.5 mg protein/mL). Cell viability was found to be 47.19%, 48.73%, and 49.16% at this concentration for the third, second, and first study, respectively. In the study without spirulina, the highest inhibition was detected at a concentration of 12.5 mg protein/mL. The cytotoxic effect without spirulina was found to be less than that of fermented spirulina. Ozturk et al. [71] showed that FS products of K. marxianus and L. helveticus and their unfermented spirulina counterparts did not reduce HUVEC and RAW264.7 cell viability below 60%, and the bioactive products could be considered biocompatible. Rosa et al. [72] determined that low concentrations of probiotic whey beverages had no effect on the PC-3 cell line, but had an antiproliferative effect at high concentrations. Yay et al. [24] reported that L.helveticus and K.marxianus spirulina fermentation resulted in a screening that revealed that “cascade” FS significantly decreased the viability of colon cancer cells (HT-29) in a dose-dependent manner, with up to a 72% reduction. Furthermore, doses ≤ 500 μg/mL−1 of “cascade” FS proved safe and effective in suppressing nitric oxide release without compromising cellular viability. Kayacan-Cakmakoglu et al. [73] studied the cytotoxic effects of bioactive peptides obtained by yogurt fermentation. They found that bioactive peptides had antiproliferative effects against Caco-2 cells. Grover et al. [74] reported that C-phycocyanin, a pigment obtained by the extraction of spirulina, had a strong immunomodulatory effect in a study conducted on an animal model and also did not have a cytotoxic effect. Current study findings emphasize the distinct and enhanced efficacy of pilot-scale production in exerting cytotoxic effects on cancer cells, context of colon cancer, presenting a potential avenue for further exploration of this fermented product in terms of its bioactive compounds. It is thought that phytopigments (carotenoids, chlorophyll, phycocyanin) and polysaccharides contained in spirulina contribute to the cytotoxic effect.

4. Conclusions

This study highlighted the importance of bioactive compound production by the addition of spirulina to the fermentation medium of L. rhamnosus, one of the LAB species, and the particular findings of the pilot-scale bioreactor study. Tests performed after pilot-scale production showed strong antioxidant and total phenolic content. Inhibition against pathogenic bacteria evaluations are an important indicator for the use of bioactive products in industry. Furthermore, in cytotoxic activity studies, bioactive products were found to have antiproliferative effects against Caco-2 cells. Pilot studies of fermented spirulina have determined that it exhibits higher bioactive properties compared to without spirulina. A lot of studies have already shown that the lactic acid fermentation of A. platensis improves its functional value. Hence, the aim of our study was to produce fermented A. platensis biomass on a pilot scale by scaling up and to further evaluate the potential of this bioactive product to be introduced to the commercial market. Considering the commercial importance of current LAB and microalgae products, there is a greater need to optimize microbial fermentation processes and pilot-scale production studies. To our knowledge, between LAB and spirulina, pilot-scale co-cultivation studies have never been conducted so far. In this respect, our study is original and provides significant gains to the literature.

Supplementary Materials

The following supporting information can be downloaded at: https://www.mdpi.com/article/10.3390/fermentation11050248/s1, Table S1: Identified LAB strains

Author Contributions

Study conception and design: A.E.K. and D.B.; data collection and performance of the experiments: A.E.K., A.Ö. and E.D.; analysis and interpretation of results: D.B. and O.S.; draft manuscript preparation: A.E.K., E.D., A.Ö., D.B. and O.S. All authors have read and agreed to the published version of the manuscript.

Funding

This research received no external funding.

Institutional Review Board Statement

Not applicable.

Informed Consent Statement

Not applicable.

Data Availability Statement

The original contributions presented in the study are included in the article; further inquiries can be directed to the corresponding author.

Conflicts of Interest

The authors declare no conflicts of interest.

References

  1. Chai, K.F.; Voo, A.Y.H.; Chen, W.N. Bioactive peptides from food fermentation: A comprehensive review of their sources, bioactivities, applications, and future development. Compr. Rev. Food Sci. Food Saf. 2020, 19, 3825–3885. [Google Scholar] [CrossRef] [PubMed]
  2. Sarker, A.; Ahmmed, R.; Ahsan, S.M.; Rana, J.; Ghosh, M.K.; Nandi, R. A comprehensive review of food waste valorization for the sustainable management of global food waste. Sustain. Food Technol. 2024, 2, 48–69. [Google Scholar] [CrossRef]
  3. Liu, F.; Li, M.; Wang, Q.; Yan, J.; Han, S.; Ma, C.; Ma, P.; Liu, X.; McClements, D.J. Future foods: Alternative proteins, food architecture, sustainable packaging, and precision nutrition. Crit. Rev. Food Sci. Nutr. 2022, 63, 6423–6444. [Google Scholar] [CrossRef] [PubMed]
  4. Niccolai, A.; Bazec, K.; Rodolfi, L.; Biondi, N.; Zlatic, E.; Jamnik, P.; Tredici, M.R. Lactic Acid Fermentation of Arthrospira platensis (Spirulina) in a Vegetal Soybean Drink for Developing New Functional Lactose-Free Beverages. Front. Microbiol. 2020, 11, 560–684. [Google Scholar] [CrossRef]
  5. Wu, C.; Huang, J.; Zhou, R. Genomics of lactic acid bacteria: Current status and potential applications. Crit. Rev. Microbiol. 2017, 43, 393–404. [Google Scholar] [CrossRef]
  6. Pfeiler, E.A.; Klaenhammer, T.R. The genomics of lacticacid bacteria. Trends Microbiol. 2007, 15, 546–553. [Google Scholar] [CrossRef]
  7. Felis, G.E.; Dellaglio, F. Taxonomy of Lactobacilli and Bifidobacteria. Curr. Issues Intest. Microbiol. 2007, 8, 44–61. [Google Scholar] [PubMed]
  8. Srinivash, M.; Krishnamoorthi, R.; Mahalingam, P.U.; Malaikozhundan, B.; Keerthivasan, M. Probiotic potential of exopolysaccharide producing lactic acid bacteria isolated from homemade fermented food products. J. Agric. Food Res. 2023, 11, 11100517. [Google Scholar] [CrossRef]
  9. Burgain, J.; Scher, J.; Francius, G.; Borges, F.; Corgneau, M.; Revol-Junelles, A.M.; Cailliez-Grimal, C.; Gaiani, C. Lactic acid bacteria in dairy food: Surface characterization and interactions with food matrix components. Adv. Colloid. Interf. Sci. 2014, 213, 21–35. [Google Scholar] [CrossRef]
  10. Perez, R.H.; Zendo, T.; Sonomoto, K. Novel bacteriocins from lactic acid bacteria (LAB): Various structures and applications. Microb. Cell Factor. 2014, 13, S3. [Google Scholar] [CrossRef]
  11. Lafarga, T. Cultured microalgae and compounds derived thereof for food applications: Strain selection and cultivation, drying, and processing strategies. Food Rev. Int. 2020, 36, 559–583. [Google Scholar] [CrossRef]
  12. Gershwin, M.E.; Belay, A. (Eds.) Spirulina in Human Nutrition and Health; CRC Press: Boca Raton, FL, USA, 2007. [Google Scholar] [CrossRef]
  13. Garrido-Cardenas, J.A.; Manzano-Agugliaro, F.; Acien-Fernandez, F.G.; Molina-Grima, E. Microalgae research worldwide. Algal Res. 2018, 35, 50–60. [Google Scholar] [CrossRef]
  14. Garofalo, C.; Norici, A.; Mollo, L.; Osimani, A.; Aquilanti, L. Fermentation of Microalgal Biomass for Innovative Food Production. Microorganisms 2022, 10, 2069. [Google Scholar] [CrossRef] [PubMed]
  15. Barberis, S.E.; Origone, A.L.; Adaro, M.O.; Bersi, G. Bioactive Peptides as Functional Food Ingredients. In Microbial Biotechnology: Principles and Applications, 3rd ed.; Elsevier Inc.: Amsterdam, The Netherlands, 2018. [Google Scholar] [CrossRef]
  16. Sahin, B.; Hosoglu, M.I.; Guneser, O.; Karagul-Yuceer, Y. Fermented Spirulina products with Saccharomyces and non-Saccharomyces yeasts: Special reference to their microbial, physico-chemical and sensory characterizations. Food Biosci. 2022, 47, 101691. [Google Scholar] [CrossRef]
  17. Hafeez, Z.; Cakir-Kiefer, C.; Roux, E.; Perrin, C.; Miclo, L.; Dary-Mourot, A. Strategies of producing bioactive peptides from milk proteins to functionalize fermented milk products. Food Res. Int. 2014, 63, 71–80. [Google Scholar] [CrossRef]
  18. Elam, E.; Feng, J.; Lv, Y.-M.; Ni, Z.-J.; Sun, P.; Thakur, K.; Zhang, J.G.; Ma, Y.-L.; Wei, Z.J. Recent advances on bioactive food derived anti-diabetic hydrolysates and peptides from natural resources. J. Funct. Foods. 2021, 86, 104674. [Google Scholar] [CrossRef]
  19. Martelli, F.; Cirlini, M.; Lazzi, C.; Neviani, E.; Bernini, V. Solid-state fermentation of Arthrospira platensis to implement new food products: Evaluation of stabilization treatments and bacterial growth on the volatile fraction. Foods 2021, 10, 67. [Google Scholar] [CrossRef]
  20. Moayedi, A.; Mora, L.; Aristoy, M.-C.; Hashemi, M.; Safari, M.; Toldrá, F. ACE- Inhibitory and Antioxidant Activities of Peptide Fragments Obtained from Tomato Processing By-Products Fermented Using Bacillus subtilis: Effect of Amino Acid Composition and Peptides Molecular Mass Distribution. Appl. Biochem. Biotechnol. 2016, 181, 48–64. [Google Scholar] [CrossRef]
  21. Bao, J.; Zhang, X.; Zheng, J.; Ren, D.; Lu, J. Mixed fermentation of Spirulina platensis with Lactobacillus plantarum and Bacillus subtilis by random-centroid optimization. Food Chem. 2018, 264, 64–72. [Google Scholar] [CrossRef]
  22. Verni, M.; Dingeo, C.; Rizzello, C.G.; Pontonio, E. Lactic acid bacteria fermentation and endopeptidase treatment improve the functional and nutritional features of Arthrospira platensis. Front. Microbiol. 2021, 12, 744437. [Google Scholar] [CrossRef]
  23. Jamnik, P.; Mahnič, N.; Mrak, A.; Pogačnik, L.; Jeršek, B.; Niccolai, A.; Rutar, J.M.; Ogrinc, N.; Dušak, L.; Ferjančič, B.; et al. Fermented Biomass of Arthrospira platensis as a Potential Food Ingredient. Antioxidants 2022, 11, 216. [Google Scholar] [CrossRef] [PubMed]
  24. Yay, C.; Cinar, Z.O.; Donmez, S.; Tumer, T.B.; Guneser, O.; Hosoglu, M.I. Optimizing bioreactor conditions for Spirulina fermentation by Lactobacillus helveticus and Kluyveromyces marxianus: Impact on chemical & bioactive properties. Bioresour. Technol. 2024, 403, 130832. [Google Scholar] [CrossRef]
  25. Niccolai, A.; Shannon, E.; Abu-ghannam, N.; Biondi, N.; Rodolfi, L. Lactic acid fermentation of Arthrospira platensis (Spirulina) biomass for probiotic-based products. J. Appl. Phycol. 2019, 31, 1077–1083. [Google Scholar] [CrossRef]
  26. de Marco Castro, E.; Shannon, E.; Abu-Ghannam, N. Effect of fermentation on enhancing the nutraceutical properties of Arthrospira platensis (Spirulina). Fermentation 2019, 5, 28. [Google Scholar] [CrossRef]
  27. Liu, J.G.; Hou, C.W.; Lee, S.Y.; Chuang, Y.; Lin, C.C. Antioxidant effects and UVB protective activity of Spirulina (Arthrospira platensis) products fermented with lactic acid bacteria. Process Biochem. 2011, 46, 1405–1410. [Google Scholar] [CrossRef]
  28. De Man, J.C.; Rogosam, M.; Sharpe, M.E. A Medium for the Cultivation of Lactobacilli. J. Appl. Bacteriol. 1960, 23, 130–135. [Google Scholar] [CrossRef]
  29. Richmond, A. Handbook of Microalgal Culture: Biotechnology and Applied Phycology; Blackwell Science: Oxford, UK; Ames, IA, USA, 2004. [Google Scholar]
  30. Acien, F.G.; Fernandez, J.M.; Magan, J.J.; Molina, E. Production cost of a real microalgae production plant and strategies to reduce it. Biotechnol. Adv. 2012, 30, 1344–1353. [Google Scholar] [CrossRef]
  31. Niangoran, N.G.U.F.; Buso, D.; Zissis, G.; Prudhomme, T. Influence of light intensity and photoperiod on energy efficiency of biomass and pigment production of Spirulina (Arthrospira platensis). OCL 2021, 28, 37. [Google Scholar] [CrossRef]
  32. Lowry, O.H.; Rosebrough, N.J.; Farr, A.L.; Randall, R.J. Protein measurement with the Folin phenol reagent. J. Biol. Chem. 1951, 193, 265–275. [Google Scholar] [CrossRef]
  33. Dubois, M.; Gilles, K.A.; Hamilton, J.K.; Rebers, P.T.; Smith, F. Colorimetric method for determination of sugars and related substances. Anal. Chem. 1956, 28, 350–356. [Google Scholar] [CrossRef]
  34. Marsh, J.B.; Weinstein, D.B. Simple charring method for determination of lipids. J. Lipid Res. 1966, 7, 574–576. [Google Scholar] [CrossRef] [PubMed]
  35. Inegbedion, F. Estimation of the moisture content, volatile matter, ash content, fixed carbon and calorific values of saw dust briquettes. MANAS J. Eng. 2022, 10, 17–20. [Google Scholar] [CrossRef]
  36. Gökmen, G.G.; Sariyildiz, S.; Cholakov, R.; Nalbantsoy, A.; Baler, B.; Aslan, E.; Düzel, A.; Sargin, S.; Göksungur, Y.; Kişla, D. A novel Lactiplantibacillus plantarum strain: Probiotic properties and optimization of the growth conditions by response surface methodology. World J. Microbiol. Biotechnol. 2024, 40, 66. [Google Scholar] [CrossRef] [PubMed]
  37. Deniz, I.; Demir, T.; Oncel, S.S.; Hames, E.E.; Vardar-Sukan, F. Effect of Agitation and Aeration on Keratinase Production in Bioreactors Using Bioprocess Engineering Aspects. Protein J. 2021, 40, 388–395. [Google Scholar] [CrossRef] [PubMed]
  38. Ozdemir, A. D-optimal experimental design for production models in nonstandard experiments. Qual. Reliab. Eng. Int. 2020, 36, 1537–1552. [Google Scholar] [CrossRef]
  39. Kavak, A.E.; Zent, İ.; Sağir, E.M.; Oncü, G.; Simsek, F.İ. Characterization of nuvita biosearch center (NBC) isolated lactic acid bacteria strains from human origin and determination of growth kinetic profiles of selected cultures under bioreactor. Ann. Microbiol. 2024, 74, 26. [Google Scholar] [CrossRef]
  40. Rizzello, C.G.; Lorusso, A.; Russo, V.; Pinto, D.; Marzani, B.; Gobbetti, M. Improving the antioxidant properties of quinoa flour through fermentation with selected autochthonous lactic acid bacteria. Int. J. Food Microbiol. 2017, 241, 252–261. [Google Scholar] [CrossRef]
  41. Sanders, E.R. Aseptic laboratory techniques: Plating methods. J. Vis. Exp. 2012, e3064. [Google Scholar] [CrossRef]
  42. Tsega, K.T.; Maina, K.J.; Tesema, N.B. Characterization of potential probiotics Lac tobacillus species isolated from the gastrointestinal tract of Rhode Island Red (RIR) chicken in Ethiopia. Heliyon 2023, 9, e17453. [Google Scholar] [CrossRef]
  43. Efsa Panel On Additives And Products Or Substances Used In Animal Feed (Feedap); Rychen, G.; Aquilina, G.; Azimonti, G.; Bampidis, V.; Bastos, M.d.L.; Bories, G.; Chesson, A.; Cocconcelli, P.S.; Flachowsky, G.; et al. Guidance on the characterisation of microorganisms used as feed additives or as production organisms. EFSA J. 2018, 16, 5206. [Google Scholar] [CrossRef]
  44. Singleton, V.L.; Orthofer, R.; Lamuela-Raventos, R.M. Analysis of total phenols and other oxidation substrates and antioxidants by means of Folin-Ciocalteu reagent. Acad. Press. 1999, 299, 152–178. [Google Scholar] [CrossRef]
  45. Cakir-Koc, R.; Budama-Kilinc, Y.; Kaya, Z.; Berber Orcen, B.; Ucarkus, E. Coconut oil-loaded chitosan nanoparticles for the treatment of acne vulgaris: Cytotoxicity, antibacterial activity, and antibiofilm properties. Fresenius Environ. Bull. 2018, 27, 2642–2648. [Google Scholar]
  46. Wu, W.J.; Ahn, B.Y. Statistical Optimization of Medium Components by Response Surface Methodology to Enhance Menaquinone-7 (Vitamin K-2) Production by Bacillus subtilis. J. Microbiol. Biotechn. 2018, 28, 902–908. [Google Scholar] [CrossRef] [PubMed]
  47. Wang, X.; Li, W.; Mahsa, G.C.; Zhang, C.; Ma, K.; Rui, X.; Li, W. Co-cultivation effects of Lactobacillus helveticus SNA12 and Kluveromyces marxiensis GY1 on the probiotic properties, flavor, and digestion in fermented milk. Food Res. Int. 2023, 169, 112843. [Google Scholar] [CrossRef] [PubMed]
  48. Hamme, V.; Sannier, F.; Piot, J.M.; Didelot, S.; Bordenave-Juchereau, S. Crude goat whey fermentation by Kluyveromyces marxianus and Lactobacillus rhamnosus: Contribution to proteolysis and ACE inhibitory activity. J. Dairy Res. 2009, 76, 152–157. [Google Scholar] [CrossRef]
  49. Jain, S.; Anal, A.K. Production and characterization of functional properties of protein hydrolysates from egg shell membranes by lactic acid bacteria fermentation. J. Food Sci. Technol. 2017, 54, 1062–1072. [Google Scholar] [CrossRef]
  50. Ovando, C.A.; de Carvalho, J.C.; Vinícius de Melo Pereira, G.; Jacques, P.; Soccol, V.T.; Soccol, C.R. Functional Properties and Health Benefits of Bioactive Peptides Derived from Spirulina: A Review. Food Rev. Int. 2018, 34, 34–51. [Google Scholar] [CrossRef]
  51. Lafarga, T.; Sánchez-Zurano, A.; Villaró, S.; Morillas-España, A.; Acién, G. Industrial production of spirulina as a protein source for bioactive peptide generation. Trends Food Sci. Technol. 2021, 116, 176–185. [Google Scholar] [CrossRef]
  52. Sun, Y.; Chang, R.; Li, Q. Isolation and characterization of an antibacterial peptide from protein hydrolysates of Spirulina platensis. Eur. Food Res. Technol. 2015, 242, 685–692. [Google Scholar] [CrossRef]
  53. Hwanhlem, N.; Watthanasakphuban, N.; Riebroy, S.; Benjakul, S.; H-Kittikun, A.; Maneerat, S. Probiotic lactic acid bacteria from Kung-Som: Isolation, screening, inhibition of pathogenic bacteria. Int. J. Food Sci. Technol. 2010, 45, 594–601. [Google Scholar] [CrossRef]
  54. Georgieva, R.; Yocheva, L.; Tserovska, L.; Zhelezova, G.; Stefanova, N.; Atanasova, A.; Danguleva, A.; Ivanova, G.; Karapetkov, N.; Rumyan, N.; et al. Antimicrobial activity and antibiotic susceptibility of Lactobacillus and Bifidobacterium spp. intended for use as starter and probiotic cultures. Biotechnol. Biotechnol. Equip. 2015, 29, 84–91. [Google Scholar] [CrossRef] [PubMed]
  55. Poimenidou, S.V.; Skarveli, A.; Saxami, G.; Mitsou, E.K.; Kotsou, M.; Kyriacou, A. Inhibition of Listeria monocytogenes Growth, Adherence and Invasion in Caco-2 Cells by Potential Probiotic Lactic Acid Bacteria Isolated from Fecal Samples of Healthy Neonates. Microorganisms 2023, 11, 363. [Google Scholar] [CrossRef]
  56. Yang, X.; Peng, Z.; He, M.; Li, Z.; Fu, G.; Li, S.; Zhang, J. Screening, probiotic properties, and inhibition mechanism of a Lactobacillus antagonistic to Listeria monocytogenes. Sci. Total Environ. 2024, 906, 167587. [Google Scholar] [CrossRef] [PubMed]
  57. Tolpeznikaite, E.; Bartkevics, V.; Skrastina, A.; Pavlenko, R.; Ruzauskas, M.; Starkute, V.; Zokaityte, E.; Klupsaite, D.; Ruibys, R.; Rocha, J.M.; et al. Submerged and Solid-State Fermentation of Spirulina with Lactic Acid Bacteria Strains: Antimicrobial Properties and the Formation of Bioactive Compounds of Protein Origin. Biology 2023, 12, 248. [Google Scholar] [CrossRef]
  58. Chaiklahan, R.; Chirasuwan, N.; Triratana, P.; Loha, V.; Tia, S.; Bunnag, B. Polysaccharide Extraction from Spirulina sp. and Its Antioxidant Capacity. Int. J. Biol. Macromol. 2013, 58, 73–78. [Google Scholar] [CrossRef]
  59. Perez-Alva, A.; MacIntosh, A.J.; Baigts-Allende, D.K.; García-Torres, R.; Ramírez-Rodrigues, M.M. Fermentation of algae to enhance their bioactive activity: A review. Algal Res. 2022, 64, 102684. [Google Scholar] [CrossRef]
  60. Li, S.; Zhao, Y.; Zhang, L.; Zhang, X.; Huang, L.; Li, D.; Niu, C.; Yang, Z.; Wang, Q. Antioxidant activity of Lactobacillus plantarum strains iso lated from traditional Chinese fermented foods. Food Chem. 2012, 135, 1914–1919. [Google Scholar] [CrossRef] [PubMed]
  61. Patil, S.M.; Sujay, S.; Tejaswini, M.; Sushma, P.P.; Prithvi, S.; Ramu, R. Bioactive peptides: Its production and potential role on health. Innov. Food Sci. Emerg. Technol. 2020, 7, 167–182. [Google Scholar]
  62. Hayes, M.; García-Vaquero, M. Bioactive compounds from fermented food products. In Novel Food Fermentation Technologies, 1st ed.; Shikha Ojha, K., Tiwari, B.K., Eds.; Springer: Cham, Switzerland, 2016; pp. 293–310. [Google Scholar] [CrossRef]
  63. Das, D.; Goyal, A. Antioxidant activity and γ-aminobutyric acid (GABA) producing ability of probiotic Lactobacillus plantarum DM5 isolated from Marcha of Sikkim. LWT-Food Sci. Technol. 2015, 61, 263–268. [Google Scholar] [CrossRef]
  64. Ayyash, M.; Al-Nuaimi, A.K.; Al-Mahadin, S.; Liu, S.Q. In vitro investigation of anticancer and ACE-inhibiting activity, α-amylase and α-glucosidase inhibition, and antioxidant activity of camel milk fermented with camel milk probiotic: A comparative study with fermented bovine milk. Food Chem. 2018, 239, 588–597. [Google Scholar] [CrossRef]
  65. AbdEl-Baki, H.H.; El Baz, F.K.; El-Baroty, G.S. Production of phenolic compounds from Spirulina maxima microalgae and its protective effects. Afr. J. Biotechnol. 2009, 8, 7059–7067. [Google Scholar]
  66. Hartmann, R.; Meisel, H. Food-derived peptides with biological activity: From research to food applications. Curr. Opin. Biotechnol. 2007, 18, 163–169. [Google Scholar] [CrossRef]
  67. Filannino, P.; Bai, Y.; Di Cagno, R.; Gobbetti, M.; Ganzle, M.G. Metabolism of phenolic compounds by Lactobacillus spp. during fermentation of cherry juice and broccoli puree. Food Microbiol. 2015, 46, 272–279. [Google Scholar] [CrossRef] [PubMed]
  68. Lahrichi, S.L.; Affolter, M.; Zolezzi, I.S.; Panchaud, A. Food peptidomics: Large scale analysis of small bioactive peptides—A pilot study. J. Proteom. 2013, 88, 83–91. [Google Scholar] [CrossRef] [PubMed]
  69. Lamuela-Raventós, R.M. Folin–Ciocalteu method for the measurement of total phenolic content and antioxidant capacity. In Measurement of Antioxidant Activity & Capacity; John Wiley & Sons: Hoboken, NJ, USA, 2018; pp. 107–115. [Google Scholar] [CrossRef]
  70. Wu, Q.; Liu, L.; Miron, A.; Klímová, B.; Wan, D.; Kuča, K. The antioxidant, immunomodulatory, and anti-inflammatory activities of Spirulina: An overview. Arch. Toxicol. 2016, 90, 1817–1840. [Google Scholar] [CrossRef]
  71. Ozturk, N.; Yay, C.; Cinar, Z.O.; Atalay, H.N.; Guneser, O.; Hosoglu, M.I.; Tumer, T.B. Optimizations related to the use of Lactobacillus helveticus, Kluyveromyces marxianus in monoculture, and co-culture for production of Spirulina-based fermented products. Algal Res. 2025, 86, 103948. [Google Scholar] [CrossRef]
  72. Rosa, L.S.; Santos, M.L.; Abreu, J.P.; Balthazar, C.F.; Rocha, R.S.; Silva, H.L.; Esmerino, E.A.; Duarte, M.C.K.H.; Pimentel, T.C.; Freitas, M.Q.; et al. Antiproliferative and apoptotic effects of probiotic whey dairy beverages in human prostate cell lines. Food Res. Int. 2020, 137, 109450. [Google Scholar] [CrossRef]
  73. Kayacan Çakmakoğlu, S.; Dere, S.; Bekiroğlu, H.; Bozkurt, F.; Karasu, S.; Dertli, E.; Türker, M. Production of bioactive peptides during yogurt fermentation, their extraction and functional characterization. Food Biosci. 2024, 61, 104805. [Google Scholar] [CrossRef]
  74. Grover, P.; Bhatnagar, A.; Kumari, N.; Narayan, B.A.; Kumar, N.D.; Purkayastha, J. C-Phycocyanin-a novel protein from Spirulina platensis-In vivo toxicity, antioxidant and immunomodulatory studies. Saudi J. Biol. Sci. 2021, 28, 1853–1859. [Google Scholar] [CrossRef]
Figure 1. Graphical plan of the study.
Fermentation 11 00248 g001
Figure 2. Residual plots for (a) the antioxidant response and (b) the antioxidant activity response.
Fermentation 11 00248 g002
Figure 3. Contour plots for (a) spirulina powder (g/L) and aeration (vvm) design factors, (b) spirulina powder (g/L) and agitation (rpm) design factors, and (c) aeration (vvm) and agitation (rpm) design factors.
Fermentation 11 00248 g003aFermentation 11 00248 g003b
Figure 4. Variation in viable cell count for L. rhamnosus in 24 h pilot-scale production. Bars indicate mean and standard deviation.
Fermentation 11 00248 g004
Figure 5. Antioxidant capacity expressed as mg of gallic acid equivalent (GAE) per g of bioactive products for three pilot productions. Bars indicate mean and standard deviation.
Fermentation 11 00248 g005
Figure 6. Total phenolic content expressed as mg of gallic acid equivalent (GAE) per g of bioactive products for three pilot productions. Bars indicate mean and standard deviation.
Fermentation 11 00248 g006
Figure 7. Cell viability (%) of Caco-2 cells treated with different concentrations of bioactive products. 0 represents the control cells, and other samples show the concentration of the bioactive product applied. A–E Different uppercase superscript letters in the same concentration indicate differences between samples. a–e Different lowercase superscript letters in the same sample indicate differences between samples. Bars indicate mean and standard deviation.
Fermentation 11 00248 g007
Table 1. SAG Medium Solution A and Solution B ingredients.
Solution A500 mLSolution B500 mL
NaHCO313.61 gNaNO32.50 g
Na2CO34.03 gK2SO4 1.00 g
K2HPO40.50 gNaCl1.00 g
MgSO4·7H2O0.20 g
CaCl2·2H2O0.04 g
P-IV Metal Solution6 mL
Chu Micronutrient Solution1 mL
Table 2. P-IV Metal Solution Component.
ComponentAmount
Na2EDTA0.75 g
Na2MoO4·2H2O4 mg
CoCl2·6H2O2 mg
MnCl2·4H2O41 mg
ZnCl25 mg
FeCl3·6H2O97 mg
Table 3. Chu Micronutrient Solution.
ComponentAmount
Na2EDTA50 mg
CoCl2·6H2O20 mg
MnCl2·4H2O12.6 mg
ZnSO4·7H2O44 mg
H3BO3618 mg
Na2MoO4·2H2O12.6 mg
CuSO4·5H2O19.6 mg
Table 6. Summaries of fits and ANOVA results of biomass (y1) and antioxidant activity (y2) responses.
Summaries of Fitsy1/y2
R20.9255/0.9863
R a d j 2 0.8428/0.9629
R p r e 2 0.6781/0.7730
Adequate precision11.3290/22.9862
ANOVA results biomass (y1) and antioxidant activity (y2) responses
Source (y1/y2)SoS (y1/y2)DoF (y1/y2)MS (y1/y2)F-values (y1/y2)p-values (y1/y2)Comment (y1/y2)
Model134.24/16.7210/1213.42/1.3911.19/42.050.0006/<0.0001S/S
A-/1.62-/1-/1.62-/48.82-/0.0002-/S
B12.15/-1/-12.15/-10.13/-0.0111/-S/-
C38.27/1.671/138.27/1.6731.89/50.240.0003/0.0002S/S
AB26.61/2.421/126.61/2.4222.17/73.070.0011/<0.0001S/S
AC18.42/3.051/118.42/3.0515.35/92.020.0035/<0.0001S/S
BC7.13/1.231/17.13/1.235.94/37.060.0375/0.0005S/S
A23.63/0.891/13.63/0.893.02/26.960.1160/0.0013NS/S
B2-/1.62-/1-/1.62-/48.89-/0.0002-/S
C2-/1.20-/1-/1.20-/36.33-/0.0005-/S
A2B13.69/4.251/113.69/4.2511.40/128.220.0082/<0.0001S/S
A2C31.55/2.631/131.55/2.6326.29/79.230.0006/<0.0001S/S
AB218.20/3.531/118.20/3.5315.16/106.440.0037/<0.0001S/S
AC228.71/3.131/128.71/3.1323.92/94.350.0009/<0.0001S/S
Residual10.80/0.239/71.20/0.03
Lack of Fit1.31/0.034/20.3283/0.020.1730/0.39520.9430/0.6929NS/NS
Pure Error9.49/0.205/51.90/0.04
Cor Total145.04/16.9619/19
Note: SoS = sum of squares, DoF = degrees of freedom, MS = mean squared, S = significant, NS = not significant.
Table 7. Results of optimization and validation run.
Solution fromA = Spirulina Powder
(g/L)
B = Aeration
(vvm)
C = Agitation
(rpm)
y1 = Biomass
(g/L)
y2 = Antioxidant Activity
(%)
The bi-objective optimization3.180.93119.973.7484.72
Validation run3.180.93119.974.2381.59
Table 8. Antibacterial effect of bioactive products in mm (1st, 2nd, 3rd, and 4th study).
Gram-NegativeGram-Positive
Study No.Escherichia
coli
Salmonella
enterica
Listeria
monocytogenes
Staphylococcus
aureus
1st7.34.515.45.4
2nd7.54.79.84.1
3rd10.45.216.17.6
4th6.24.48.05.5
Disclaimer/Publisher’s Note: The statements, opinions and data contained in all publications are solely those of the individual author(s) and contributor(s) and not of MDPI and/or the editor(s). MDPI and/or the editor(s) disclaim responsibility for any injury to people or property resulting from any ideas, methods, instructions or products referred to in the content.

