Article

Comparative Analysis of Physicochemical and Biological Activities of Meads from Five Mekong Region Honeys Pre- and Post-Fermentation

by
Sahutchai Inwongwan
1,2,3,
Thanaporn Kitcharoen
1,
Pitchayapak Wongsasuk
4,
William Le Masurier
4,
Chanon Saksunwiriya
1,2,
Phuwasit Takioawong
2,
Hataichanok Pandith
1,2,
Sitthisak Intarasit
1,2,
Nuttapol Noirungsee
1,2,3 and
Terd Disayathanoowat
1,2,3,*
1
Department of Biology, Faculty of Science, Chiang Mai University, Chiang Mai 50200, Thailand
2
Research Center of Deep Technology in Beekeeping and Bee Products for Sustainable Development Goals (SMART BEE SDGs), Chiang Mai University, Chiang Mai 50200, Thailand
3
Center of Excellence in Microbial Diversity and Sustainable Utilization, Faculty of Science, Chiang Mai University, Chiang Mai 50200, Thailand
4
Day Drinker Collective Company Limited, Chiang Dao, Chiang Mai 50170, Thailand
*
Author to whom correspondence should be addressed.
Fermentation 2025, 11(4), 190; https://doi.org/10.3390/fermentation11040190
Submission received: 5 March 2025 / Revised: 23 March 2025 / Accepted: 2 April 2025 / Published: 3 April 2025
(This article belongs to the Special Issue Safety and Quality in Fermented Beverages)

Abstract

This study examines the physicochemical and biological changes in meads produced from five honey types sourced from the Mekong region: Tree Marigold (Tithonia diversifolia, Myanmar), Coffee (Coffea canephora, Vietnam), Kapok (Ceiba pentandra, Cambodia), Rubber (Hevea brasiliensis, China), and Mixed Floral (Thailand). Honey musts were fermented with Saccharomyces cerevisiae at 25 °C for two weeks. After fermentation, meads exhibited lighter coloration, a stable pH (3.5–4.5), and varying bioactivities. All meads showed antimicrobial activity against Escherichia coli, while activity against Staphylococcus aureus and Klebsiella pneumoniae varied by honey source and depended on fermentation. Antioxidant activity ranged from 19.25 to 68.11% inhibition, and peaked in Tree Marigold honey after fermentation. Total phenolic and flavonoid contents fluctuated, with Mixed Floral mead showing the highest post-fermentation phenolic levels. The results of a sensory analysis ranked Tree Marigold mead the highest across taste, mouthfeel, aftertaste, and overall preference. These findings underscore the influence of honey origin and fermentation on the physicochemical, antimicrobial, and sensory properties of mead.

1. Introduction

Fermented beverages have played an important role in human culture for thousands of years, with mead being one of the earliest recorded examples. Mead, an alcoholic beverage produced by the fermentation of honey, has a long history in Europe, Asia, and Africa. Ancient civilizations such as the Greeks, the Vikings, and the Chinese dynasties consumed mead for both its nutritional and medicinal benefits [1]. Unlike beer and wine, which are made from grain and grapes, mead is characterized by its honey-based fermentation, resulting in different biochemical and sensory properties [2]. The recent resurgence of mead in global markets underscores its potential as an artisanal and functional alcoholic beverage. Southeast Asia (SEA), particularly the Mekong region, has a thriving honey industry that offers a promising opportunity for the development of region-specific mead products.
The honey market in SEA is expanding due to increasing consumer preference for natural and health-enhancing products. Honey possesses antimicrobial, antioxidant, and anti-inflammatory properties, making it a valuable ingredient in both the food and pharmaceutical industries. Mead, as a derivative of honey, retains many of these bioactive compounds and also exhibits superior antioxidant, anti-inflammatory, and anti-allergic properties as a result of the fermentation process [2,3]. The fermentation process alters the chemical composition of honey, enhancing the bioavailability of polyphenols and producing new bioactive metabolites that may contribute to human health [4,5]. Consequently, the production of mead not only adds economic value to honey but also aligns with the rising demand for functional alcoholic beverages. The honey produced in the Mekong region varies significantly in flavor, chemical composition, and bioactive content due to diverse floral sources and climatic conditions [6]. Understanding these variations is critical for optimizing mead production and ensuring high-quality products. Mead fermentation involves yeast-driven sugar conversion, which influences the final composition and sensory attributes of the beverage. Factors such as yeast selection, fermentation temperature, and aging conditions contribute to variations in alcohol content, acidity, residual sugar, and aroma profiles. In addition, post-fermentation treatments further refine the physicochemical characteristics of mead, enhancing its market appeal and stability.
The biochemical changes that occur during mead fermentation are comparable to those observed in wine production. Fermentation induces modifications in sugar metabolism, organic acid formation, and polyphenol transformation, which collectively impact the sensory properties and shelf life of the final product [7]. Understanding these biochemical pathways is essential for controlling fermentation conditions and ensuring product consistency [8]. This study aims to develop meads using honeys sourced from the five Mekong countries and to evaluate the physicochemical and biological activity changes that occur during fermentation. By investigating these aspects, this research seeks to contribute to the scientific understanding of mead production while promoting the economic potential of regional honey varieties in the development of high-value fermented products.

2. Materials and Methods

2.1. Materials

The materials used in this project, including honey, were obtained with the approval and consent of collaborators representing specific countries. The honey’s origin, including its specified source and primary floral composition, was documented and provided by the Research Center of Deep Technology in Beekeeping and Bee Products for Sustainable Development Goals (SMART BEE SDGs), Chiang Mai, Thailand. The mead samples were prepared using five different honey sources from the Mekong region: Tree Marigold (Tithonia diversifolia, Myanmar, M), Coffee (Coffea canephora, Vietnam, V), Kapok (Ceiba pentandra, Cambodia, K), Rubber (Hevea brasiliensis, China, C), and Mixed Floral (Thailand, T).

2.2. Chemicals

All chemicals used in this study were of analytical grade. The fermentation process utilized commercial brewing yeast Saccharomyces cerevisiae and ethanol (for controls). For physicochemical and bioactivity analyses, the following reagents were employed: acetonitrile and deionized water (HPLC-grade) for sugar analysis; 2,2-diphenyl-1-picrylhydrazyl (DPPH), methanol, gallic acid, Folin–Ciocalteu reagent (50%), sodium carbonate (5%), quercetin, aluminum chloride (10%), and potassium acetate (1M) were used for antioxidant, total phenolic content (TPC), and total flavonoid content (TFC) assays. Standard pH buffer solutions (pH 4, 7, and 10) were used for pH meter calibration. For antimicrobial testing, Mueller–Hinton Agar (MHA), phenol (5%), and gentamicin (0.1 mg/mL) were used as reference substances. Distilled water and ethanol (5% and 10%) were also used as solvents and negative controls.

2.3. Mead Fermentation

The fermentation process was conducted in a controlled environment of a professional licensed mead brewer, ensuring adherence to appropriate brewing standards. The honey musts were diluted to achieve a specific gravity of 1.1 (25 °Brix) and supplemented with commercial brewing yeast, Saccharomyces cerevisiae. Fermentation was carried out at room temperature (25 °C) in a dark environment for two weeks, allowing the alcohol content to reach approximately 9–10% ABV. Following fermentation, the meads were bottled and analyzed for physicochemical, antimicrobial, and sensory properties.

2.4. Color

The mead color measurement was conducted using the HI 96785 Honey Color Portable Photometer (Hanna Instruments, Woonsocket, RI, USA). The device was calibrated, and a sample-filled cuvette was inserted into the photometer. The measurement was performed in honey color mode, and the Pfund scale value was recorded. The process was repeated three times to ensure accuracy.

2.5. pH

The pH was measured following the Association of Official Analytical Chemists (AOAC, 2000)’s method. First, 4 g of the sample was accurately weighed and mixed with 30 mL of distilled water to create a homogenous solution. The pH meter was calibrated using standard pH buffer solutions of pH 4, 7, and 10 to ensure measurement accuracy. After calibration, the electrode of the pH meter was immersed into the prepared sample solution. The pH value was recorded once the reading stabilized. Between each measurement, the electrode was thoroughly rinsed with distilled water to prevent cross-contamination. The measurement process was repeated three times to enhance the reliability of the results [9].

2.6. Sugar Content Analysis

The sugar content in mead samples was quantified using high-performance liquid chromatography (HPLC) [10] with an Agilent 1260 DAD and refractive index (RI) detector (Agilent Technologies, Santa Clara, CA, USA). Separation was performed on an Asahipak NH2P-50 4EE column (Shodex, Resonac Corporation, Tokyo, Japan, 4.6 mm ID × 250 mm L), specifically designed for carbohydrate analysis. The system operated under isocratic elution conditions using a mobile phase of 75% acetonitrile in deionized water (25:75 v/v) at a flow rate of 1.0 mL/min and a maximum pressure of 150 bar. The column temperature was maintained at 30 °C, and a 10 µL sample volume was injected per analysis. The total run time for each sample was 120 min to ensure complete separation and accurate quantification of sugars. A standard calibration curve was established using six different sugar concentrations (1, 2, 4, 6, 8, and 10 mg/mL), each analyzed in triplicate.

2.7. Antimicrobial Activity

The antimicrobial activity of the mead samples was evaluated using the agar well diffusion method [11] against Escherichia coli DMST 703, Klebsiella pneumoniae DMST 8216, Staphylococcus aureus DMST 8013, and Micrococcus luteus DMST 15503. MHA was prepared, sterilized, and poured into Petri dishes. Bacterial strains were cultured in nutrient broth, adjusted to a 0.5 McFarland standard (~1.5 × 10⁸ CFU/mL), and uniformly spread onto MHA plates. Sterile wells (6–8 mm) were drilled into the agar, and test substances in suitable solvents were applied at predetermined concentrations. DI water, 5% ethanol, and 10% ethanol served as negative controls, while 5% phenol and gentamicin (0.1 mg/mL) were used as positive controls. Plates were incubated at 37 °C for 18–24 h, and inhibition zones were measured using a Vernier caliper.

2.8. Determination of Antioxidant Activity Using 2,2-Diphenyl-1-picrylhydrazyl Free Radical Scavenging Assay

To determine the antioxidant activity of mead, a DPPH radical scavenging assay was performed [12]. A 0.1 mM DPPH (Sigma-Aldrich, St. Louis, MO, USA) solution was freshly prepared in methanol and stored in the dark to prevent degradation. For the reaction, 200 µL of the mead sample was mixed with 100 µL of the DPPH solution. The mixture was then incubated in the dark at room temperature for 30 min. After incubation, the absorbance of the reaction mixture was measured at 517 nm using a microplate render. A control sample consisting of DPPH solution without the mead sample was used as a reference to determine the maximum absorbance. The antioxidant activity was calculated based on the percentage of DPPH radical inhibition.

2.9. Total Phenolic Content

The method for determining total phenolic compounds involves preparing a 50% Folin–Ciocalteu reagent (Sigma-Aldrich, St. Louis, MO, USA) and 5% sodium carbonate solution. A standard gallic acid solution is prepared with concentrations 0.01 mg/mL. In a 96-well plate, 25 µL of the standard solution or sample extract is added to each well, followed by 125 µL of DI water and 25 µL of 95% ethanol. Then, 12.5 µL of the 50% Folin–Ciocalteu reagent is added and allowed to react for 5 min. Subsequently, 25 µL of the 5% sodium carbonate solution is added, and the mixture is incubated in the dark for 1 h. The absorbance is measured using a microplate reader at a wavelength of 725 nm. The total phenolic content is calculated by comparing the absorbance of the sample with the standard curve generated from gallic acid standards [13].

2.10. Total Flavonoid Content

The method for determining total flavonoid compounds involves preparing a 10% aluminum chloride solution (1 mL) and 1M potassium acetate solution (1 mL) using distilled water. A quercetin standard solution is prepared with concentrations 0.01 mg/mL. In a 96-well plate, 20 µL of the standard or sample extract is added to each well, followed by 4 µL of the 10% aluminum chloride solution and 60 µL of methanol. Then, 4 µL of 1M potassium acetate and 112 µL of distilled water are added. The mixture is incubated at room temperature for 30 min. The absorbance is measured using a microplate reader at a wavelength of 415 nm. The total flavonoid content is calculated by comparing the absorbance of the sample with the standard curve generated from quercetin standards [14].

2.11. Sensory Evaluation

A sensory consumer test was conducted with 45 untrained consumer panelists aged 22 to 50, of mixed sexes. Each participant evaluated all five types of mead. Forty milliliters of samples of each product was served to each panelist. Samples were assigned numerical codes and presented in different sequences and random arrangements. The panelists were asked to rate each sample with a nine-point hedonistic scale for appearance, aroma, color, taste, overall impression and overall liking. The nine-point scale was structured as follows: 9: like extremely, 8: like very much, 7: like moderately, 6: like slightly, 5: like neither nor, 4: dislike slightly, 3: dislike moderately, 2: dislike very much, and 1: dislike extremely [15]. The calculated averages for each sample were then used to generate radar charts (spider charts) to visually represent the sensory profile of each mead sample.

2.12. Statistical Analysis

Statistical analyses were performed using R i386 4.1.3 and RStudio. Paired t-tests were conducted to compare pre- and post-fermentation samples, while ANOVA with Tukey’s HSD test was used for comparisons across all samples. Data are presented as the arithmetic mean ± standard deviation from three replicates per product. A significance level of p < 0.05 was applied to all analyses.

3. Results

3.1. Physicochemical Changes in Mead Before and After Fermentation

The physicochemical changes in mead before and after fermentation, including color, pH, and sugar content (glucose and fructose levels) changes, are presented in Table 1. All meads fell within the “water white” to “extra light amber” range based on the honey color standard. Following fermentation, the meads typically exhibited a lighter appearance. The darkest pre-fermentation meads were samples K, T, and V, which all displayed a similar tone of white and changed to extra white after fermentation. The lightest was C, which shifted from extra white to water white. The pH remained relatively stable across all samples, ranging from 3.5 to 4.5, with no significant increase after fermentation. Among the samples, C had the highest initial pH (~4.3), followed by T (~4.2), V (~3.9), M (~3.9), and K (~3.8). A substantial reduction in sugar content was observed. Prior to fermentation, glucose levels ranged from 58.40 mg/mL (V) to 88.82 mg/mL (C), while fructose levels were the highest in sample K (116.84 mg/mL) and lowest in sample V (65.55 mg/mL). After fermentation, glucose was nearly depleted in all samples, with sample K retaining the highest residual glucose (0.72 mg/mL). Fructose levels followed a similar trend, but samples C (1.33 mg/mL) and T (1.15 mg/mL) retained slightly higher amounts than other samples, suggesting incomplete fructose utilization. These results confirm that fermentation effectively refines mead by improving clarity, maintaining stable pH, and significantly reducing sugar levels. Differences in residual sugar content suggest variations in fermentation efficiency, which could be attributed to factors such as yeast activity, initial sugar composition, or fermentation conditions.

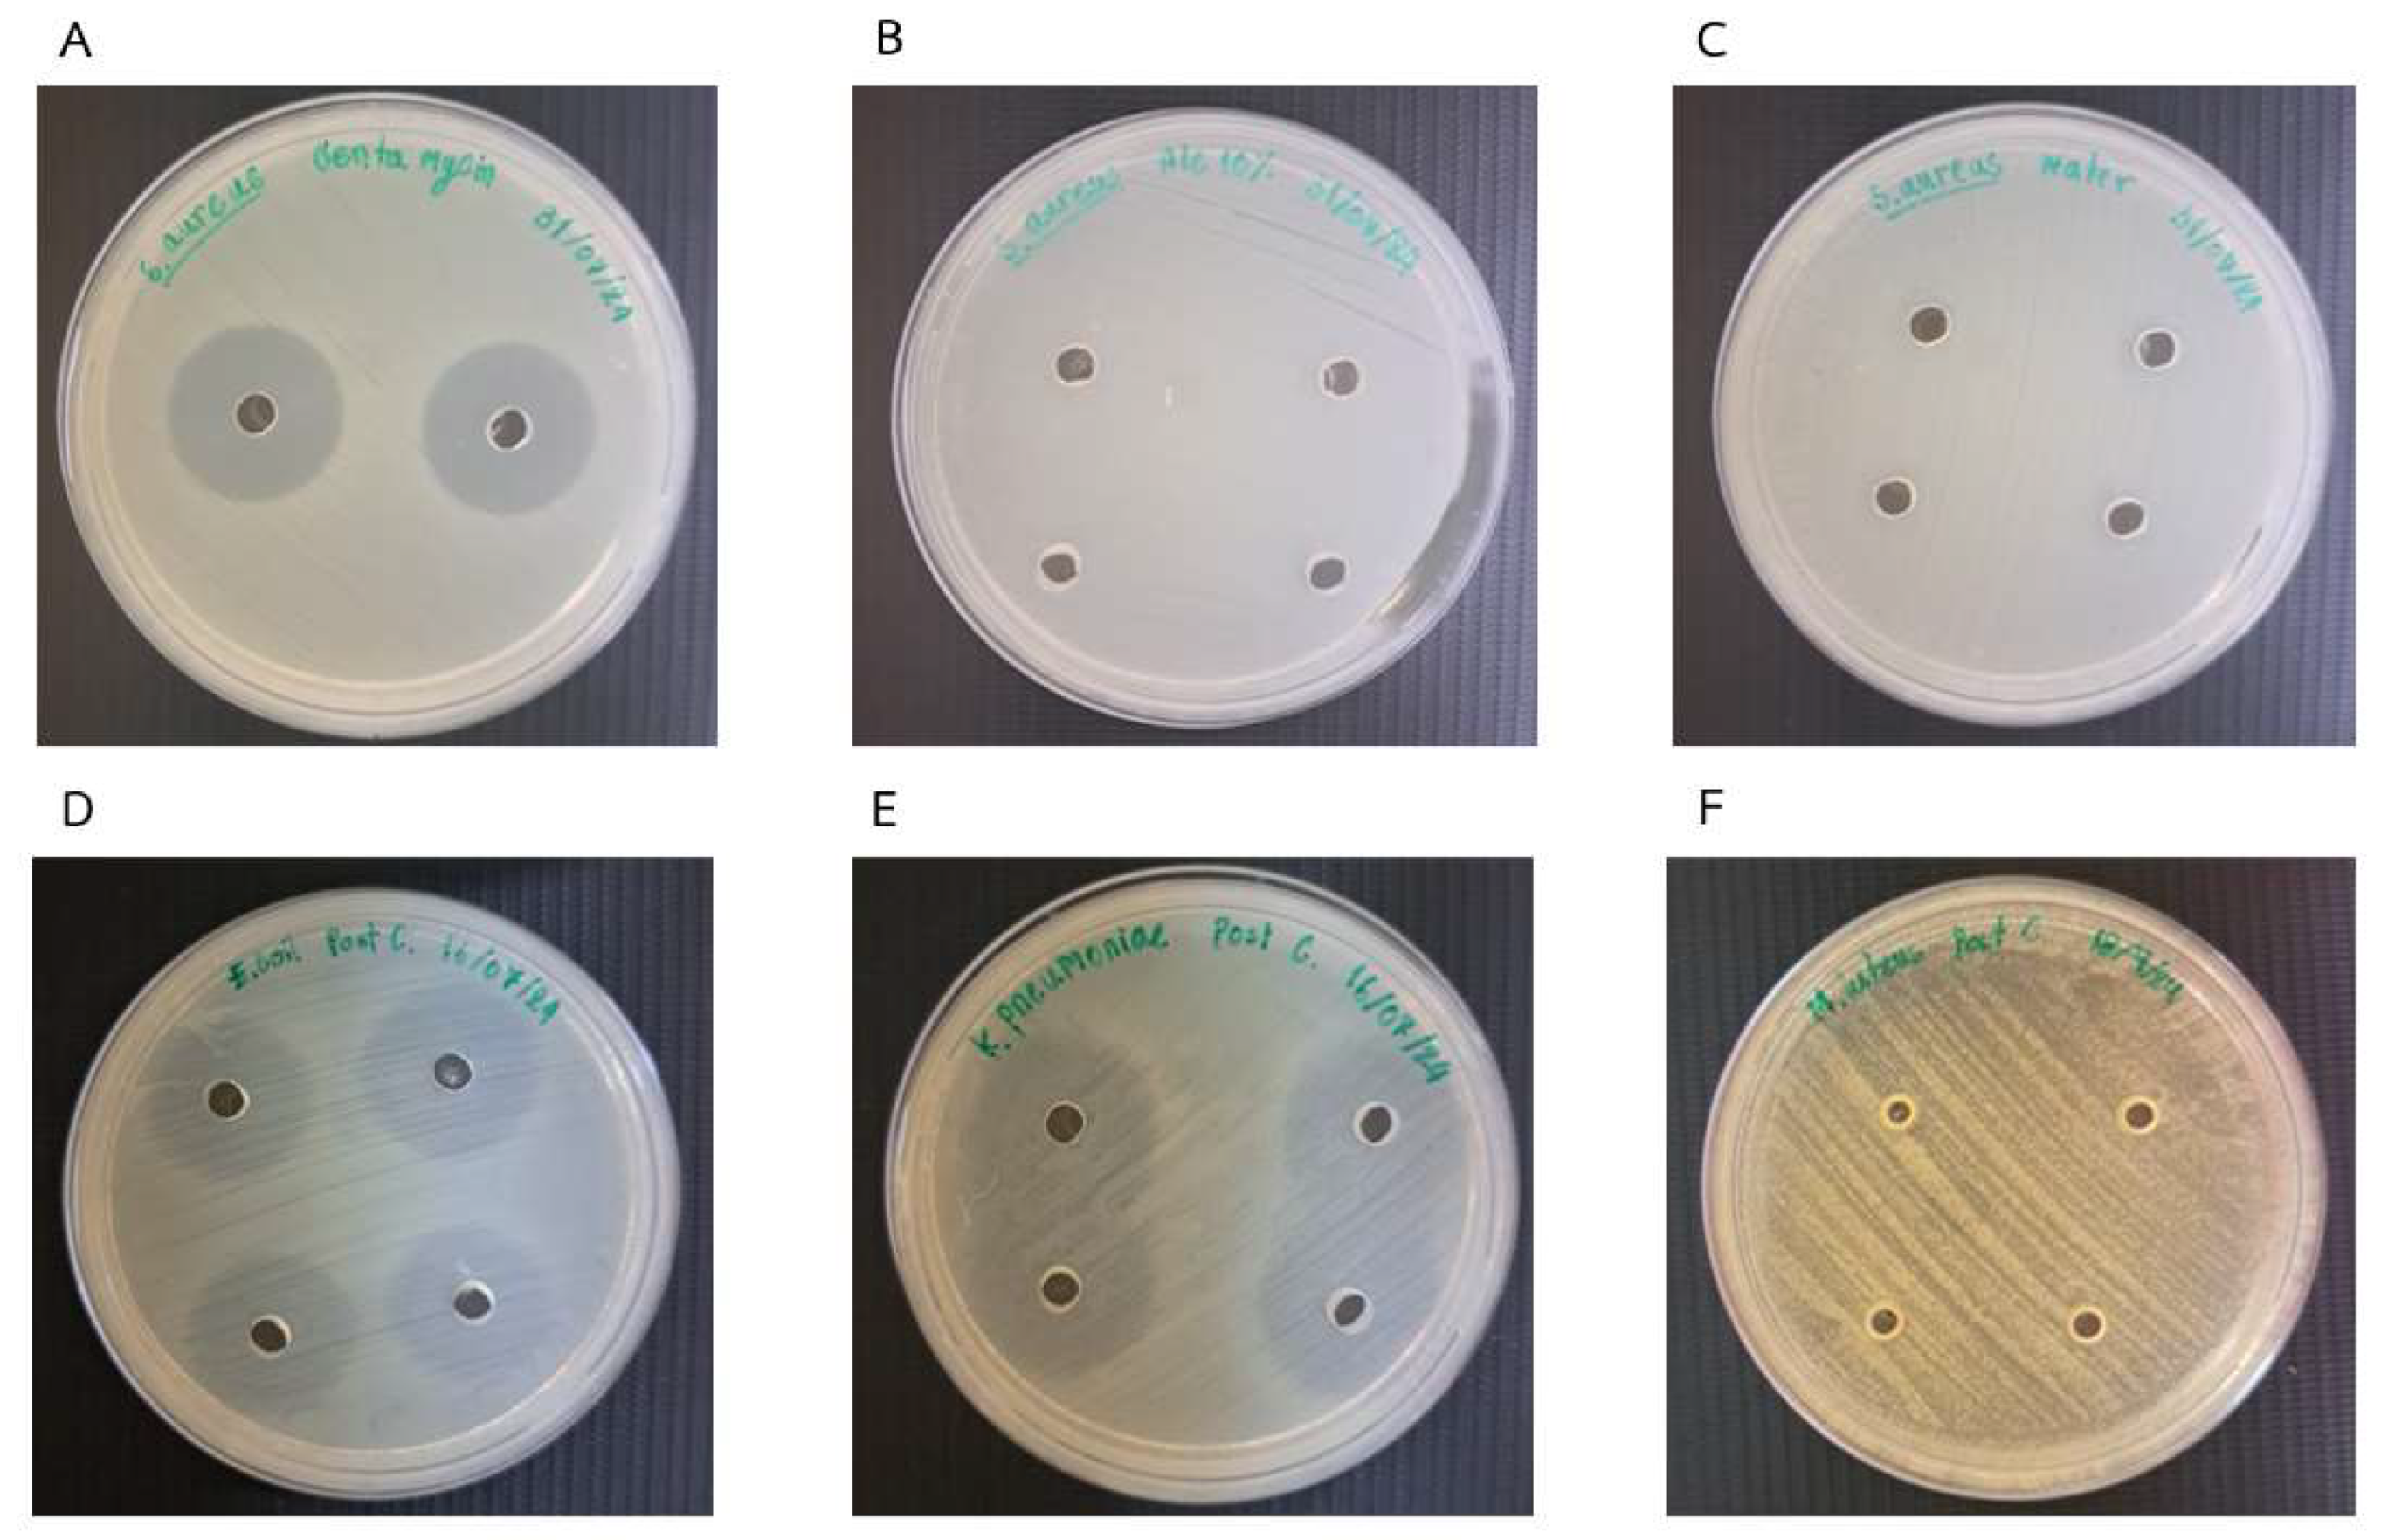
3.2. Antibacterial Activities

The positive controls (5% phenol and 0.1 mg/mL gentamicin) exhibited clear and distinct growth inhibition zones, indicating complete bacterial suppression and confirming the effectiveness of the assay. In contrast, the negative controls (water and 10% ethanol) showed no clear inhibition zone or growth reduction, verifying that the observed antimicrobial effects in the test samples were not due to ethanol content. Notably, the mead samples exhibited growth reduction zones—defined as areas where bacterial growth was visibly decreased but not entirely inhibited—suggesting a bacteriostatic rather than bactericidal effect (Figure 1). The extent of inhibition varied across bacterial species and fermentation status as reported in Table 2.
For E. coli, growth reduction zones were observed both before and after fermentation in all mead samples. Against S. aureus, growth reduction was detected in pre-fermentation Coffee mead (V) and post-fermentation Kapok mead (K). In contrast, K. pneumoniae showed no inhibition before fermentation, but after fermentation, all mead samples demonstrated visible growth reduction. None of the tested samples inhibited M. luteus. These findings indicate that fermentation influences the antimicrobial properties of meads, with some samples exhibiting enhanced inhibitory effects after fermentation. Further studies are necessary to determine the active compounds responsible for this activity and whether the observed growth reduction translates to practical antimicrobial applications.

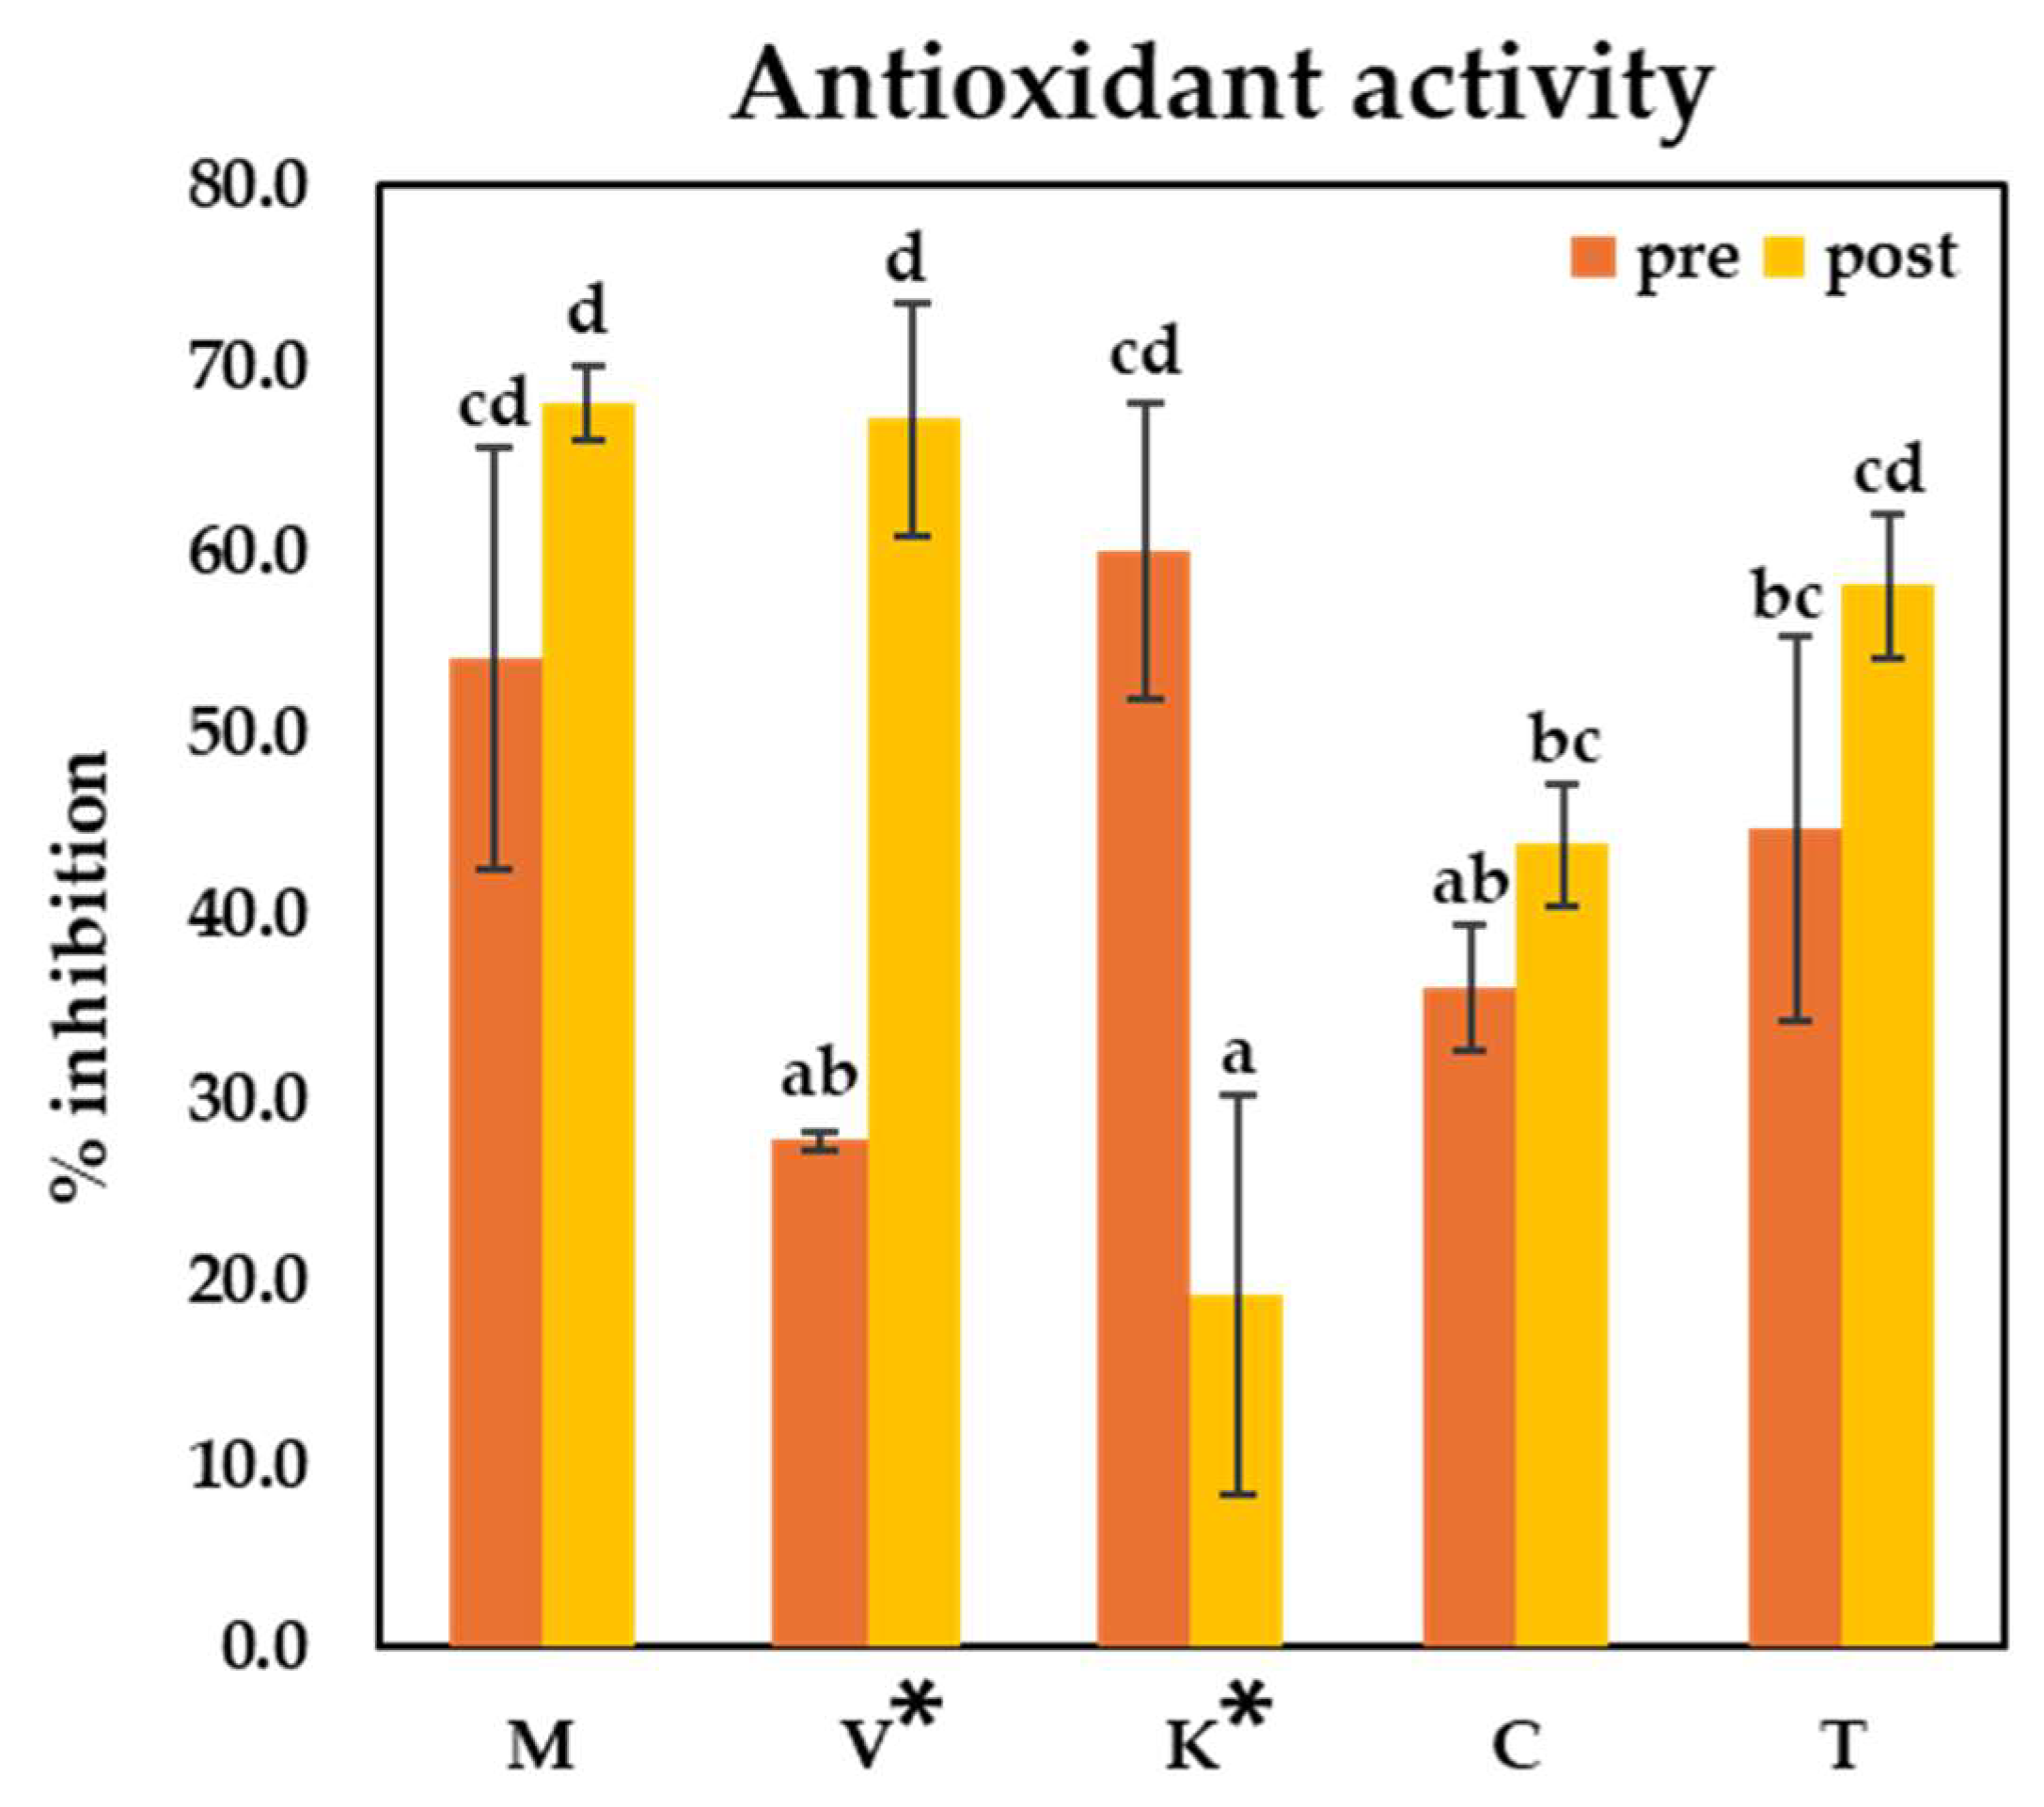
3.3. Antioxidant Activities

The antioxidant activity of the mead samples was assessed using the DPPH assay, with inhibition percentages recorded both before and after fermentation (Figure 2). The results indicated variation in antioxidant potential among the samples, with inhibition percentages ranging from 19.25% to 68.11%. Before fermentation, the highest antioxidant activity was observed in sample K (60.05%), followed by M (54.19%), T (44.84%), C (36.30%), and V (27.74%). After fermentation, the inhibition percentages shifted, with M exhibiting the highest antioxidant capacity (68.11%), followed by V (67.25%), T (58.07%), C (43.89%), and K (19.25%). While an overall trend of increased antioxidant activity following fermentation was observed, our statistical analysis using a paired t-test revealed that samples V and K exhibited a significant difference (p < 0.05) between pre- and post-fermentation antioxidant activity. This suggests that, apart from K, which exhibited a decrease in antioxidant activity, fermentation generally enhanced antioxidant capacity. However, the observed changes in most samples may not be statistically robust, except for V.

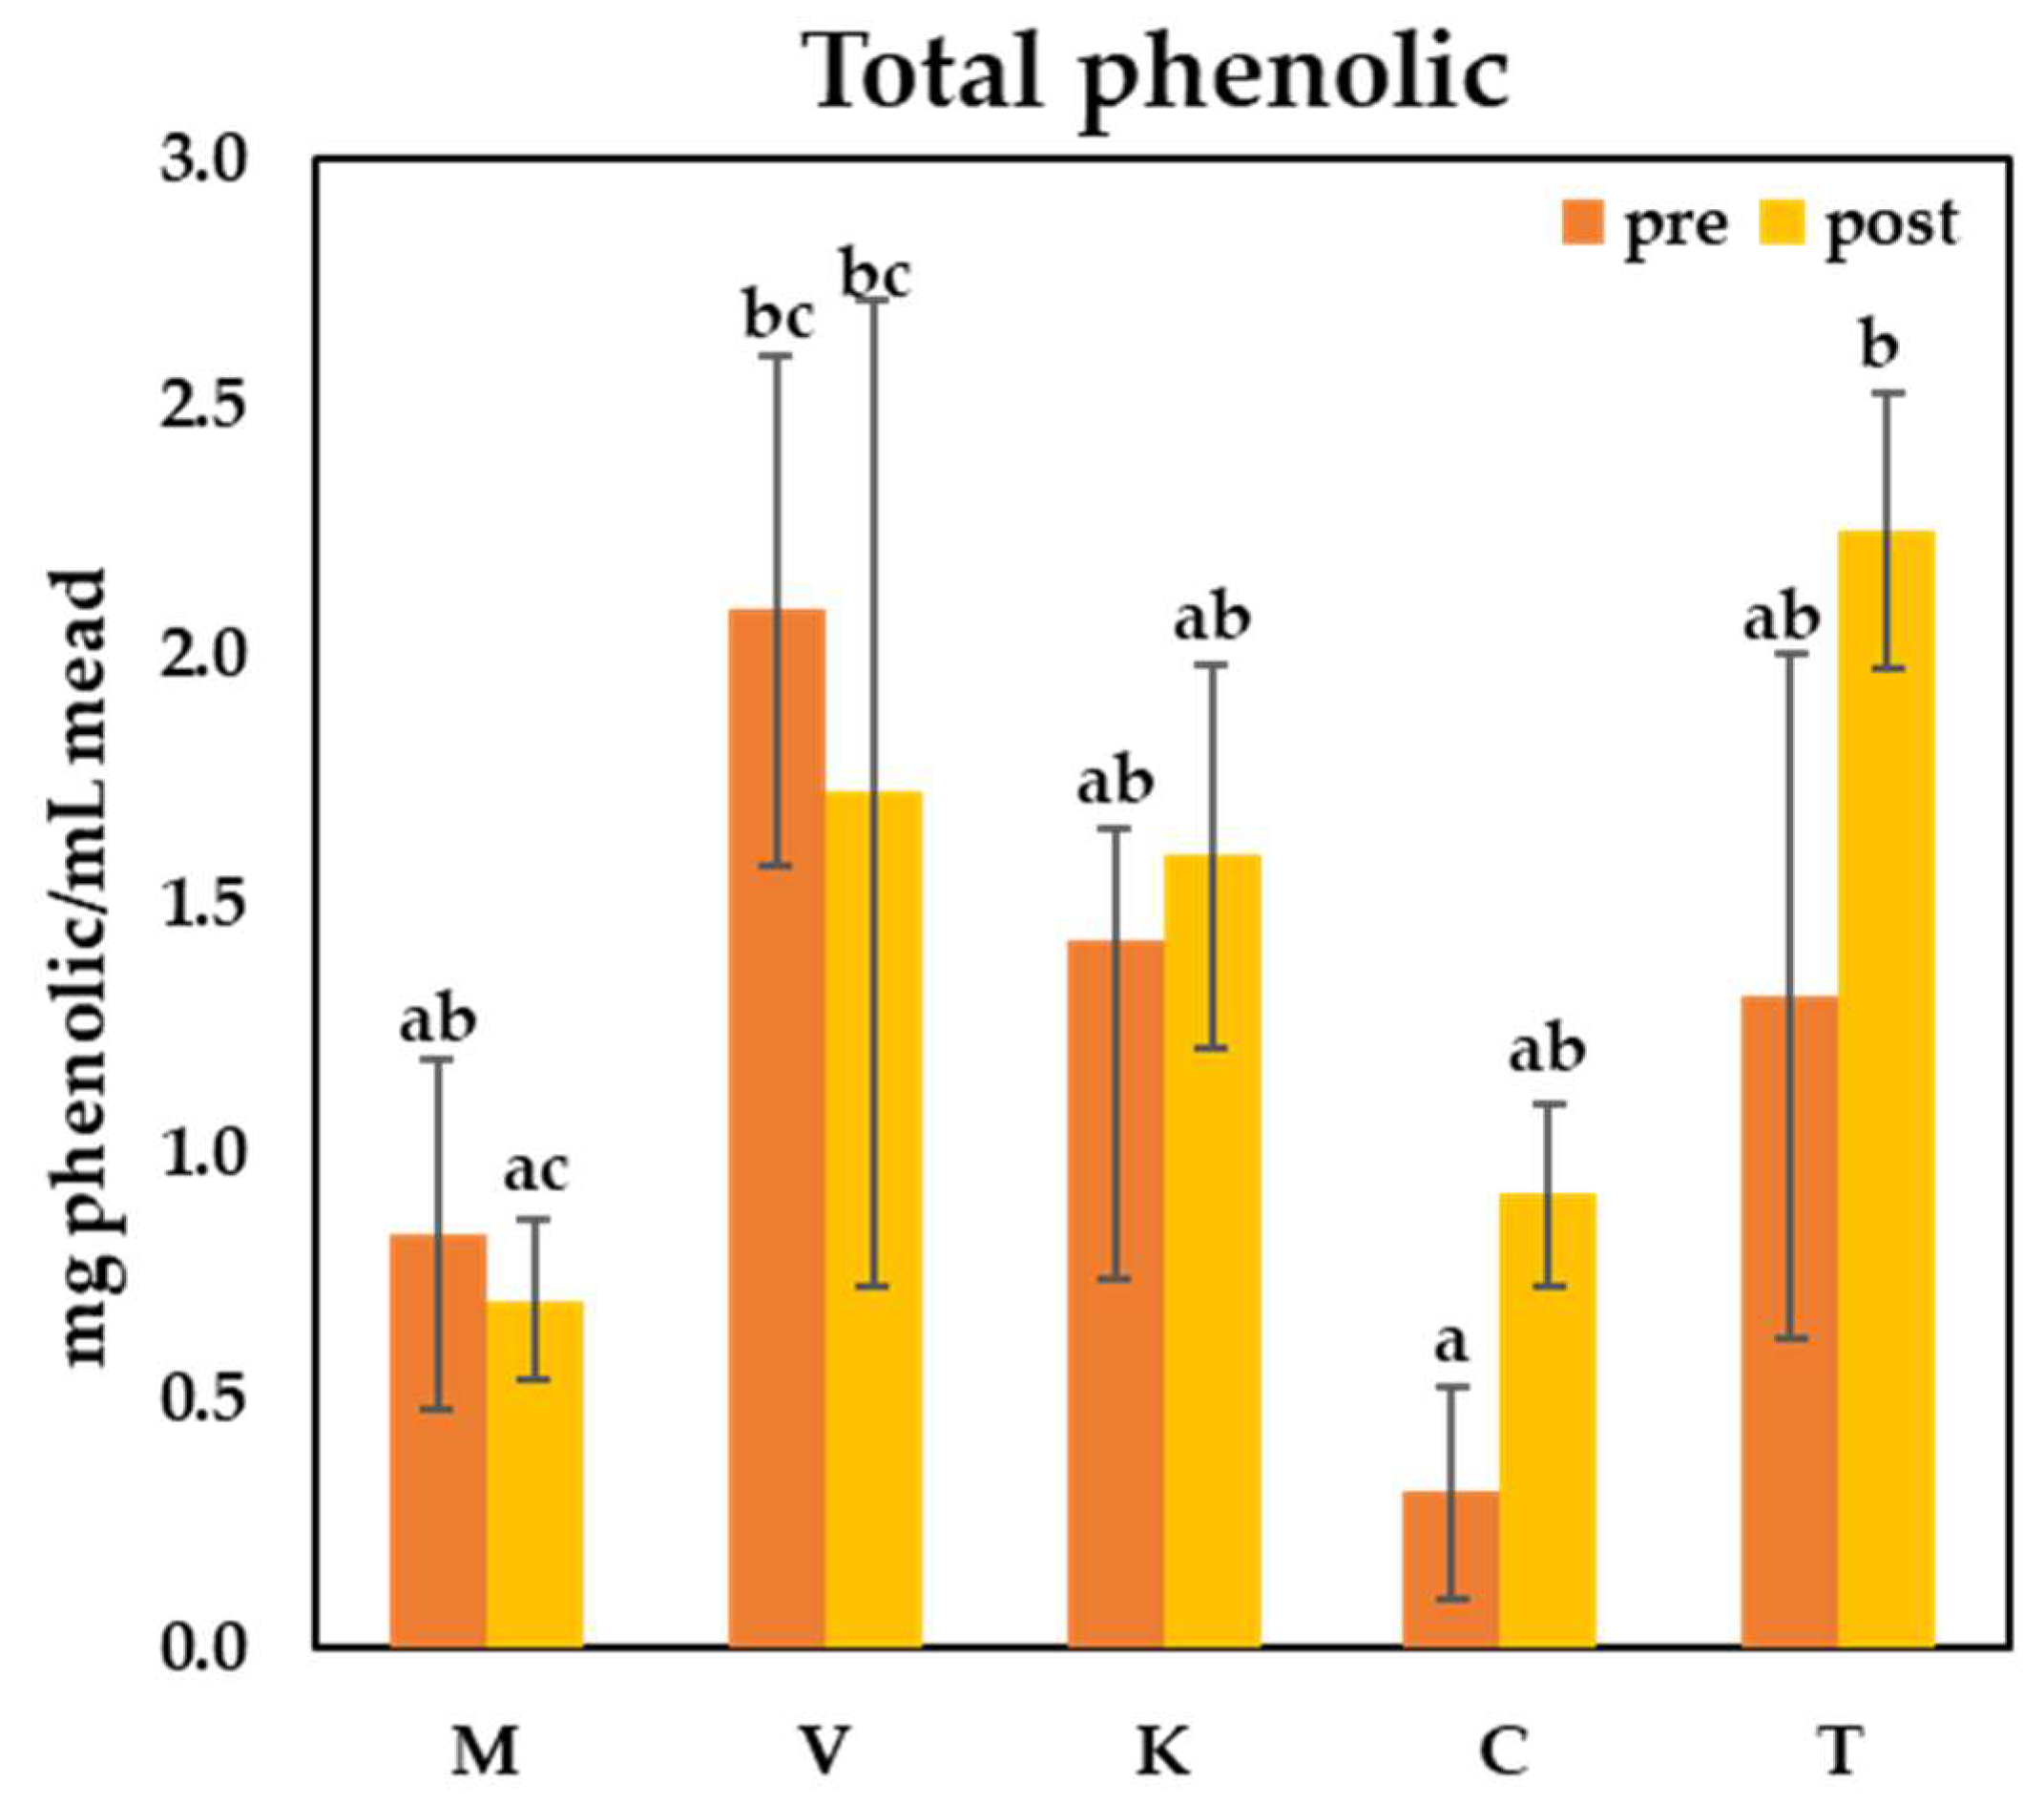
3.4. Total Phenolic and Flavonoid Contents

The total phenolic content of the mead samples was analyzed, with values ranging from 0.31 to 2.25 mg phenolic/mL (Figure 3). The results indicate variations in phenolic concentration among samples, both pre- and post-fermentation, suggesting that fermentation influences the retention or transformation of phenolic compounds. Before fermentation, the highest total phenolic content was observed in V (2.09 mg/mL), followed by K (1.43 mg/mL), T (1.31 mg/mL), M (0.83 mg/mL), and C (0.32 mg/mL). After fermentation, the ranking shifted, with T exhibiting the highest total phenolic content (2.25 mg/mL), followed by V (1.72 mg/mL), K (1.50 mg/mL), C (0.91 mg/mL), and M (0.70 mg/mL).
The total flavonoid content of the mead samples was analyzed, with values ranging from 0.0381 to 0.2422 mg flavonoid/mL (Figure 4). These results indicate variability in flavonoid concentration among samples, with some showing a slight increase while others experienced a decline following fermentation. Before fermentation, the highest total flavonoid content was observed in K (0.21 mg/mL), followed by T (0.13 mg/mL), C (0.08 mg/mL), V (0.05 mg/mL), and M (0.05 mg/mL). Following fermentation, the ranking shifted slightly, with K retaining the highest flavonoid content (0.21 mg/mL), followed by T (0.15 mg/mL), M (0.06 mg/mL), C (0.04 mg/mL), and V (0.04 mg/mL).
Unlike phenolic compounds, where three samples showed an increase after fermentation, only T and M exhibited a modest rise in flavonoid content. While these changes were not statistically significant, a trend toward increased flavonoid levels in T and M was observed, with T increasing from 0.13 to 0.15 mg/mL and M increasing from 0.05 to 0.06 mg/mL. This suggests that fermentation may have played a role in enhancing the extraction or solubilization of flavonoids in these specific samples. The increase could be attributed to the breakdown of flavonoid-bound complexes, making them more bioavailable. However, the observed variations across samples indicate that flavonoid retention during fermentation is influenced by multiple factors, such as raw material composition and microbial activity, rather than a consistent enhancement effect.

3.5. Sensory Evaluation

The sensory evaluation results (Figure 5) indicate that appearance was rated highly across all mead samples, with sample M receiving the highest score (7.5), followed by C (7.1), V (7.0), T (6.9), and K (6.7). This suggests that all meads had visually appealing characteristics, with minor variations among them. Among the sensory attributes, sample M consistently achieved the highest ratings across all parameters, including aroma (7.0), taste (6.3), mouthfeel (6.3), aftertaste (6.3), overall perception (6.4), and overall liking (6.6). These results indicate that sample M provided the most balanced and desirable sensory experience, making it the most preferred mead. Sample K also presented relatively desirable results, particularly in taste (5.1), mouthfeel (5.0), and overall perception (5.5), suggesting a well-rounded but slightly less favorable profile compared to M. Samples T and C received moderate scores in overall liking (5.1 and 5.4, respectively), with T presenting slightly better results in aroma (5.9) and C in taste (5.0) and aftertaste (5.1). Sample V had the lowest scores across most attributes, particularly in taste (4.6), overall liking (5.0), and overall perception (5.0), suggesting that it was the least favored mead in the sensory evaluation.

4. Discussion

The fermentation process significantly modified the physicochemical and biological properties of meads produced from five different honey varieties: Tree Marigold (Tithonia diversifolia, Myanmar, M), Coffee (Coffea canephora, Vietnam, V), Kapok (Ceiba pentandra, Cambodia, K), Rubber (Hevea brasiliensis, China, C), and Mixed Floral (Thailand, T). Changes in color, pH, antimicrobial activity, antioxidant capacity, and sensory characteristics were observed, consistent with previous studies on mead fermentation and honey-derived fermented beverages [16]. The color analysis revealed a general lightening of the meads following fermentation (Table 1), which is likely due to pigment degradation and oxidative processes. The reduction in color intensity aligns with previous findings where fermentation led to the breakdown of polyphenols and Maillard reaction intermediates, thereby altering the visual characteristics of the final product [17]. The honey varieties with higher initial pigment concentrations, such as Kapok and Mixed Floral meads, showed a noticeable transition to lighter shades, whereas Rubber mead changed from extra white to water white, suggesting a more pronounced structural modification of chromophores during fermentation [18]. The pH values ranged from 3.5 to 4.5 (Table 2), providing microbial stability and sensory attributes in mead production. The stable pH values are due to the buffering capacity of organic acids such as gluconic, lactic, and acetic acids, which are either present in honey or formed during fermentation [13]. The highest initial pH was found in Rubber mead, which was least affected following fermentation, suggesting lower acid production or higher initial buffering components.
Regarding antimicrobial activity, all meads exhibited inhibitory effects against E. coli before and after fermentation, while S. aureus inhibition was detected before fermentation in Coffee mead and after fermentation in Rubber mead. Additionally, after fermentation, all samples demonstrated antimicrobial effects against K. pneumoniae, whereas no activity was detected against M. luteus (Table 2). The antimicrobial properties of meads likely stem from bioactive compounds such as phenolics, organic acids, and hydrogen peroxide, which are enhanced or transformed during fermentation [19]. Fermentation also promotes the production of antimicrobial peptides like saccharomycin by S. cerevisiae, further contributing to microbial suppression [20,21].
The increased inhibition of post-fermentation K. pneumoniae suggests that ethanol and antimicrobial peptides enhance microbial suppression. Ethanol, beyond its direct antimicrobial effects, may increase membrane permeability, improving the delivery and function of bioactive compounds [22]. This synergy likely amplifies the antimicrobial activity in meads. In contrast, M. luteus remained unaffected, possibly due to its thick peptidoglycan layer, which may limit bioactive compound penetration. These findings highlight the role of fermentation in optimizing bioactive compound interactions, with ethanol acting as both an antimicrobial agent and an enhancer of bioactive compound efficacy. Future research should explore fermentation parameters that maximize these effects.
Antioxidant activity ranged from 19.25% to 68.11%, with notable increases in some post-fermentation samples (Figure 2). The highest post-fermentation antioxidant activity was observed in sample M, while sample K exhibited a decline. The enhancement of antioxidant properties in certain meads could be attributed to the bioconversion of phenolic precursors into more bioactive derivatives, as observed in previous studies on fermented honey products [23]. The decline in K’s antioxidant activity suggests the degradation of specific phenolic compounds, potentially due to prolonged exposure to oxidative stress during fermentation [24,25]. Furthermore, a variation was observed in TPC among the meads (Figure 3). The highest TPC after fermentation was found in sample T, while the lowest was in sample C. Notably, samples V and M showed a reduction in TPC after fermentation. It was determined that the increase in TPC in samples K, C, and T was due to the release of bound polyphenols through enzymatic action. Conversely, the decrease in phenolic content in samples V and M suggests the degradation of certain polyphenols under prolonged fermentation conditions [26]. TFC followed a similar trend, with the highest pre-fermentation values observed in K and the lowest in V (Figure 4). The post-fermentation increase in flavonoids in samples T and M was due to the hydrolysis of flavonoid glycosides into their more bioavailable aglycone forms. However, the Kapok mead (K) displayed a decrease in flavonoid content, which linked to oxidative degradation or complexation with proteins during fermentation [27].
The sensory test results of meads produced from five honey sources in the Mekong region (Figure 5) showed that all samples received high scores in the appearance parameter, indicating the product’s visual appeal. Sample M consistently achieved the highest ratings across all categories, including taste, mouthfeel, aftertaste, and overall liking. In contrast, other samples (T, C, V, and K) exhibited similar sensory characteristics but did not match the overall preference for sample M, particularly in taste and overall satisfaction. The superior performance of sample M could be attributed to the balanced combination of residual sugars and desirable volatile compounds, as well as the interaction of polyphenols with other flavor components. Meanwhile, samples K and V did not receive ratings that were nearly as high in taste despite having high bioactive properties such as antioxidant and antimicrobial activities. This discrepancy may have resulted from the degradation of specific polyphenolic compounds during the fermentation process [28]. These findings align with those of previous studies on the impact of key volatile compounds and physicochemical parameters on sensory perception. For instance, the sensory characteristics of distilled fruit beverages, such as plum brandies, were found to be significantly influenced by volatile compounds, including 1-propanol and acetaldehyde, which impact aroma and taste perception [29]. Similarly, the sensory attributes of Motal cheese were shown to be affected by processing factors such as pasteurization and ripening conditions, emphasizing the interplay between physicochemical characteristics and consumer acceptability [30]. Despite the high bioactive properties of some samples, such as K and V, including antioxidant and antimicrobial activities, these attributes did not necessarily translate into higher sensory scores, particularly in taste. This further supports the idea that while chemical composition contributes to health-related benefits, sensory preference is more directly influenced by taste-active and aroma-active compounds, as previously demonstrated in studies on fermented foods and beverages [30,31].
Future development strategies should focus on improving the fermentation process, such as must preparation with added yeast nutrients to enhance flavor complexity and aroma, as well as using yeast strains that produce favorable volatile compounds. Additionally, controlled fermentation techniques could be applied to maintain or increase antioxidant capacity and polyphenol content. Further product development could explore creating new mead formulations with lower sweetness or infusion with herbs and fruits to broaden the flavor profile. Market testing with diverse target groups would help refine the formulation and packaging design based on consumer preferences. Moreover, investigating the effects of aging on mead quality, such as aging in oak barrels to increase flavor complexity, could lead to a high-quality product that meets consumer expectations and enhances the competitive potential of meads in the global alcoholic beverage market.

5. Conclusions

The results of this study demonstrated that the fermentation process significantly influences the physicochemical and biological properties of meads produced from five different honey sources in the Mekong region. The obtained results revealed that fermentation led to a general lightening of the meads, a stable pH range, and an enhancement in antimicrobial activity against E. coli and K. pneumoniae, while also altering antioxidant properties and polyphenolic content in a honey-dependent manner. Some meads exhibited an increase in antioxidant capacity and total flavonoid content, suggesting the potential bioconversion of phenolic compounds into more bioactive forms. However, other varieties showed a decline in total phenolic content, possibly due to oxidative degradation. The sensory evaluation highlighted Tree Marigold mead (M) as the most preferred type, with superior ratings for taste, mouthfeel, aftertaste, and overall liking, likely due to a favorable balance of residual sugars and volatile compounds. These findings suggest that honey variety plays a crucial role in determining the final quality of mead, influencing both its bioactive profile and consumer acceptance. This study ultimately shows how different honey sources impact mead quality. The findings emphasize the potential of region-specific honeys for producing high-quality meads with functional health benefits. Future research should focus on optimizing fermentation conditions, yeast strain selection, and aging processes to enhance the retention of bioactive compounds while improving sensory appeal, thereby expanding the commercial potential of meads in the global beverage market.

Author Contributions

Conceptualization, S.I. (Sahutchai Inwongwan), H.P., N.N., S.I. (Sitthisak Intarasit) and T.D.; methodology, S.I. (Sahutchai Inwongwan) and T.K.; validation, S.I. (Sahutchai Inwongwan), T.K. and P.W.; formal analysis, S.I. (Sahutchai Inwongwan), T.K., P.W. and W.L.M., C.S. and P.T.; investigation, S.I. (Sahutchai Inwongwan), T.K. and P.T.; resources, T.D.; data curation, S.I. (Sahutchai Inwongwan); writing—original draft preparation, S.I. (Sahutchai Inwongwan) and T.K.; writing—review and editing, S.I. (Sahutchai Inwongwan); visualization, S.I. (Sahutchai Inwongwan) and T.K.; supervision, T.D.; project administration, T.K., C.S. and P.T.; funding acquisition, S.I. (Sahutchai Inwongwan) and T.D. All authors have read and agreed to the published version of the manuscript.

Funding

Mekong-Lancang Cooperation (MLC) Special Fund number 2022.

Institutional Review Board Statement

Not applicable.

Informed Consent Statement

Informed consent was obtained from all subjects involved in the study.

Data Availability Statement

The original contributions presented in the study are included in the article, further inquiries can be directed to the corresponding author.

Acknowledgments

This research work was partially supported by Chiang Mai University. We extend our gratitude to the Langchang-Mekong Cooperation Special Fund for supporting this project, particularly in facilitating honey sourcing and fostering regional collaboration within the Mekong region. We also acknowledge the SMART BEE SDGs Lab for providing essential materials and research support. Additionally, we appreciate the Day Drinker Collective Company Limited for their generous provision of fermentation facilities and expertise in the mead brewing process. ChatGPT 4.0 was used solely for proofreading and had no intellectual contribution to the manuscript.

Conflicts of Interest

Authors Pitchayapak Wongsasuk and William Le masurier are employed by the company Day Drinker Collective Company Limited. But for purposes of this investigation, there was no financing relationship with the company; therefore, there are no conflicts of interest. The remaining authors declare that the research was conducted in the absence of any commercial or financial relationships that could be construed as a potential conflict of interest.

References

  1. McGovern, P.E.; Zhang, J.; Tang, J.; Zhang, Z.; Hall, G.R.; Moreau, R.A.; Nunez, A.; Butrym, E.D.; Richards, M.P.; Wang, C.-S.; et al. Fermented beverages of pre- and proto-historic China. Proc. Natl. Acad. Sci. USA 2004, 101, 17593–17598. [Google Scholar] [PubMed]
  2. Xiang, H.; Sun-Waterhouse, D.; Waterhouse, G.I.; Cui, C.; Ruan, Z. Fermentation-enabled wellness foods: A fresh perspective. Food Sci. Hum. Wellness 2019, 8, 203–243. [Google Scholar]
  3. Liu, Y.; Jiang, B.; Wang, K. A review of fermented bee products: Sources, nutritional values, and health benefits. Food Res. Int. 2023, 174, 113506. [Google Scholar]
  4. Roldán, A.; van Muiswinkel, G.; Lasanta, C.; Palacios, V.; Caro, I. Influence of pollen addition on mead elaboration: Physicochemical and sensory characteristics. Food Chem. 2011, 126, 574–582. [Google Scholar]
  5. Yang, F.; Chen, C.; Ni, D.; Yang, Y.; Tian, J.; Li, Y.; Chen, S.; Ye, X.; Wang, L. Effects of Fermentation on Bioactivity and the Composition of Polyphenols Contained in Polyphenol-Rich Foods: A Review. Foods 2023, 12, 3315. [Google Scholar] [CrossRef]
  6. da Silva, P.M.; Gauche, C.; Gonzaga, L.V.; Costa, A.C.O.; Fett, R. Honey: Chemical composition, stability and authenticity. Food Chem. 2016, 196, 309–323. [Google Scholar] [CrossRef]
  7. Varela, C.; Pizarro, F.; Agosin, E. Biomass content governs fermentation rate in nitrogen-deficient wine musts. Appl. Environ. Microbiol. 2004, 70, 3392–3400. [Google Scholar]
  8. Bauer, F.F.; Pretorius, I.S. Yeast stress response and fermentation efficiency: How to survive the making of wine—A review. S. Afr. J. Enol. Vitic. 2019, 21, 27–51. [Google Scholar]
  9. AOAC. Official Methods of Analysis of AOAC International, 15th ed.; Association of Official Analytical Chemists: Arlington, VA, USA, 2000. [Google Scholar]
  10. Kamata, T.; Uemura, M. Solute accumulation in wheat seedlings during cold acclimation: Contribution to increased freezing tolerance. Cryo Lett. 2004, 25, 311–322. [Google Scholar]
  11. Hossain, M.L.; Lim, L.Y.; Hammer, K.; Hettiarachchi, D.; Locher, C. A Review of Commonly Used Methodologies for Assessing the Antibacterial Activity of Honey and Honey Products. Antibiotics 2022, 11, 975. [Google Scholar] [CrossRef]
  12. Kedare, S.B.; Singh, R.P. Genesis and development of DPPH method of antioxidant assay. J. Food Sci. Technol. 2011, 48, 412–422. [Google Scholar] [CrossRef] [PubMed]
  13. Chitarrini, G.; Debiasi, L.; Stuffer, M.; Ueberegger, E.; Zehetner, E.; Jaeger, H.; Robatscher, P.; Conterno, L. Volatile Profile of Mead Fermenting Blossom Honey and Honeydew Honey with or without Ribes nigrum. Molecules 2020, 25, 1818. [Google Scholar] [CrossRef] [PubMed]
  14. Shraim, A.M.; Ahmed, T.A.; Rahman, M.; Hijji, Y.M. Determination of total flavonoid content by aluminum chloride assay: A critical evaluation. LWT 2021, 150, 111932. [Google Scholar] [CrossRef]
  15. Stone, H.; Sidel, J.L. 6—Descriptive Analysis. In Sensory Evaluation Practices, 3rd ed.; Stone, H., Sidel, J.L., Eds.; Academic Press: San Diego, CA, USA, 2004; pp. 201–245. [Google Scholar]
  16. Mărgăoan, R.; Cornea-Cipcigan, M.; Topal, E.; Kösoğlu, M. Impact of Fermentation Processes on the Bioactive Profile and Health-Promoting Properties of Bee Bread, Mead and Honey Vinegar. Processes 2020, 8, 1081. [Google Scholar] [CrossRef]
  17. Gutiérrez-Escobar, R.; Aliaño-González, M.J.; Cantos-Villar, E. Wine Polyphenol Content and Its Influence on Wine Quality and Properties: A Review. Molecules 2021, 26, 718. [Google Scholar] [CrossRef]
  18. Ávila, F.; Schmeda-Hirschmann, G.; Silva, E. The Major Chromophore Arising from Glucose Degradation and Oxidative Stress Occurrence during Lens Proteins Glycation Induced by Glucose. Molecules 2018, 23, 6. [Google Scholar] [CrossRef]
  19. Abdul Hakim, B.N.; Xuan, N.J.; Oslan, S.N.H. A Comprehensive Review of Bioactive Compounds from Lactic Acid Bacteria: Potential Functions as Functional Food in Dietetics and the Food Industry. Foods 2023, 12, 2850. [Google Scholar] [CrossRef]
  20. Pereira, P.R.; Freitas, C.S.; Paschoalin, V.M.F. Saccharomyces cerevisiae biomass as a source of next-generation food preservatives: Evaluating potential proteins as a source of antimicrobial peptides. Compr. Rev. Food Sci. Food Saf. 2021, 20, 4450–4479. [Google Scholar] [CrossRef]
  21. Varela, C.; Torrea, D.; Schmidt, S.A.; Ancin-Azpilicueta, C.; Henschke, P.A. Effect of oxygen and lipid supplementation on the volatile composition of chemically defined medium and Chardonnay wine fermented with Saccharomyces cerevisiae. Food Chem. 2012, 135, 2863–2871. [Google Scholar] [CrossRef]
  22. Sen, O.; Hinks, J.; Lin, Q.; Lin, Q.; Kjelleberg, S.; Rice, S.A.; Seviour, T. Escherichia coli displays a conserved membrane proteomic response to a range of alcohols. Biotechnol. Biofuels Bioprod. 2023, 16, 147. [Google Scholar] [CrossRef]
  23. Fortes, J.P.; Franco, F.W.; Baranzelli, J.; Ugalde, G.A.; Ballus, C.A.; Rodrigues, E.; Mazutti, M.A.; Somacal, S.; Sautter, C.K. Enhancement of the Functional Properties of Mead Aged with Oak (Quercus) Chips at Different Toasting Levels. Molecules 2023, 28, 56. [Google Scholar]
  24. Adamenko, K.; Kawa-Rygielska, J.; Kucharska, A.Z.; Głowacki, A.; Piórecki, N. Changes in the Antioxidative Activity and the Content of Phenolics and Iridoids during Fermentation and Aging of Natural Fruit Meads. Biomolecules 2021, 11, 1113. [Google Scholar] [CrossRef] [PubMed]
  25. Socha, R.; Pająk, P.; Fortuna, T.; Buksa, K. Phenolic Profile and Antioxidant Activity of Polish Meads. Int. J. Food Prop. 2015, 18, 2713–2725. [Google Scholar]
  26. Akalın, H.; Bayram, M.; Anlı, R.E. Determination of some individual phenolic compounds and antioxidant capacity of mead produced from different types of honey: Properties of mead from different types of honey. J. Inst. Brew. 2017, 123, 167–174. [Google Scholar]
  27. Cheung, Y.; Meenu, M.; Yu, X.; Xu, B. Phenolic acids and flavonoids profiles of commercial honey from different floral sources and geographic sources. Int. J. Food Prop. 2019, 22, 290–308. [Google Scholar] [CrossRef]
  28. Bogdanov, S.; Jurendic, T.; Sieber, R.; Gallmann, P. Honey for Nutrition and Health: A Review. J. Am. Coll. Nutr. 2008, 27, 677–689. [Google Scholar]
  29. Balak, J.; Drábová, L.; Maťátková, O.; Doležal, M.; Marsík, D.; Kolouchova, I.J. Differences in Volatile Profiles and Sensory Characteristics in Plum Spirits on a Production Scale. Fermentation 2024, 10, 235. [Google Scholar] [CrossRef]
  30. Rezaei, A.; Alirezalu, K.; Damirchi, S.A.; Hesari, J.; Papademas, P.; Domínguez, R.; Lorenzo, J.M.; Yaghoubi, M. Effect of Pasteurization and Ripening Temperature on Chemical and Sensory Characteristics of Traditional Motal Cheese. Fermentation 2020, 6, 95. [Google Scholar] [CrossRef]
  31. Alfonzo, A.; Gaglio, R.; Barbera, M.; Francesca, N.; Moschetti, G.; Settanni, L. Evaluation of the Fermentation Dynamics of Commercial Baker’s Yeast in Presence of Pistachio Powder to Produce Lysine-Enriched Breads. Fermentation 2020, 6, 2. [Google Scholar]
Figure 1. Comparison of inhibitory zones, showing the positive control (0.1 mg/mL gentamycin) (A), negative control (10% ethanol) (B), negative control (water) (C), an example of post-fermentation mead from Rubber honey (China) against E. coli (D) and K. pneumoniae (E), and the lack of activity against M. luteus (F).
Fermentation 11 00190 g001
Figure 2. Antioxidant activity of meads before and after fermentation. A * indicates a significant difference between pre- and post-fermentation meads (paired t-test, p < 0.05). Statistical groupings (letters) were determined using ANOVA and post hoc tests (p < 0.05). Pre-fermentation values are in orange; post-fermentation values in yellow. Meads were produced from five honey sources: Tree Marigold (T. diversifolia, Myanmar, M), Coffee (C. canephora, Vietnam, V), Kapok (C. pentandra, Cambodia, K), Rubber (H. brasiliensis, China, C), and Mixed Floral (Thailand, T).
Fermentation 11 00190 g002
Figure 3. Total phenolic content before and after fermentation. Statistical groupings (letters) were determined using ANOVA and post hoc tests (p < 0.05). Pre-fermentation values are in orange; post-fermentation values in yellow. Meads were produced from five honey sources: Tree Marigold (T. diversifolia, Myanmar, M), Coffee (C. canephora, Vietnam, V), Kapok (C. pentandra, Cambodia, K), Rubber (H. brasiliensis, China, C), and Mixed Floral (Thailand, T).
Fermentation 11 00190 g003
Figure 4. Total flavonoid content before and after fermentation. Statistical groupings (letters) were determined using ANOVA and post hoc tests (p < 0.05). Pre-fermentation values are in orange; post-fermentation values in yellow. Meads were produced from five honey sources: Tree Marigold (T. diversifolia, Myanmar, M), Coffee (C. canephora, Vietnam, V), Kapok (C. pentandra, Cambodia, K), Rubber (H. brasiliensis, China, C), and Mixed Floral (Thailand, T).
Fermentation 11 00190 g004
Figure 5. Sensory evaluation radar chart comparing mead samples based on taste, aroma, appearance, mouthfeel, aftertaste, overall perception, and overall liking. Sample M exhibited the highest ratings across all attributes, indicating the most favorable sensory profile among the tested meads. Meads were produced from five different honey sources: Tree Marigold (T. diversifolia, Myanmar, M), Coffee (C. canephora, Vietnam, V), Kapok (C. pentandra, Cambodia, K), Rubber (H. brasiliensis, China, C), and Mixed Floral (Thailand, T).
Fermentation 11 00190 g005
Table 1. Physiochemical changes in pre- and post-fermentation meads.
SamplesColorpHGlucose
(mg/mL ± SD)
Fructose
(mg/mL ± SD)
Tree Marigold
(T. diversifolia, Myanmar, M)
PreWhite3.78 ± 0.0372.3 ± 0.586.4 ± 0.5
PostExtra white3.87 ± 0.030.03 ± 0.050.39 ± 0.18
Coffee
(C. canephora, Vietnam, V)
PreWhite3.94 ± 0.0458.4 ± 1.065.6 ± 0.9
PostExtra white3.94 ± 0.020.18 ± 0.070.40 ± 0.17
Kapok
(C. pentandra, Cambodia, K)
PreExtra light amber3.65 ± 0.1661 ± 3117 ± 4
PostExtra light amber3.77 ± 0.050.7 ± 0.50.73 ± 0.11
Rubber
(H. brasiliensis, China, C)
PreExtra white4.31 ± 0.0288.8 ± 0.3101.4 ± 0.6
PostWater white4.35 ± 0.040.13 ± 0.131.3 ± 0.5
Mixed Floral
(Thailand, T)
PreWhite4.20 ± 0.0275.7 ± 1.990.9 ± 1.9
PostExtra white4.19 ± 0.020.5 ± 0.41.2 ± 0.4
Table 2. Bacterial growth reduction activities of pre- and post-fermentation meads.
SampleE. coliK. pneumoniaeS. aureusM. luteus
Tree Marigold
(T. diversifolia, Myanmar, M)
Pre---
Post--
Coffee
(C. canephora, Vietnam, V)
Pre--
Post--
Kapok
(C. pentandra, Cambodia, K)
Pre---
Post-
Rubber
(H. brasiliensis, China, C)
Pre---
Post--
Mixed Floral
(Thailand, T)
Pre---
Post--
Disclaimer/Publisher’s Note: The statements, opinions and data contained in all publications are solely those of the individual author(s) and contributor(s) and not of MDPI and/or the editor(s). MDPI and/or the editor(s) disclaim responsibility for any injury to people or property resulting from any ideas, methods, instructions or products referred to in the content.

