Article

Characterization of Urease from Providencia sp. LBBE and Its Application in Degrading Urea and Ethyl Carbamate in Rice Wine

Anhui Engineering Laboratory for Industrial Microbiology Molecular Breeding, College of Biological and Food Engineering, Anhui Polytechnic University, Wuhu 241000, China
*
Authors to whom correspondence should be addressed.
These authors contributed equally to this work.
Fermentation 2024, 10(12), 653; https://doi.org/10.3390/fermentation10120653
Submission received: 25 November 2024 / Revised: 7 December 2024 / Accepted: 14 December 2024 / Published: 17 December 2024
(This article belongs to the Special Issue Safety and Quality in Fermented Beverages)

Abstract

Enzymatic degradation of the carcinogen ethyl carbamate (EC) and its precursor urea is a promising method for controlling EC levels in alcoholic beverages. However, limited enzymes with EC-hydrolyzing activity and low ethanol or acid tolerance hinder their practical application. Here, a new urease with urea- and EC-hydrolyzing activities from Providencia sp. LBBE was characterized. The enzyme displayed considerable ethanol tolerance, retaining 42.4% activity after 1 h of incubation with 30% (v/v) ethanol at 37 °C. It exhibited broad pH tolerance (pH 3.0–8.0), with optimal pH 7.0 for EC and 7.5 for urea. After treatment at pH 4.5 and 5.0, it retained 41.3% and 59.4% activity, respectively. The Km and Vmax for EC and urea at pH 4.5 were 515.6 mM, 33.9 µmol/(min⸱mg) and 32.0 mM, 263.6 µmol/(min⸱mg), respectively. Using 6000 U/L purified enzyme at 30 °C for 9 h, 49.8% and 81.6% of urea was removed from rice wine (pH 4.5 and 7.0), respectively. No appreciable reduction in EC was observed under identical conditions, which may be ascribed to the minimal EC affinity. This study contributes to the future realization of the effective control of EC content in alcoholic beverages.

1. Introduction

Ethyl carbamate (Urethane, EC) is a class 2A carcinogen with multi-site carcinogenicity [1]. It is a pervasive contaminant in a variety of fermented foods (soy sauce, vinegar, kimchi, etc.) and alcoholic beverages (brandy, rice wine, sake, etc.) [2]. In rice wine, the mean EC content is 200–300 μg/L, which is considerably higher than that observed in Chinese liquor [2,3]. Given that ethanol has been demonstrated to enhance the carcinogenic effects of EC, the presence of EC raises concerns regarding the safety of long-term consumption of alcoholic beverages [4]. Many countries have established stringent restrictions on the maximum permitted EC content of alcoholic beverages available for sale [3]. Therefore, controlling the EC levels in alcoholic beverages is of great significance for food safety.
The formation of EC in rice wine is primarily attributed to the chemical reaction between urea and ethanol that occurs during the production or storage process [5,6]. Two primary strategies have been adopted to regulate the EC content of rice wine [7,8]. One strategy involves the direct degradation of EC into ammonia, ethanol, and carbon dioxide via the action of urethanase (EC. 3.5.1.75) [9]. However, the limited ethanol and acid tolerance of the identified urethanase precluded their application in the efficient reduction of EC in rice wine [10]. The second strategy is to reduce the EC formation by reducing the precursors (mainly urea). This strategy encompasses the optimization of the wine-making process, the metabolic engineering of yeast to regulate its metabolism, and the degradation of urea by acid urease (EC 3.5.1.5) [8,11,12,13]. The urease degradation method is advantageous for addressing the food safety issue of EC because of the direct and efficient degradation of urea without modifying yeast metabolism or altering the wine-making process. Acid urease from Lactobacillus fermentum and Arthrobacter mobilis SAM 0752 has been employed in commercial applications for urea degradation in alcoholic beverages [14,15]. Additionally, urease from Bacillus paralicheniformis ATCC 9945a (Bp_Urease) has been expressed in Bacillus subtilis, which is generally recognized as safe (GRAS) [16]. Although the use of acid urease can efficiently reduce urea content in alcoholic beverages such as sake and rice wine, it should be noted that urea is not the sole precursor for EC formation [6,17]. Therefore, the use of acid urease only ablates the EC produced by the urea–ethanol reaction pathway. However, it is unable to degrade the EC generated by other precursors.
It has been demonstrated that urease derived from Lactobacillus reuteri CICC6124 (Lr_Urease), B. paralicheniformis ATCC 9945a (Bp_Urease), Providencia rettgeri JNB815 (Pr_Urease), and Bacillus amyloliquefaciens JP-21 (Ba_Urease) can degrade EC [17,18,19,20,21,22]. Despite exhibiting markedly enhanced resistance to acid and ethanol in comparison to the currently identified urethanase, these ureases are constrained by their weak EC affinity and low catalytic efficiency, which impede their direct degradation of EC in rice wine [11,17,19,23]. Consequently, the identification and characterization of novel ureases with high EC-degrading capabilities represent a promising avenue for the control of EC content in rice wine. In our previous work, we employed the genome walking method to obtain a gene cluster (ureDABCEFG, GenBank accession no. MF099656) of urease from Providencia sp. LBBE (Ps_Urease) and expressed the urease in recombinant Escherichia coli [19]. In this study, we further explored the enzymatic properties of urease towards urea and EC. Additionally, the efficiency of the direct degradation of EC and urea in rice wine was evaluated. The findings of this study will provide a foundation for further screening of urease with high EC degradation performance, thus establishing a basis for the future resolution of the problem of the EC content in rice wine.

2. Materials and Methods

2.1. Plasmids, Strains, and Chemical Reagents

The plasmid pRSFDuet-1 and E. coli BL21(DE3) (Novagen, Madison, WI, USA) were used as the vector and host, respectively, for protein expression. The recombinant strain BL21(DE3)/pRSFDuet-Psure-2, which contained the Ps_Urease gene cluster (ureDABCEFG, GenBank no. MF099656) with a strep-tag (WSHPQFEK) added to the amino-terminus of the C-subunit, was constructed as previously described [19]. This strain was used for the heterologous expression of Ps_Urease. Recombinant E. coli was cultivated in lysogeny broth (LB) medium. The Bradford protein assay kit was procured from Sangon Biotech (Shanghai, China), whereas the SDS-PAGE gel preparation kit and standard molecular weight proteins were obtained from Thermo Fisher Scientific (Cleveland, OH, USA). All other chemical reagents were obtained from Sigma-Aldrich (St. Louis, MO, USA).

2.2. Expression and Purification of Recombinant Ps_Urease

Recombinant BL21(DE3)/pRSFDuet-Psure-2 was cultivated in LB broth supplemented with kanamycin at 50 μg/mL. The growth conditions were maintained at 37 °C with shaking at 220 rpm for 12 h (MaxQ 8000, Thermo Fisher Scientific, USA). Thereafter, 1% of the culture was transferred to fresh LB medium and incubated under identical conditions until OD600 reached 0.6. Subsequently, the final concentration of 1 mmol/L NiCl2 and isopropyl-β-d-thiogalactoside (IPTG) were introduced, and the culture was incubated for a further 10 h incubation period at 30 °C and 220 rpm to facilitate protein expression. Following this, the cells were harvested by centrifugation at 4 °C, 8000× g for 10 min (Centrifuge 5910 Ri, Eppendorf AG, Hamburg, Germany) and then resuspended in 50 mM phosphate buffer (PB, pH 7.4). The cells were lysed by ultrasonication (90 W, work 2 s, intervals 3 s, 99 times), and the resulting supernatant was collected by centrifugation at 4 °C and 12,000× g for 30 min. Recombinant Ps_Urease was purified using an affinity chromatography column, StrepTrap HP (Cytiva, Marlborough, MA, USA), and the target protein was subsequently eluted using 2.5 mM desulfurized biotin, as previously described [19]. The eluates were desalted by dialysis and subsequently analyzed by SDS-PAGE. Bradford protein assay kit (Sangon, Shanghai, China) was used to measure the concentration of purified Ps_Urease.

2.3. Urease Activity Determination

The enzyme activity of Ps_Urease towards urea or EC was quantified by measuring the amount of NH3 produced in the reaction. The NH3 concentration was determined by using the Berthelot reaction method [24]. The reaction system comprised a solution of 20 mM citrate–disodium phosphate buffer (pH 4.5) and 3% EC. The “unit of enzyme activity” was defined as the quantity of enzyme necessary to generate 1 and 2 µmol NH3 per minute from the decomposition of EC and urea, respectively.

2.4. Characterization of the Recombinant Ps_Urease

The optimal temperature for recombinant Ps_Urease was determined by measuring the enzyme activity at varying temperatures (20 °C, 30 °C, 40 °C, 45 °C, 50 °C, 55 °C, 60 °C, 70 °C, 80 °C, and 90 °C). To ascertain the thermostability of Ps_Urease, the residual activity of the enzyme that had been incubated at different temperatures (20 °C, 30 °C, 40 °C, 50 °C, 60 °C, 70 °C, 80 °C, and 90 °C) for 1 h was quantified. The optimal pH of Ps_Urease was determined by quantifying enzyme activity at various pH levels (3.0, 3.5, 4.0, 4.5, 5.0, 5.5, 6.0, 6.5, 7.0, 7.5, and 8.0) using 20 mM citrate–phosphate buffer. The pH stability of Ps_Urease was ascertained by assessing the residual enzymatic activity following a 6 h incubation at 4 °C under varying pH conditions (3.0, 4.0, 4.5, 5.0, 6.0, 7.0, and 8.0). The effect of ethanol on Ps_Urease activity was determined by measuring activity in the presence of varying concentrations of ethanol (0–40%, v/v). The residual activity of Ps_Urease was determined after 1 h of incubation at 37 °C with varying concentrations of ethanol to ascertain its stability in ethanol. To ascertain the kinetic parameters of Ps_Urease, the initial reaction rate (V0) of the enzyme was determined at varying concentrations of EC (0.5–80 mM) or urea (0.5–200 mM). Subsequently, the values of Vmax and Km were generated by fitting the Michaelis–Menten curve using GraphPad Prism 10 software (GraphPad Software, San Diego, CA, USA).

2.5. Elimination of Urea and EC from Rice Wine

The pH of the rice wine sample, which contained 10% (v/v) ethanol and had a pH of 4.5, was adjusted to 7.0. Subsequently, 6000 U/L of purified Ps_Urease was introduced into the rice wine samples with pH values of 4.5 and 7.0, and the reaction was conducted at 30 °C for 18 h. Samples were collected at 3 h intervals and used to determine the concentrations of urea and EC. The concentration of urea was determined through the diacetyl monoxime reaction [25], whereas EC levels were assessed using gas chromatography-mass spectroscopy (GC-MS) by GCMS-QP2010 ultra (Shimadzu, Kyoto, Japan), as previously described [26].

2.6. Bioinformatic Analysis

Multiple sequence alignment was performed using the Clustal Omega web server (https://www.ebi.ac.uk/jdispatcher/msa/clustalo, accessed on 24 November 2024). The sequences of the C subunit of the bifunctional urease derived from Lactobacillus reuteri CICC6124 (Lr_UreC, GenBank no. EDX42993.1), Bacillus paralicheniformis ATCC 9945a (Bp_UreC, GenBank No. AGN36402.1), Providencia rettgeri JNB815 (Pr_UreC, GenBank no. AKR75466.1), and Providencia sp. LBBE (Ps_UreC, GenBank No. ASM56437.1) were employed to conduct the alignment. The ESPript 3.0 web server [27] (https://espript.ibcp.fr/ESPript/ESPript/, accessed on 24 November 2024) was used to predict the secondary structure of UreC, with the structure of UreC from Klebsiella aerogenes (PDB no. 1FWJ) serving as the template. A neighbor-joining phylogenetic tree was constructed using MEGA 11 software with 100 bootstrap replicates.

2.7. Statistical Analysis

To guarantee the veracity and consistency of the data and to facilitate statistical analysis, all experiments were independently conducted in triplicate. The experimental results were subjected to statistical evaluation using a two-way analysis of variance (ANOVA), followed by Tukey’s test. These analyses were conducted using the GraphPad Prism 10 software (GraphPad Software, San Diego, CA, USA). Results were considered statistically significant at p < 0.05.

3. Results and Discussion

3.1. Analysis of the Gene Cluster and Structural Subunit of Ps_Urease

Bacterial urease is a nickel- or iron-containing metalloenzyme, the majority of which consists of three structural subunits (UreA, UreB, UreC), and four accessory proteins (UreE, UreF, UreG, and UreD/UreH) [28,29]. The active center of urease, which contains two metal ions, is located within the largest structural subunit (UreC) [30,31]. The activation of bacterial ureases typically requires the involvement of at least four accessory proteins, namely UreE, UreF, UreG, and UreD/UreH [28,30]. This process involves the transfer of metal ions into the active center of the apoenzyme. In our previous study, we successfully identified the Ps_Urease gene cluster (ureDABCEFG) and submitted the data to the NCBI database (GenBank accession no. MF099656) [19]. The Ps_Urease gene cluster consists of three structural genes (ureA, ureB, and ureC) and four accessory genes (ureE, ureF, ureG, and ureD) (Figure 1A). Compared to the other four bifunctional ureases, which exhibit both urea- and EC-degrading activities, all contain three structural genes (Figure 1A). However, there is considerable variation in accessory genes and their respective orders of occurrence within gene clusters. In the Ps_Urease gene cluster, ureD is situated proximal to the structural genes ureA, ureB, and ureC (Figure 1A). Moreover, a comparative analysis of the structural subunits was conducted. Multiple sequence alignment of the structural subunit of UreC revealed that all four ureases had highly conserved nickel-binding ligands, specifically His134, His136, Lys217, His246, and His272, as observed in Ps_UreC [30] (Figure 1B). The residues pivotal for urea binding (His219 in Ps_UreC) and important for catalysis (Cys319, His320, and Arg336 in Ps_UreC) are also highly conserved [32] (Figure 1B). Phylogenetic tree analysis of Ps_UreC, in conjunction with the UreC from the three bifunctional ureases (Ps_Urease, Lr_Urease, and Bp_Urease), revealed that they are situated in the same branch. However, Ps_UreC exhibited a relatively distant evolutionary relationship with the other three ureases (Figure 2). It is hypothesized that all other ureases in the same evolutionary branch as the aforementioned four ureases may have EC-degrading activity. This suggests a potential avenue for the future screening of ureases with enhanced EC-degrading capabilities [33].

3.2. Heterologous Expression and Purification of Recombinant Ps_Urease

Recombinant E. coli-producing Ps_Urease was constructed as described in our previous study. After the fermentation of recombinant E. coli in LB medium, the activity of the recombinant Ps_Urease crude enzyme solution was determined to be 4.5 and 9.3 U/mL for urea and 0.33 and 0.74 U/mL for EC at pH 4.5 and 7.0, respectively (Figure S1A). The results demonstrated that Ps_Urease exhibited hydrolytic activity towards EC, representing the fifth urease identified to date that displays both EC- and urea-hydrolyzing activities. Subsequently, the crude enzyme was purified using StrepTrap HP affinity columns. SDS-PAGE analysis demonstrated that the purified sample exhibited three protein bands at approximately 8, 10, and 62 kDa, which corresponded to UreA, UreB, and UreC, respectively (Figure S1B). This result indicated that purification of Ps_Urease was successfully achieved.

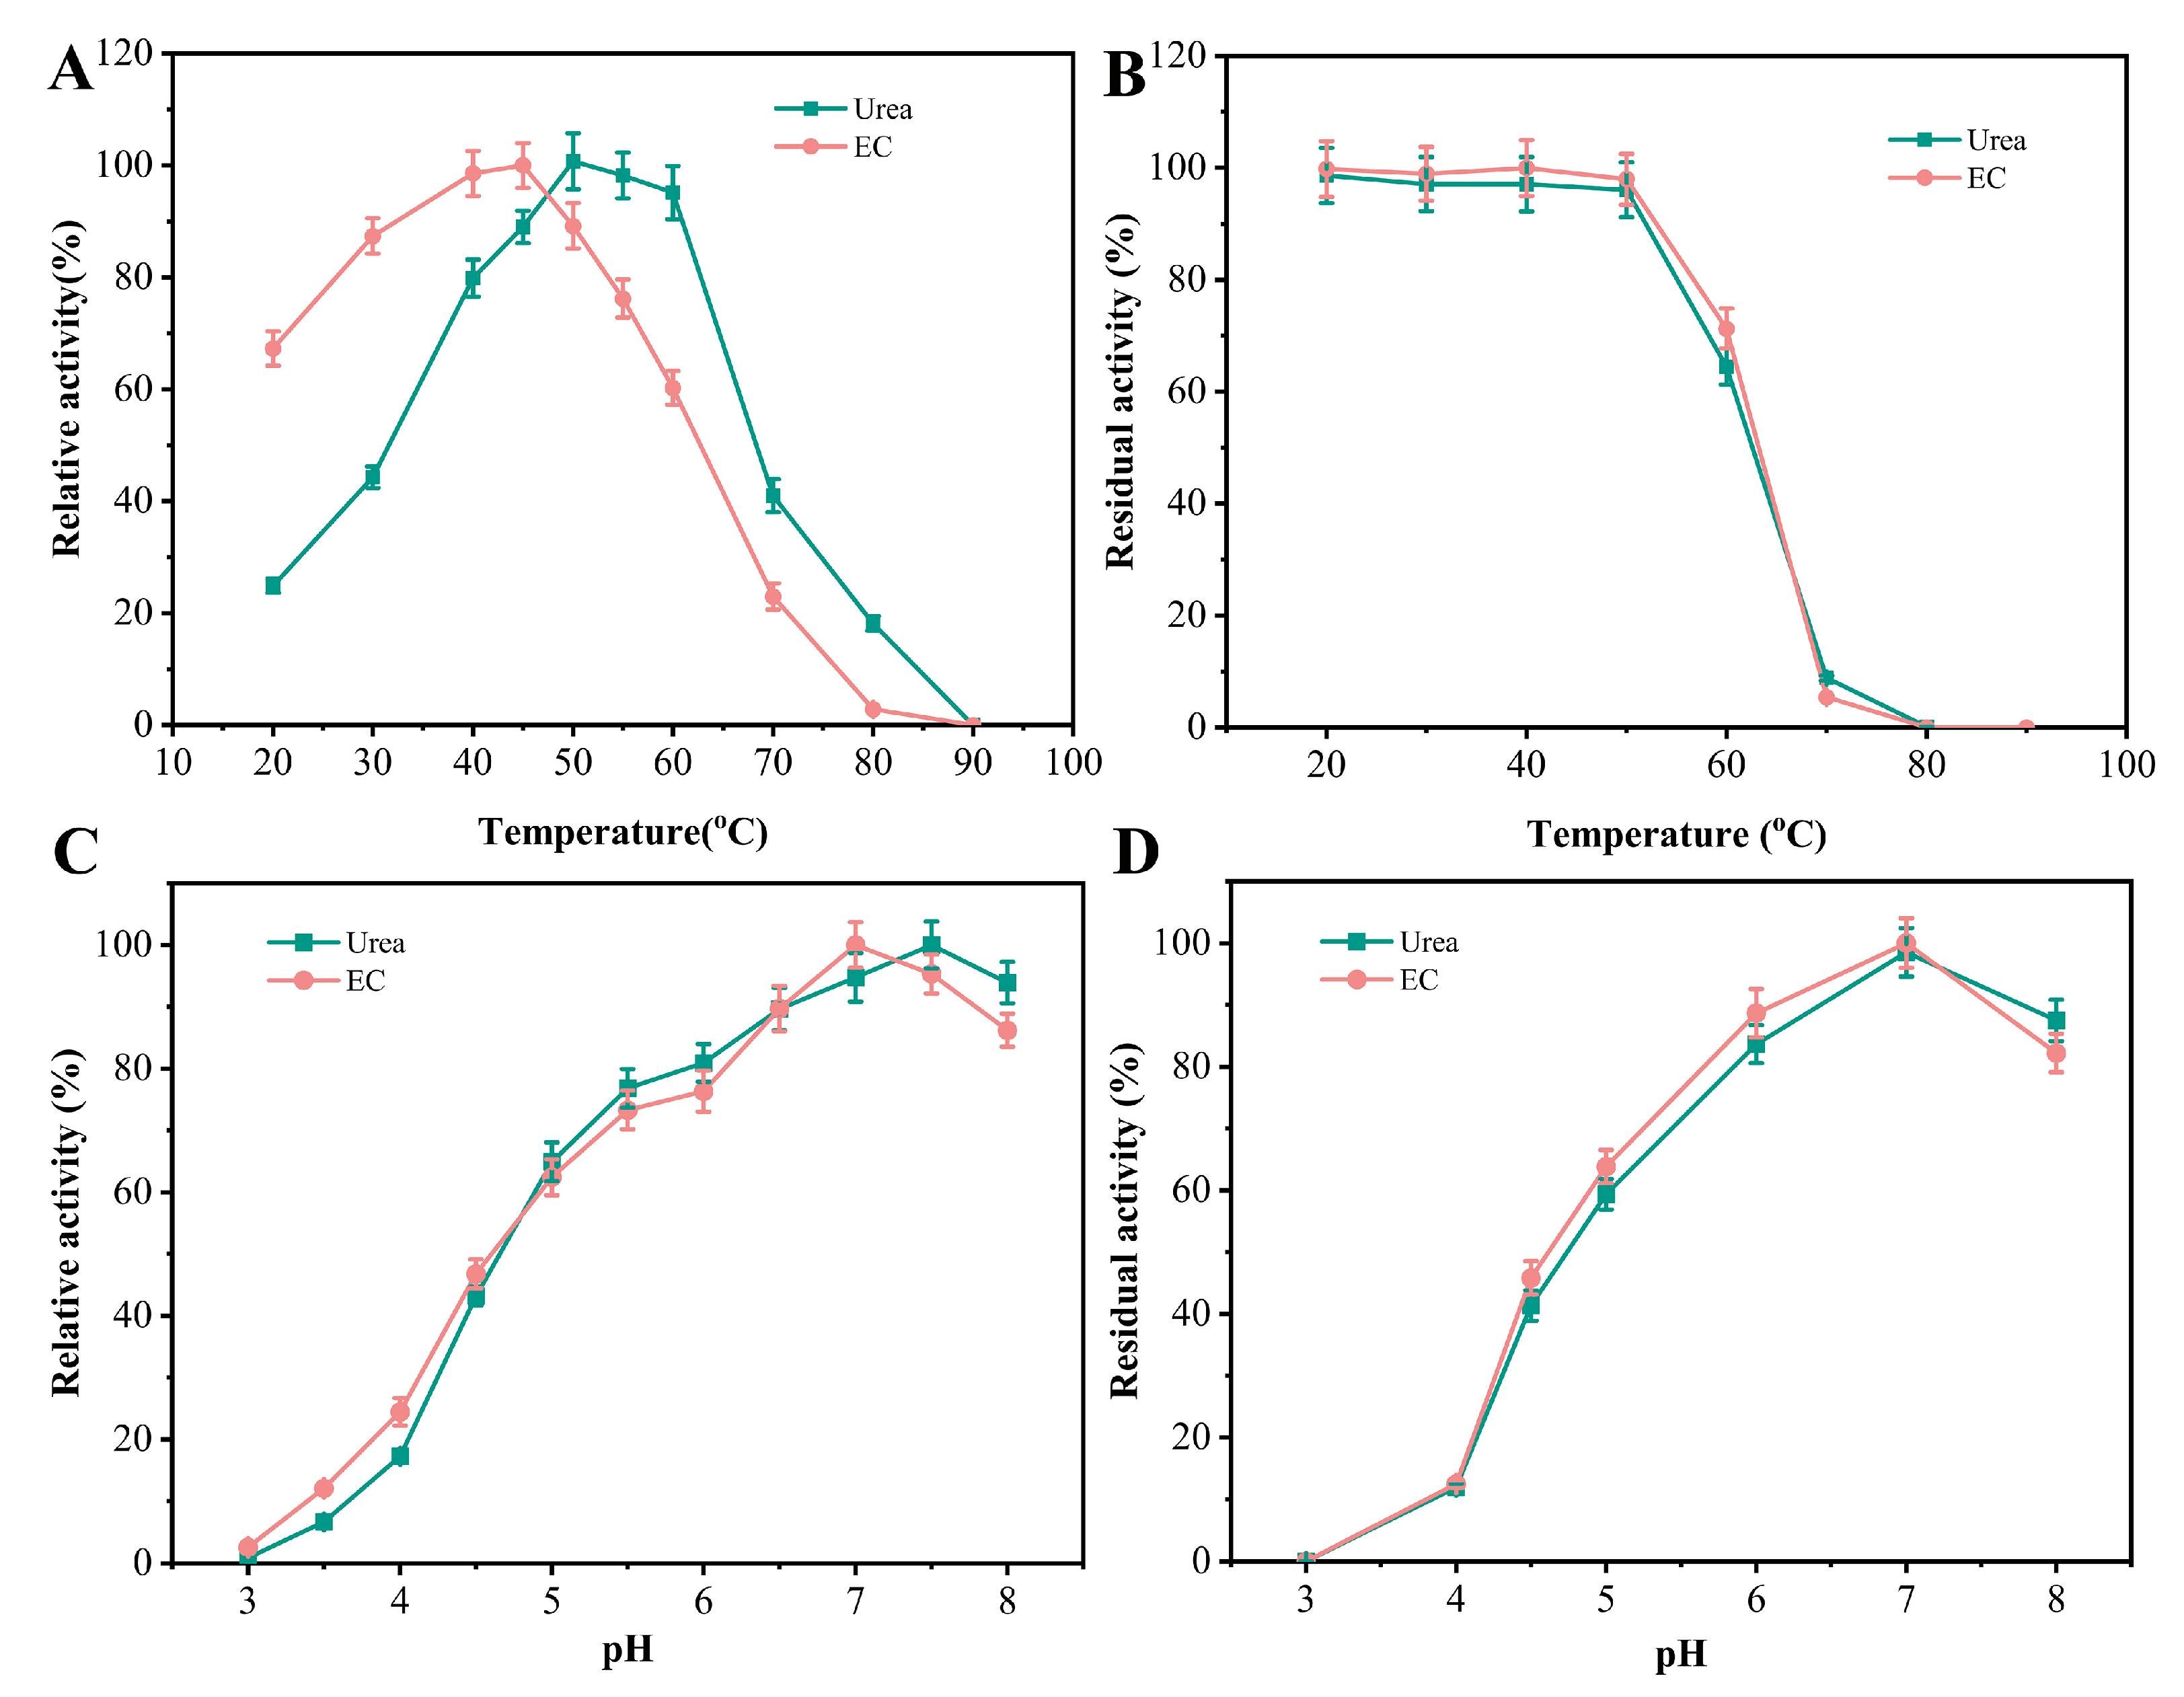
3.3. Effects of Temperature on the Activity and Stability of Ps_Urease

The enzyme activity of Ps_Urease was quantified at temperatures arranged from 20 °C to 90 °C, with the highest observed activity representing 100%. The highest activity of Ps_Urease towards EC or urea was observed at 45 and 50 °C, respectively (Figure 3A). The residual enzyme activity of Ps_Urease was quantified following a 1 h heating period at temperatures between 20 and 90 °C. These findings indicated that the enzyme retained at least 95% of its initial activity when subjected to temperatures below or equal to 50 °C (Figure 3B). Following treatment at 60 °C, the enzyme retained approximately 65% of its initial activity. The residual activity exhibited a significant decrease when exposed to temperatures exceeding 60 °C, indicating a rapid decline in its stability (Figure 3B). This result demonstrated that Ps_Urease displayed robust thermal stability at temperatures below 50 °C, suggesting its potential use in the degradation of urea and EC in finished alcoholic beverages.

3.4. Effects of pH on the Activity and Stability of Ps_Urease

The activity of Ps_Urease was determined at various pH levels (3.0 to 8.0), with the highest observed activity taken as 100%. The results demonstrated that the enzyme was active against both urea and EC within the pH range of 3.5–8.0 (Figure 3C). The utilization of EC as the substrate demonstrated that Ps_Urease exhibited the highest activity at pH 7.0, while retaining approximately 24.5–48.4% of its maximum activity within the pH 4.0–5.0 range (Figure 3C). When urea was employed as the substrate, Ps_Urease exhibited its maximum activity at pH 7.5, while maintaining approximately 17.3–64.9% of its maximum activity in the pH range of 4.0–5.0 (Figure 3C). Ps_Urease was incubated at pH 3.0–8.0 for 6 h at 4 °C and its residual activity was subsequently determined. The results revealed that the enzyme exhibited stability within the pH range of 6.0–8.0, retaining over 80% of its initial activity (Figure 3D). Furthermore, following treatment at pH 4.5 and 5.0, the enzyme retained activities of approximately 41.3% and 59.4%, respectively (Figure 3D). In accordance with the findings observed for the other four bifunctional ureases, Ps_Urease demonstrated catalytic viability for both EC and urea within the pH range of 4.0–5.0 [17,18,19,20,21,22]. However, the optimum pH for enzyme activity towards EC and urea was observed to be relatively high in comparison to the other four enzymes, which may present a challenge for its application under acidic conditions (Table S1). Additionally, the enzyme’s capacity to exert catalytic activity at pH < 5.0 renders it more effective than the identified urethanase, for which most of them demonstrated no catalytic activity at pH < 5.0 [10]. Regarding pH stability, the enzyme demonstrated consistent performance at pH 5.0, which was comparable to that of Bp_Urease [19]. However, owing to discrepancies in the assay methodology, a direct comparison with the other enzymes was not feasible (Table S1). These findings indicated that Ps_Urease displays a certain degree of stability under acidic conditions. Consequently, Ps_Urease may be employed for direct degradation of urea and EC in weakly acidic and neutral traditional fermented foods and alcoholic beverages.

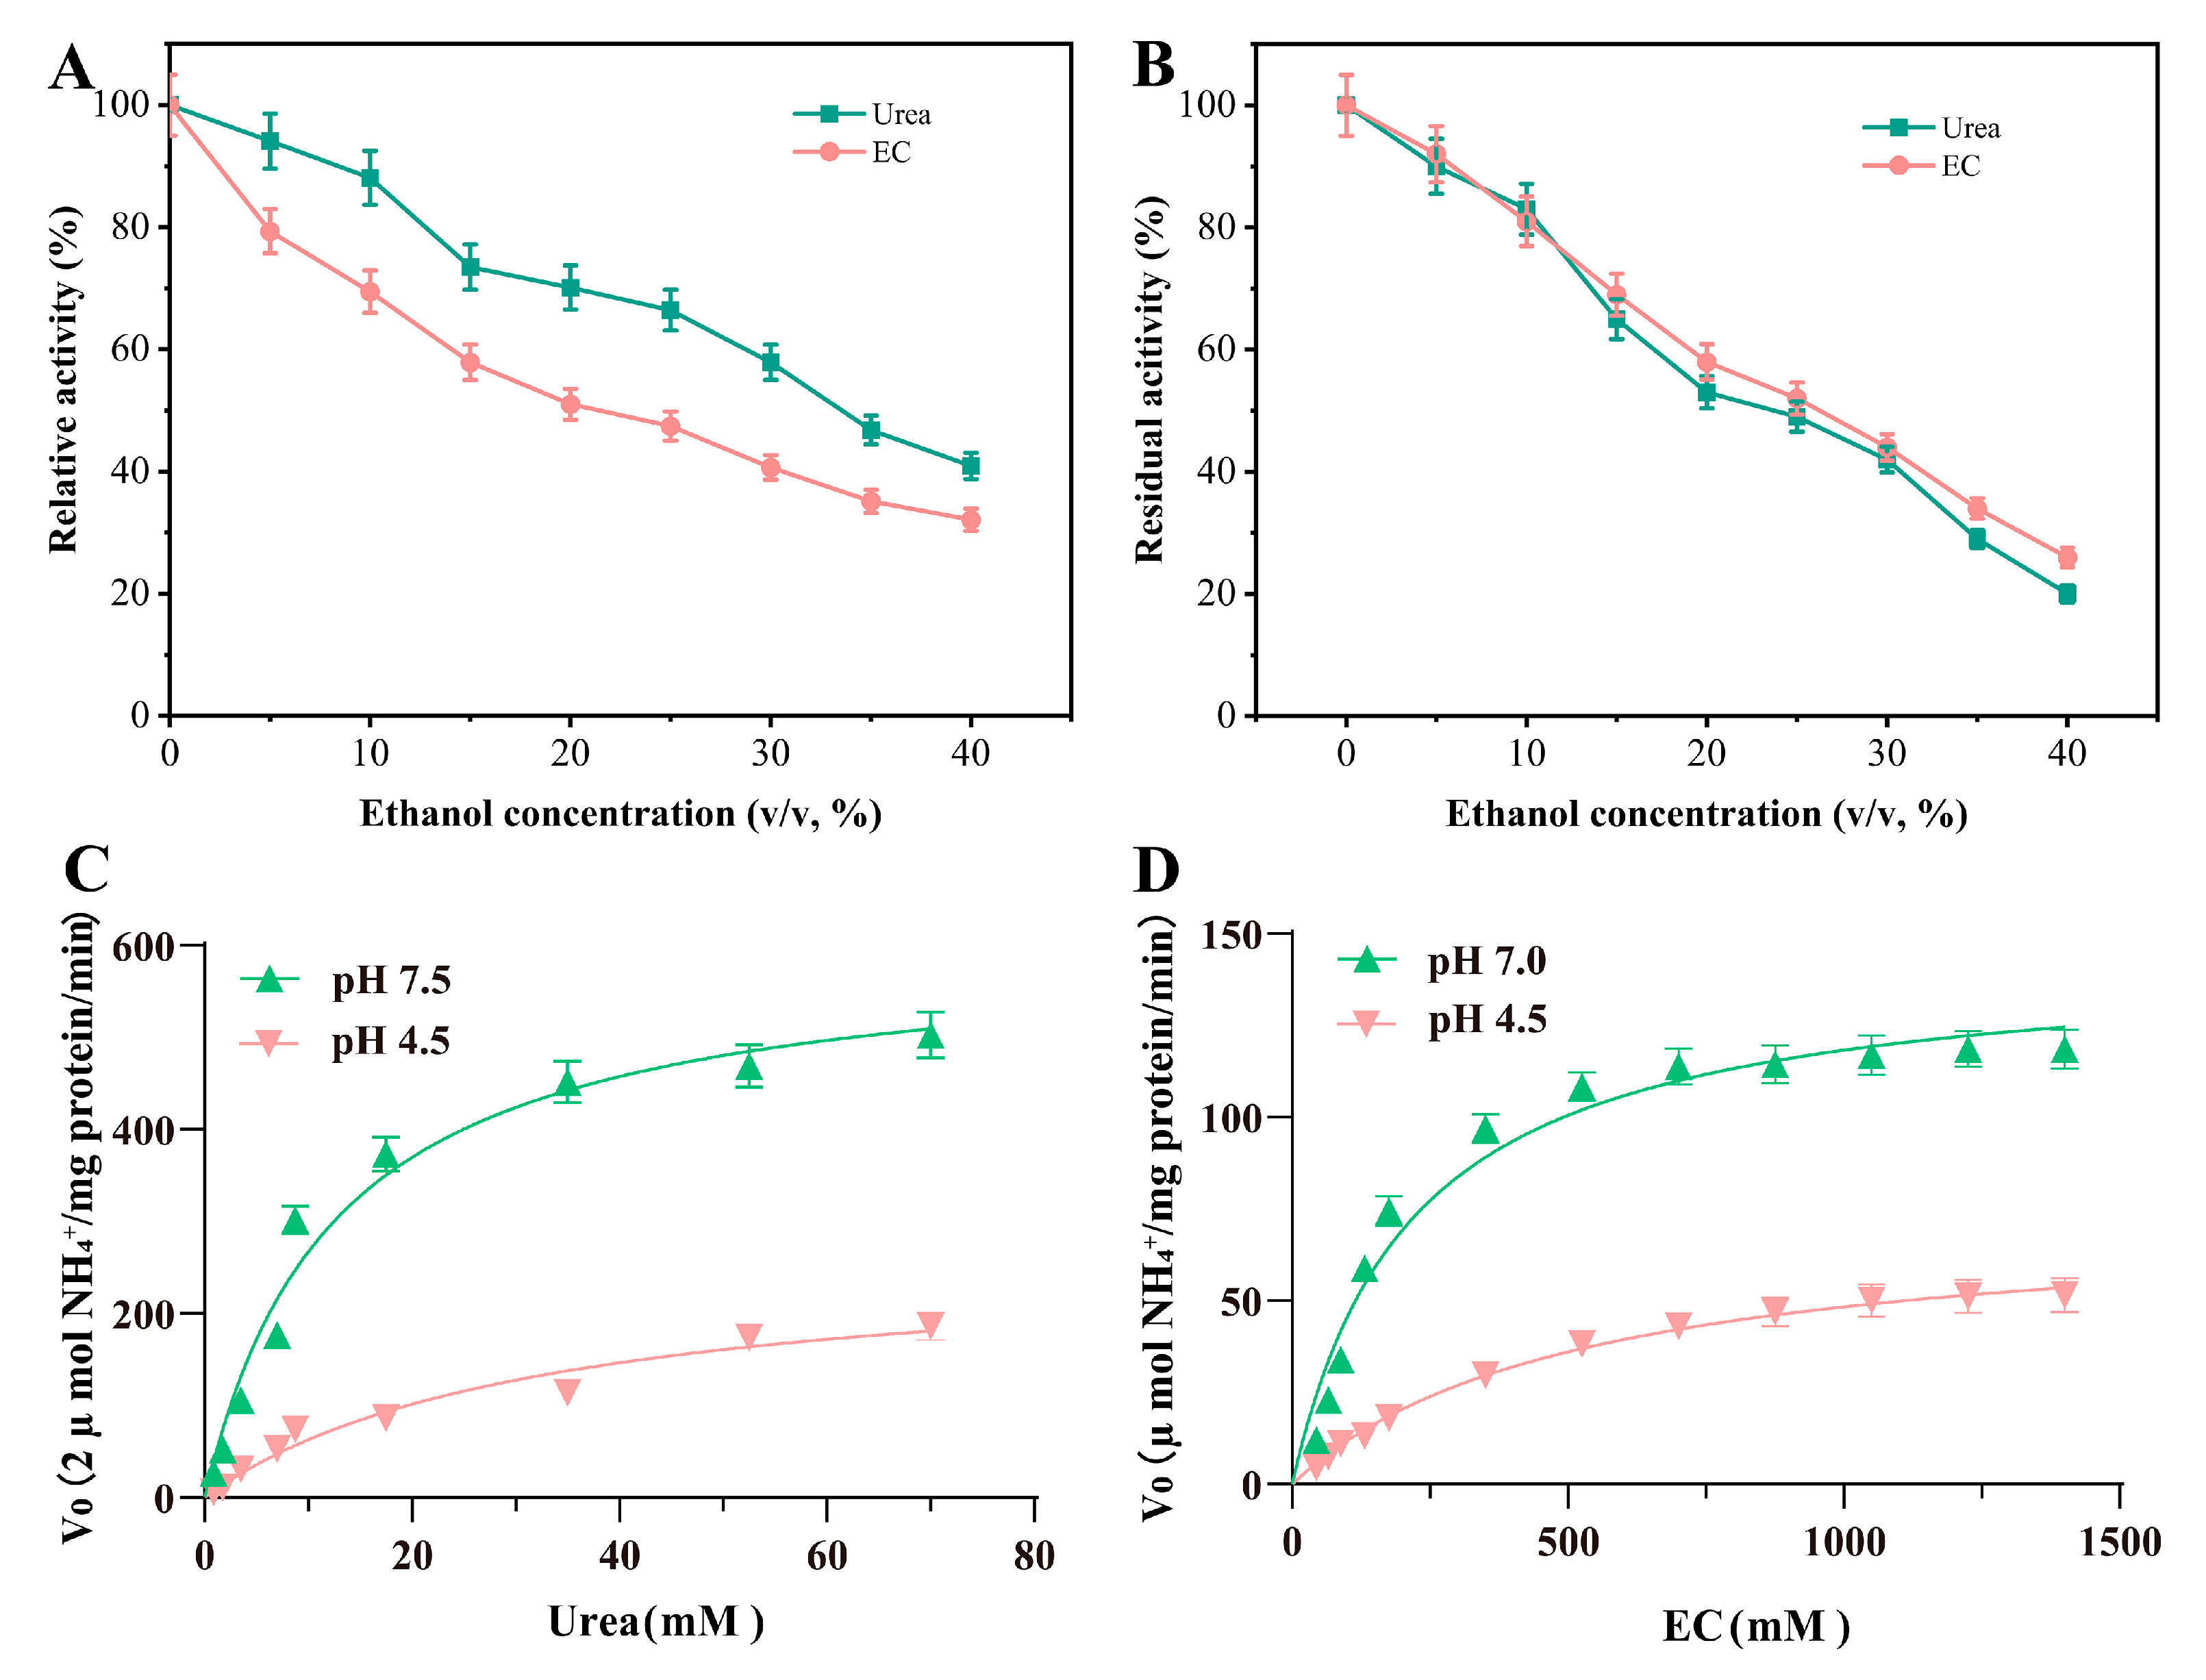
3.5. Effects of Ethanol Concentration on the Activity and Stability of Ps_Urease

The effect of ethanol concentration on the activity of Ps_Urease was assessed by quantifying its activity in the presence of varying ethanol concentrations (0–40%, v/v). The findings demonstrated that Ps_Urease exhibited approximately 69.5%, 58.0%, 51.01%, and 40.7% of its activity towards EC in solutions containing 10%, 15%, 20%, and 30% (v/v) ethanol, respectively (Figure 4A). When urea was employed as the substrate, Ps_Urease exhibited approximately 88.1%, 76.2%, 70.1%, and 57.9% activity in solutions containing 10%, 15%, 20%, and 30% (v/v) ethanol, respectively (Figure 4A). These findings indicated that Ps_Urease displayed relatively high activity for both ethanol and urea in the presence of ethanol (0–30%, v/v). Additionally, the enzyme appeared to be more susceptible to ethanol for urea degradation than EC, which was in accordance with the corresponding results for Bp_Urease and Lr_Urease [17,19]. Furthermore, the impact of 15% (v/v) ethanol on the activity of Ps_Urease was identical to that observed with Lr_Urease and Bp_Urease, for which all three enzymes exhibited approximately 60% activity (Table S1) [17,19]. To assess the impact of ethanol on the stability of Ps_Urease, the residual activity was quantified after heating the enzyme at 37 °C for 1 h in the presence of varying concentrations of ethanol. The results revealed that Ps_Urease retained 83.4%, 64.6%, 53.0%, and 42.4% of its initial activity in both EC and urea following treatment with 10%, 15%, 20%, and 30% (v/v) ethanol, respectively (Figure 4B). Due to inconsistencies in the methodology employed for the ethanol stability assay, a direct comparison with the other enzymes was not feasible (Table S1). These findings indicate that Ps_Urease exhibits tolerance to ethanol concentrations (0–30%, v/v) and demonstrates the potential for application in the degradation of urea and EC in alcoholic beverages.

3.6. Kinetic Parameters of Recombinant Ps_Urease

The initial reaction rate (V0) and the corresponding EC and urea concentrations were subjected to Michaelis–Menten curve fitting to obtain the kinetic parameters of Ps_Urease (Figure 4C,D). The results demonstrated that the Km and Vmax of the enzyme for EC at pH 7.0 and pH 4.5 were 214.7 mM and 71.8 µmol/(min⸱mg) and 515.6 mM and 33.9 µmol/(min⸱mg), respectively (Table 1), while the Km and Vmax values towards urea at pH 7.5 and pH 4.5 were found to be 12.5 mM and 600.2 µmol/(min⸱mg) and 32.0 mM and 263.6 µmol/(min⸱mg), respectively (Table 1). The affinity and Vmax of Ps_Urease for urea were markedly higher than those of EC, which is consistent with the findings of Bp_Urease [19]. However, under acidic conditions, Ps_Urease exhibits a much higher EC affinity than Bp_Urease, with the latter displaying a Km of 1018 mM at pH 4.5 (Table S1) [19]. Nevertheless, in comparison to Lr_Urease, Ps_Urease displays a diminished substrate affinity for both EC and urea at pH 4.5 (Table S1). Consequently, the utilization of Ps_Urease is likely to be less effective than that of Lr_Urease for the degradation of EC and urea in fermented foods and alcoholic beverages at pH 4.5 (Table S1).

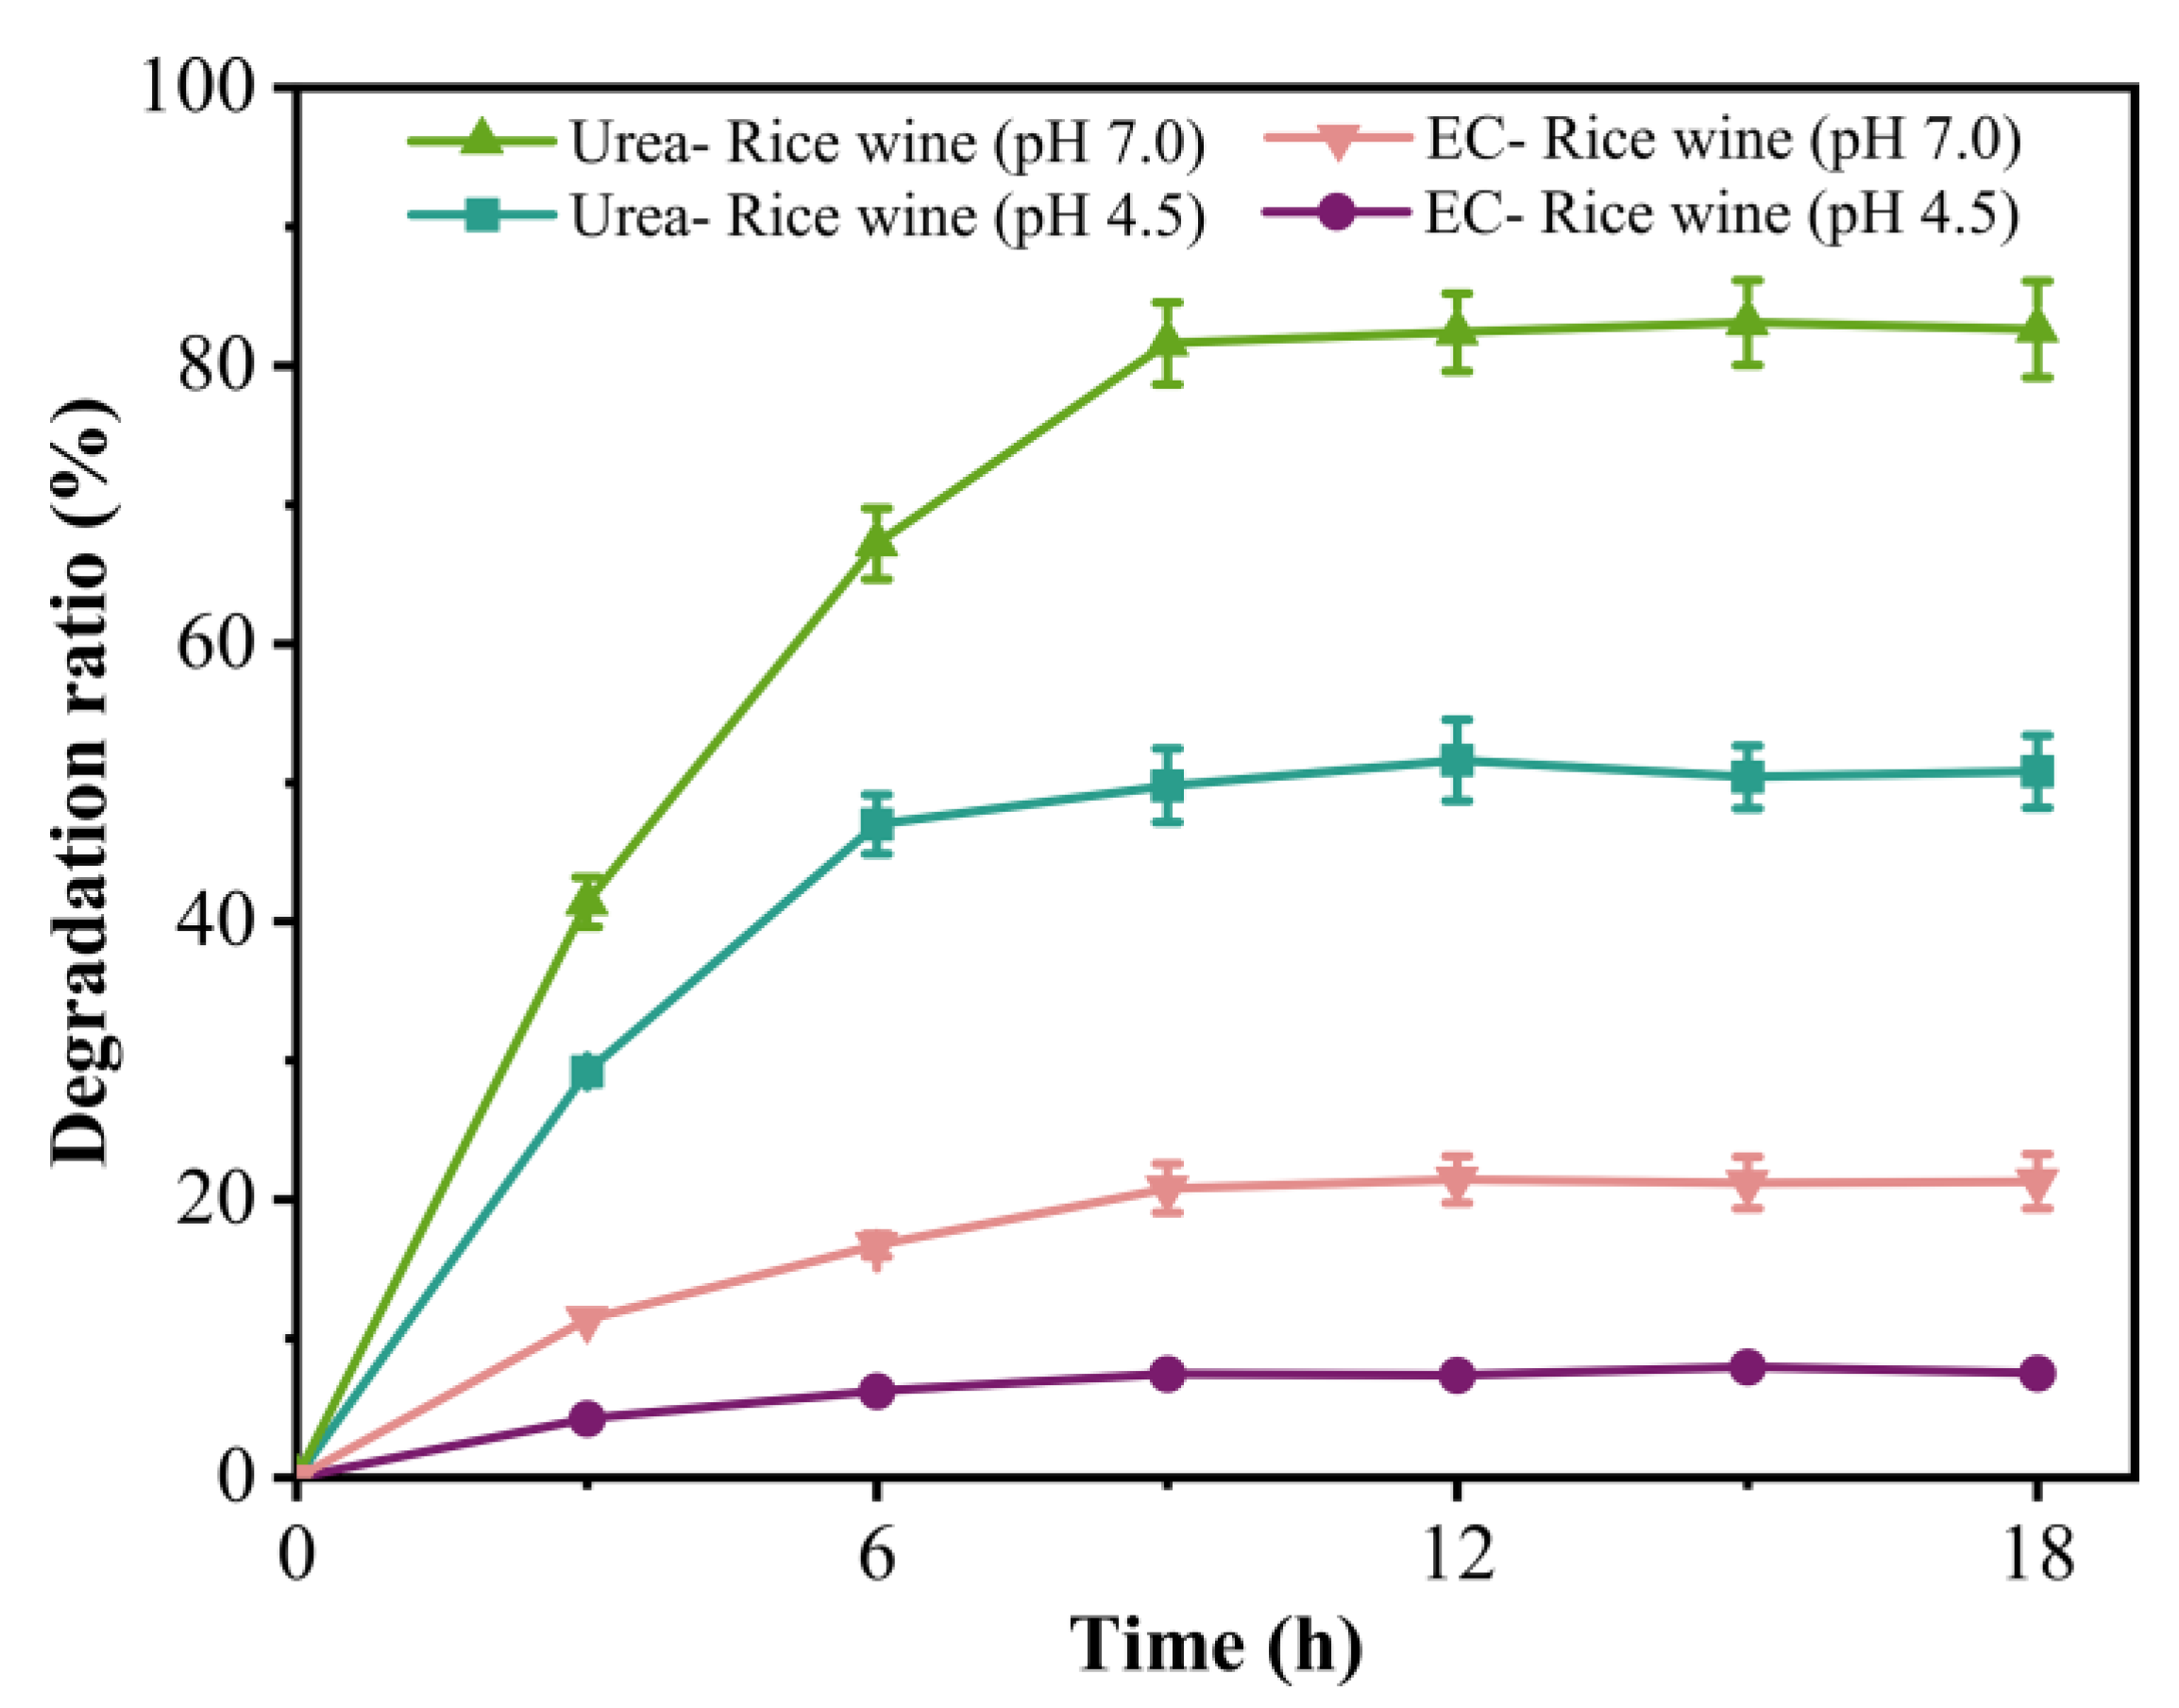
3.7. Evaluation of the Efficiency of Ps_Urease in Degrading Urea and EC from Rice Wine

Purified Ps_Urease was introduced into the rice wine samples at a final concentration of 6000 U/L, and the reaction was conducted at 30 °C for 18 h. The results demonstrated that Ps_Urease degraded 49.8% of the urea in the rice wine samples (pH 4.5) after a 6 h reaction period (Figure 5). As the reaction time increased, the degradation rate remained constant. Ps_Urease did not exhibit any significant degradation of EC in a rice wine sample (pH 4.5), which was likely attributable to its weak affinity and low activity for EC [13]. After adjusting the pH of the rice wine sample to 7.0, Ps_Urease degraded approximately 81.6% and 20.8% of the urea and EC, respectively, after 9 h of reaction (Figure 5). The degradation rates of urea and EC remained unaltered with increasing reaction time. This may be attributed to the enzyme’s insufficient activity to catalyze the decomposition of the remaining urea and EC over time, or to its low affinity for urea and EC under certain conditions, resulting in its inability to bind to the residual urea and EC [33]. A comparison of the degradation ratios of Ps_Urease on urea and EC at pH 4.5 and 7.0 conditions indicated that the reduced affinity and stability of the enzyme in acidic environments might have contributed to the observed reduction in degradation rates for both urea and EC [13]. These results suggest that Ps_Urease is more effective for the degradation of urea and EC in neutral fermented foods and alcoholic beverages. However, alcoholic beverages and fermented foods are generally acidic, which hinders its practical application. Moreover, the four bifunctional acid ureases that were identified have been demonstrated to be highly efficacious in the removal of urea from rice wine, with the capacity to remove 95.8 of the urea (as evidenced by Lr_Urease, as detailed in Table S1). However, none of the aforementioned enzymes has been demonstrated to be effective in the degradation of EC in rice wine (Table S1). This might be ascribed to the low EC affinity and catalytic efficiency of urease under acidic conditions (pH 4.5). In the future, the enzyme could be engineered to improve its stability, affinity, and catalytic efficiency under acidic conditions, thereby facilitating its utilization in acidic fermented foods and alcoholic beverages [34,35]. Alternatively, bifunctional acid urease with high acid tolerance, excellent EC affinity, and catalytic efficiency can be mined from existing protein databases based on the information provided in this study to address the challenges of urea and EC degradation in acidic fermented foods [33,36].

4. Conclusions

In this study, a new bifunctional urease with urea- and EC-hydrolyzing activities from Providencia sp. LBBE was heterologous expressed and characterized. The enzyme demonstrated acid tolerance, exhibiting catalytic activity for both EC and urea at pH levels between 3.0 and 8.0. Following treatment at pH 4.5 and 5.0, the enzyme retained approximately 41.3 and 59.4% of its initial activity, respectively. This enzyme demonstrated robust ethanol tolerance. It exhibited 40.7% and 57.9% activity towards EC and urea, respectively, in the presence of 30% (v/v) ethanol. Moreover, it retained 42.4% of its initial activity after heating in a 30% (v/v) ethanol solution at 37 °C for 1 h. The Km and Vmax of the enzyme for EC and urea at pH 4.5 were determined to be 515.6 mM and 33.9 µmol/(min⸱mg) and 32.0 mM and 263.6 µmol/(min⸱mg), respectively. The enzyme demonstrated notable degradation of urea in rice wine (pH 4.5) with a 49.8% reduction observed. However, the enzyme exhibited minimal degradation of EC, potentially because of the inherent instability of the enzyme under acidic conditions and its relatively low affinity for EC. The results of this study provide a foundation for the further screening of urease, which exhibits remarkable stability, excellent EC affinity, and catalytic activity under acidic conditions. Additionally, this study contributes to ongoing efforts to address the degradation challenges of urea and EC in acidic alcoholic beverages.

Supplementary Materials

The following supporting information can be downloaded at https://www.mdpi.com/article/10.3390/fermentation10120653/s1. Figure S1: heterologous expression and purification of recombinant Ps_Urease. (A) Crude enzyme activity of Ps_Urease towards EC and urea and (B) SDS-PAGE analysis of recombinant Ps_Urease samples. M: protein molecular weight standard. Line 1: cell lysis supernatant. Line 2: cell lysis precipitation. Line 3: purified Ps_Urease. Table S1: enzymatic properties of bifunctional urease.

Author Contributions

H.W.: investigation, data curation, formal analysis. D.L.: methodology, investigation, software, funding acquisition. S.Z.: visualization, software. S.G.: visualization. J.D.: resources. C.W.: writing—review and editing, methodology. Q.L.: writing—original draft, conceptualization, supervision, funding acquisition. All authors have read and agreed to the published version of the manuscript.

Funding

This work was financially supported by the Key Research Projects of Natural Science in Colleges and Universities in the Anhui Province (No. KJ2021A0510), The Scientific Research Foundation of the Higher Education Institutions of Anhui Province (No. 2023AH050906), and The Research Project of Anhui Polytechnic University (No. 2021YQQ044, No. Z42022160).

Institutional Review Board Statement

Not applicable.

Informed Consent Statement

Not applicable.

Data Availability Statement

Data will be made available on request.

Conflicts of Interest

The authors declare no conflicts of interest.

Abbreviations

EC: ethyl carbamate; Ps_Urease: urease from Providencia sp. LBBE; Bp_Urease: urease from B. paralicheniformis ATCC 9945a; Lr_Urease: urease from L. reuteri CICC6124; Pr_Urease: urease from P. rettgeri JNB815; Ba_Urease: urease from B. amyloliquefaciens JP-21; Ps_UreC: C subunit of Ps_Urease; Bp_UreC: C subunit of Bp_Urease; Lr_UreC: C subunit of Lr_Urease; Pr_UreC: C subunit of Pr_Urease.

References

  1. Chen, D.; Ren, Y.; Zhong, Q.; Shao, Y.; Zhao, Y.-F.; Wu, Y. Ethyl carbamate in alcoholic beverages from China: Levels, dietary intake, and risk assessment. Food Control 2017, 72, 283–288. [Google Scholar] [CrossRef]
  2. Gowd, V.; Su, H.; Karlovsky, P.; Chen, W. Ethyl carbamate: An emerging food and environmental toxicant. Food Chem. 2018, 248, 312–321. [Google Scholar] [CrossRef] [PubMed]
  3. Wang, C.; Wang, M.; Zhang, M.P. Ethyl carbamate in Chinese liquor (Baijiu): Presence, analysis, formation, and control. Appl. Microbiol. Biotechnol. 2021, 105, 4383–4395. [Google Scholar] [CrossRef] [PubMed]
  4. Lachenmeier, D.W.; Lima, M.C.; Nóbrega, I.C.; Pereira, J.A.; Kerr-Corrêa, F.; Kanteres, F.; Rehm, J. Cancer risk assessment of ethyl carbamate in alcoholic beverages from Brazil with special consideration to the spirits cachaça and tiquira. BMC Cancer 2010, 10, 266. [Google Scholar] [CrossRef] [PubMed]
  5. Mao, X.; Yue, S.J.; Xu, D.Q.; Fu, R.J.; Han, J.Z.; Zhou, H.M.; Tang, Y.P. Research progress on flavor and quality of Chinese rice wine in the brewing process. ACS Omega 2023, 8, 32311–32330. [Google Scholar] [CrossRef]
  6. Wu, P.; Cai, C.; Shen, X.; Wang, L.; Zhang, J.; Tan, Y.; Jiang, W.; Pan, X. Formation of ethyl carbamate and changes during fermentation and storage of yellow rice wine. Food Chem. 2014, 152, 108–112. [Google Scholar] [CrossRef]
  7. Xu, X.; Li, T.; Ji, Y.; Jiang, X.; Shi, X.; Wang, B. Origin, succession, and control of biotoxin in Wine. Front. Microbiol. 2021, 12, 703391. [Google Scholar] [CrossRef]
  8. Li, M.; Jia, W. Formation and hazard of ethyl carbamate and construction of genetically engineered Saccharomyces cerevisiae strains in Huangjiu (Chinese grain wine). Compr. Rev. Food Sci. Food Saf. 2024, 23, e13321. [Google Scholar] [CrossRef]
  9. Kang, T.; Lin, J.; Yang, L.; Wu, M. Expression, isolation, and identification of an ethanol-resistant ethyl carbamate-degrading amidase from Agrobacterium tumefaciens d(3). J. Biosci. Bioeng. 2021, 132, 220–225. [Google Scholar] [CrossRef]
  10. Masaki, K. Features and application potential of microbial urethanases. Appl. Microbiol. Biotechnol. 2022, 106, 3431–3438. [Google Scholar] [CrossRef]
  11. Liu, Q.; Kang, Z.; Du, G. Advances in microbial enzymatic elimination of ethyl carbamate in Chinese rice wine. Chin. J. Biotech. 2019, 35, 567–576. [Google Scholar] [CrossRef]
  12. Jung, J.Y.; Kang, M.J.; Hwang, H.S.; Baek, K.R.; Seo, S.O. Reduction of ethyl carbamate in an alcoholic beverage by CRISPR/Cas9-based genome editing of the wild yeast. Foods 2022, 12, 102. [Google Scholar] [CrossRef] [PubMed]
  13. Liu, Q.; Yao, X.; Liang, Q.; Li, J.; Fang, F.; Du, G.; Kang, Z. Molecular engineering of Bacillus paralicheniformis acid urease to degrade urea and ethyl carbamate in model Chinese rice wine. J. Agric. Food Chem. 2018, 66, 13011–13019. [Google Scholar] [CrossRef] [PubMed]
  14. Kakimoto, S.; Sumino, Y.; Kawahara, K.; Yamazaki, E.; Nakatsui, I. Purification and characterization of acid urease from Lactobacillus fermentum. Appl. Microbiol. Biotechnol. 1990, 32, 538–543. [Google Scholar] [CrossRef]
  15. Miyagawa, K.; Sumida, M.; Nakao, M.; Harada, M.; Yamamoto, H.; Kusumi, T.; Yoshizawa, K.; Amachi, T.; Nakayama, T. Purification, characterization, and application of an acid urease from Arthrobacter mobilis. J. Biotechnol. 1999, 68, 227–236. [Google Scholar] [CrossRef]
  16. Liu, Q.; Jin, X.; Fang, F.; Li, J.; Du, G.; Kang, Z. Food-grade expression of an iron-containing acid urease in Bacillus subtilis. J. Biotechnol. 2019, 293, 66–71. [Google Scholar] [CrossRef]
  17. Yang, Y.; Kang, Z.; Zhou, J.; Chen, J.; Du, G. High-level expression and characterization of recombinant acid urease for enzymatic degradation of urea in rice wine. Appl. Microbiol. Biotechnol. 2015, 99, 301–308. [Google Scholar] [CrossRef]
  18. Zhou, J.; Kang, Z.; Liu, Q.; Du, G.; Chen, J. Degradation of urea and ethyl carbamate in Chinese rice wine by recombinant acid urease. Chin. J. Biotech. 2016, 32, 74–83. [Google Scholar] [CrossRef]
  19. Liu, Q.; Chen, Y.; Yuan, M.; Du, G.; Chen, J.; Kang, Z. A Bacillus paralicheniformis iron-containing urease reduces urea concentrations in rice wine. Appl. Environ. Microbiol. 2017, 83, e01258-17. [Google Scholar] [CrossRef]
  20. Liu, X.; Zhang, Q.; Zhou, N.; Tian, Y. Expression of an acid urease with urethanase activity in E. coli and analysis of urease gene. Mol. Biotechnol. 2017, 59, 84–97. [Google Scholar] [CrossRef]
  21. Yang, L.; Liu, X.; Zhou, N.; Tian, Y. Characteristics of refold acid urease immobilized covalently by graphene oxide-chitosan composite beads. J. Biosci. Bioeng. 2019, 127, 16–22. [Google Scholar] [CrossRef] [PubMed]
  22. Jia, Y.; Fang, F. Improving applicability of urease from Bacillus amyloliquefaciens JP-21 by site-directed mutagenesis. Chin. J. Biotech. 2020, 36, 1640–1649. [Google Scholar] [CrossRef]
  23. Jia, Y.; Zhou, J.; Du, G.; Chen, J.; Fang, F. Identification of an urethanase from Lysinibacillus fusiformis for degrading ethyl carbamate in fermented foods. Food Biosci. 2020, 36, 100666. [Google Scholar] [CrossRef]
  24. Weatherburn, M.W. Phenol-hypochlorite reaction for determination of ammonia. Anal. Chem. 1967, 39, 971–974. [Google Scholar] [CrossRef]
  25. Yang, L.; Wang, S.; Tian, Y. Purification, properties, and application of a novel acid urease from Enterobacter sp. Appl. Biochem. Biotechnol. 2010, 160, 303–313. [Google Scholar] [CrossRef]
  26. Zhao, X.; Zou, H.; Fu, J.; Zhou, J.; Du, G.; Chen, J. Metabolic engineering of the regulators in nitrogen catabolite repression to reduce the production of ethyl carbamate in a model rice wine system. Appl. Environ. Microbiol. 2014, 80, 392–398. [Google Scholar] [CrossRef]
  27. Robert, X.; Gouet, P. Deciphering key features in protein structures with the new ENDscript server. Nucleic Acids Res. 2014, 42, W320–W324. [Google Scholar] [CrossRef]
  28. Kappaun, K.; Piovesan, A.R.; Carlini, C.R.; Ligabue-Braun, R. Ureases: Historical aspects, catalytic, and non-catalytic properties—A review. Adv. Res. 2018, 13, 3–17. [Google Scholar] [CrossRef]
  29. Proshlyakov, D.A.; Farrugia, M.A.; Proshlyakov, Y.D.; Hausinger, R.P. Iron-containing ureases. Coord. Chem. Rev. 2021, 448, 214190. [Google Scholar] [CrossRef]
  30. Carter, E.L.; Flugga, N.; Boer, J.L.; Mulrooney, S.B.; Hausinger, R.P. Interplay of metal ions and urease. Metallomics 2009, 1, 207–221. [Google Scholar] [CrossRef]
  31. Carter, E.L.; Tronrud, D.E.; Taber, S.R.; Karplus, P.A.; Hausinger, R.P. Iron-containing urease in a pathogenic bacterium. Proc. Natl. Acad. Sci. USA 2011, 108, 13095–13099. [Google Scholar] [CrossRef] [PubMed]
  32. Maroney, M.J.; Ciurli, S. Nonredox nickel enzymes. Chem. Rev. 2014, 114, 4206–4228. [Google Scholar] [CrossRef] [PubMed]
  33. Liu, Q.; Wang, H.; Zhang, W.; Cheng, F.; Qian, S.; Li, C.; Chen, Y.; Zhu, S.; Wang, T.; Tian, S. High salt-resistant urethanase degrades ethyl carbamate in soy sauce. J. Agric. Food Chem. 2024, 72, 21266–21275. [Google Scholar] [CrossRef] [PubMed]
  34. Notin, P.; Rollins, N.; Gal, Y.; Sander, C.; Marks, D. Machine learning for functional protein design. Nat. Biotechnol. 2024, 42, 216–228. [Google Scholar] [CrossRef] [PubMed]
  35. Kortemme, T. De novo protein design-From new structures to programmable functions. Cell 2024, 187, 526–544. [Google Scholar] [CrossRef]
  36. Nguyen, D.T.; Mitchell, D.A.; van der Donk, W.A. Genome mining for new enzyme chemistry. ACS Catal. 2024, 14, 4536–4553. [Google Scholar] [CrossRef]
Figure 1. Characterization of urease gene clusters and sequence alignment of structural subunit C. (A) Structures of bifunctional urease gene clusters reported to date. (B) Sequence alignment of structural C subunits of ureases. Ka_UreC (PDB No. 1FWJ), Bp_UreC (GenBank accession No. AGN36402.1), Lr_UreC (GenBank No. EDX42993.1), Pr_UreC (GenBank No. AKR75466.1), and Ps_UreC (GenBank accession No. ASM56437.1) represent the C subunit of ureases from K. aerogenes, L. reuteri CICC6124, B. paralicheniformis ATCC 9945a, P. rettgeri JNB815, and Providencia sp. LBBE. Metal ligands are marked by stars; residues that are important for urea binding or catalysis are highlighted by squares.
Fermentation 10 00653 g001
Figure 2. Phylogenetic analysis of urease C subunit. The neighbor-joining phylogenetic tree was constructed using MEGA 11 software with 100 bootstrap replicates.
Fermentation 10 00653 g002
Figure 3. Effects of temperature and pH on Ps_Urease activity and stability. (A,B) Effect of temperature on enzyme activity and stability, respectively. (C,D) Effect of pH on enzyme activity and stability, respectively.
Fermentation 10 00653 g003
Figure 4. Effects of ethanol concentration on Ps_Urease activity, stability, and Michaelis–Menten curves of enzymes towards EC and urea under different pH conditions. (A,B) Effect of ethanol on enzyme activity and stability, respectively. (C) Michaelis–Menten curves of enzyme towards urea at pH 4.5 and pH 7.0. (D) Michaelis–Menten curves of the enzyme towards EC at pH 4.5 and pH 7.0.
Fermentation 10 00653 g004
Figure 5. Evaluation of urea and EC degradation by recombinant Ps_Urease in rice wine. A final concentration of 6000 U/L of purified Ps_Urease was introduced into the wine samples, and subsequently, the mixture was incubated at 30 °C for 18 h.
Fermentation 10 00653 g005
Table 1. Kinetic parameters of the recombinant Ps_Urease.
SubstratepHKm (mM)Vmax (µmol·mg−1·min−1)
EC4.5515.6 ± 26.833.9 ± 1.8
7.0214.7 ± 10.271.8 ± 2.7
Urea4.532.0 ± 1.4263.6 ± 12.1
7.512.5 ± 0.5600.2 ± 25.2
Disclaimer/Publisher’s Note: The statements, opinions and data contained in all publications are solely those of the individual author(s) and contributor(s) and not of MDPI and/or the editor(s). MDPI and/or the editor(s) disclaim responsibility for any injury to people or property resulting from any ideas, methods, instructions or products referred to in the content.

