Abstract
Clostridium ljungdahlii is a model acetogenic bacterium utilized for ethanol production from syngas, with its growth and ethanol synthesis being profoundly influenced by fermentation pH. However, the mechanistic basis of this pH-dependent regulation remains poorly understood. In this study, we systematically investigated the impact of pH on the growth and metabolic profile of C. ljungdahlii under controlled pH conditions using CO as the sole carbon and energy source. At pH 6.0, C. ljungdahlii consumed around 6.0 M carbon monoxide, producing 413 ± 43 mM acetate, 288 ± 35 mM ethanol, and 17 ± 2 mM 2,3-butanediol, with a maximum optical density (OD) of 15.9. In contrast, at pH 5.3, the strain exhibited enhanced metabolic activity, consuming around 9.6 M carbon monoxide and generating 235 ± 24 mM acetate, 756 ± 26 mM ethanol, 38 ± 4 mM 2,3-butanediol, and 28 ± 7 mM lactate, achieving a maximum OD of 30. This represents an approximate twofold increase in both ethanol production and biomass accumulation compared to pH 6.0. Proteomic and parallel reaction monitoring (PRM) analyses demonstrated that the expression levels of key enzymes in central metabolic pathways were marginally higher at pH 6.0 than at pH 5.3, indicating that the observed physiological enhancements were not attributable to differential enzyme expression but likely stemmed from variations in ATP synthesis efficiency. Further optimization experiments revealed that the optimal pH for growth and ethanol production by C. ljungdahlii under CO-sufficient and nutrient-replete conditions is approximately 5.3. These findings provide critical insights into the pH-dependent metabolic regulation of C. ljungdahlii and establish essential parameters for scaling up syngas fermentation for ethanol production. Additionally, this study offers a foundation for further exploration of the unique proton motive force-driven ATP synthesis system in C. ljungdahlii and its broader implications for metabolic network regulation.
1. Introduction
Clostridium ljungdahlii is a well-studied model acetogen renowned for its ability to utilize syngas (a mixture of CO, CO2, and H2) as a carbon and energy source. This organism is capable of producing valuable bulk biochemicals and biofuels, including lactate, acetate, 2,3-butanediol, and ethanol, through syngas fermentation [1,2,3,4]. As such, C. ljungdahlii serves as an excellent microbial cell factory for sustainable biofuel and biochemical production [5,6,7]. The central metabolic pathway for syngas utilization in C. ljungdahlii is the Wood–Ljungdahl pathway (WLP), also known as the reductive acetyl-CoA pathway, which has been extensively characterized in acetogenic bacteria [8,9,10,11]. The WLP is a carbon fixation pathway that synthesizes acetyl-CoA from two molecules of CO2 via two distinct branches: the methyl branch and the carbonyl branch (Figure 1). In the methyl branch, one molecule of CO2 is reduced to form methyl tetrahydrofolate (CH3-THF), which is subsequently converted to methyl-cobalamin iron-sulfur protein (Methyl-CoFeSP) through a series of enzymatic reactions [12,13,14]. The carbonyl branch involves the reduction of another CO2 molecule to CO, catalyzed by carbon monoxide dehydrogenase (CODH). Methyl-CoFeSP and CO are then condensed into acetyl-CoA by the carbon monoxide dehydrogenase/acetyl-CoA synthase complex (CODH/ACS), a key enzyme complex in the WLP [15,16]. Acetyl-CoA can either be converted to acetate via phosphotransacetylase and acetate kinase or channeled into other metabolic pathways for biomass synthesis. All key enzymes involved in the WLP have been identified and characterized in C. ljungdahlii [2,8,9,11,14,17].
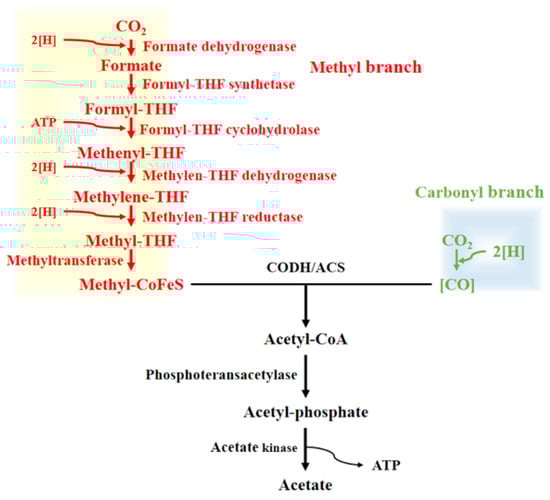
Figure 1.
Metabolic pathway of Wood–Ljungdahl pathway. Abbreviation used: CoFeS, corrinoid iron-sulfur protein; THF, tetrahydrofolate; CODH/ACS, carbon monoxide dehydrogenase/acetyl-CoA synthase complex.
Despite its metabolic versatility, the energy conservation mechanisms in C. ljungdahlii during syngas fermentation are considered relatively inefficient. First, hydrogenase and CODH are critical enzymes for energy generation from syngas. CODH catalyzes the oxidation of CO to CO2, producing reduced ferredoxin (Fdred) as the primary energy carrier, while ATP and NAD(P)H are generated through electron bifurcation reactions [3,11]. Similarly, hydrogenase complexes oxidize H2 to produce Fdred and NADPH during CO2/H2 fermentation [18]. However, the functional roles of three hydrogenase complexes (CLJU_c07070, CLJU_c17280, CLJU_c37220) and three CODH complexes (CLJU_c09110, CLJU_c17910, CLJU_c37670) remain incompletely understood, as their transcriptional regulation and metabolic functions vary significantly depending on the carbon and energy sources utilized [19]. Second, methylenetetrahydrofolate reductase (MTHFR), a key enzyme in the WLP, catalyzes a critical redox reaction (Figure 2). Although Fdred has been identified as the electron donor for this reaction, the specific electron acceptor remains unresolved, complicating the redox balance analysis and hindering a comprehensive understanding of energy metabolism in C. ljungdahlii [20,21,22]. Third, and most importantly, ATP synthesis in C. ljungdahlii is uniquely mediated by the Rnf-ATPase system, which generates ATP via an electrochemical proton gradient (Figure 2) [11,23]. The efficiency of ATP synthesis is influenced by the proton motive force (PMF, also named as electrochemical proton (H+) gradient), which is directly affected by the pH gradient across the cell membrane. Consequently, extracellular and intracellular pH variations significantly impact ATP production, energy conservation, and product formation during syngas fermentation [13,24,25]. However, detailed studies on the effects of pH on C. ljungdahlii growth, metabolism, and Rnf complex activity under different pH conditions remain limited.
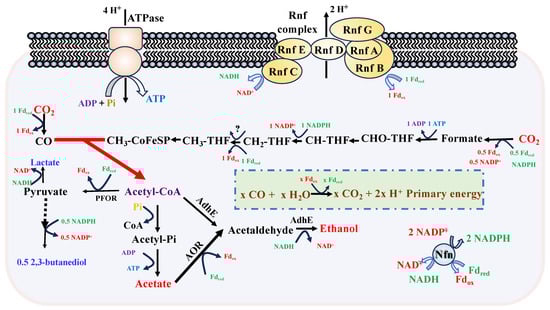
Figure 2.
The central metabolic pathways for product synthesis in C. ljungdahlii CO fermentation. Abbreviations used: AdhE, adhE, aldehyde/alcohol dehydrogenase; AOR, aor, acetaldehyde:ferredoxin oxidoreductase; PFOR, pfor, pyruvate:ferredoxin oxidoreductase; Rnf complex: This complex is typically composed of multiple subunits, whose function is electron transformation between different redox potentials; Nfn: An enzyme complex containing two subunits. Its function is similar to Rnf complex; Fdred, reduced ferredoxin; Fdox, oxidized ferredoxin.
In this study, we conducted controlled batch fermentations of C. ljungdahlii at two distinct pH values (pH 5.3 and 6.0) to investigate the influence of pH on energy conservation mechanisms and product formation during CO fermentation. By analyzing fermentation performance, metabolic profiles, and enzyme activities, we aim to elucidate the pH-dependent regulatory mechanisms governing energy metabolism and product synthesis in C. ljungdahlii.
2. Materials and Methods
2.1. Strains and Culture Medium
Clostridium ljungdahlii DSM 13528, used in this study, was obtained from the Deutsche Sammlung von Mikroorganismen und Zellkulturen GmbH (DSMZ, Braunschweig, Germany). The strain was cultivated in 250 mL anaerobic bottles containing 50 mL of modified DSMZ 879 medium, as described by Zhu et al. [19,26], at 36 °C under strict anaerobic conditions. A gas mixture (CO:CO2, 80:20, v/v; Dalian Date Gas Co., Ltd., Dalian, China) served as the carbon and energy source. The medium was thoroughly mixed and deoxygenated overnight in an anaerobic glove box (COY Laboratory Products, Grass Lake, MI, USA), using resazurin as an anaerobic indicator. After autoclaving, FeSO4, vitamins, cysteine hydrochloride, and NaHCO3 buffer were aseptically added using a 0.2 μm syringe filter. The bottles were pressurized with the gas mixture to 0.2 MPa and maintained under these conditions.
2.2. Fed-Batch Fermentation with CO
C. ljungdahlii was revived and pre-cultured in 250 mL anaerobic bottles using CO/CO2 as the carbon source. Fed-batch fermentations were conducted in quadruple 5 L fermenters (T&J Bio-engineering Co., Ltd., Shanghai, China), specially customized for gas fermentation, containing 2.5 L of modified DSMZ medium with pH control. Duplicate parallel fermentations were performed for each condition. The gas supply pressure was maintained at 0.1 MPa, with an initial gas flow rate of 30 mL/min. Off-gas samples were collected every 12 h and analyzed using a gas chromatography (GC-7820, HuiFen Chemical Instrument Co., Ltd., Jining, China). The gas flow rate was adjusted based on the off-gas composition, increasing when the CO content fell below 15%. The concentration nutrients were gradually added according to the growth indicated by the optical density (OD). The fermentation pH was controlled at either 5.3 or 6.0 by adding 4 M KOH. A 300 mL pre-culture was inoculated into the bioreactor, and 5 mL samples were collected every 12 h for cell density monitoring and product analysis.
2.3. Carbon and Energy Flux Analysis
Acetate and ethanol are the primary products of CO fermentation, and their biosynthetic pathways are well-defined (Figure 2). The amount of CO consumed for acetate and ethanol production can be calculated based on these pathways. Reduced ferredoxin (Fdred) serves as the primary energy carrier during CO fermentation. NADH and NADPH are generated via electron bifurcation, utilizing equimolar amounts of Fdred as the electron donor. The synthesis of 1 mole of ethanol, acetate, 2,3-butanediol, and lactate requires 6, 4, 11, and 6 moles of Fdred, respectively. However, analyzing the redox balance remains challenging due to the incomplete elucidation of the ethanol synthesis pathway. In this study, we assumed that all ethanol is produced via the AOR pathway, where acetate is converted to acetaldehyde, which is subsequently reduced to ethanol [27,28,29]. ATP synthesis is closely linked to the Rnf-ATPase system, in which Fd participates. Although the precise mathematical relationship between Fdred consumption and ATP formation remains unclear, this framework allows for a comparative analysis of energy consumption and ATP synthesis under the two fermentation pH conditions.
2.4. Comparative Proteomics Analysis
To investigate protein expression differences, a comparative proteomic analysis of C. ljungdahlii cells grown under CO at pH 5.3 and pH 6.0 was conducted. Bacterial cells were collected as previously described [19]. Data-Independent Acquisition-Mass Spectrometry (DIA-MS) analysis was performed by Shanghai Applied Protein Technology (Shanghai, China). The mass spectrometry workflow and protein database alignment procedures have been detailed in prior publications [30]. All raw data files were deposited in the PRIDE database under accession number PXD060541.
The comparative proteomics results revealed the expression levels of all functional proteins involved in CO fermentation by C. ljungdahlii. We focused on three groups of proteins: (1) those located in central metabolic pathways, (2) those exhibiting the greatest expression differences between pH 6.0 and pH 5.3, and (3) the top 30 most highly expressed proteins during fermentation. Some proteins appeared in multiple groups, suggesting their critical roles in CO fermentation.
2.5. Parallel Reaction Monitoring (PRM) Analysis
To validate the protein expression levels obtained from DIA-MS analysis, selected proteins were further quantified using liquid chromatography-parallel reaction monitoring mass spectrometry (LC-PRM/MS) at Shanghai Applied Protein Technology Co., Ltd. (Shanghai, China) [31]. Given the presence of isoenzymes such as AOR and AdhE, which catalyze identical metabolic reactions, traditional enzyme assays cannot accurately determine the specific activity of individual enzymes. PRM analysis, however, can precisely measure the copy number of functional proteins, providing a proxy for enzyme activity.
Peptides were prepared following the iTRAQ/TMT/label-free protocol, and a Peptide Retention Time Calibration Mixture (Thermo Scientific, Waltham, MA, USA) containing stable isotope-labeled peptides was spiked into each sample as an internal standard. Tryptic peptides were desalted using C18 stage tips and subjected to reversed-phase chromatography on an Easy nLC-1200 system (Thermo Scientific). A one-hour gradient with acetonitrile (5–30% over 45 min) was applied. PRM analysis was performed on a Q Exactive HF-X mass spectrometer (Thermo Scientific) in positive ion mode. Optimized collision energy, charge state, and retention times were determined experimentally for each target protein using high-intensity, high-confidence unique peptides. Full MS1 scans were acquired at a resolution of 60,000 (at 300 m/z), with an automatic gain control (AGC) target of 3.0 × 10⁶ and a maximum ion injection time of 200 ms. Full MS scans were followed by 20 PRM scans at 30,000 resolution (at m/z 200), with an AGC target of 3.0 × 10⁶ and a maximum injection time of 100 ms. Targeted peptides were isolated with a 1.6 Th window, and ion activation/dissociation was performed at a normalized collision energy of 27 in a higher-energy collisional dissociation (HCD) cell. Raw data were analyzed using Skyline (MacCoss Lab, University of Washington, Seattle, WA, USA) [30], where signal intensities for individual peptide sequences were quantified relative to each sample and normalized to the internal standard.
2.6. Analytical Methods
Concentrations of lactic acid, acetic acid, 2,3-butanediol, and ethanol in fermentation products were determined using an Agilent Technologies 1260 Infinity II high-performance liquid chromatograph (HPLC). An Agilent Hi-Plex H column (Agilent Technologies, Santa Clara, CA, USA) equipped with a 35 °C refractive index detector was used. The column temperature was maintained at 55 °C, and acidified water (5 mM H2SO4) served as the mobile phase at a flow rate of 0.6 mL/min. Cell growth was monitored by measuring the absorbance at 600 nm (A600nm) during anaerobic fermentation using an Ultrospec 2100 Pro spectrophotometer (GE, Fairfield, CT, USA). Measurements were taken at defined time intervals.
3. Results and Discussion
3.1. Fed-Batch Fermentation in CO Fermentation with pH Control
In the CO fermentation experiments, C. ljungdahlii demonstrated superior growth at pH 5.3, achieving a maximum optical density (OD) of 30 ± 3.6 at 96 h (Figure 3). In contrast, at pH 6.0, the maximum OD was significantly lower (16 ± 3.5) and was reached earlier at 84 h. These findings suggest that C. ljungdahlii is more efficient at nutrient uptake and energy utilization for biomass accumulation under slightly acidic conditions. The enhanced growth at pH 5.3 can be attributed to the higher proton motive force, which facilitates the Rnf-ATPase system, leading to increased ATP production. Consequently, C. ljungdahlii exhibited more robust growth at pH 5.3 compared to pH 6.0.
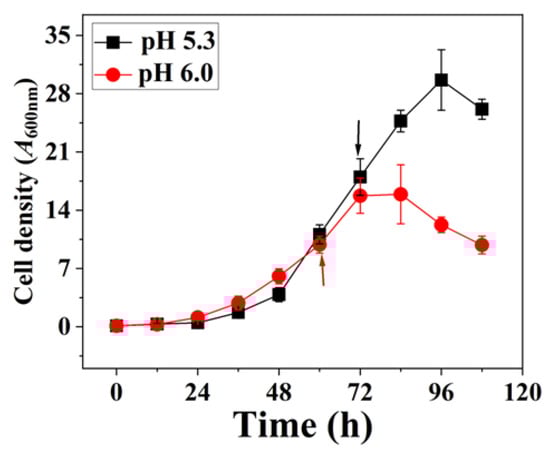
Figure 3.
Cell growth of C. ljungdahlii with pH 6.0 or pH 5.3. Arrows: These two time points represent exponential growth phases, respectively. Samples were withdrawn from fermenter at these time points for proteome and parallel reaction monitoring (PRM) analysis.
Ethanol emerged as the predominant metabolic product, reaching a concentration of 756 ± 26 mM at 96 h in the pH 5.3 fermentation. Acetate production was also significant, with a concentration of 235 ± 24 mM at the same time point, alongside minor quantities of 2,3-butanediol and lactate (Figure 4 and Table S1). Gas flow meter measurements of the off-gas and syngas indicated that 9588 mM of CO was consumed over the course of the fermentation. In contrast, at pH 6.0, acetate was the dominant product, reaching 413 ± 43 mM at 84 h, while ethanol production was lower at 288 ± 35 mM. Trace amounts of 2,3-butanediol (17 ± 2 mM) were detected, and lactate was not measurable (Table S1). Additionally, CO consumption was significantly lower (6030 mM) under this condition. These results underscore the influence of pH on both biomass yield and the distribution of fermentation products.
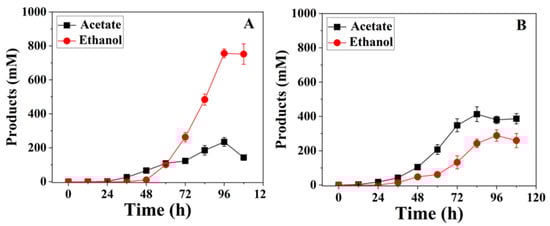
Figure 4.
Product concentrations of C. ljungdahlii grown in CO at pH 5.3 (A) and pH 6.0 (B).
The energy metabolism analysis revealed that the moles of CO consumed during fermentation could be determined by quantifying redox reactions associated with product synthesis (Figure 2 and Figure 5). At pH 5.3, the synthesis of acetate, ethanol, 2,3-butanediol, and lactate required 6062 mM of reduced ferredoxin (Fdred), generated through CO oxidation (Figure 5 and Table S1). Similarly, at pH 6.0, the synthesis of these products required 3621 mM of Fdred. The remaining bioenergy was utilized for biomass accumulation, which is closely linked to ATP production. Calculations showed that 3526 mM of CO was consumed for biomass production at pH 5.3, compared to only 2409 mM at pH 6.0. This discrepancy in CO utilization aligns with the observed differences in maximum OD, which was approximately twice as high at pH 5.3 (OD = 30) compared to pH 6.0 (OD = 16).
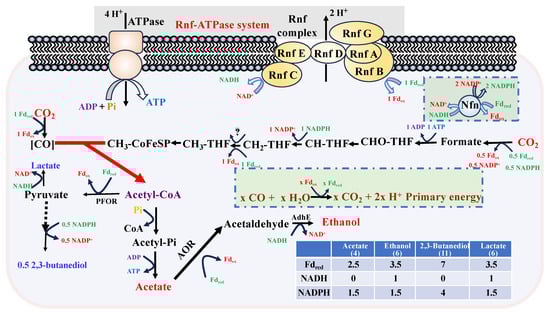
Figure 5.
Energy metabolic balance analysis during product synthesis in CO fermentation. The table in the figure displays the specific bioenergy required during product synthesis. The synthesis of NADH and NADPH are derived from the electron bifurcation of Fdred. As a result, the number in the products row represents the Fdred required for product synthesis.
C. ljungdahlii employs the Wood–Ljungdahl (WL) pathway, consuming one mole of ATP for acetyl-CoA formation while generating one mole of ATP during acetate synthesis from acetyl-CoA (Figure 1). This metabolic strategy highlights the organism’s reliance on the Rnf-ATPase system for ATP generation, which is highly sensitive to extracellular pH [11,17]. In this study, the H+ concentration at pH 5.3 was fivefold higher than at pH 6.0, providing a more favorable transmembrane proton motive force for ATP synthesis. While previous studies identified pH 6.0 as the optimal growth pH for C. ljungdahlii in uncontrolled anaerobic batch cultures [2,32,33], our controlled experiments revealed that pH 5.3 supports maximal growth and ethanol production (Figure 3 and Figure 4). This finding is not consistent with observations in other alcohol-producing Clostridium species, where growth and alcohol production phases are often temporally separated [34,35]. By optimizing pH control, we synchronized these phases, enhancing both growth and ethanol titer simultaneously, thereby elucidating a unique metabolic adaptation in C. ljungdahlii.
3.2. Quantitative Proteome Analyses of C. ljungdahlii Cells in CO Fermentation
Significant differences in growth and metabolic product profiles were observed under varying pH conditions (Figure 3 and Figure 4). To explore the underlying mechanisms, quantitative proteomics was employed to assess protein expression changes induced by pH variations. Protein expression levels were quantified using mass spectrometry (MS)-derived intensity values.
Key proteins involved in central metabolic pathways, including the WL pathway and Rnf-ATPase system, exhibited high expression levels, underscoring their critical roles in gas fermentation (Figure 6 and Table S2). However, the fold changes in expression of these proteins between pH 5.3 and 6.0 were modest (generally less than 2-fold), suggesting that pH-induced metabolic differences are not primarily driven by transcriptional or translational regulation of central metabolic enzymes. Instead, the observed differences in growth and product formation are likely attributable to variations in ATP synthesis efficiency mediated by the Rnf-ATPase system, which is directly influenced by extracellular H+ concentration. This aligns with prior studies demonstrating that enhanced ATP availability promotes growth and reduces acetate production in syngas-utilizing Clostridium species [36].
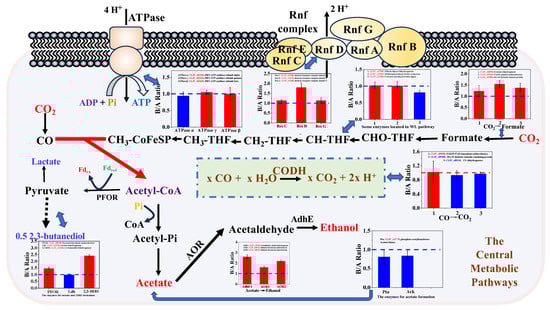
Figure 6.
Expression profiles of key enzymes located in central metabolic pathways. The red color indicates that protein expression level is higher in the fermentation at 6.0 than that at 5.3. On the contrary, green color indicates that protein expression level is higher in the fermentation at 5.3. The details of expression profiles were listed in Table S2. Gene name: Genes are listed in the order of ORF (open reading frame) numbers.
Under stable pH control and sufficient carbon supply, C. ljungdahlii maintains a fixed ratio of ATP and NADH production and consumption. At pH 6.0, reduced ATP generation led to an NADH surplus, prompting upregulation of enzymes involved in ethanol and 2,3-butanediol synthesis, such as adhE, pfor, 2,3-bdh, and aor (Figure 6 and Table S2). Despite this, ethanol and 2,3-butanediol yields were higher at pH 5.3, suggesting an optimal ATP/NADH ratio that facilitates carbon and redox balance, thereby promoting growth and alcohol production without necessitating excessive enzyme expression. Notably, the bifunctional acetaldehyde/alcohol dehydrogenase (AdhE) and formate dehydrogenase (FDH) exhibited differential expression patterns. While AdhE1 was consistently expressed, AdhE2 remained silent, consistent with previous transcriptomic findings [19,26]. Among the three FDH isoforms encoded in the C. ljungdahlii genome, one (gene No. CLJU_c08930) showed significantly elevated expression at pH 6.0, though its functional relevance remains unclear and warrants further investigation.
The pH variation during fermentation significantly altered the relative expression levels of numerous functional proteins. We identified and cataloged the 60 proteins exhibiting the most pronounced upregulation and downregulation under the two fermentation conditions (Figure 7 and Table S3). Although a comprehensive analysis of these proteins revealed their involvement in diverse metabolic processes, the precise functional roles of many remain uncharacterized. Consequently, elucidating the specific mechanisms driving these expression changes remains a challenge. Notably, proteins associated with flagellar synthesis were highly expressed under pH 5.3 fermentation conditions. It has been reported that the bacterial flagellar motor is driven by transmembrane electrochemical gradients of ions, such as H+ or Na+, which propel cellular movement. We propose that the pH shift during fermentation modulates the transmembrane electrochemical potential, thereby influencing the expression of flagellar-related proteins.
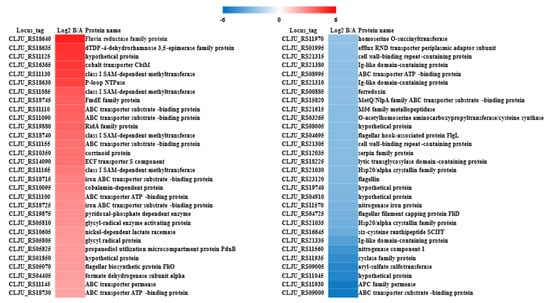
Figure 7.
The top 60 protein expression profiles with the most significant changes in CO fermentation. The color is used to clearly represent the differences in protein expression levels between the two pH conditions. Red indicates that the protein expression level is higher at pH 6.0, while blue indicates that the protein expression level is higher at pH 5.3. The fold change (FC) is defined as the ratio of the protein expression level at pH 6.0 to that at pH 5.3.
Additionally, we identified the top 30 proteins with the highest expression abundance under each fermentation condition (Table S4). Functional analysis revealed that the majority of these proteins are integral to central metabolic pathways, underscoring their critical roles in cellular growth and metabolism. Furthermore, the high expression levels of cell-wall-binding repeat-containing proteins (Gene No. CLJU_c02370 and CLJU_c02505) highlight their potential significance in the physiology and survival of C. ljungdahlii.
3.3. PRM Quantification of 25 Key Enzymes in C. ljungdahlii CO Fermentation
PRM technology employed to quantify the expression levels of 25 key enzymes involved in the central metabolic pathway under different pH conditions (Table 1). This approach not only validated the accuracy of comparative proteomics but also facilitated the characterization of enzyme activity based on relative protein abundance [18,20]. Overall, the expression levels of key enzymes were slightly higher at pH 6.0 compared to pH 5.3 during CO fermentation. These PRM results were consistent with the findings from comparative proteomics analysis (Table S2, Figure 6).

Table 1.
The PRM analysis of the central metabolic enzymes in CO fermentation.
Interestingly, despite the higher expression of key enzymes at pH 6.0, C. ljungdahlii exhibited significantly enhanced growth, CO consumption, and ethanol production at pH 5.3. This discrepancy suggests that elevated protein expression of key enzymes does not necessarily correlate with increased metabolic flux. Instead, the results indicate that reduced ATP acquisition efficiency severely impairs the metabolic activity of C. ljungdahlii, which is the primary reason for the lower growth and metabolic rates observed at pH 6.0 [11]. Notably, the expression of AdhE2 was undetectable, further confirming that AdhE2 remains transcriptionally and translationally silent when AdhE1 is actively expressed during C. ljungdahlii gas fermentation [19,26]. This observation highlights the precise regulatory mechanisms governing AdhE enzymes in metabolic pathways.
Additionally, AOR enzymes and 2,3-butanediol dehydrogenase exhibited higher expression levels at pH 6.0 compared to pH 5.3. These enzymes, which are Fd-dependent and NADPH-dependent oxidoreductases, respectively, play critical roles in the ethanol and 2,3-butanediol synthesis pathways [4,27,36]. However, fermentation results revealed significantly lower production of ethanol and 2,3-butanediol at pH 6.0 (Figure 4 and Table S1), as discussed in the previous section. Furthermore, the Rnf complex and ATPase complex, which are transmembrane multi-subunit complexes, present challenges for traditional enzymatic activity assays. PRM technology, however, enabled the quantification of their protein abundance as a proxy for enzymatic activity. The results demonstrated comparable expression levels of these two enzyme complexes under both pH conditions.
3.4. Optimal pH for the Growth and Metabolism in CO Fermentation
The capacity for ATP generation in C. ljungdahlii is closely linked to the pH of the fermentation broth during gas fermentation. We observed that C. ljungdahlii exhibited significantly improved growth and higher ethanol production at pH 5.3 (Figure 4). To determine whether lower pH conditions are more favorable for ethanol production and growth, we conducted additional fermentations across a broader pH range, including pH 5.8, 5.5, 5.0, and 4.8, in CO fermentation (Figure S2). By integrating the fermentation data obtained at pH 5.3 and 6.0, we summarized the maximum biomass, peak ethanol production, and highest acetate production under various pH conditions into a single figure (Figure 8).
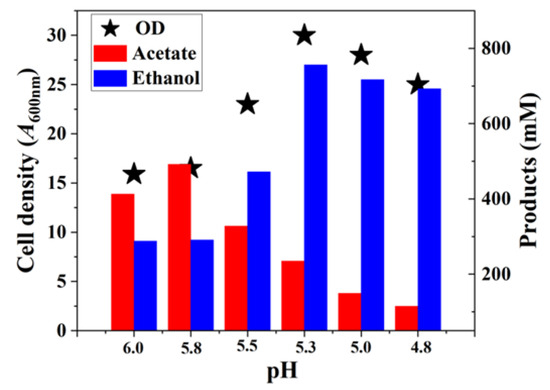
Figure 8.
The maximum growth, acetate, and ethanol production in different pH condition fermentation conditions.
The results demonstrated that as the pH decreased, the growth and ethanol production capabilities of C. ljungdahlii gradually increased [11,37]. However, when the pH dropped below 5.3, a slight decline in both growth and alcohol production was observed, indicating that excessively low pH adversely affects cellular metabolism and growth. Thus, the optimal pH for growth and metabolism in C. ljungdahlii CO fermentation, under steady pH control, is approximately 5.3. In traditional batch fermentation, the widely recognized optimal growth pH for C. ljungdahlii is 6.0. In contrast, during continuous fermentation where ethanol is the primary target product, the pH is often maintained below 5.3 [18,37]. To balance growth and ethanol production, some researchers have adopted a two-stage fermentation strategy, applying different pH controls at distinct stages of the process. In this study, we found that during batch fermentation, by employing fed-batch strategies and carefully controlling CO supply, C. ljungdahlii could achieve optimal growth and ethanol production simultaneously (Figure 3 and Figure 4). This finding provides critical experimental evidence to support the scaling-up of ethanol production using CO as the carbon source.
4. Conclusions
The Rnf-ATPase system is the primary mechanism for ATP synthesis during CO fermentation of C. ljungdahlii, serving as the most critical bioenergy source for bacterial metabolism. The efficiency of ATP production by this system is closely linked to the fermentation pH. The results under different pH conditions reveal that the optimal pH for growth and ethanol production in C. ljungdahlii fermentation is around 5.3 with sufficient carbon source and nutrients. Calculations showed that the proton concentration at pH 5.3 is five times higher than that at pH 6.0. The enhanced proton motive force enables C. ljungdahlii to achieve approximately twice the CO consumption, biomass accumulation and ethanol production at pH 5.3 compared to that at pH 6.0. Comparative proteomics and PRM results indicated that, despite lower growth and alcohol production, the expression levels of key enzymes in the central metabolic pathways were slightly higher under pH 6.0 fermentation conditions than that at pH 5.3. This suggests that during CO fermentation in C. ljungdahlii, not only the metabolic pathways remain unobstructed, but redox balance must also be maintained. Specifically, the rate of bioenergy generation must match the rate of bioenergy consumption to achieve homeostasis during growth and metabolism. This implies that ATP, Fdred, NADH, and NADPH, as crucial forms of bioenergy, are produced and consumed in fixed ratio to maintain optimal redox balance. At pH 6.0, the low transmembrane proton motive force impairs the efficient synthesis of ATP, thereby negatively impacting growth and alcohol production. Similarly, at pH 5.0 and 4.8, excessively high proton motive force also adversely affects the growth and alcohol production of C. ljungdahlii.
Supplementary Materials
The following supporting information can be downloaded at: https://www.mdpi.com/article/10.3390/fermentation11030154/s1, Table S1: Products concentrations of C. ljungdahlii grown in CO at pH 5.3 and pH 6.0; Table S2: The expression profiles of the key enzymes located in central metabolic pathways during CO fermentation of C. ljungdahlii; Figure S1: The bar graphs in the Figure 6; Table S3: The top 60 protein expression profiles with the most significant changes in CO fermentation; Table S4: The top 60 protein expression profiles with the highest expression levels in CO fermentation; Figure S2: The growth, acetate and ethanol production in different pH condition fermentation conditions.
Author Contributions
Conceptualization, Q.Z., L.-P.L., L.-C.L., Q.L., F.-L.L. and Z.-Y.L.; Methodology, L.-C.L.; Software, Z.-R.L. and L.-C.L.; Validation, Z.-Q.W., Q.L., F.-L.L. and Z.-Y.L.; Formal analysis, Z.-Q.W., J.-W.W., H.-P.G. and Q.Z.; Investigation, Z.-R.L. and J.-W.W.; Resources, Z.-Q.W. and Q.L.; Data curation, Z.-R.L., Q.L. and Z.-Y.L.; Writing—original draft, Z.-Y.L.; Writing—review & editing, F.-L.L.; Supervision, Z.-Y.L.; Project administration, F.-L.L.; Funding acquisition, H.-P.G., Q.Z. and L.-P.L. All authors have read and agreed to the published version of the manuscript.
Funding
This work was financially supported by the National Natural Science Foundation of China (Grant No. U21B2099,32370039), Shandong Provincial Natural Science Foundation (ZR2023 MC062), and the China Petrochemical Corporation (Sinopec).
Institutional Review Board Statement
Not applicable.
Informed Consent Statement
Not applicable.
Data Availability Statement
The original contributions presented in this study are included in the article/Supplementary Materials. Further inquiries can be directed to the corresponding author.
Conflicts of Interest
Authors Hui-Peng Gao, Quan Zhang and Lan-Peng Li were employed by the Sinopec Dalian Research Institute of Petroleum and Petrochemicals. The remaining authors declare that the research was conducted in the absence of any commercial or financial relationships that could be construed as a potential conflict of interest.
References
- Henstra, A.M.; Sipma, J.; Rinzema, A.; Stams, A.J.M. Microbiology of synthesis gas fermentation for biofuel production. Curr. Opin. Biotech. 2007, 18, 200–206. [Google Scholar] [CrossRef] [PubMed]
- Köpke, M.; Held, C.; Hujer, S.; Liesegang, H.; Wiezer, A.; Wollherr, A.; Ehrenreich, A.; Liebl, W.; Gottschalk, G.; Dürre, P. Clostridium ljungdahlii represents a microbial production platform based on syngas. Proc. Natl. Acad. Sci. USA 2010, 107, 13087–13092. [Google Scholar] [CrossRef]
- Liew, F.; Henstra, A.M.; Winzer, K.; Köpke, M.; Simpson, S.D.; Minton, N.P. Insights into CO2 fixation pathway of by targeted mutagenesis. mBio 2016, 7, e00427-16. [Google Scholar] [CrossRef] [PubMed]
- Köpke, M.; Mihalcea, C.; Liew, F.M.; Tizard, J.H.; Ali, M.S.; Conolly, J.J.; Al-Sinawi, B.; Simpson, S.D. 2,3-butanediol production by acetogenic bacteria, an alternative route to chemical synthesis, using industrial waste gas. Appl. Environ. Microbiol. 2011, 77, 5467–5475. [Google Scholar] [CrossRef]
- Jones, S.W.; Fast, A.G.; Carlson, E.D.; Wiedel, C.A.; Au, J.; Antoniewicz, M.R.; Papoutsakis, E.T.; Tracy, B.P. CO2 fixation by anaerobic non-photosynthetic mixotrophy for improved carbon conversion. Nat. Commun. 2016, 7, 12800. [Google Scholar] [CrossRef]
- Marcellin, E.; Behrendorff, J.B.; Nagaraju, S.; DeTissera, S.; Segovia, S.; Palfreyman, R.W.; Daniell, J.; Licona-Cassani, C.; Quek, L.E.; Speight, R.; et al. Low carbon fuels and commodity chemicals from waste gases-systematic approach to understand energy metabolism in a model acetogen. Green Chem. 2016, 18, 3020–3028. [Google Scholar] [CrossRef]
- Liew, F.E.; Nogle, R.; Abdalla, T.; Rasor, B.J.; Canter, C.; Jensen, R.O.; Wang, L.; Strutz, J.; Chirania, P.; De Tissera, S.; et al. Carbon-negative production of acetone and isopropanol by gas fermentation at industrial pilot scale. Nat. Biotechnol. 2022, 40, 335–344. [Google Scholar] [CrossRef]
- Drake, H.L.; Gössner, A.S.; Daniel, S.L. Old acetogens, new light. Ann. N. Y. Acad. Sci. 2008, 1125, 100–128. [Google Scholar] [CrossRef]
- Ragsdale, S.W. Enzymology of the Wood-Ljungdahl pathway of acetogenesis. Ann. N. Y. Acad. Sci. 2008, 1125, 129–136. [Google Scholar] [CrossRef]
- Fackler, N.; Heijstra, B.D.; Rasor, B.J.; Brown, H.; Martin, J.; Ni, Z.F.; Shebek, K.M.; Rosin, R.R.; Simpson, S.D.; Tyo, K.E.; et al. Stepping on the gas to a circular economy: Accelerating development of carbon-negative chemical production from gas fermentation. Annu. Rev. Chem. Biomol. 2021, 12, 439–470. [Google Scholar] [CrossRef]
- Schuchmann, K.; Müller, V. Autotrophy at the thermodynamic limit of life: A model for energy conservation in acetogenic bacteria. Nat. Rev. Microbiol. 2014, 12, 809–821. [Google Scholar] [CrossRef] [PubMed]
- Wiechmann, A.; Müller, V. Energy Conservation in the Acetogenic Bacterium. Microorganisms 2021, 9, 258. [Google Scholar] [CrossRef]
- Kremp, F.; Roth, J.; Müler, V. A third way of energy conservation in acetogenic bacteria. Microbiol. Spectr. 2022, 10, e01385-22. [Google Scholar] [CrossRef] [PubMed]
- Ljungdahl, L.G. The autotrophic pathway of acetate synthesis in acetogenic bacteria. Annu. Rev. Microbiol. 1986, 40, 415–450. [Google Scholar] [CrossRef]
- Doukov, T.I.; Iverson, T.M.; Seravalli, J.; Ragsdale, S.W.; Drennan, C.L. A Ni-Fe-Cu center in a bifunctional carbon monoxide dehydrogenase/acetyl-CoA synthase. Science 2002, 298, 567–572. [Google Scholar] [CrossRef] [PubMed]
- Yin, M.D.; Lemaire, O.N.; Rosas Jimenez, J.G.; Belhamri, M.; Shevchenko, A.; Hummer, G.; Wagner, T.; Murphy, B.J. Conformational dynamics of a multienzyme complex in anaerobic carbon fixation. Science 2025, 387, 498–504. [Google Scholar] [CrossRef]
- Tremblay, P.L.; Zhang, T.; Dar, S.A.; Leang, C.; Lovley, D.R. The Rnf complex of Clostridium ljungdahlii is a proton-translocating ferredoxin:NAD+ oxidoreductase essential for autotrophic growth. Mbio 2013, 4, e00406-12. [Google Scholar] [CrossRef]
- Wang, S.N.; Huang, H.Y.; Kahnt, J.; Mueller, A.P.; Köpke, M.; Thauer, R.K. NADP-specific electron-bifurcating [FeFe]-hydrogenase in a functional complex with formate dehydrogenase in Clostridium autoethanogenum grown on CO. J. Bacteriol. 2013, 195, 4373–4386. [Google Scholar] [CrossRef]
- Zhu, H.F.; Liu, Z.Y.; Zhou, X.; Yi, J.H.; Lun, Z.M.; Wang, S.N.; Tang, W.Z.; Li, F.L. Energy conservation and carbon flux distribution during fermentation of CO or H2/CO2 by Clostridium ljungdahlii. Front. Microbiol. 2020, 11, 416. [Google Scholar] [CrossRef]
- Yi, J.H.; Huang, H.Y.; Liang, J.Y.; Wang, R.F.; Liu, Z.Y.; Li, F.L.; Wang, S.N. A heterodimeric reduced-ferredoxin-dependent methylenetetrahydrofolate reductase from syngas-fermenting Clostridium ljungdahlii. Microbiol. Spectr. 2021, 9, e0095821. [Google Scholar] [CrossRef]
- Mock, J.; Wang, S.N.; Huang, H.Y.; Kahnt, J.; Thauer, R.K. Evidence for a hexaheteromeric methylenetetrahydrofolate reductase in Moorella thermoacetica. J. Bacteriol. 2014, 196, 3303–3314. [Google Scholar] [CrossRef] [PubMed]
- Öppinger, C.; Kremp, F.; Müller, V. Is reduced ferredoxin the physiological electron donor for MetVF-type methylenetetrahydrofolate reductases in acetogenesis? A hypothesis. Int. Microbiol. 2022, 25, 75–88. [Google Scholar] [CrossRef] [PubMed]
- Müller, V. Energy conservation in acetogenic bacteria. Appl. Environ. Microbiol. 2003, 69, 6345–6353. [Google Scholar] [CrossRef] [PubMed]
- Rosenbaum, F.P.; Müller, V. Energy conservation under extreme energy limitation: The role of cytochromes and quinones in acetogenic bacteria. Extremophiles 2021, 25, 413–424. [Google Scholar] [CrossRef]
- Liu, Z.Y.; Jia, D.C.; Zhang, K.D.; Zhu, H.F.; Zhang, Q.; Jiang, W.H.; Gu, Y.; Li, F.L. Ethanol metabolism dynamics in Clostridium ljungdahlii grown on carbon monoxide. Appl. Environ. Microbiol. 2020, 86, e00730-20. [Google Scholar] [CrossRef]
- Liew, F.; Henstra, A.M.; Köpke, M.; Winzer, K.; Simpson, S.D.; Minton, N.P. Metabolic engineering of Clostridium autoethanogenum for selective alcohol production. Metab. Eng. 2017, 40, 104–114. [Google Scholar] [CrossRef]
- Lubner, C.E.; Jennings, D.P.; Mulder, D.W.; Schut, G.J.; Zadvornyy, O.A.; Hoben, J.P.; Tokmina-Lukaszewska, M.; Berry, L.; Nguyen, D.M.; Lipscomb, G.L.; et al. Mechanistic insights into energy conservation by flavin-based electron bifurcation. Nat. Chem. Biol. 2017, 13, 655–659. [Google Scholar] [CrossRef]
- Peters, J.W.; Miller, A.F.; Jones, A.K.; King, P.W.; Adams, M.W.W. Electron bifurcation. Curr. Opin. Chem. Biol. 2016, 31, 146–152. [Google Scholar] [CrossRef]
- Yang, Y.J.; Qiao, K.Y.; Yu, Y.R.; Zong, Y.M.; Liu, C.; Li, Y. Unravelling potential biomarkers for acute and chronic brucellosis through proteomic and bioinformatic approaches. Front. Cell. Infect. Microbiol. 2023, 13, 1216176. [Google Scholar] [CrossRef]
- Sun, H.L.; Luan, G.D.; Ma, Y.F.; Lou, W.J.; Chen, R.Z.; Feng, D.D.; Zhang, S.S.; Sun, J.H.; Lu, X.F. Engineered hypermutation adapts cyanobacterial photosynthesis to combined high light and high temperature stress. Nat. Commun. 2023, 14, 1238. [Google Scholar] [CrossRef]
- Tanner, R.S.; Miller, L.M.; Yang, D. Clostridium ljungdahlii sp. nov., an acetogenic species in clostridial rRNA homology group I. Int. J. Syst. Bacteriol. 1993, 43, 232–236. [Google Scholar] [CrossRef]
- Xie, B.T.; Liu, Z.Y.; Tian, L.; Li, F.L.; Chen, X.H. Physiological response of Clostridium ljungdahlii DSM 13528 of ethanol production under different fermentation conditions. Bioresour. Technol. 2015, 177, 302–307. [Google Scholar] [CrossRef] [PubMed]
- Moon, H.G.; Jang, Y.S.; Cho, C.; Lee, J.; Binkley, R.; Lee, S.Y. One hundred years of clostridial butanol fermentation. FEMS Microbiol. Lett. 2016, 363, fnw001. [Google Scholar] [CrossRef] [PubMed]
- Lütke-Eversloh, T.; Bahl, H. Metabolic engineering of Clostridium acetobutylicum: Recent advances to improve butanol production. Curr. Opin. Biotech. 2011, 22, 634–647. [Google Scholar] [CrossRef] [PubMed]
- Tan, Y.; Liu, Z.Y.; Liu, Z.; Li, F.L. Characterization of an acetoin reductase/2,3-butanediol dehydrogenase from Clostridium ljungdahlii DSM 13528. Enzym. Microb. Technol. 2015, 79–80, 1–7. [Google Scholar] [CrossRef]
- Valgepea, K.; Loi, K.Q.; Behrendorff, J.B.; Lemgruber, R.D.P.; Plan, M.; Hodson, M.P.; Köpke, M.; Nielsen, L.K.; Marcellin, E. Arginine deiminase pathway provides ATP and boosts growth of the gas-fermenting acetogen. Metab. Eng. 2017, 41, 202–211. [Google Scholar] [CrossRef]
- Valgepea, K.; Lemgruber, R.D.P.; Abdalla, T.; Binos, S.; Takemori, N.; Takemori, A.; Tanaka, Y.; Tappel, R.; Köpke, M.; Simpson, S.D.; et al. H2 drives metabolic rearrangements in gas-fermenting. Biotechnol. Biofuels 2018, 11, 55. [Google Scholar] [CrossRef]
Disclaimer/Publisher’s Note: The statements, opinions and data contained in all publications are solely those of the individual author(s) and contributor(s) and not of MDPI and/or the editor(s). MDPI and/or the editor(s) disclaim responsibility for any injury to people or property resulting from any ideas, methods, instructions or products referred to in the content. |
© 2025 by the authors. Licensee MDPI, Basel, Switzerland. This article is an open access article distributed under the terms and conditions of the Creative Commons Attribution (CC BY) license (https://creativecommons.org/licenses/by/4.0/).