Article

The Optimization of the Nutrient Medium Composition for the Submerged Cultivation of the Mycolicibacterium neoaurum Strain VKM Ac-3067D in a 100 L Bioreactor Under Controlled Conditions by Mathematical Planning

by
Vera V. Yaderets
,
Nataliya V. Karpova
,
Elena V. Glagoleva
,
Alexandra S. Shibaeva
and
Vakhtang V. Dzhavakhiya
*
Laboratory of Biotechnology of Industrial Microorganisms, Department of Biotechnology and Technology of Bioorganic Synthesis Products, Russian Biotechnological University (ROSBIOTECH), Moscow 125080, Russia
*
Author to whom correspondence should be addressed.
Fermentation 2025, 11(2), 82; https://doi.org/10.3390/fermentation11020082
Submission received: 31 December 2024 / Revised: 24 January 2025 / Accepted: 28 January 2025 / Published: 7 February 2025

Abstract

The biotechnological production of carotenoids offers a promising alternative to their chemical synthesis or extraction from plants. Mycolicibacterium species have shown potential as pigment-producing microorganisms. However, bacterial strains typically exhibit lower productivity compared to fungal and yeast strains. Earlier, we enhanced the β-carotene biosynthesis in M. neoaurum strain VKM Ac-3067D by modifying the cultivation medium. Key changes included replacing glucose with glycerol and soybean meal with skimmed milk powder (SMP) and increasing the urea content from 0.5 to 1.0 g/L. To further optimize β-carotene yield, a steepest ascent method was applied combining factorial design with a gradient-based optimization (Wilson–Box method). The resulting regression model showed that the most influential factors were the glycerol concentration and SPM use. The in-flask fermentation of the Ac-3067D strain in a medium containing 25.5 g/L of glycerol (carbon source) and 12.80 g/L of SMP (nitrogen source) increased β-carotene yield to 318.4 ± 8.3 mg/kg. In a 15 L bioreactor, β-carotene yield increased to 432.3 ± 10.4 mg/kg, while the biomass concentration reached 23.2 ± 1.2 g/L. The further scaling up to a 100 L bioreactor increased both β-carotene yield (450.4 ± 8.2 mg/kg) and biomass concentration (25.2 ± 1.1 g/L). Thus, β-carotene production technology using the M. neoaurum strain AC-3067D was successfully scaled up from 750 mL flasks to a 100 L bioreactor, confirming its potential for industrial-scale application.

1. Introduction

A high biological activity of carotenoids and their wide range of applications determine the ongoing interest of researchers in finding effective methods for their production [1,2,3,4,5]. According to the available data, there are three main methods of the production of these compounds, chemical synthesis [6,7], extraction [3,6,8,9,10], and biosynthesis, which is based on the use of various microorganisms including fungi, yeast, bacteria, and microalgae [2,3,4,5].
To date, the majority of commercial carotenoids on the global market are of a chemical origin [11,12] that is explained by low production costs, relatively high yield of target products, and the lack of the productivity dependence on a season [12]. However, chemical synthesis has several drawbacks. First, not all carotenoids can be produced via chemical synthesis. Second, toxic by-products are generated during their production, thus contributing to environmental pollution. Third, chemically synthesized compounds can differ from their natural analogues in their isomeric composition and effectiveness, and may also cause allergic and other undesirable reactions. For example, natural astaxanthin consists mainly of esterified forms (95%), while synthetic astaxanthin is non-esterified; as a result, natural astaxanthin is 50-fold more effective in relation to the singlet oxygen neutralization and 20-fold more effective in scavenging of free radicals [13]. In addition, a global trend to prefer natural carotenoids has been observed in recent years among consumers. All these facts suggest that in the nearest future, the focus of carotenoid production may shift towards the use of natural sources.
Technologies related to the carotenoid extraction from natural plant sources are certainly positively assessed by consumers. However, the stability of the manufacturing processes is complicated by a seasonality of carotenoid sources, relatively low yield, and the need for the purification of the target product from other metabolites that does not completely meet the requirements of industrial production, and it is often labor-consuming, and requires significant land areas for the cultivation of target plants [14].
Bacteria represent another potential type of producers suitable for the microbiological production of carotenoids, because they are widely used in the large-scale production of various biological compounds and have a short life cycle [3,15,16,17]. The suitable producers may include either naturally pigmented bacteria, or genetically modified bacteria, which initially were not able to synthesize pigments.
The ability of a producer strain to synthesize compounds with specific properties depends not only on individual characteristics of the strain, but also on the conditions, under which the target product is obtained. Determining the composition of a cultivation medium is an effective method for increasing biosynthetic activity of microorganisms producing biologically active compounds [18,19]. The medium composition can be determined by two ways: empirical selection, or the use of mathematical design of experiments. The traditional empirical selection method is widely used for determining the optimal cultivation conditions for microorganisms [19]. However, experimental design makes it possible to simultaneously vary all factors and to provide a quantitative evaluation of the influence of key factors and interactions on the yield of the target parameter with smaller errors compared to the traditional one-factor methods [20,21,22,23,24]. The ultimate goal of the mathematical modeling is the controlled cultivation of producer strains to achieve the maximum yield of the biomass or target metabolites.
For example, modeling of the nutrient medium composition for Candida melibiosica strain 2491 enabled its optimization, so its use for the yeast cultivation increased the phytase biosynthesis by 22.5% [23]. This approach was also used in the planning of β-carotene production by Rhodotorula glutinis ATCC 4054. Rice bran, molasses, and sugarcane bagasse were tested as substrates. As a result, rice bran was found to be the best inexpensive substrate for the biomass growth and β-carotene production. Using mathematical planning, the optimal contents of medium components were determined, including sucrose (18.6 g/L), NaCl (0.66 g/L), and KH2PO4 (1.01 g/L). In addition, the optimal amount of the inoculum, pH (5.4), and stirring rate were established, which provided a several-fold increase in the biosynthesis of the target product [24].
Fast-growing, non-pathogenic bacteria from the genus Mycolicibacterium, which have been shown to synthesize β-carotene and lycopene as well as several other pigments [17,24,25,26], can be considered as promising producers of carotenoids. In our earlier studies, we developed the M. neoaurum strain AC-501/22 via chemical mutagenesis and optimized its cultivation conditions in a 3 L bioreactor to achieve a β-carotene yield of 262.4 mg/kg of dry biomass [27]. The strain was deposited in the All-Russian Collection of Microorganisms (accession number M. neoaurum VKM AC-3067D). The purpose of this study was the optimization of the nutrient medium composition using mathematical planning and its approbation under conditions of a submerged cultivation of the AC-3067D strain during the scaling up of the process from flasks to a 100 L bioreactor.

2. Materials and Methods

2.1. Reagents and Media Components

Skimmed milk powder was manufactured by HiMedia Laboratories (Mumbai, India). Urea was manufactured by NeoFroxx GmbH (Einhausen, Germany). Skimmed deodorated soybean flour was purchased from Soyanta 200 (Irkutsk, Russia). Citric acid was manufactured by Component-reactiv Ltd. (Moscow, Russia). Agar was manufactured by Difco (Detroit, MI, USA). Inorganic salts, glycerol, glucose, and organic solvents (acetone, hexane, benzene) were purchased from Acros Organics (Geel, Belgium).

2.2. Producer Strain

M. neoaurum strain AC-3067D was stored in the working collection of the Laboratory of Biotechnology of Industrial Microorganisms of the Russian Biotechnological University (Moscow, Russia).

2.3. Nutrient Media for M. neoaurum Cultivation and Maintenance

M. neoaurum VKM Ac-3067D was cultivated on the A1 medium of the following composition (g/L): agar, 17.0; glucose, 10.0; soybean meal, 10.0; citric acid, 2.2; urea, 0.5; NH4Cl, 1.0; KH2PO4, 0.5; MgSO4·7H2O, 0.5; FeSO4·7H2O, 0.05; and CaCO3, 1.5 (pH 6.8–7.2). After being stored on an agarized medium at 4 °C for one month, the cultures were transferred to a fresh medium. For long-term preservation, the cultures were freeze-dried with a powdered milk as a carrier and stored at 4 °C.

2.4. Cultivation of M. neoaurum VKM Ac-3067D on a Liquid Nutrient Medium

The control liquid medium (AM medium) used for the further modification had the following composition (g/L): glycerol, 20.0; skimmed milk powder (SMP), 10.0; citric acid, 2.2; urea, 1.0; NH4Cl, 1.0; KH2PO4, 0.5; MgSO4·7H2O, 0.5; FeSO4·7H2O, 0.05; and CaCO3, 1.5 (pH 6.8–7.2).
The inoculum was prepared as follows. A tube containing the bacterial culture was supplemented with 10 mL of a sterile physiological solution. The agar surface was gently scraped using an inoculation loop, and the obtained cell suspension was transferred into 750 mL flasks containing 100 mL of the AM medium followed by the 48-h incubation of flasks at 220 rpm and 35 °C in an Innova 44 shaker (New Brunswick, Germany). The obtained inoculate (10 vol. %) was then transferred to fresh flasks containing 100 mL of the same medium and cultivated for 72 h under identical conditions. The resulting culture broth was either used to inoculate the bioreactor, or dried and then analyzed for the carotenoid content.

2.5. Carotenoid Content Determination

The carotenoid content in the cell biomass of M. neoaurum VKM Ac-3067D was measured spectrophotometrically [27]. The procedure was conducted under low illumination with the room temperature maintained below 20 °C. A 30-mL aliquot of culture broth was centrifuged for 5 min at 7500 rpm. The supernatant was discarded, and the remaining biomass underwent a 3-fold extraction using 10 mL of acetone. The resulting acetone extracts were pooled, transferred into a separating funnel, and mixed with petroleum ether (10 mL). After vigorous shaking, the resulted emulsion was broken by a adding a saturated NaCl solution dropwise. Once the acetone layer separated, the solution was re-extracted with petroleum ether. The petroleum ether extracts were pooled and filtered through a glass filter. The absorption spectrum of the carotenoid extract was recorded at 450 nm using a Thermo Spectronic spectrophotometer (Thermo Fisher Scientific, Waltham, MA, USA) with petroleum ether used as a reference. The total carotenoid content was determined using the following formula:
C a r o t e n o i d c o n t e n t ( μ g / g d . w . ) = V ( m L ) × A 450 × 10 6 2592 × 100 × m ( g ) ,
where A450 is the experimentally determined adsorption of the measured solution; 2592 is the value of a 1% extinction; and m is the weight of dried cells (g).

2.6. Nutrient Medium Optimization Using the Mathematical Planning Method (Complete Factorial Experiment, CFE 23)

2.6.1. Nutrient Medium Optimization by a Complete Factorial Experiment (CFE)

To perform the nutrient medium optimization by CFE [28], three factors were chosen: glycerol concentration (X1), SPM concentration (X2), and urea concentration (X3). Variations of these factors were arranged on two levels, bottom (–1) and upper (+1). The plan center (Z) was chosen based on the research executed on the influence of these components on the β-carotene biosynthesis and the biomass yield [28]. The sizes of variation steps (δ) for these factors are shown in Table 1.
The number of experiments N was determined by the following formula:
N = n × k,
where n is the number of the levels of variation and k is the number of factors.
The regression coefficients were determined using Formulas (3) and (4):
b 0 = y ¯ N ,
b i = x i u y ¯ u N ,
where N is the number of experiments calculated by Formula (2), ȳ is the experimentally obtained value of the parameter, xiu is the value of the variable in the corresponding column of the experiment plan, u is the number of the experimental variant, and i is the number of a factor.
The coefficients of interaction (b12, b13, b23, b123) were determined using Formulas (5) and (6):
b i j = u = l N x i u x j i y ¯ u N
b i j k = u = l N x i u x j i x k u y ¯ u N
where xiu, xju, and xku are variable values in the corresponding column of the planning matrix and ȳu is the average value of the optimization parameter.
The line-by-line dispersion was determined by Formula (7):
S y u l 2 = y u l 2 y u l 2 m m 1 ,
where u is the row number in the planning matrix, l is the number in each row, and m is the number of parallel experiments.
A single-value dispersion is calculated using Formulas (8) and (9):
S b i 2 = S y u l 2 m N 2 ,
S b i = S b i 2 .
The error determination is calculated by Formula (10):
|bi|= t × Sbi,
where t is Student’s coefficient at t0.9S determined as a tabulated value for the given number of the degrees of freedom (f).
Degrees of freedom were calculated using Formulas (11) and (12):
f = (m1) ·N,
where m is the number of parallel experiments and N is the total number of experiments.
fad = NN′,
where N is the number of experiments and N′ is the number of significant regression coefficients.
The dispersion of adequacy was calculated using Formula (13):
S a d 2 = y ¯ u y u 2 N N ,
where N is the total number of experiments, N′ is the number of significant regression coefficients including b0, ȳ is the experimentally obtained factor value, and y is the factor value calculated by the obtained regression formula.
Then, using Formula (14), the dispersion of reproduction was calculated:
S y ¯ 2 = S y u l 2 m M .
The Fisher criterion was calculated using Formula (15):
F p = S a d 2 S y ¯ 2 .
The uniformity and reproducibility of the experiment were evaluated by the Cochran test (Gp) using table data.

2.6.2. Nutrient Medium Optimization Using the Steepest Ascent Method

The nutrient medium optimization by the steepest ascent method was performed according to [29]. After the assessment of the adequacy of the regression equation and the fulfillment of the Fm > Fp condition, the next optimization stage is carried out using the above-mentioned method. First, the Li coefficient is found according to Formula (16) to calculate the steepest ascent program:
Li = δ × bi,
where δ is the variation step and bi is the regression coefficient.
The Li value can be either positive or negative. Therefore, the factor can either increase or decrease. The factor with the maximum |Li| value is considered as the basic one. Then, the new γi coefficients are calculated using Formula (17):
γ i = L i L max .
In the case of the base factor (hbase, Formula (18)), the step for the movement along the gradient is calculated according to Formula (19). First, the “reserve” for the movement along each factor from the basic level up to a practical worthwhile value in the decreasing or increasing direction is calculated by Formula (19).
h b a s e = Δ i n ,
Δ i = X i max X i 0 Δ i = X i 0 X i min ,
were n is the number of steps towards the maximum or minimum value of the Ximax factor. The n number is chosen arbitrarily; as a rule, it varies within 5–8 steps.
The movement step for other factors is calculated using Formula (20):
h = h b a s e × γ i
If the regression coefficient of a planning factor is insignificant, then during a calculation of the steepest ascent program, it can be used at the basic level. A new matrix is constructed on the basis of the performed calculations, and then new experiments are performed.
All experiments on the mathematical planning were performed three times, each in three replications. The data shown in the Section 3 represent the means of these experiments.

2.7. M. neoaurum Fermentation in a 3 L Bioreactor

2.7.1. Inoculum Preparation

The procedure of inoculum obtaining was similar to that described in Section 2.4; the following medium composition was used (g/L): glycerol, 25.5; powdered milk, 12.8; citric acid, 2.2; urea, 1.0; NH4Cl, 1.0; KH2PO4, 0.5; MgSO4·7H2O, 0.5; FeSO4·7H2O, 0.05; and CaCO3, 1.5 (pre-sterilization pH 6.8–7.2). Prior to the inoculation of the bioreactor, the inoculum was microscoped using a Carl Zeiss Primo Star microscope (Carl Zeiss, Jena, Germany) for the quality control. The inoculum volume further used for the bioreactor seeding was 10% of the fermentation medium volume (150 mL). The inoculum was added in the bioreactor via a sterile inoculum feeding line.

2.7.2. Bioreactor Preparation and Fermentation

M. neoaurum fermentation in a 3 L bioreactor was performed as described earlier [27]. After the completion of the process, the biomass was inactivated by a 30-min heating at 80–85 °C with continuous stirring, then transferred out into a collection vessel, centrifuged, and dried in a Martin Christ ALPHA 2-4LD plus freeze dryer (Martin Christ Gefriertrocknungsanlagen GmbH, Osterode am Harz, Germany).

2.8. M. neoaurum Fermentation in a 15 L Bioreactor

2.8.1. Inoculum Preparation

An inoculum was produced in accordance with the procedure described in Section 2.4; the medium composition was the same as described in Section 2.7.1. The inoculum obtained in flasks was combined under sterile conditions into one 2 L flask with the bottom outlet. The total volume of the inoculum was 1.0 L. Prior to the inoculation of the bioreactor, the quality of inoculum was examined using a Carl Zeiss Primo Star microscope (Carl Zeiss, Jena, Germany). The inoculum was transferred into the bioreactor via a sterile inoculum feeding line.

2.8.2. Bioreactor Preparation

The fermentation system used in the study consisted of a computer-based automatic control unit and three 15 L bioreactors (Prointech-Bio, Pushchino, Russia) connected via the coupling elements with the feed lines for the direct steam, compressed air, and water. The effective volume of bioreactors was 10 L. The units for monitoring culture broth parameters included a Buk-3 thermal sensor connected to a controller (Keklab Group, Moscow, Russia); an InPro 6800/12/220 oxygen sensor (Mettler Toledo, Greifensee, Switzerland) connected to a controller regulating the work of the mechanical stirring device; and an InPro3300/225/PT1000 pH sensor (Mettler Toledo, Greifensee, Switzerland) connected via a controller to a peristaltic pump delivering a titrating solution.
Bioreactors were equipped with 0.2 μm fine filters for compressed air. The preparation and sterilization of the fermentation medium (see Section 2.8.1 for the medium composition) were carried out directly within the bioreactor. Preliminarily, bioreactors with the air filters were sterilized for 1 h at 121 ± 2 °C. Then, all components of the fermentation medium were sequentially loaded into each bioreactor through a receiver, and the volume of the medium was adjusted to 10.0 L with purified water. If necessary, the pH level was adjusted to 6.8–7.2. The medium was sterilized for 1 h at 125 ± 1 °C by introducing direct steam into the bioreactor through a bubbler, sample collector, and bottom outlet.

2.8.3. M. neoaurum Fermentation

The pre-inoculation fermentation regime is shown in Table 2. The level of pO2 was controlled by changing the air supply volume to culture broth volume ratio (manual mode) via changes in the stirrer’s rpm number (automatic mode). For both regimes, the fermentation process duration was 82 h. The basic fermentation parameters are shown in Table 3.
Upon the completion of fermentation, the biomass of M. neoaurum was either inactivated (see Section 2.7.2) or transferred via a seed train to seed a 100 L bioreactor.

2.9. M. neoaurum Fermentation in a 100 L Bioreactor

2.9.1. Inoculum Preparation

The inoculum for the bioreactor was obtained as described in Section 2.8.

2.9.2. Bioreactor Preparation

A 100 L bioreactor was connected via the control unit with the feed lines for the steam, compressed air, and water as well as with an automatic control unit. The effective volume of the bioreactor ranged from 60 to 70 L. The measurement devices required to control fermentation medium parameters included a Buk-3 thermal sensor connected to a controller (Keklab Group, Moscow, Russia), an InPro 6800/12/220 sensor for dissolved oxygen (Mettler Toledo, Greifensee, Switzerland), connected via a controller to the mechanical stirring device, and an InPro3300/225/PT1000 pH sensor (Mettler Toledo, Greifensee, Switzerland) intended to manage the supply of a titrant solution by a peristaltic pump via the controller.
The fermentation medium was mixed by a mechanical stirring device characterized by the motor located on the top and the end seal; the stirring rate ranged from 50 to 600 rpm. The pO2 level was regulated by manual adjusting the air flow volume compared to the fermentation medium volume and by automatic change in the stirring rate. The medium was sterilized directly in the bioreactor. After sterilization, the air flow rate and the pressure within the bioreactor were set to be 35 L/min and 0.03 MPa, respectively; the dissolved oxygen concentration in the medium was set to 100%. After the cooling of the bioreactor to 29–30 °C, a sterile medium sample was taken for a microbiological analysis.

2.9.3. M. neoaurum Fermentation

The pre-inoculation fermentation regime is shown in Table 4. The pO2 level was regulated by manual adjusting the air flow rate relative to the volume of the culture medium with the automatic changes in the rpm number of the stirrer. For both regimes, the process was conducted for 72–74 h. The basic fermentation parameters are shown in Table 5.
Upon the completion of fermentation, the biomass of M. neoaurum was inactivated (see Section 2.7.2) and collected into a collector. After centrifugation, it was dried in a Martin Christ ALPHA 2-4LD plus freeze dryer (Martin Christ Gefriertrocknungsanlagen GmbH, Osterode am Harz, Germany).

3. Results

3.1. Optimization of Nutrient Medium Composition by CFE 23

In this study, the composition of the nutrient medium was optimized by the steepest ascent method, which combines CFE with the Wilson–Box method. The planning factors included the concentrations of glycerol, a surfactant (SMP), and urea (see Table 1). The output parameter of optimization (y) was determined as the content of β-carotene (mg/g) in the culture broth (CB). The number of experiments was determined using Formula (2) (N = 8 for this study); based on this, the experimental planning matrix for CFE 23 was constructed (Table 6). Using this matrix, a series of experiments was conducted, each in three replications. The results are shown in Table 3.
The mathematical model equation should be the following:
y ¯ = b 0 + b 1 x 1 + b 2 x 2 + b 3 x 3 ,
where ȳ is the process optimization parameter, bi is a regression coefficient indicating the influence of factors on the optimization parameters, and x is the value of a factor level in encoded units. The homogeneity and reproducibility of the experiment were evaluated using Cochran’s criterion (Gp). For the obtained data, Gp = 0.2594, which is less than the tabulated value for the used degrees of freedom (0.2594 < 0.5157). Thus, we concluded that the obtained data are homogenous and reproducible.
To determine the direction of action for each factor, regression coefficients were calculated using Formulas (3) and (4): b0 = 202.56, b1 = 11.75, b2 = 8.44, and b3 = 2.05. Then, using the data presented in Table 6, the significance of the calculated regression coefficients was determined for m = 3, where m is the number of parallel experiments. The line-by-line dispersion was calculated using Formula (7), where m = 3 represents the number of parallel experiments and N = 8 represents the total number of experiments. The results are shown in Table 7.
Using Formulas (8) and (9), a single-value dispersion (Sbi) was calculated to be equal to 2.02. Then, using Formula (10) with t = 2.09, the error determination was calculated ( t S b i = 4.21). Therefore, regression coefficients are significant in the case when |bi| > 4.21, and the regression equation takes the following form:
y = 202.56 + 11.75 x 1 + 8.44 x 2
To evaluate the adequacy of the obtained linear approximation equation, Equation (21), the β-carotene yield (y) was calculated for each variant. The x1 and x2 values were taken from Table 6. The results of the performed calculations are shown in Table 8.
Using Formula (12), the dispersion of adequacy S a d 2 was determined at NN′ = 5. According to the performed calculations, S a d 2 = 164.33. Using Formula (13), the dispersion of reproducibility S y 2 = 32.51 was calculated. The Fisher criterion Fp = 5.05 was calculated by Formula (14).
The tabulated value of the Fisher criterion (Ft) is located at the intersection of the values of the degree of freedom of the dispersion of adequacy (fad = 5) and the number of degrees of freedom of the dispersion of reproducibility (f = 16).
Since Fp > Ft (5.05 > 2.85), then, first, the equation is inadequate (i.e., the process cannot be described by the linear approximation equation). Second, the obtained results evidence that the process is close to the near-optimum area, when the influence of the interaction between factors is enhanced.
If the process cannot be described by the linear approximation equation, it is possible to use a complete factorial experiment with allowance for all interactions between factors. A new planning matrix and the results obtained during the experiment implementation are shown in Table 9.
The regression equation obtained by the use of CFE 23 is the following:
y = b0 + b1x1 + b2x2 + b3x3 + b12x1x2 + + b13x1x3 + + b23x2x3 + b123x1x2x3.
Using Formulas (3)–(6), coefficients of regression were calculated. The regression equation has the following form:
y = 202.56 + 11.75x1 + 8.44x2 − 6.05x2x3 − 6.5x1x2x3
Then, the adequacy of the obtained linear approximation equation, Equation (22), was determined. To achieve this, a dry biomass yield (y) was calculated for each variant using the regression equation. The results of this calculation are shown in Table 10.
The dispersion of adequacy was calculated using Formula (13). According to the performed calculations, the dispersion of adequacy was equal to 98.60. The dispersion of reproduction calculated earlier by Formula (14) was 32.51. The Fisher criterion Fp calculated by Formula (15) was equal to 3.03. The tabulated value of the Fisher criterion (Ft) was determined at fad = 3 and f = 16. Since Fp < Ft (3.03 < 3.24), then, the obtained regression equation (Formula (21)) is adequate to the studied process. Therefore, the biomass yield within the studied concentration range is positively influenced by an increase in the glycerol and SMP concentrations. At the same time, the effect of these factors is enhanced in the case of a combined action of x1 and x2 or x1, x2, and x3 factors (if these factors are at the highest coordination level).

3.2. The Optimization of the Nutrient Medium Composition by the Steepest Ascent Method

Based on the results of the performed CFE, one can suppose the efficiency of the steepest ascent method for the further medium optimization. Since the coefficient of regression b3 was determined as insignificant, then the urea concentration was further considered as a constant variable equal to 1.0 g/L.
The initial data required for the construction of a new planning matrix are shown in Table 11.
Since the value of the γi coefficient for glycerol is less than that for SMP, this factor was considered as the base one. The steepest ascent steps for glycerol and SMP are presented in Table 11. In all variants, the urea concentration was 1.0 g/L. A new experimental design matrix was created, and the β-carotene yield was determined. The results are shown in Table 12.
The maximum β-carotene yield (318.4 ± 8.3 mg/kg) was obtained for variant 3, where the nutrient medium contained 25.5 g/L of glycerol and 12.8 g/L SMP. The further increase in the glycerol and SMP concentrations up to 30.0 and 14.75 g/L, respectively, was accompanied with the inhibition of a pigment accumulation process.
Thus, a new composition of the fermentation medium was proposed. The next stage of work included the examination of this medium composition for the cultivation of M. neoaurum in a 3 L bioreactor.

3.3. M. neoaurum Fermentation in a 3 L Bioreactor

Earlier, we studied the effect of the temperature, dissolved oxygen level, and acidity of a culture medium on the biomass accumulation and β-carotene production by M. neoaurum [27]. The optimal pH values were found to fall within the range of 6.8–7.0, and the optimal O2 concentration was 50%. Therefore, these parameters were maintained at a constant level during M. neoaurum fermentation in the bioreactor as described in the Section 2.
After 30 h of fermentation, a sterile 50% glycerol solution (2.5 g/L of fermentation medium) was added under controlled optimal pH and O2 concentration (6.8–7.2 and 50%, respectively). Glycerol addition started automatically, when pH exceeded 7.0, and the dissolved oxygen concentration decreased. The results are shown in Figure 1. The productivity of M. neoaurum in terms of the β-carotene production and the maximum biomass increase was recorded after 72 h of fermentation and reached 370.5 mg/kg and 25.4 g/L, respectively.

3.4. M. neoaurum Fermentation in a 15 L Bioreactor

The fermentation of M. neoaurum in a 15 L bioreactor was performed under the same conditions as described in Section 3.3. The results are shown in Figure 2. The β-carotene productivity of M. neoaurum and the maximum biomass yield observed after 72 h of fermentation reached 432.3 ± 10.4 mg/kg and 23.2 ± 1.2 g/L, respectively.

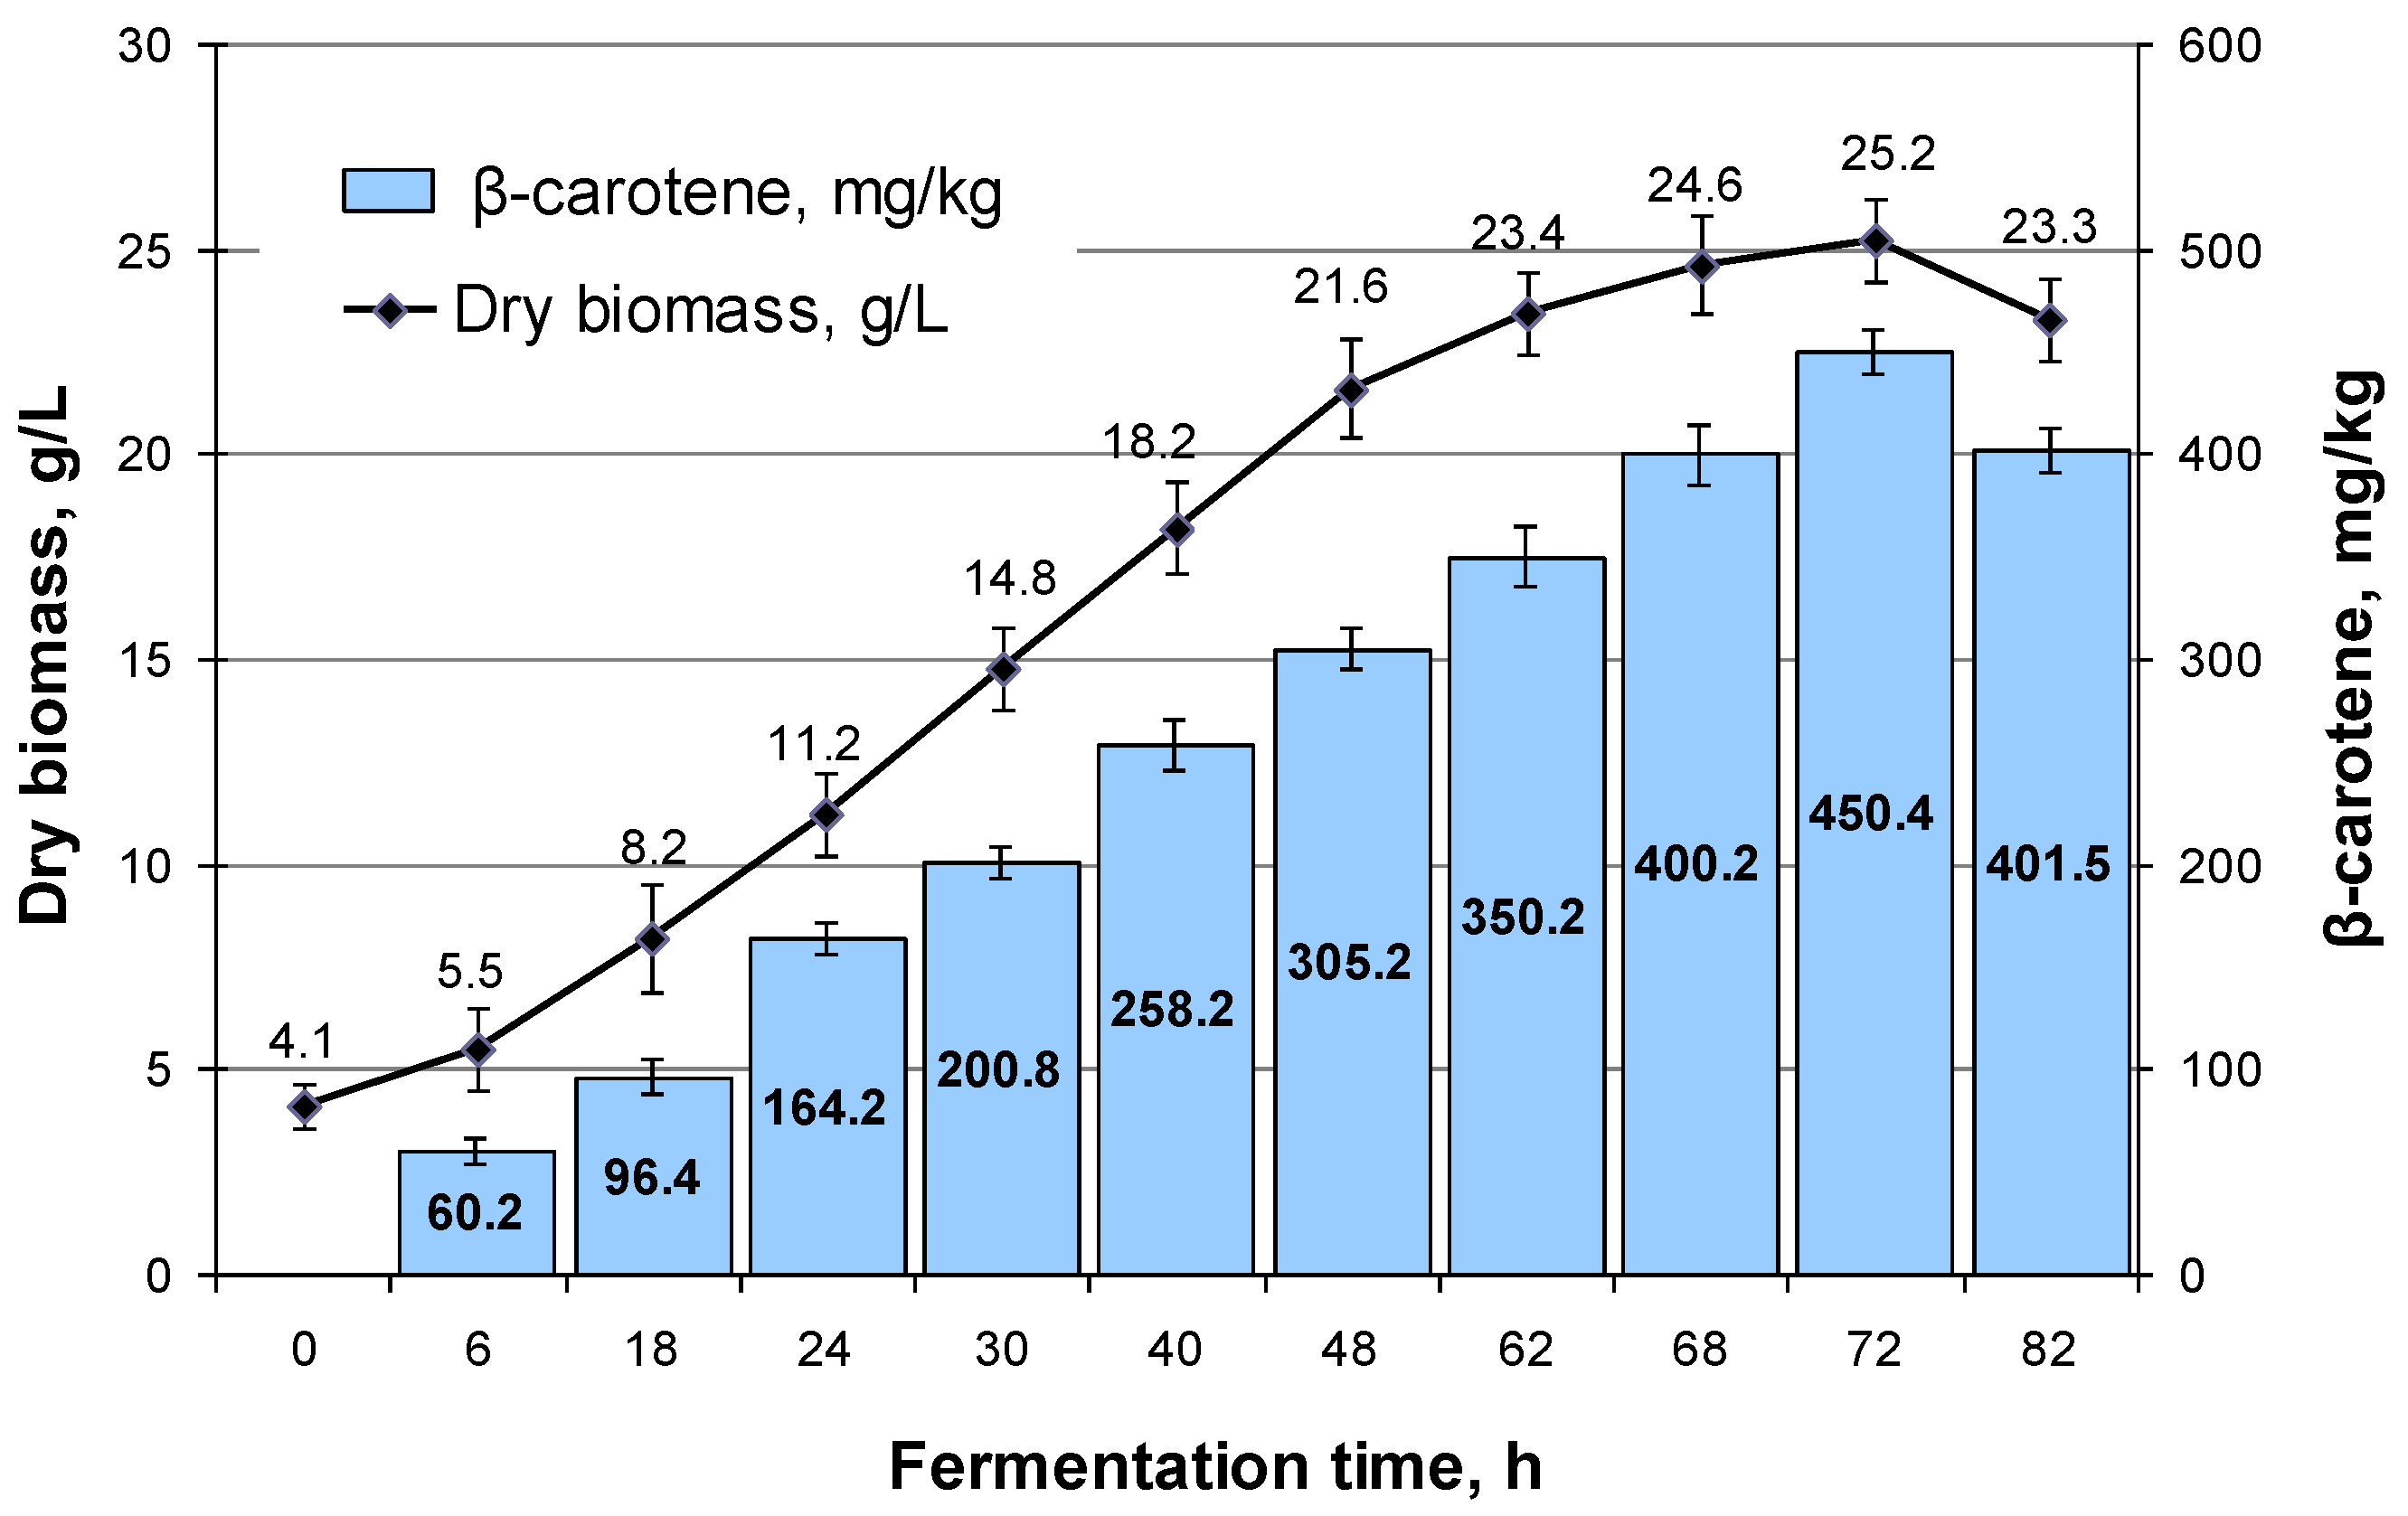
3.5. M. neoaurum Fermentation in a 100 L Bioreactor

The fermentation of M. neoaurum in a 100 L bioreactor was performed under the constant pH (6.8–7.2), and the pO2 value of 50% or more. After 30 h of fermentation, a sterile 50% glycerol solution (2.5 g/L of fermentation medium) was added in an automatic mode. The results are shown in Figure 3. The β-carotene productivity and the maximum biomass yield of the Ac-3067D strain observed after 72 h of fermentation reached 450.4 ± 8.2 mg/kg and 25.2 ± 1.1 g/L, respectively.

4. Discussion

One of the most challenging tasks for biotechnological processes based on the use of overproducing strains is the selection and optimization of fermentation conditions. The analysis of numerous data shows that the growth of a culture and the biosynthesis of secondary metabolites are influenced by such factors as the viability of the planting material, the composition of the cultivation medium, and physicochemical conditions of fermentation. However, one should note that optimal conditions for the cell growth and the target product biosynthesis may not coincide [29,30,31].
Traditional approaches for the optimization of the β-carotene production are based on the change in one parameter at a time. However, this approach often does not allow a researcher to determine variables responsible for the optimal result, since such approaches do not take into account possible interaction between different factors [24]. One of the effective methods for optimizing cultivation conditions is a combination of the experimental and mathematical modeling with the conduction of a computational experiment, which includes an important step, namely, the determination of a mathematical model, i.e., a regression equation, which characterizes the relationship between the optimization parameter and the main factors. An approach based on the design of experiments (DOE) makes it possible to not only efficiently evaluate the main effects and interactions using a minimal number of experiments, but also relatively rapidly conclude on the significance of various components of the nutrient medium as well as to determine its qualitative and quantitative composition [20,21,22,23,24]. Mathematical modeling is widely used to determine optimal cultivation conditions for highly active strains. Numerous publications describe different examples of the DOE use for the development of processes occurring in biotechnological plants. However, one should note that this study represents the first attempt to use mathematical modeling for the optimization of the M. neoaurum cultivation conditions.
This study investigated the influence of three key factors (glycerol, SMP, and urea) on the β-carotene productivity of M. neoaurum. We found that glycerol and SMP provided the greatest impact on the pigment yield. The stimulation of the carotenoid biosynthesis can be explained by the fact that glycerol is involved in the biosynthesis of isoprenoids representing precursors of carotenoids (Figure 4). Use of glycerol as a carbon source for the β-carotene biosynthesis was also demonstrated in some other studies. For example, Bindea et al. [32] studied the effect of pH and glycerol concentration on a pigment accumulation. In addition, a positive effect of a glycerol addition into the nutrient medium on the carotenoid biosynthesis was reported by Suwaleerat et al. [33] for Rhodococcus opacus PD630. According to the obtained regression equation, the factors that have the greatest influence on the biosynthesis of β-carotene by M. neoaurum cells include glycerol and SMP concentrations. Using the mathematical planning method, the optimal values of these concentrations were determined as 25.5 and 12.80 g/L, respectively.
The influence of the nitrogen sources on the development and morphology of microorganisms and also on the synthesis of secondary metabolites is determined by the importance of this element as a constituent of nucleotides and amino acids representing building blocks of enzymes providing the biosynthetic processes. However, according to some data, the greatest effect on the carotenoid biosynthesis is provided by carbon rather than nitrogen [37], which was confirmed in the current study.
As a rule, microbial biosynthesis technologies are initially developed under laboratory conditions and then scaled up to the pilot and then industrial scales. The main task of the scale-up process is to increase the volume of production while maintaining or even increasing the productivity of the used strain [38,39]. High cell density in fermenters significantly differs from their natural growth conditions and results in some stresses related to various environmental factors such as changes in temperature, pH, osmotic concentrations, etc. [40].
Published data related to the industrial technologies of β-carotene production by M. neoaurum are rather poor. The majority of publications are focused on optimizing fermentation conditions for such producers as Blakeslea trispora and Rhodotorula spp. There is also a study describing the optimization of fermentation conditions of Yarrowia lipolytica. A successful modification of the original strain and optimization of batch fermentation conditions for a 5 L bioreactor provided a β-carotene yield of 2.7 g/L [41]. Another study reports about the fermentation of a genetically modified Yarrowia lipolytica strain, YL-C0, in a 5 L bioreactor with the constant glucose concentration of 10.0 g/L, pO2 level maintained at 20–30% by adjusting the stirring rate, and pH level maintained at 5.5 using a 15% ammonia solution; under such conditions, the maximum β-carotene yield reached 1.7 g/L [42].
It is known that the reduction in the concentration of carbon and/or nitrogen sources causes some disorders in the biosynthesis of secondary metabolites including β-carotene. In the case of periodic processes, this problem can be solved by additional feeding of the limiting substrate, thus avoiding a suppressive effect of initially high substrate concentrations and increasing the yield of a target metabolite. Therefore, after 30 h of fermentation, a sterile 50% glycerol solution (2.5 g/L of a fermentation medium) was added under controlled optimal pH and pO2 conditions (6.8–7.2 and 50%, respectively). A continuous supply of a 50% glycerol solution during fermentation also helps to stabilize the pH level due to the formation of organic acids during its metabolization [43]. Such pH stabilization promotes more active biosynthesis of β-carotene.
In this study, M. neoaurum cultivation in flasks under selected conditions resulted in a β-carotene yield of 318.4 ± 8.3 mg/kg. When the optimized medium was tested in a 3 L bioreactor, β-carotene and dry biomass yields were 370.5 ± 8.0 mg/kg and 25.4 ± 1.0 g/L, respectively. These results allowed us to perform a step-by-step scaling up of the process in 15 L and 100 L bioreactors. For the 15 L bioreactor, β-carotene and dry biomass yields reached 432.3 ± 10.4 mg/kg and 22.2 ± 1.2 g/L, respectively. In the case of the 100 L bioreactor, the strain productivity for β-carotene was 450.4 ± 11.0 mg/kg, while the dry biomass yield was 25.2 ± 1.1 g/L. Note that the scaling up from the 3 L to 100 L bioreactor provided an increase in the β-carotene yield by 21.7% that can be associated with the improved aeration conditions.
Aeration is a key parameter, which should be considered for the production of this class of pigments, since the biosynthesis of carotenoids is an aerobic process. The air flow rate during microbial fermentation is an important factor providing the nutrient absorption, growth rate, cell mass accumulation, and carotenoid biosynthesis. In addition, according to some published data, a decrease in the oxygen content in the culture medium affects the production of carotenoids and xanthophylls [31]. The effect of aeration can depend on the microorganism species.
Moreover, the development of a biotechnological process should take into account such factors as the design of the bioreactor, used raw materials, and fermentation type (batch, fed-batch, or continuous). These factors play a very important role in achieving the desired yield of target metabolites, including β-carotene [31].

5. Conclusions

The performed study showed that the biosynthesis of β-carotene by M. neoaurum cells is influenced mainly by the glycerol and SMP concentration. Using mathematical planning, we optimized a nutrient medium composition for M. neoaurum fermentation and β-carotene biosynthesis and determined the optimal glycerol and SMP concentrations (25.5 and 12.8 g/L, respectively). Under such cultivation conditions, the β-carotene production by the M. neoaurum strain AC-3067D in 750 mL flasks was 318.4 ± 8.3 mg/kg. In the case of a 15 L bioreactor, the β-carotene and biomass yields were 432.3 ± 10.4 mg/kg and 23.2 ± 1.2 g/L, respectively. The further scaling up to a 100 L bioreactor increased the yield of β-carotene and the biomass up to 450.4 ± 8.2 mg/kg and 25.2 ± 1.1 g/L, respectively.
The obtained results demonstrate the potential of the application of the M. neoaurum strain AC-3067D for industrial β-carotene production. The further work planned with this strain includes determining cultivation conditions and optimal fermentation parameters for pilot-scale and industrial conditions with the process scaling up to a 1000 L bioreactor.

Author Contributions

Conceptualization, V.V.Y. and E.V.G.; methodology, N.V.K., E.V.G. and A.S.S.; software, V.V.Y.; validation, E.V.G., N.V.K. and V.V.Y.; formal analysis, V.V.D.; investigation, N.V.K., V.V.Y. and V.V.D.; data curation, V.V.Y.; writing—original draft preparation, N.V.K. and A.S.S.; writing—review and editing, V.V.Y. and V.V.D.; visualization, V.V.Y. and A.S.S.; supervision, V.V.D. and E.V.G.; project administration, V.V.D.; funding acquisition, V.V.D. All authors have read and agreed to the published version of the manuscript.

Funding

The study was carried out within the State Assignment of the Ministry of Science and Higher Education of the Russian Federation (theme no. 123012000071-1).

Institutional Review Board Statement

Not applicable.

Informed Consent Statement

Not applicable.

Data Availability Statement

The original contributions presented in this study are included in the article. Further inquiries can be directed to the corresponding author(s).

Conflicts of Interest

The authors declare no conflicts of interest.

References

  1. Maoka, T. Carotenoids: Distribution, function in nature, and analysis using LC-photodiode array detector (DAD)-MS and MS/MS system. Mass Spectrom 2023, 12, A0133. [Google Scholar] [CrossRef]
  2. Maoka, T. Carotenoids as natural functional pigments. J. Nat. Med. 2020, 74, 1–16. [Google Scholar] [CrossRef]
  3. Yaderets, V.V.; Karpova, N.V.; Glagoleva, E.V.; Petrova, K.S.; Shibaeva, A.S.; Dzhavakhiya, V.V. Carotenoids: Overview of the main methods and conditions of their preparation. Proc. Univ. Appl. Chem. Biotechnol. 2024, 14, 41–54. (In Russian) [Google Scholar] [CrossRef]
  4. Ashokkumar, V.; Flora, G.; Sevanan, M.; Sripriya, R.; Chen, W.H.; Park, J.H.; Rajesh Banu, J.; Kumar, G. Technological advances in the production of carotenoids and their applications—A critical review. Bioresour. Technol. 2023, 367, 128215. [Google Scholar] [CrossRef] [PubMed]
  5. Foong, L.C.; Loh, C.W.L.; Ng, H.S.; Lan, J.C. Recent development in the production strategies of microbial carotenoids. World J. Microbiol. Biotechnol. 2021, 37, 12. [Google Scholar] [CrossRef] [PubMed]
  6. Ernst, H. Recent advances in industrial carotenoid synthesis. Pure Appl. Chem. 2002, 74, 2213–2226. [Google Scholar] [CrossRef]
  7. Lim, K.C.; Yusoff, F.M.; Shariff, M.; Kamarudin, M.S. Astaxanthin as feed supplement in aquatic animals. Rev. Aquac. 2017, 10, 738–773. [Google Scholar] [CrossRef]
  8. Botella-Pavía, P.; Rodríguez-Concepción, M. Carotenoid biotechnology in plants for nutritionally improved foods. Physiol. Plant. 2006, 126, 369–381. [Google Scholar] [CrossRef]
  9. Gong, M.; Bassi, A. Carotenoids from microalgae: A review of recent developments. Biotechnol. Adv. 2016, 34, 1396–1412. [Google Scholar] [CrossRef] [PubMed]
  10. Rodriguez-Amaya, D.B. Update on natural food pigments – A mini-review on carotenoids, anthocyanins, and betalains. Food Res. Int. 2019, 124, 200–205. [Google Scholar] [CrossRef] [PubMed]
  11. Choi, S.S.; Kim, G.D. Production of carotenoids by bacteria: Carotenoid productivity and availability. J. Life Sci. 2022, 32, 411–419. [Google Scholar] [CrossRef]
  12. El Baky, H.H.A.; El Baroty, G.S.; Mostafa, E.M. Optimization growth of Spirulina (Arthrospira) platensis in photobioreactor under varied nitrogen concentration for maximized biomass, carotenoids and lipid contents. Recent Pat. Food. Nutr. Agric. 2018, 11, 40–48. [Google Scholar] [CrossRef] [PubMed]
  13. Aneesh, P.A.; Ajeeshkumar, K.K.R.G.; Kumar Lekshmi, R.; Anandan, C.N.; Ravishankar, S.M. Bioactivities of astaxanthin from natural sources, augmenting its biomedical potential: A review. Trends Food Sci. Technol. 2022, 125, 81–90. [Google Scholar] [CrossRef]
  14. Frusciante, S.; Diretto, G.; Bruno, M.; Ferrante, P.; Pietrella, M.; Prado-Cabrero, A.; Rubio-Moraga, A.; Beyer, P.; Gomez-Gomez, L.; Al-Babili, S.; et al. Novel carotenoid cleavage dioxygenase catalyzes the first dedicated step in saffron crocin biosynthesis. Proc. Natl. Acad. Sci. USA 2014, 111, 12246–12251. [Google Scholar] [CrossRef]
  15. Asker, D. Isolation and characterization of a novel, highly selective astaxanthin-producing marine bacterium. Agric. Food Chem. 2017, 65, 101–9109. [Google Scholar] [CrossRef] [PubMed]
  16. Silva, T.P.; Paixão, S.M.; Alves, L. Ability of Gordonia alkanivorans strain 1B for high added value carotenoids production. RSC Adv. 2018, 5, 58055. [Google Scholar] [CrossRef]
  17. Tran, T.; Dawrs, S.N.; Norton, G.J.; Virdi, R.; Honda, J.R. Brought to you courtesy of the red, white, and blue pigments of nontuberculous mycobacteria. AIMS Microbiol. 2020, 6, 434–450. [Google Scholar] [CrossRef] [PubMed]
  18. Igreja, W.S.; Maia, F.A.; Lopes, A.S.; Chisté, R.C. Biotechnological production of carotenoids using low-cost substrates is influenced by cultivation parameters: A review. Int. J. Mol. Sci. 2021, 22, 8819. [Google Scholar] [CrossRef] [PubMed]
  19. Pagels, F.; Vasconcelos, V.; Guedes, A.C. Carotenoids from Cyanobacteria: Biotechnological potential and optimization strategies. Biomolecules 2021, 11, 735. [Google Scholar] [CrossRef]
  20. Dyaa, A.; Soliman, H.; Abdelrazak, A.; Samra, B.N.; Khojah, E.; Ahmed, A.F.; El-Esawi, M.A.; Elsayed, A. Optimization of carotenoids production from Rhodotorula sp. strain ATL72 for enhancing its biotechnological applications. J. Fungi 2022, 8, 160. [Google Scholar] [CrossRef]
  21. Xu, X.; Liu, W.; Niu, H.; Hua, M.; Su, Y.; Miao, X.; Chi, Y.; Xu, H.; Wang, J.; Sun, M.; et al. Study on the fermentation effect of Rhodotorula glutinis utilizing tofu whey wastewater and the influence of Rhodotorula glutinis on lying hens. Front. Nutr. 2023, 10, 1125720. [Google Scholar] [CrossRef]
  22. Siziya, I.N.; Yoon, D.J.; Kim, M.; Seo, M.J. Enhanced production of C30 carotenoid 4,4’-diaponeurosporene by optimizing culture conditions of Lactiplantibacillus plantarum subsp. plantarum KCCP11226T. J. Microbiol. Biotechnol. 2022, 32, 892–901. [Google Scholar] [CrossRef] [PubMed]
  23. Stanchev, V.; Georfiev, D.; Gargova, S. Mathematical modeling of the nutrient medium composition for the production of yeast phytase. Bulg. J. Agric. Sci. 2010, 16, 628–634. [Google Scholar]
  24. Husseiny, S.M.; Abdelhafez, A.A.; Ali, A.A.; Sand, H.M. Optimization of b-carotene production from Rhodotorula glutinis ATCC 4054 growing on agro-industrial substrate using Plackett–Burman design. Proc. Natl. Acad. Sci. India Sect. B Biol. Sci. 2017, 88, 1637–1646. [Google Scholar] [CrossRef]
  25. da Costa Cardoso, L.A.; Kanno, K.Y.F.; Karp, S.G. Microbial production of carotenoids—A review. Afr. J. Biotechnol. 2017, 16, 139–146. [Google Scholar] [CrossRef]
  26. Kerr, S.; Calé, C.; Cabral, J.M.; van Keulen, F. Factors enhancing lycopene production by a new Mycobacterium aurum mutant. Biotechnol. Lett. 2004, 26, 103–108. [Google Scholar] [CrossRef]
  27. Yaderets, V.; Karpova, N.; Glagoleva, E.; Shibaeva, A.; Dzhavakhiya, V. Enhanced β-carotene production in Mycolicibacterium neoaurum Ac-501/22 by combining mutagenesis, strain selection, and subsequent fermentation optimization. Fermentation 2023, 9, 1007. [Google Scholar] [CrossRef]
  28. Rozhnov, E.D. Modeling of Biotechnological Processes: Methodological Recommendations for Performing Laboratory Work, Conducting Practical Classes and Organizing Independent Work of Students for the Speciality 04/19/2011—Biotechnology; Altai State Technical University: Biysk, Russia, 2019; pp. 40–96. [Google Scholar]
  29. Zhernosekova, I.V.; Chernogor, N.P.; Tymchuk, A.A.; Vinnikov, A.I. Methods of experiments planning by optimization of the nutrient medium for Streptomycete. Visnyk Dnipropetrovsk Univ. Biol. Ecol. 2001, 18, 20–28. [Google Scholar] [CrossRef]
  30. Zeni, J.; Colet, R.; Cence, K.; Tiggeman, L.; Toniazzo, G.; Cansian, R.L.; Di Luccio, M.; Oliveira, D.; Valduga, E. Screening of microorganisms for production of carotenoids. CyTA J. Food 2011, 9, 160–166. [Google Scholar] [CrossRef]
  31. Mata-Gómez, L.C.; Montañez, J.C.; Méndez-Zavala, A.; Aguilar, C. Biotechnological production of carotenoids by yeasts: An overview. Microb. Cell Fact. 2014, 13, 12. [Google Scholar] [CrossRef] [PubMed]
  32. Bindea, M.; Rusu, B.; Rusu, A.; Trif, M.; Leopold, L.F.; Dulf, F.; Vodnar, D.C. Valorification of crude glycerol for pure fractions of docosahexaenoic acid and β-carotene production by using Schizochytrium limacinum and Blakeslea trispora. Microb. Cell Fact. 2018, 17, 97. [Google Scholar] [CrossRef] [PubMed]
  33. Suwaleerat, T.; Thanapimmetha, A.; Srisaiyoot, M.; Chisti, Y.; Srinophakun, P. Enhanced production of carotenoids and lipids by Rhodococcus opacus PD630. J. Chem. Technol. Biotechnol. 2018, 93, 2160–2169. [Google Scholar] [CrossRef]
  34. Baughn, A.D.; Rhee, K.Y. Metabolomics of central carbon metabolism in Mycobacterium tuberculosis. Microbiol. Spectr. 2014, 2. [Google Scholar] [CrossRef] [PubMed]
  35. Paniagua-Michel, J.; Olmos-Soto, J.; Ruiz, M.A. Pathways of carotenoid biosynthesis in bacteria and microalgae. Methods Mol. Biol. 2012, 892, 1–12. [Google Scholar] [CrossRef]
  36. Janisch, N.; Levendosky, K.; Budell, W.C.; Quadri, L.E.N. Genetic underpinnings of carotenogenesis and light-induced transcriptome remodeling in the opportunistic pathogen Mycobacterium kansasii. Pathogens 2023, 12, 86. [Google Scholar] [CrossRef]
  37. Zheng, X.; Hu, R.; Chen, D.; Chen, J.; He, W.; Huang, L.; Lin, C.; Chen, H.; Chen, Y.; Zhu, J.; et al. Lipid and carotenoid production by the Rhodosporidium toruloides mutant in cane molasses. Biores. Technol. 2021, 326, 124816. [Google Scholar] [CrossRef] [PubMed]
  38. Dzhavakhiya, V.; Savushkin, V.; Ovchinnikov, A.; Glagolev, V.; Savelyeva, V.; Popova, E.; Novak, N.; Glagoleva, E. Scaling up a virginiamycin production by a high-yield Streptomyces virginiae VKM Ac-2738D strain using adsorbing resin addition and fed-batch fermentation under controlled conditions. 3 Biotech 2016, 6, 240. [Google Scholar] [CrossRef]
  39. Schmidt, F.R. Optimization and scale up of industrial fermentation processes. Appl. Microbiol. Biotechnol. 2005, 68, 425–435. [Google Scholar] [CrossRef]
  40. Liu, W.C.; Gong, T.; Wang, Q.H.; Liang, X.; Chen, J.J.; Zhu, P. Scaling-up fermentation of Pichia pastoris to demonstration-scale using new methanol-feeding strategy and increased air pressure instead of pure oxygen supplement. Sci. Rep. 2016, 6, 18439. [Google Scholar] [CrossRef]
  41. Jing, Y.; Wang, J.; Gao, H.; Jiang, Y.; Jiang, W.; Jiang, M.; Xin, F.; Zhang, W. Enhanced β-carotene production in Yarrowia lipolytica through the metabolic and fermentation engineering. J. Ind. Microbiol. Biotechnol. 2023, 50, kuad009. [Google Scholar] [CrossRef]
  42. Liu, L.; Qu, Y.L.; Dong, G.R.; Wang, J.; Hu, C.Y.; Meng, Y.H. Elevated β-carotene production using codon-adapted CarRA&B and metabolic balance in engineered Yarrowia lipolytica. Front. Microbiol. 2021, 12, 627150. [Google Scholar] [CrossRef]
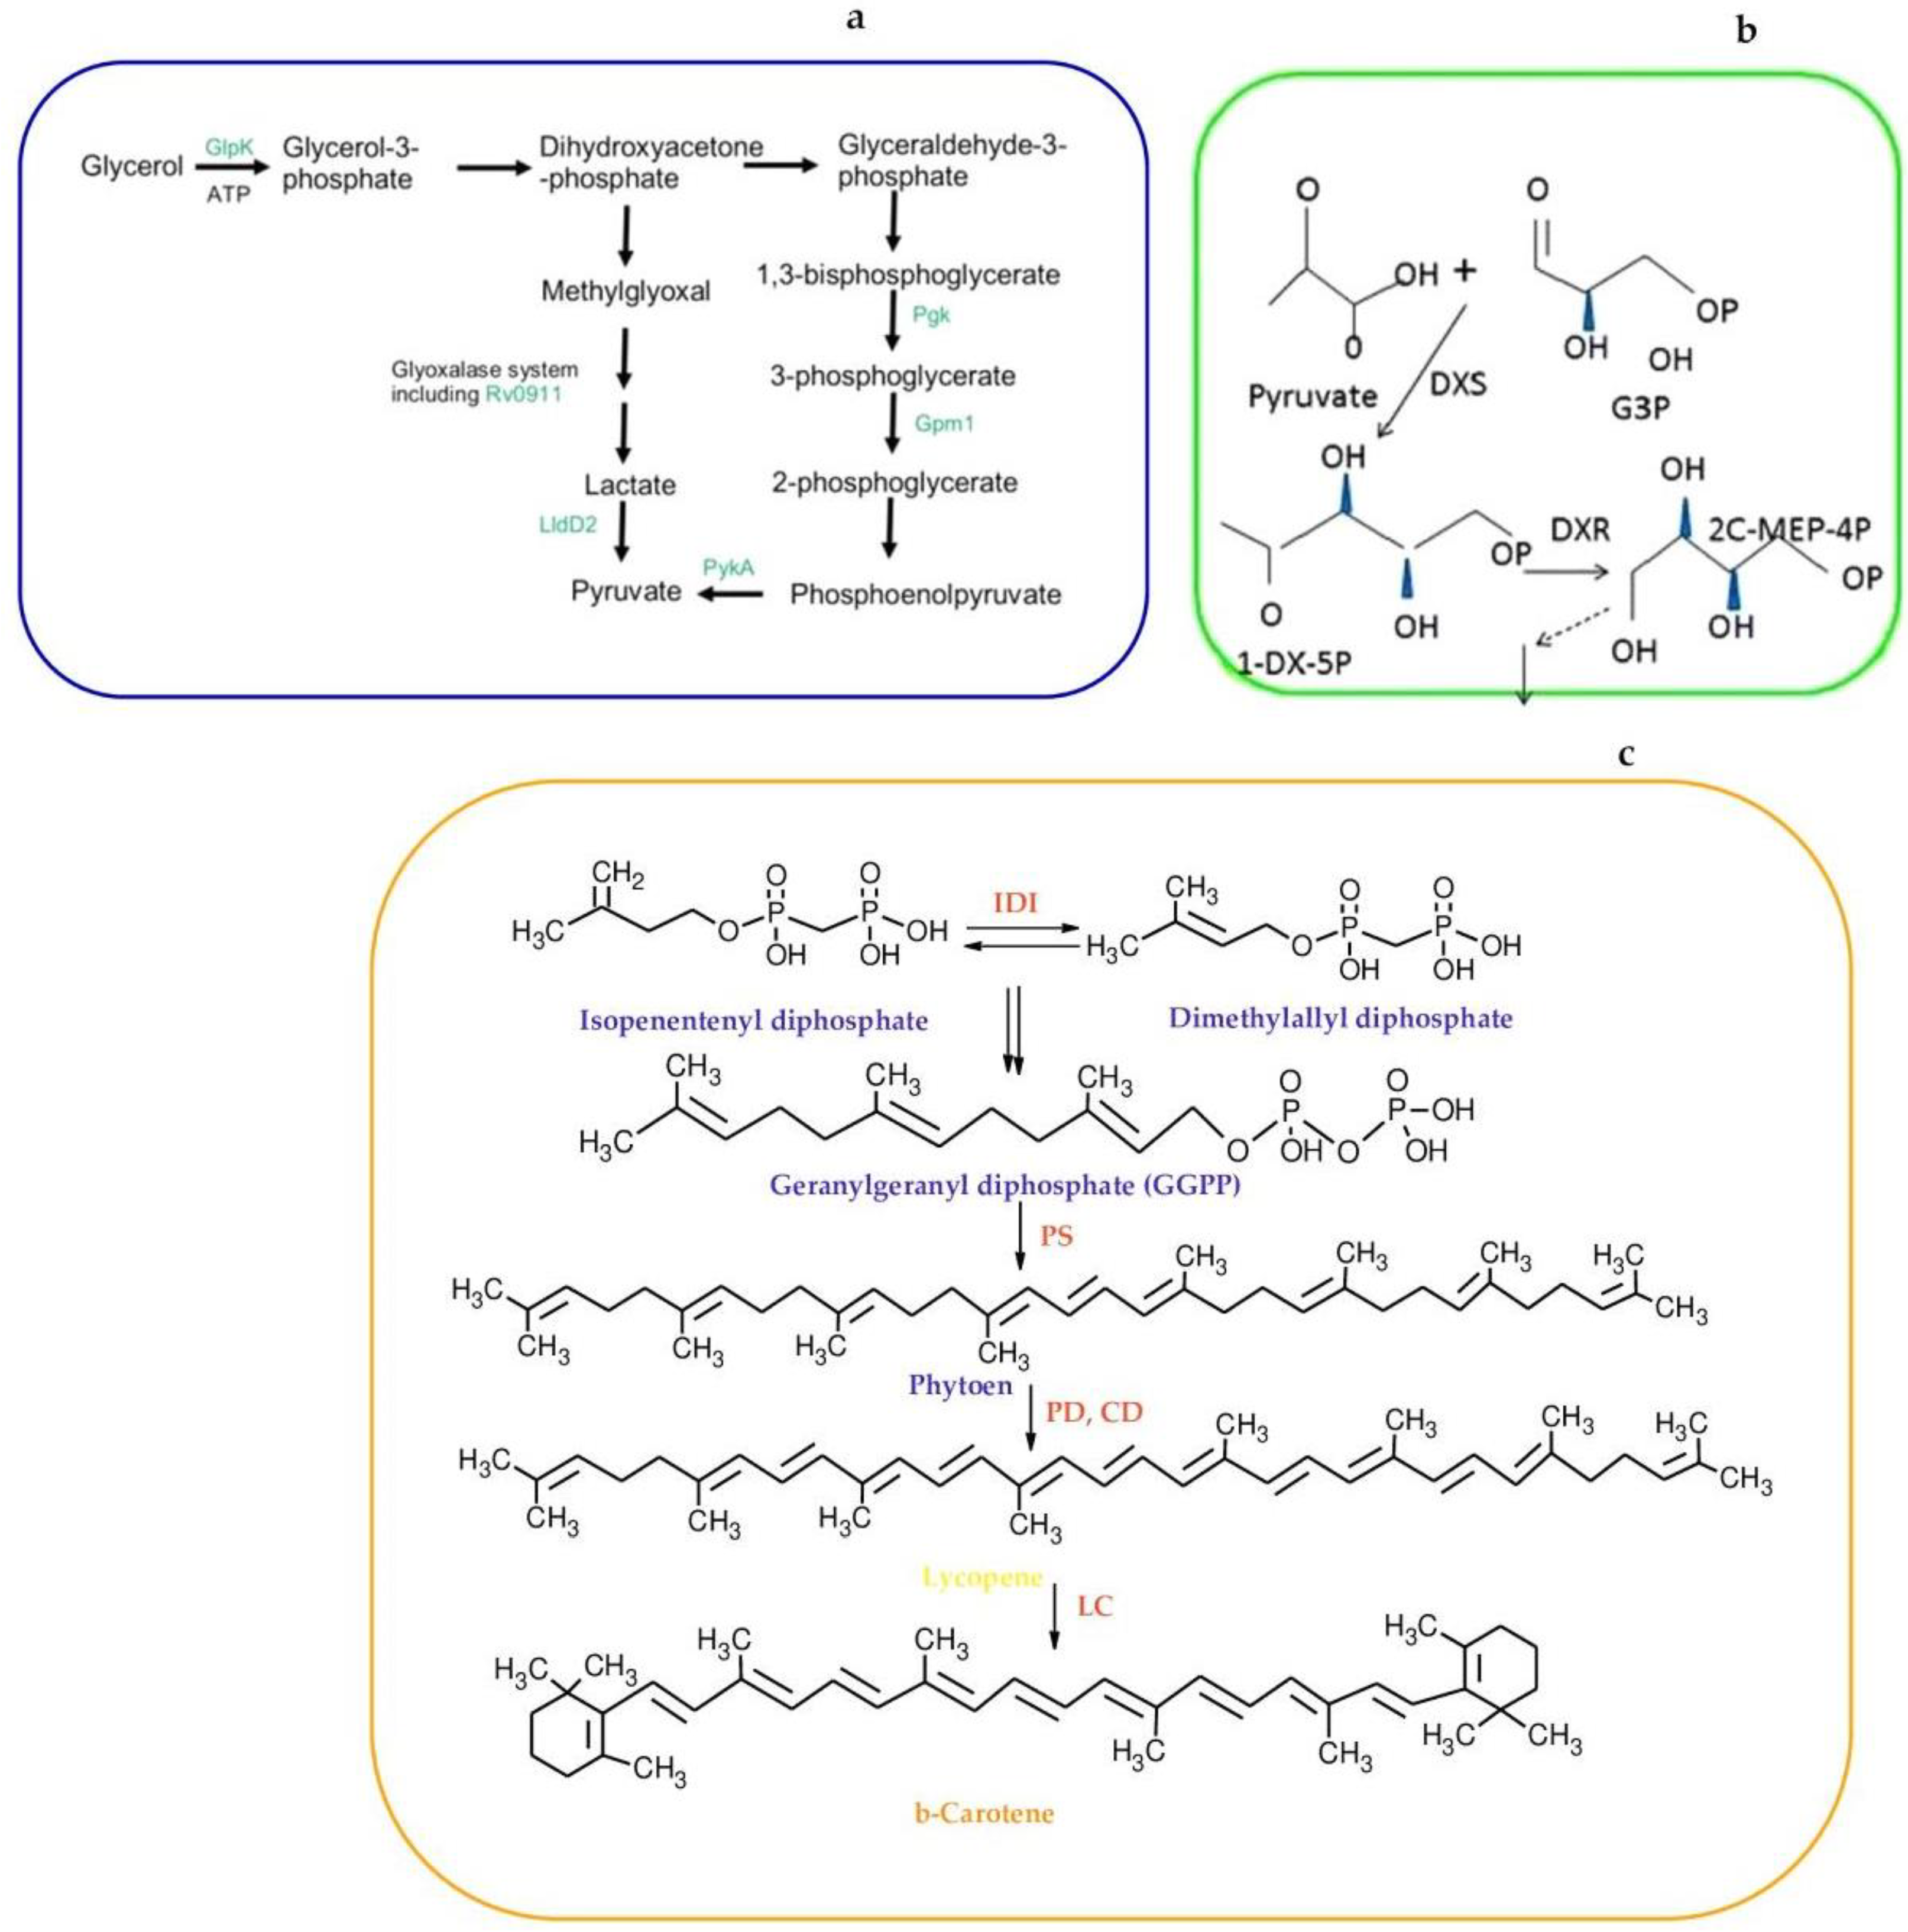
  43. Hunter, G.J. The oxidation of glycerol by Mycobacteria. Biochem. J. 1953, 55, 320–328. [Google Scholar] [CrossRef] [PubMed]
Figure 1. Biomass yield and β-carotene accumulation during fermentation of M. neoaurum in 3 L fermenter with culture feeding by 2.5 g/L glycerol after 30 h of cultivation.
Fermentation 11 00082 g001
Figure 2. Biomass yield and β-carotene accumulation during fermentation of M. neoaurum in 15 L fermenter with culture feeding (50% glycerol, 2.5 g/L) after 30 h of cultivation.
Fermentation 11 00082 g002
Figure 3. Biomass yield and β-carotene accumulation during fermentation of M. neoaurum in 100 L fermenter with culture feeding (50% glycerol, 2.5 g/L) after 30 h of cultivation.
Fermentation 11 00082 g003
Figure 4. Proposed pathway for carotenoid biosynthesis in M. neoaurum based on published data: (a) pyruvate production from glycerol [34]; (b) biosynthetic pathways of isoprenoids [35]; (c) general scheme of carotenoid biosynthesis [36]. 1-DX-5P, deoxyxylulose 5-phosphate; 2C-MEP-4P, 2-C-methyl-D-erythritol 4-phosphate; CD, carotene desaturase; DXR, 1-deoxy-D-xylose 5-phosphate reducto-isomerase; DXS, 1-deoxy-D-xylose 5-phosphate synthase; G3P, glycerolaldehyde-3-phosphate; Glpk, glycerol kinase; Gpm1, phosphoglycerate mutase 1; IDI, diphosphate isomerase; LC, lycopene β-cyclase; LldD2, lactate dehydrogenase; PD, phytoene desaturase; Pgk, phosphoglycerate kinase; PS, phytoene synthase; PykA, pyruvate kinase; Rv0911, putative glyoxalase.
Fermentation 11 00082 g004
Table 1. The plan center and the variation step of the studied factors.
FactorsX1X2X3
VariablesGlycerolSMPUrea
Concentration, g/L20.010.01.0
δ, g/L2.51.50.15
Low level (–1), g/L17.57.50.85
High level (+1), g/L22.511.51.15
Table 2. Pre-inoculation fermentation regime (15 L bioreactor).
ParameterValue
Medium volume 10.0 L
Temperature35 ± 1 °C
Aeration0.1 L/min
Stirring rate250 rpm
pO2 level100% of saturation
Pressure within the bioreactor0.03–0.05 MPa
Medium pH6.8–7.2
Table 3. Basic parameters for the M. neoaurum strain AC-3067D fermentation in a 15 L bioreactor.
ParameterValue
Temperature35 ± 1 °C
Aeration5–10 L/min
pH6.8–7.2
Stirring rate400–450 rpm to maintain the required level of dissolved oxygen
Feeding addition Glycerol (2.5 g/L) after 30 h of fermentation
Fermentation time72–76 h
Process controlThe first sampling to control the culture purity and crude biomass weight is performed after 18–24 h of fermentation. The further sampling is performed as required, but at least one time a day.
Table 4. Pre-inoculation fermentation regime (100 L bioreactor).
ParameterValue
Medium volume70.0 L
Temperature35 ± 1 °C
Aeration3.5 L/min
Stirring rate250 rpm
pO2 level100% of saturation
Pressure within the bioreactor0.03–0.05 MPa
Medium pH6.8–7.2
Table 5. Basic parameters for a M. neoaurum strain AC-3067D fermentation in a 100 L bioreactor.
ParameterValue
Temperature35 °C
Aeration35–70 L/min
pHMaintained at 6.8–7.2 using a sterile 10% HCl solution
Stirring rate400–450 rpm to maintain the required level of dissolved oxygen
Feeding addition50% glycerol solution (2.5 g/L of medium) after 30 h of fermentation
Fermentation time72–80 h
Table 6. The experimental matrix in natural and encoded units of factor values and the results of the experiment (output parameter values).
Experiment No. Encoded Factors Natural-Scale Factors, g/Lβ-Carotene Yield, mg/kg
x1x2x3x1x2x3y1  *y2  *y3  *ȳu  **
1 −1 −1 −1 17.58.50.85182.5170.4186.2179.70
2 +1 −1 −1 22.58.50.85206.2196.5188.4197.03
3 −1 +1 −1 17.511.50.85190.6198.5188.6192.57
4 +1 +1 −1 22.511.50.85248.3220.4229.5232.73
5 −1 −1 +1 17.58.51.15180.8188.5183.8184.37
6 +1 −1 +1 22.58.51.15204.3227.4214.5215.40
7 −1 +1 +1 17.511.51.15196.6202.6220.7206.63
8 +1 +1 +1 22.511.51.15216.7200.8218.7212.07
* y1, y2, and y3 represent the numerical values of the response function for each of the replications obtained after the completion of the experiment, mg/kg; ** ȳu is the mean arithmetical value of the response function, mg/kg.
Table 7. Determination of line-by-line dispersions.
uyul∑(yul)2(∑yul)2 y u l 2 m S y u l 2
1182.5170.4186.297,012.85290,628.8196,876.2768.29
2206.2196.5188.4116,625.25349,399.21116,466.4079.42
3190.6198.5188.6111,300.57333,737.29111,245.7627.40
4248.3220.4229.5162,899.3487,483.24162,494.41202.44
5180.8188.5183.8102,003.33305,919.61101,973.2015.06
6204.3227.4214.5139,459.5417,574.44139,191.48134.01
7196.6202.6220.7128,406.81384,276.01128,092.00157.40
8216.7200.8218.7135,109.22404,750.44134,916.8196.20
∑ = 780.24
Table 8. The determination of the deviation square for the average values obtained experimentally and those calculated by the linear approximation equation.
uyulȳuȳu − yuu − yu)2
1182.38179.70−2.687.18
2205.87197.03−8.8478.10
3199.25192.57−6.6944.72
4222.75232.739.9999.75
5182.38184.371.993.95
6205.87215.409.5390.81
7199.25206.637.3854.45
8222.75212.07−10.68114.04
∑ = 493.00
Table 9. Experimental plan and obtained results.
Experiment No.Factors at a Natural Scale, g/LEncoded FactorsAuxiliary Graphs in a CFE 23 MatrixΒ-Carotene Yield, mg/kg
x1x2x3x1x2x3x1x2x2x3x1x3x1x2x3y1 *y2 *y3 *ȳu **
117.58.50.85−1 −1 −1 +1+1+1−1182.5170.4186.2179.70
222.58.50.85+1 −1 −1 −1+1−1+206.2196.5188.4197.03
317.511.50.85−1 +1 −1 −1−1+1+1190.6198.5188.6192.57
422.511.50.85+1 +1 −1 +1−1−1−1248.3220.4229.5232.73
517.58.51.15−1 −1 +1 +1−1−1+180.8188.5183.8184.37
622.58.51.15+1 −1 +1 −1−1+1−1204.3227.4214.5215.40
717.511.51.15−1 +1 +1 −1+1−1−1196.6202.6220.7206.63
822.511.51.15+1 +1 +1 +1+1+1+1216.7200.8218.7212.07
* y1, y2, and y3 represent the numerical values of the response function for each of the replications obtained after the completion of the experiment, mg/kg; ** ȳu is the mean arithmetical value of the response function, mg/kg.
Table 10. The deviation square for the means determined experimentally and by the linear approximation equation.
uyulȳuȳu    yuu    yu)2
1194.49179.70−14.79218.67
2193.76197.033.2710.70
3187.15192.575.4229.39
4234.85232.73−2.124.50
5170.27184.3714.10198.69
6217.98215.40−2.586.65
7211.36206.63−4.7322.37
8210.64212.071.432.04
∑ = 493.00
Table 11. The calculation of the steepest ascent for the determination of the quantitative ratio of medium components.
Factor and Experiment Characteristics X1X2
Glycerol ConcentrationSPM Concentration
Base level, g/L22.511.5
Maximum level, g/L30.015.0
Stock, Δi7.54.5
Variation interval (δi)2.51.5
Coefficient of regression (bi) 11.758.44
Production Li = biδi 29.3412.66
Coefficient (γi) 0.260.59
Steepest ascent step (hi), g/L1.50.65
Table 12. The planning matrix for the experiment based on the steepest ascent method.
Experiment No.X1 (Glycerol Concentration, g/L)X2 (SMP Concentration, g/L)β-Carotene Yield, mg/kg
1 (initial medium)22.511.5248.3 ± 5.7
224.012.15284.5 ± 8.2
325.512.80318.4 ± 8.3
427.013.45292.4 ± 6.4
528.514.10252.1 ± 5.5
630.014.75224.6 ± 8.2
Disclaimer/Publisher’s Note: The statements, opinions and data contained in all publications are solely those of the individual author(s) and contributor(s) and not of MDPI and/or the editor(s). MDPI and/or the editor(s) disclaim responsibility for any injury to people or property resulting from any ideas, methods, instructions or products referred to in the content.

